Article

Thermal Conductivity and Rheology of Graphene Oxide Nanofluids and a Modified Predication Model

International Research Center for Renewable Energy & State Key Laboratory of Multiphase Flow in Power Engineering, Xi’an Jiaotong University, Xi’an 710049, China
*
Author to whom correspondence should be addressed.
Appl. Sci. 2022, 12(7), 3567; https://doi.org/10.3390/app12073567
Submission received: 7 March 2022 / Revised: 28 March 2022 / Accepted: 29 March 2022 / Published: 31 March 2022
(This article belongs to the Special Issue Nano/Microscale Heat Transfer)

Abstract

:
In order to reveal the heat transfer performance of nanofluids in solar collectors, the thermal conductivity and dynamic viscosity of five kinds of graphene oxide nanofluids, with a mass fraction of 0.002% to 0.01%, were studied in the temperature range of 25–50 °C. To ensure the dispersion and stability of the prepared nanofluids, UV–Vis absorption spectrum, zeta potential and particle size distribution were employed for nanofluid characterization. Agglomeration and sedimentation of the prepared nanofluids after standing for 20 days were observed, showing the good stability of the prepared graphene oxide–water nanofluid. The dynamic viscosity and thermal conductivity were measured. They show that with the increase in temperature, the dynamic viscosity of nanofluids decreases and the thermal conductivity increases. With the increase in mass concentration, the viscosity and thermal conductivity are improved. The highest thermal conductivity increase is obtained when the nanofluid concentration is 0.01% and the temperature is 50 °C. Finally, and most importantly, considering the inaccuracy of the existing experimental correlations to the predicted values of thermal conductivity, we propose our new mathematical model of correlation and carry out a series of tests to verify its reliability. The experimental correlations with temperature and concentration as independent variables show good agreement and accuracy with the experimental data.

1. Introduction

In the past decades, the thermal conductivity of nanofluids as the essential heat transfer property has been given much attention. They have been proposed as promising heat transfer fluids for numerous applications, especially in solar collectors [1]. In fact, nanofluids are fluids which consist of a base fluid with suspended nano-sized particles (1–100 nm) [1,2]. Researchers have focused on the thermal conductivity of different types of nanofluids, such as oxide, nitride, carbon nanotubes, carbon fiber, carbon black, graphene oxide, graphene, graphite sheet and hybrid materials of different shapes, i.e., particles, disks, tubes, flakes, fibers, etc. [3,4]. In recent years, many carbon-based nanofluids have been investigated. Their thermal properties were measured experimentally and analyzed theoretically. These carbon-based nanoparticles include single-layer carbon nanotubes, multilayer carbon nanotubes, graphene, graphene oxide, graphite nanoplates, etc. Compared with metal or metal oxide, carbon nanostructures have higher intrinsic thermal conductivity and lower density, and carbon nanostructures have strong c–c covalent bond and phonon scattering, so their thermal conductivity is higher than other nanoparticles [5]. In addition, some studies showed that carbon-based nanomaterials, such as carbon nanotubes, graphite nanoparticles and flaked graphite nanofibers, are also good substrate for the preparation of hybrid nanofluids. It is worth noting that the axial thermal conductivity of carbon nanotubes is 3000 w/mk [6] but that of graphene monolayer is 5000 w/mk [7]. This means that Graphene and its oxides have good thermal conductivity and are very beneficial to their application in nanofluids for enhanced heat transfer. Graphene oxide nanofluids are one of most promising nanofluids widely investigated by researchers, and the precise and reliable correlations for prediction of their thermophysical properties are still highly desired although there are already many correlations available from the literature. On the other hand, there are many numerical studies on the flow and heat transfer properties of the various kinds of nanofluids, which are important for the in-depth understanding and prediction of the performance of nanofluids for application in practice [8,9,10,11,12,13,14].
The aim of this study is to evaluate the influence of various parameters on the heat transfer performance of graphene oxide nanofluids and establish a theoretical and experimental correlation for the precise prediction of the thermal conductivity of such nanofluids. Firstly, five kinds of graphene oxide nanofluids were prepared, with a mass fraction of 0.002% to 0.010% at the same concentration gradient. Then, the stability, thermal conductivity and dynamic viscosity of each nanofluid were measured. Finally, the empirical correlation of the thermal conductivity versus the temperature and nanoparticle concentration is presented.

2. Experimental Section

2.1. Experimental Materials

Graphene Oxide Nanopowders (GO) with purity of 99.99% were used as dispersing particles (Jiangsu Xianfeng nanomaterials technology Co., Ltd., Nanjing, China) (Figure 1) with sodium dodecyl sulfate as dispersant and deionized water as dispersion.

2.2. Nanofluid Preparation

The nanofluid prepared should be a stable suspension without obvious sedimentation after a long time of standing. In our study, graphene oxide nanofluids were prepared by a two-step method [15]. Firstly, nanoparticles were added into deionized water, then magnetic stirring and ultrasonication were used (both for 1 h), and finally, five concentrations of graphene oxide nanofluids were obtained. Five kinds of graphene oxide nanofluids were prepared, with a mass fraction of 0.002% to 0.01%.

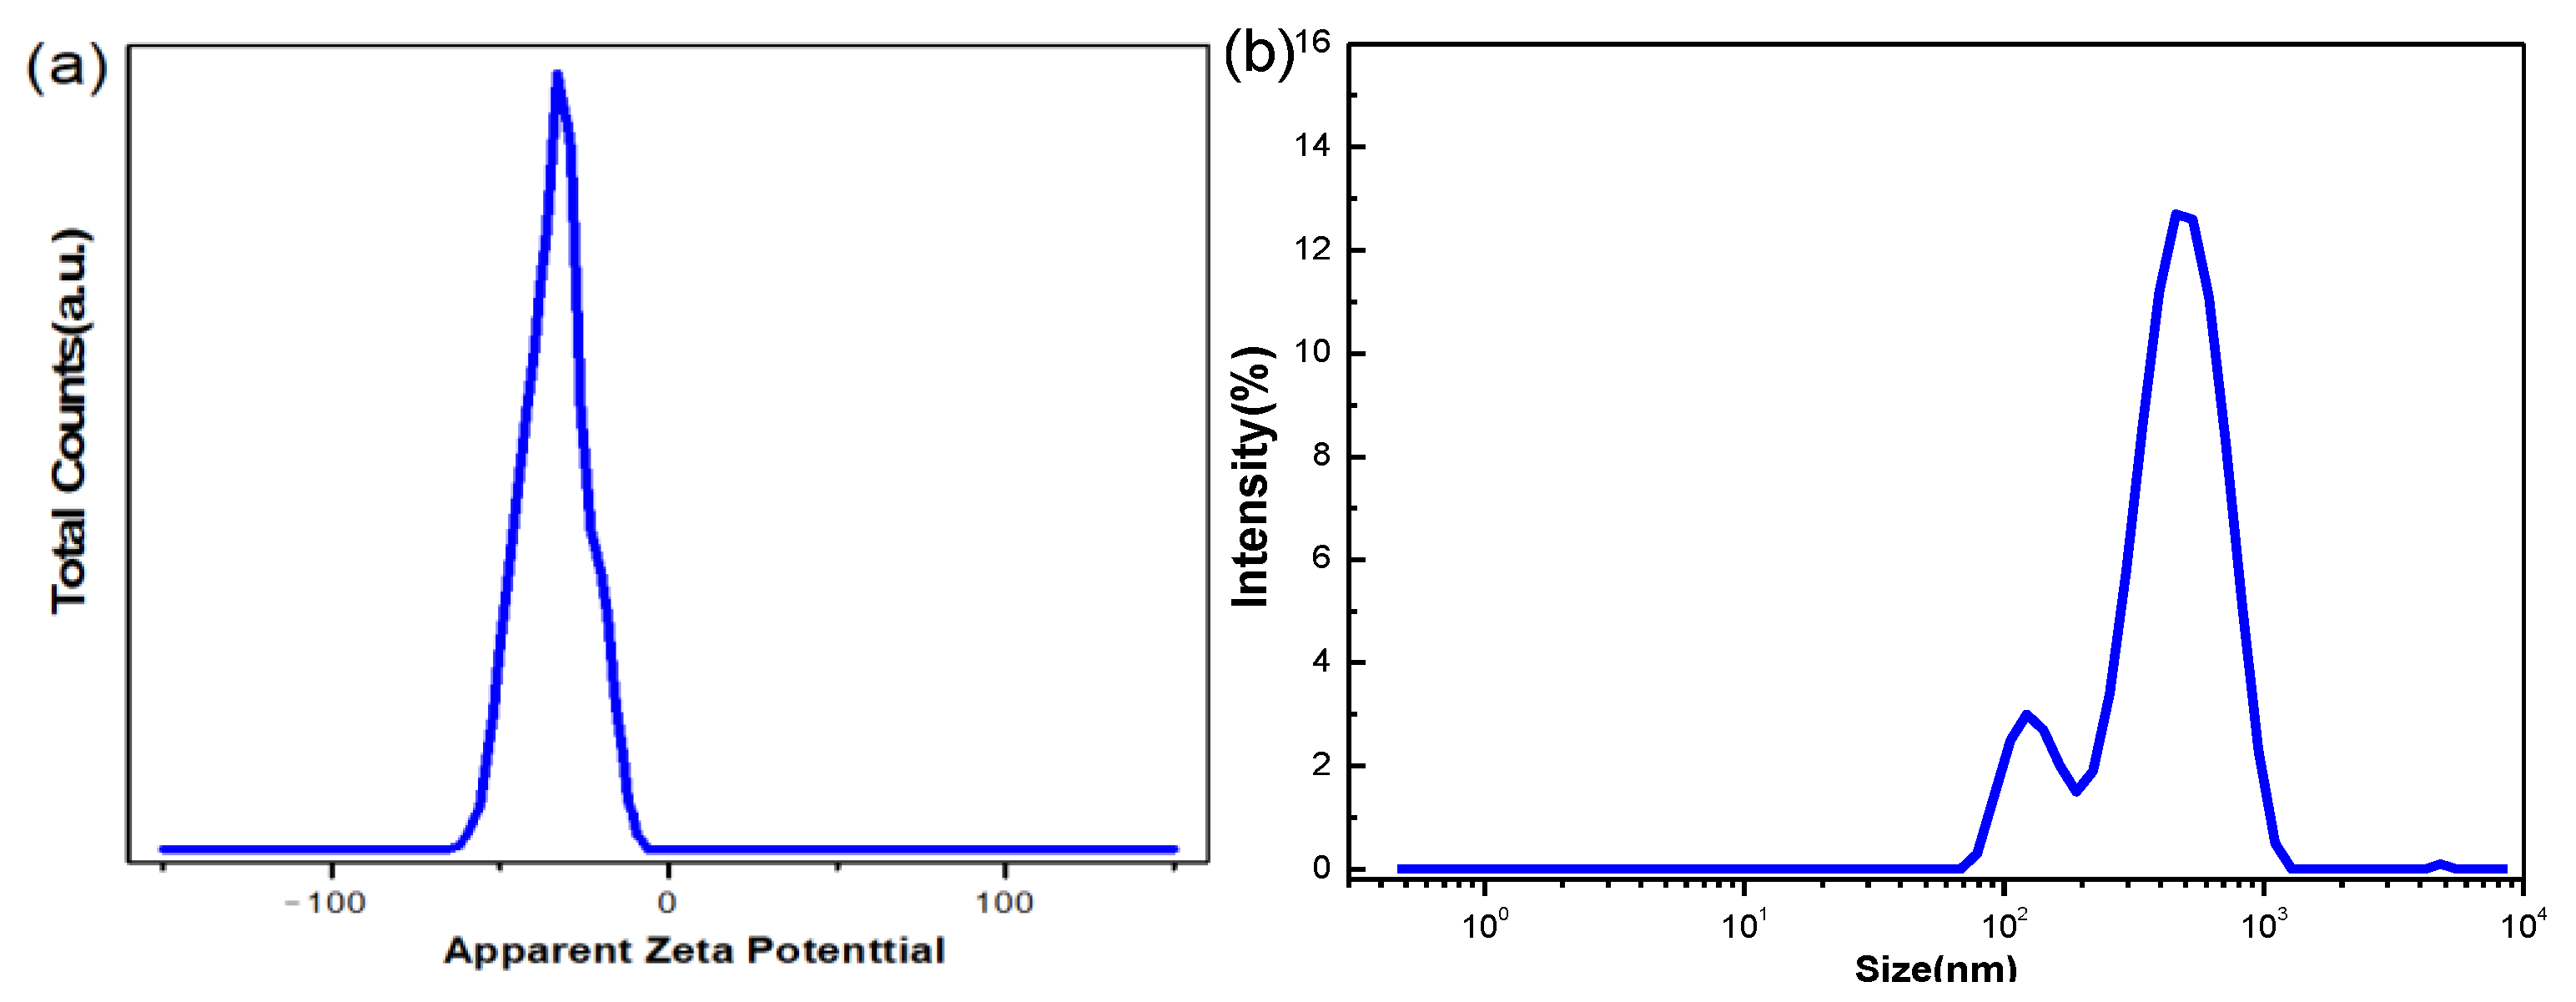
2.3. Stability Characterization

In order to test the stability of nanofluids, we compared the newly prepared nanofluids with the nanofluids after standing for 20 days.

2.4. Characterization and Measurements

The Zeta potential (ξ) of samples was measured by Zeta potential meter (ZS, Malvern Instruments, Worcestershire, UK). The samples were measured from 30 °C to 70 °C with an interval of 10 °C. Transmission spectra of each sample was measured in the wavelength range from 200 to 800 nm on a double-beam UV–Vis–NIR spectrophotometer (Agilent Cary 5000) using a quartz cuvette with an optical path length of 10 mm at room temperature. Thermal conductivity of the samples was measured at temperature range from 20 °C to 50 °C at an interval of 10 °C by laser thermal conductivity analyzer (LFA 467, NETZSCH, Selb, Germany). The rheological properties were tested by high-pressure rheometer (MCR302, Anton Paar, Ashland, VA, USA).

3. Results and Discussion

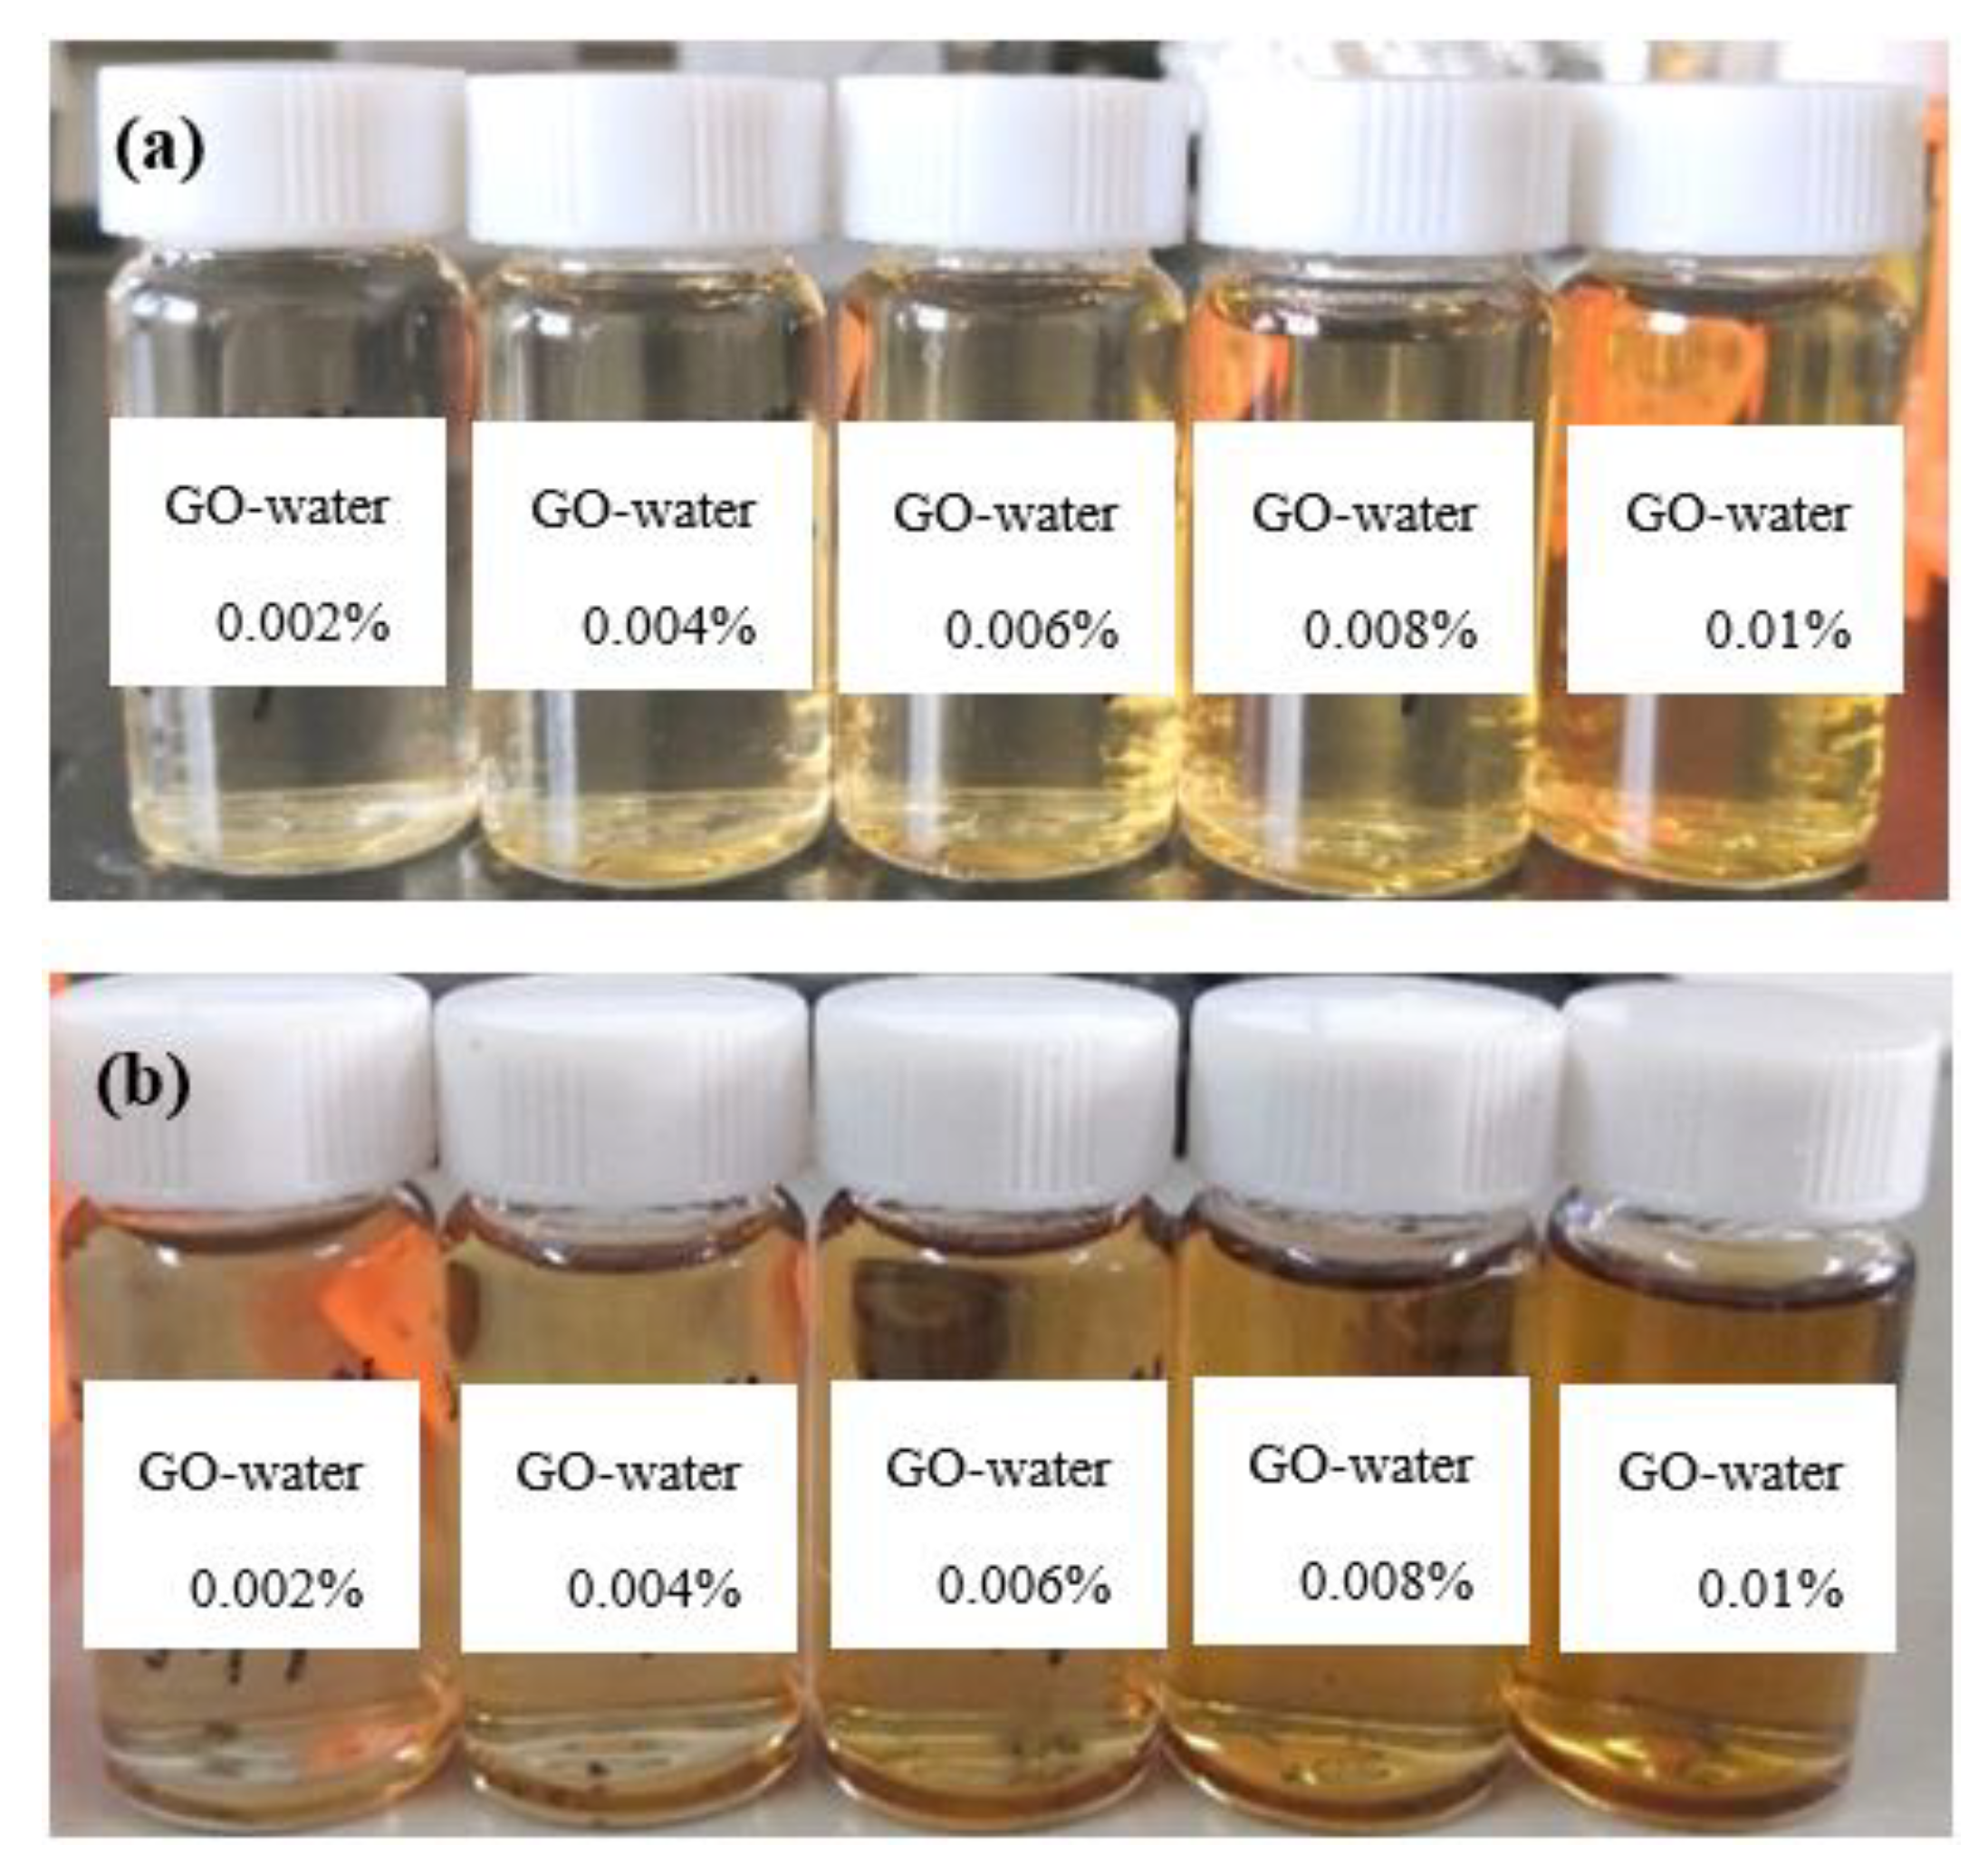
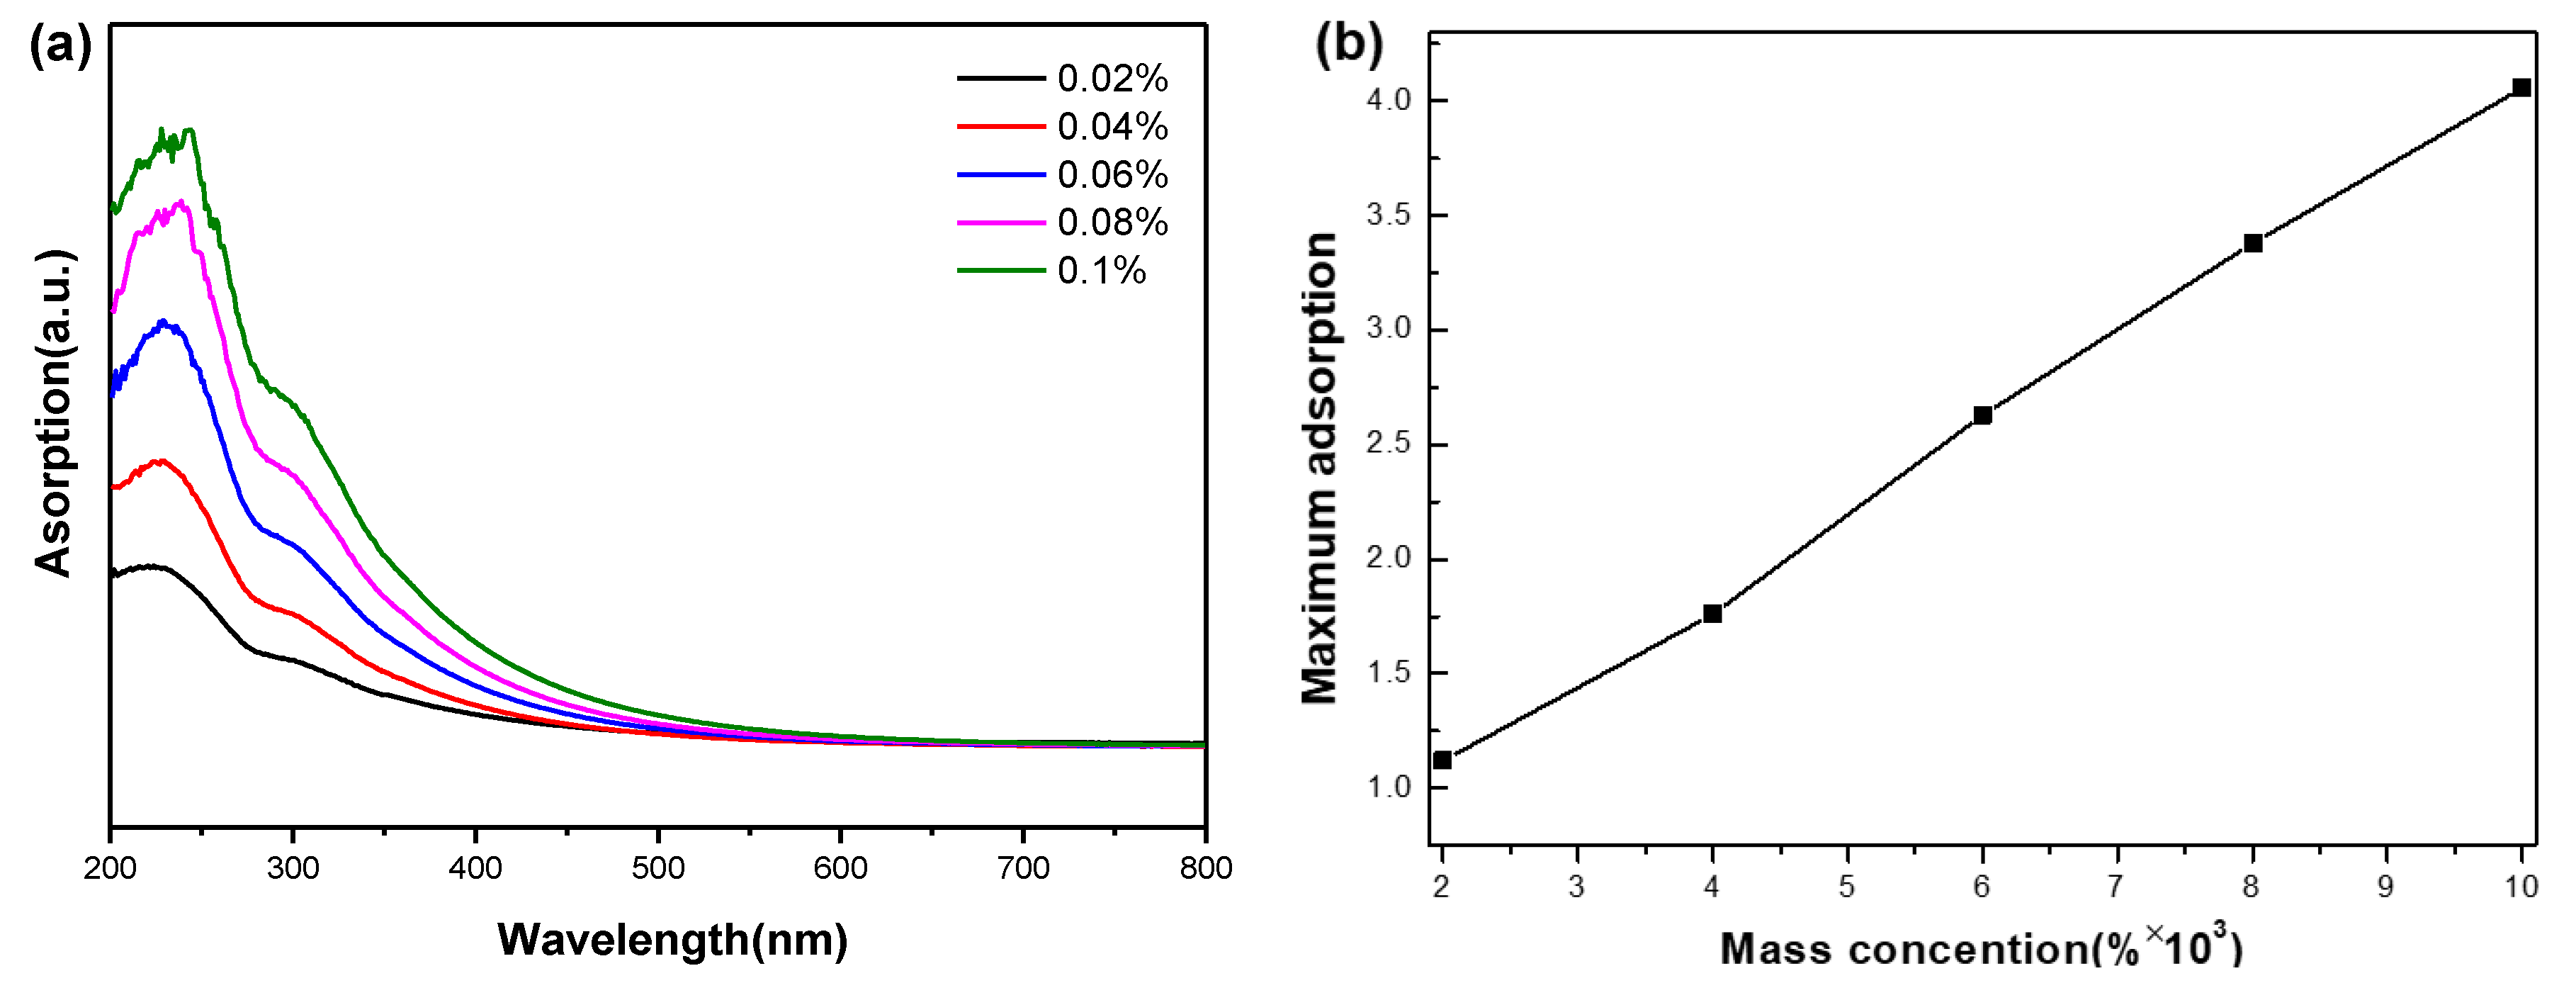
3.1. Stability of Graphene Oxide Nanofluids

It is expected that graphene oxide has good hydrophilicity and water compatibility, which ensures the good stability of graphene oxide nanofluids. To demonstrate the stability of our prepared graphene oxide nanofluids, we compared the newly prepared nanofluids with the nanofluids after standing for 20 days. As shown in Figure 1, there is no obvious sedimentation of nanoparticles after 20 days of standing under atmospheric conditions. This means that the graphene oxide nanofluids we prepared have good suspending stability, no visible aggregation and sedimentation can be observed after a long time of standing.
To be more convinced, we used a UV-visible absorption spectrometer to measure the light absorptivity of nanofluids at different wavelengths, and the results are shown in Figure 2a. It can be seen that with the increase in mass concentration, the absorptivity at the whole range of wavelength also increases. We then recorded the maximum absorptivity for the GO nanofluids of various concentrations and plotted them against the nanoparticle mass concentration, and the results can be seen in Figure 2b. As is shown, there is a good linearity between the maximum absorption and mass fraction of nanofluid. The nanofluids we prepared conform to Lambert Beer’s law, and the nanoparticles are believed to have good dispersibility in the base solution.
Zeta potential and particle size distribution of nanofluids with mass fraction of 0.002% were measured by Zeta potential analyzer. The results are shown in Figure 3. In fact, Zeta potential is one of the most critical values to validate the quality of the nanofluids stability. According to stabilization theory, the electrostatic repulsions between the particles increase if zeta potential has a high absolute value, which indicates a good stability of the suspensions. Generally, a suspension with a measured zeta-potential above 30 mV (absolute value) is considered to have good stability, and very good stability and little settling can be obtained when the zeta potential is above 60 mV [16]. From Figure 3a, it can be seen that the absolute value of zeta potential corresponding to the peak value is 45.3 mv, which indicates the fairly good stability of nanofluids. From the particle size distribution curve in Figure 3b, it can be seen that the particle size corresponding to the intensity peak is in the order of hundreds of nanometers. For instance, it is ca. 400 nm for 0.002% GO nanofluid. In general, the nanoparticles of the suspension system undergo sever aggregation and then achieve an equilibrium size distribution conforming to the specified particle size range.

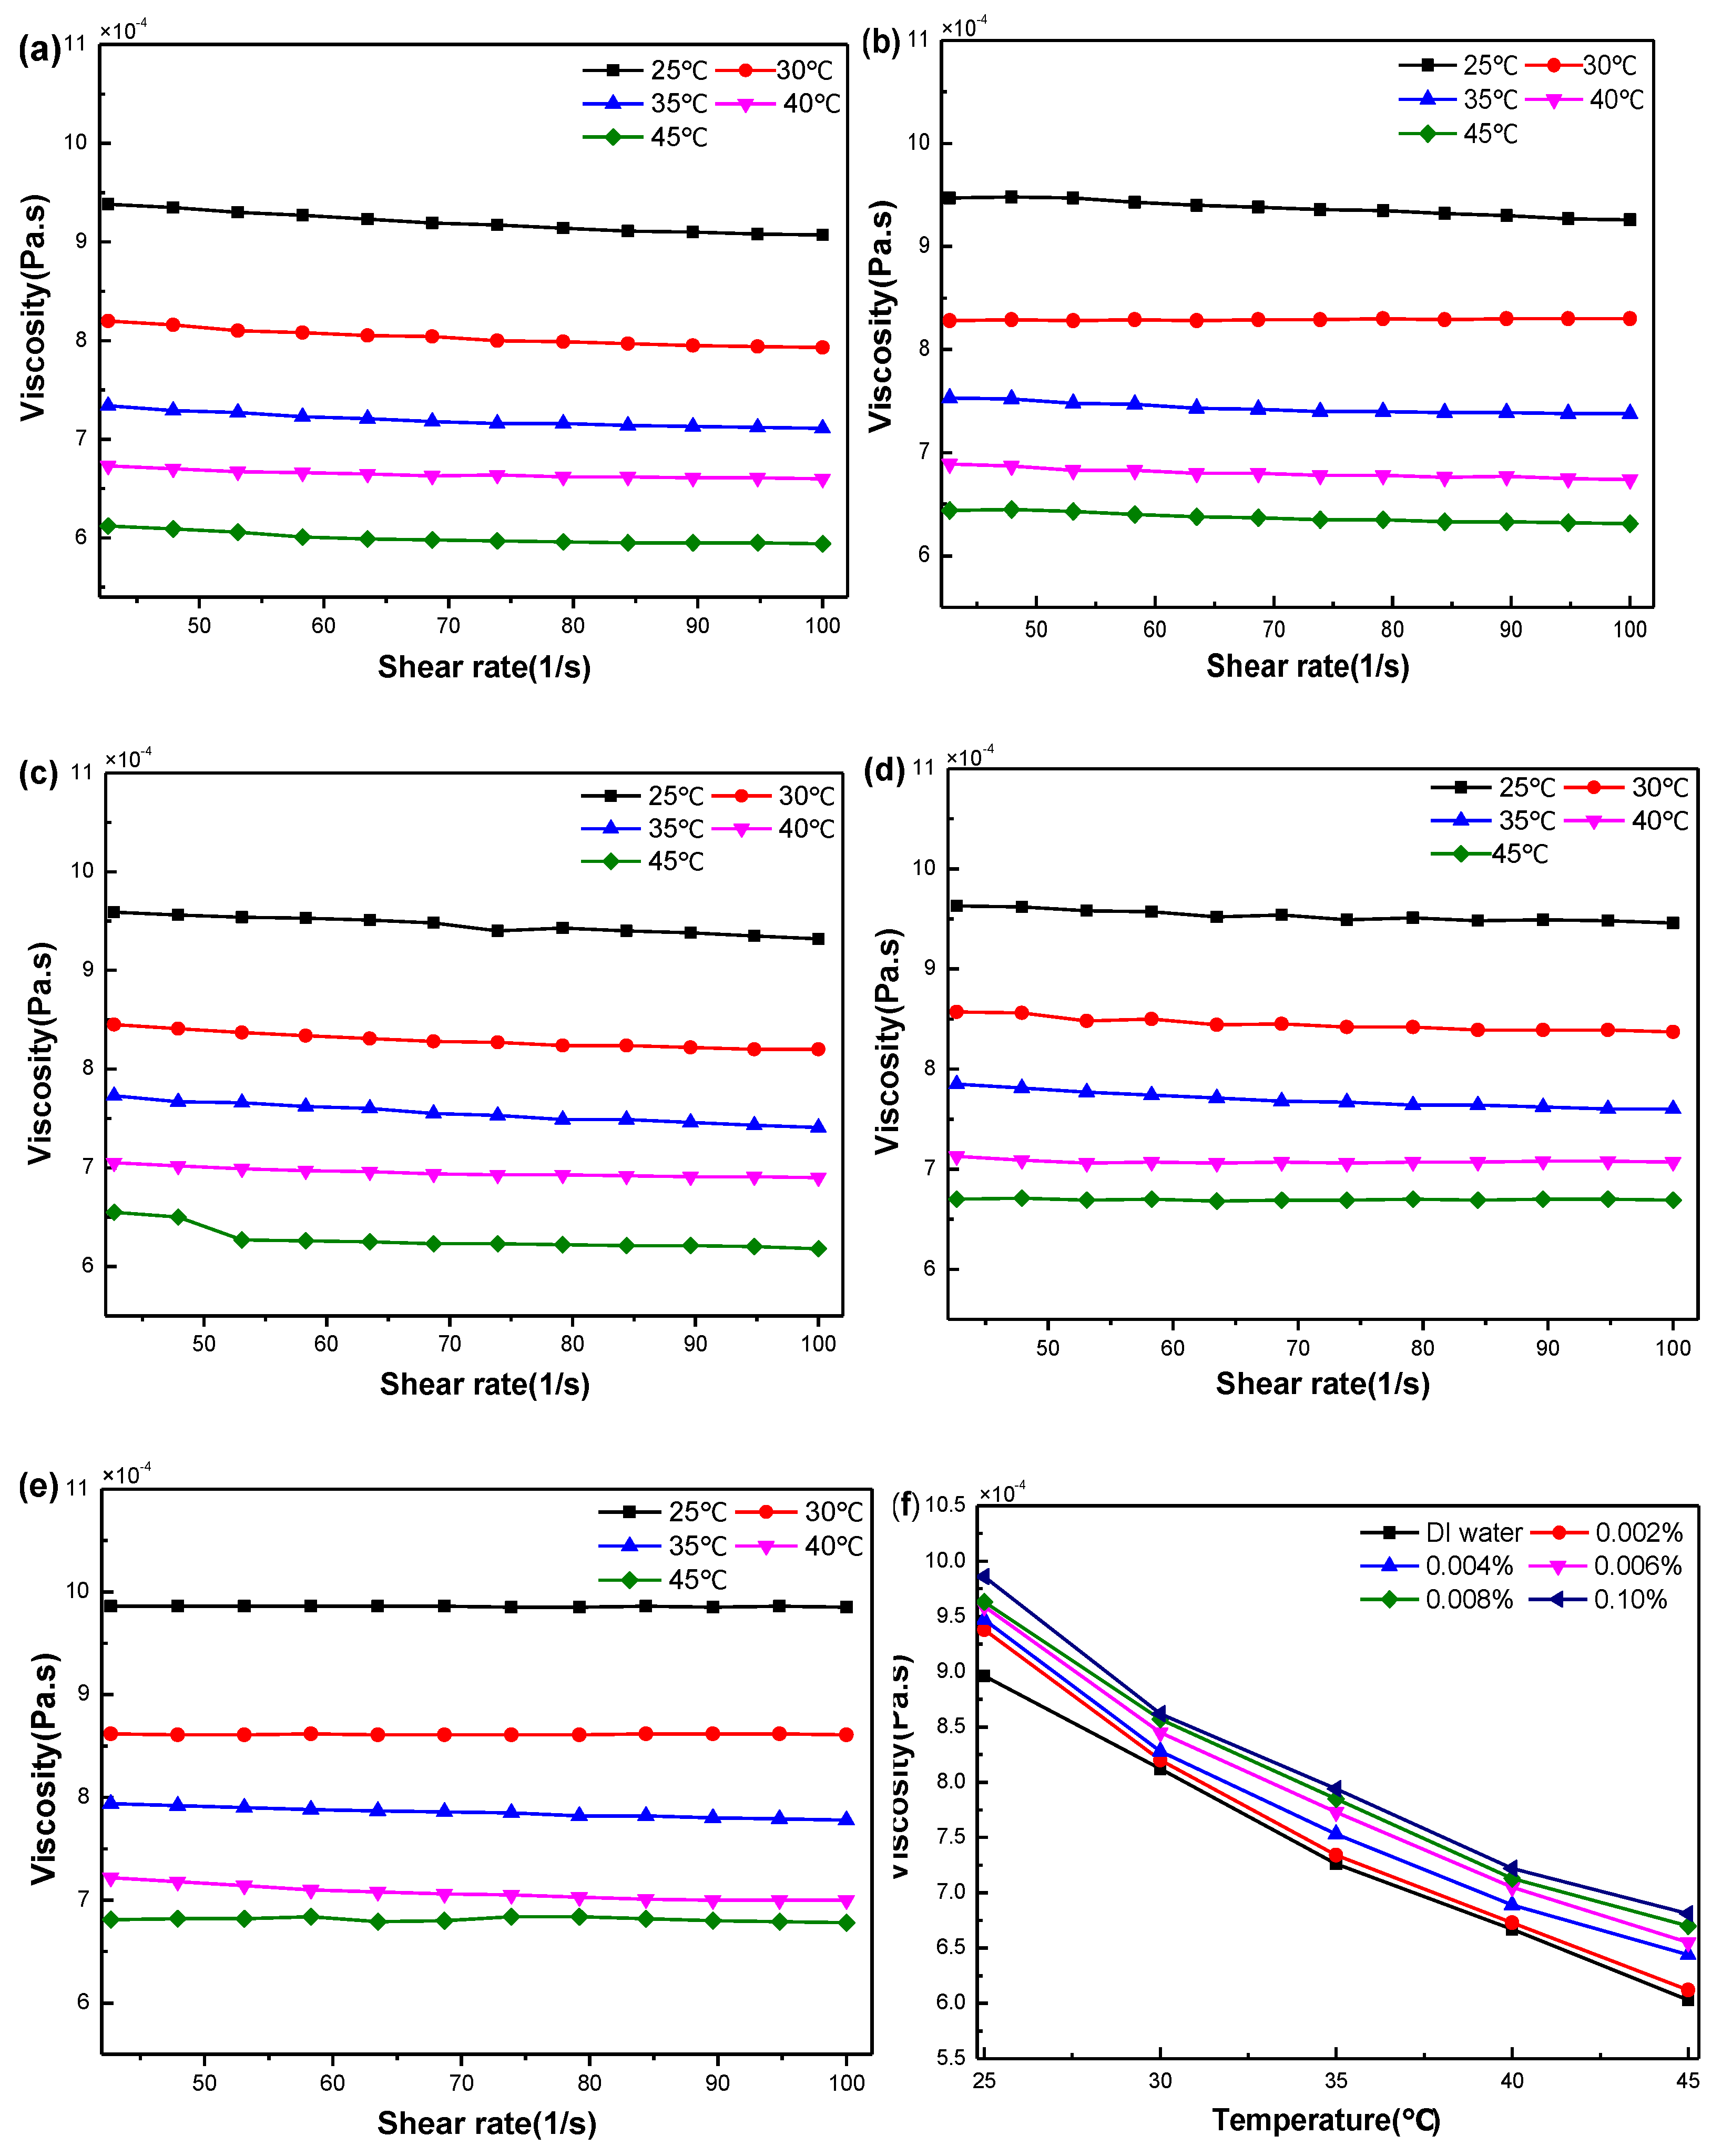
3.2. Rheological Properties of GO Nanofluids

The viscosity of nanofluids is an important parameter to determine the performance of heat transfer fluids. As with conventional fluids, temperature is also a key independent variable which affect the viscosity of nanofluids. In our case, viscosity of deionized water is measured to be 1.034 mPa·s, which is in good agreement with its theoretical value at 20 °C, and the relative deviation is less than 2.5%. It indicates that our test equipment is reliable. As is well known, deionized water exhibits Newtonian properties in the shear rate range.
Figure 4a–e shows the dynamic viscosity changes of nanofluids with different mass concentrations in the temperature range of 25 °C to 45 °C when the shear rate is changing from 0 to 100/s. It can be seen that the dynamic viscosity of the nanofluid almost keeps a constant value within the concentration range at a certain temperature. This means that in our experiments, GO nanofluid has Newtonian fluid characteristics. Figure 4f displays the relationship between temperature and dynamic viscosity. As can be seen in this Figure, the viscosity of nanofluids decreased with the increase in temperature. It is known that the interaction between particles and molecules decreases when temperature is increased, which in turn results in a decreased viscosity, as also has been observed for many other kinds of nanofluids [17]. At the same time, it is also noted that with the increase in mass concentration viscosity is also increased. In general, with the increase in nanoparticle concentration, particles would be easier to agglomerate, as a result, the frictional force between particles would be increased in the shear flow, which leads to an increased viscosity [18].

3.3. Thermal Conductivity of Graphene Oxide Nanofluids

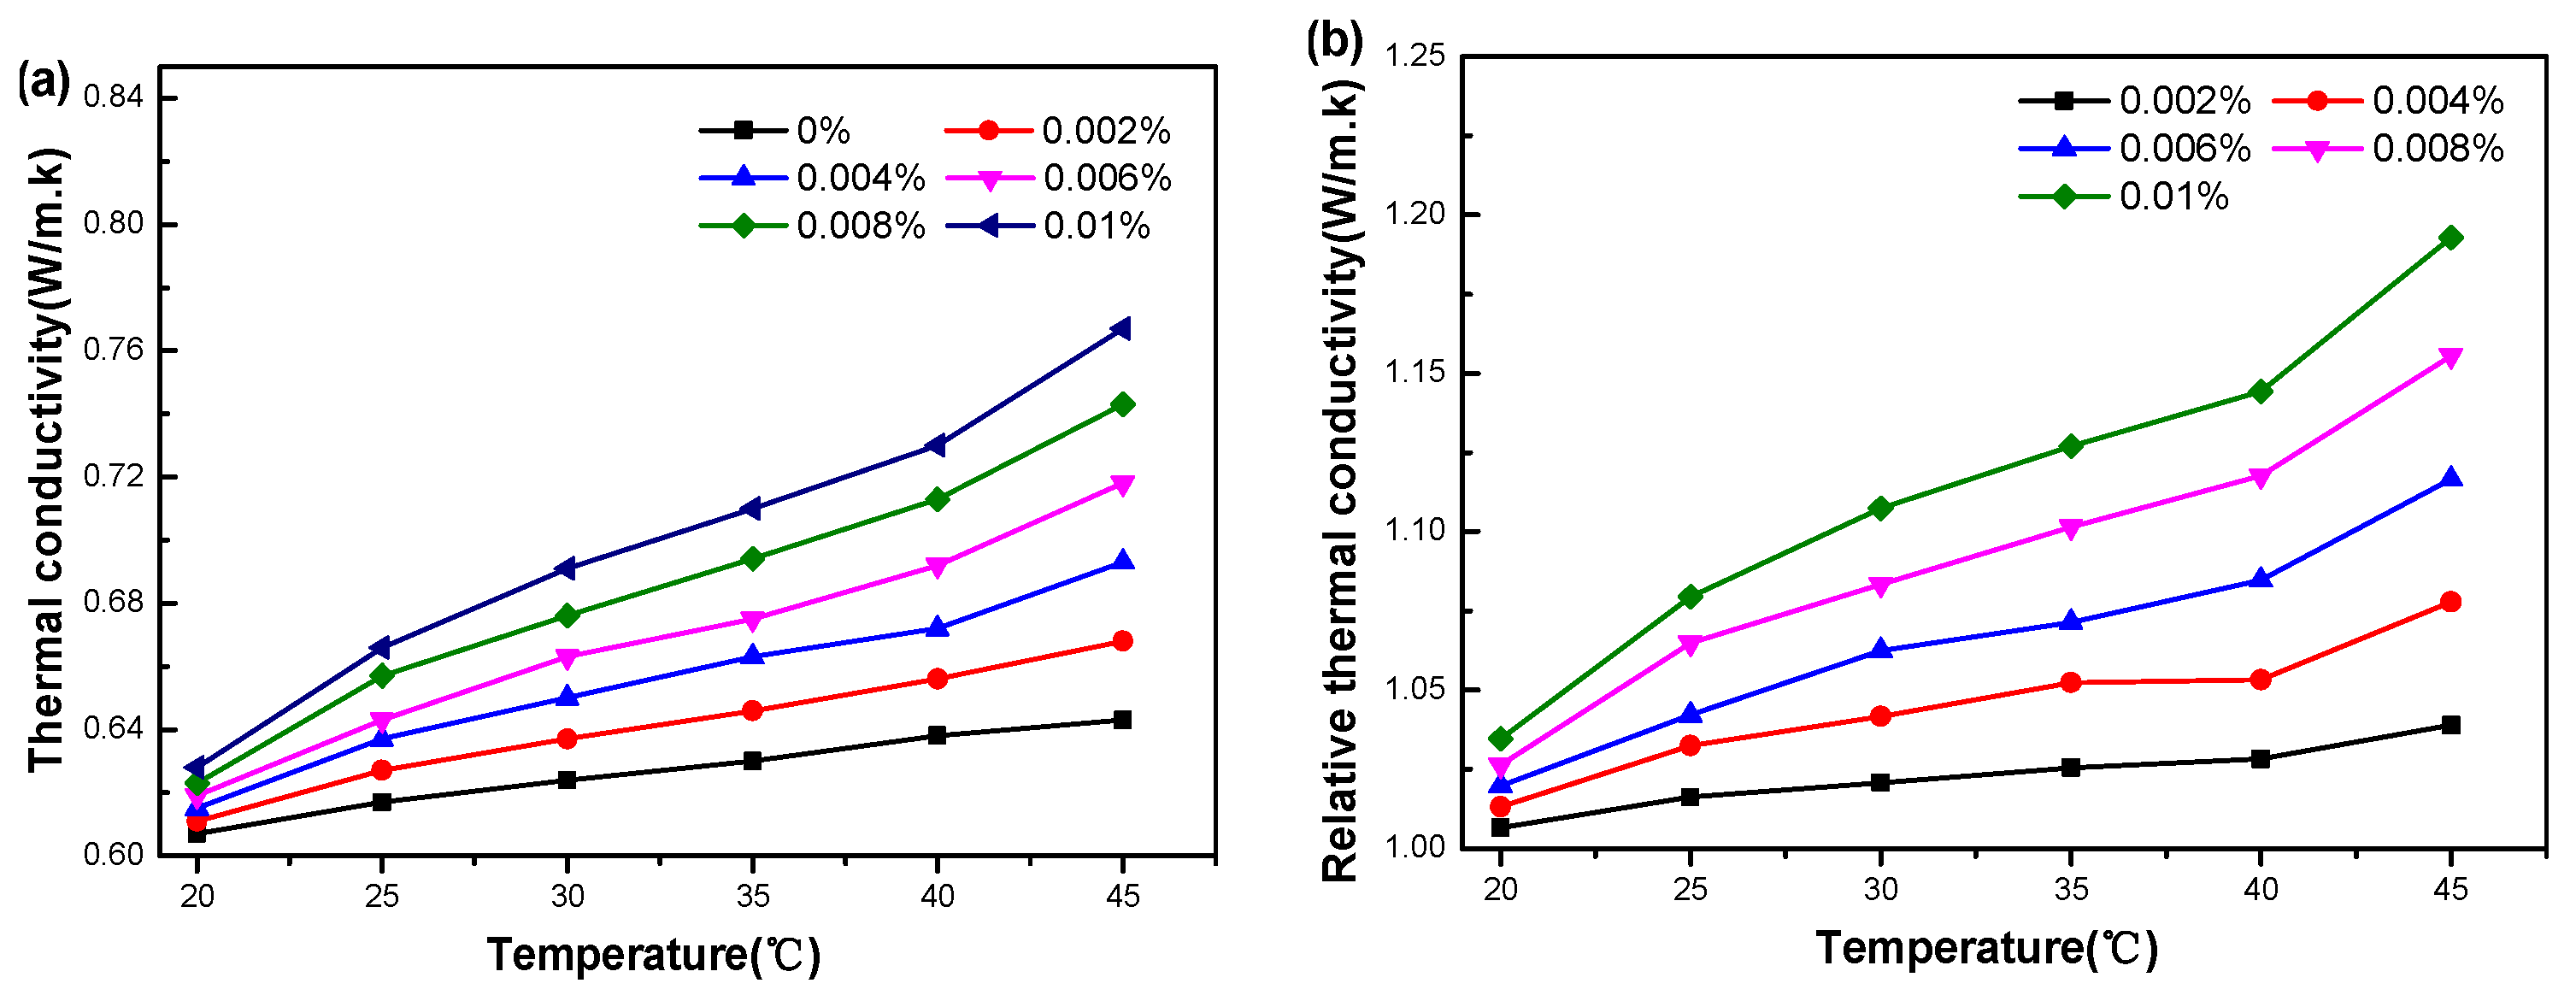
3.3.1. Effect of Temperature

In this section, the effect of temperature on the thermal conductivity of graphene oxide nanofluids is investigated. A laser thermal conductometer is used to measure the thermal conductivity of nanofluids, which is based on the hot wire method. Figure 5 shows the relationship between the relative conductivity and the temperature under different nanoparticle concentration. It can be seen that the thermal conductivity of nanofluids increases with the increment of temperature.
What is more, it is noticed that with the temperature being increased, the gradient of thermal conductivity also shows an increasing trend. On the one hand, with the increase in temperature, the increased Brownian motion of nanoparticles could cause the increased collision probability between nanoparticles in the fluid, which accompanies the enhancement of thermal conductivity. On the other hand, with the temperature increased, collision between the base liquid molecules and nanoparticles, the vibration frequency and thermal motion velocity of the base liquid molecules, would also increase; all these parameters can enhance thermal conductivity [18]. The maximum thermal conductivity is obtained at 50 °C and 0.010% mass concentration is 0.767 W/mK.

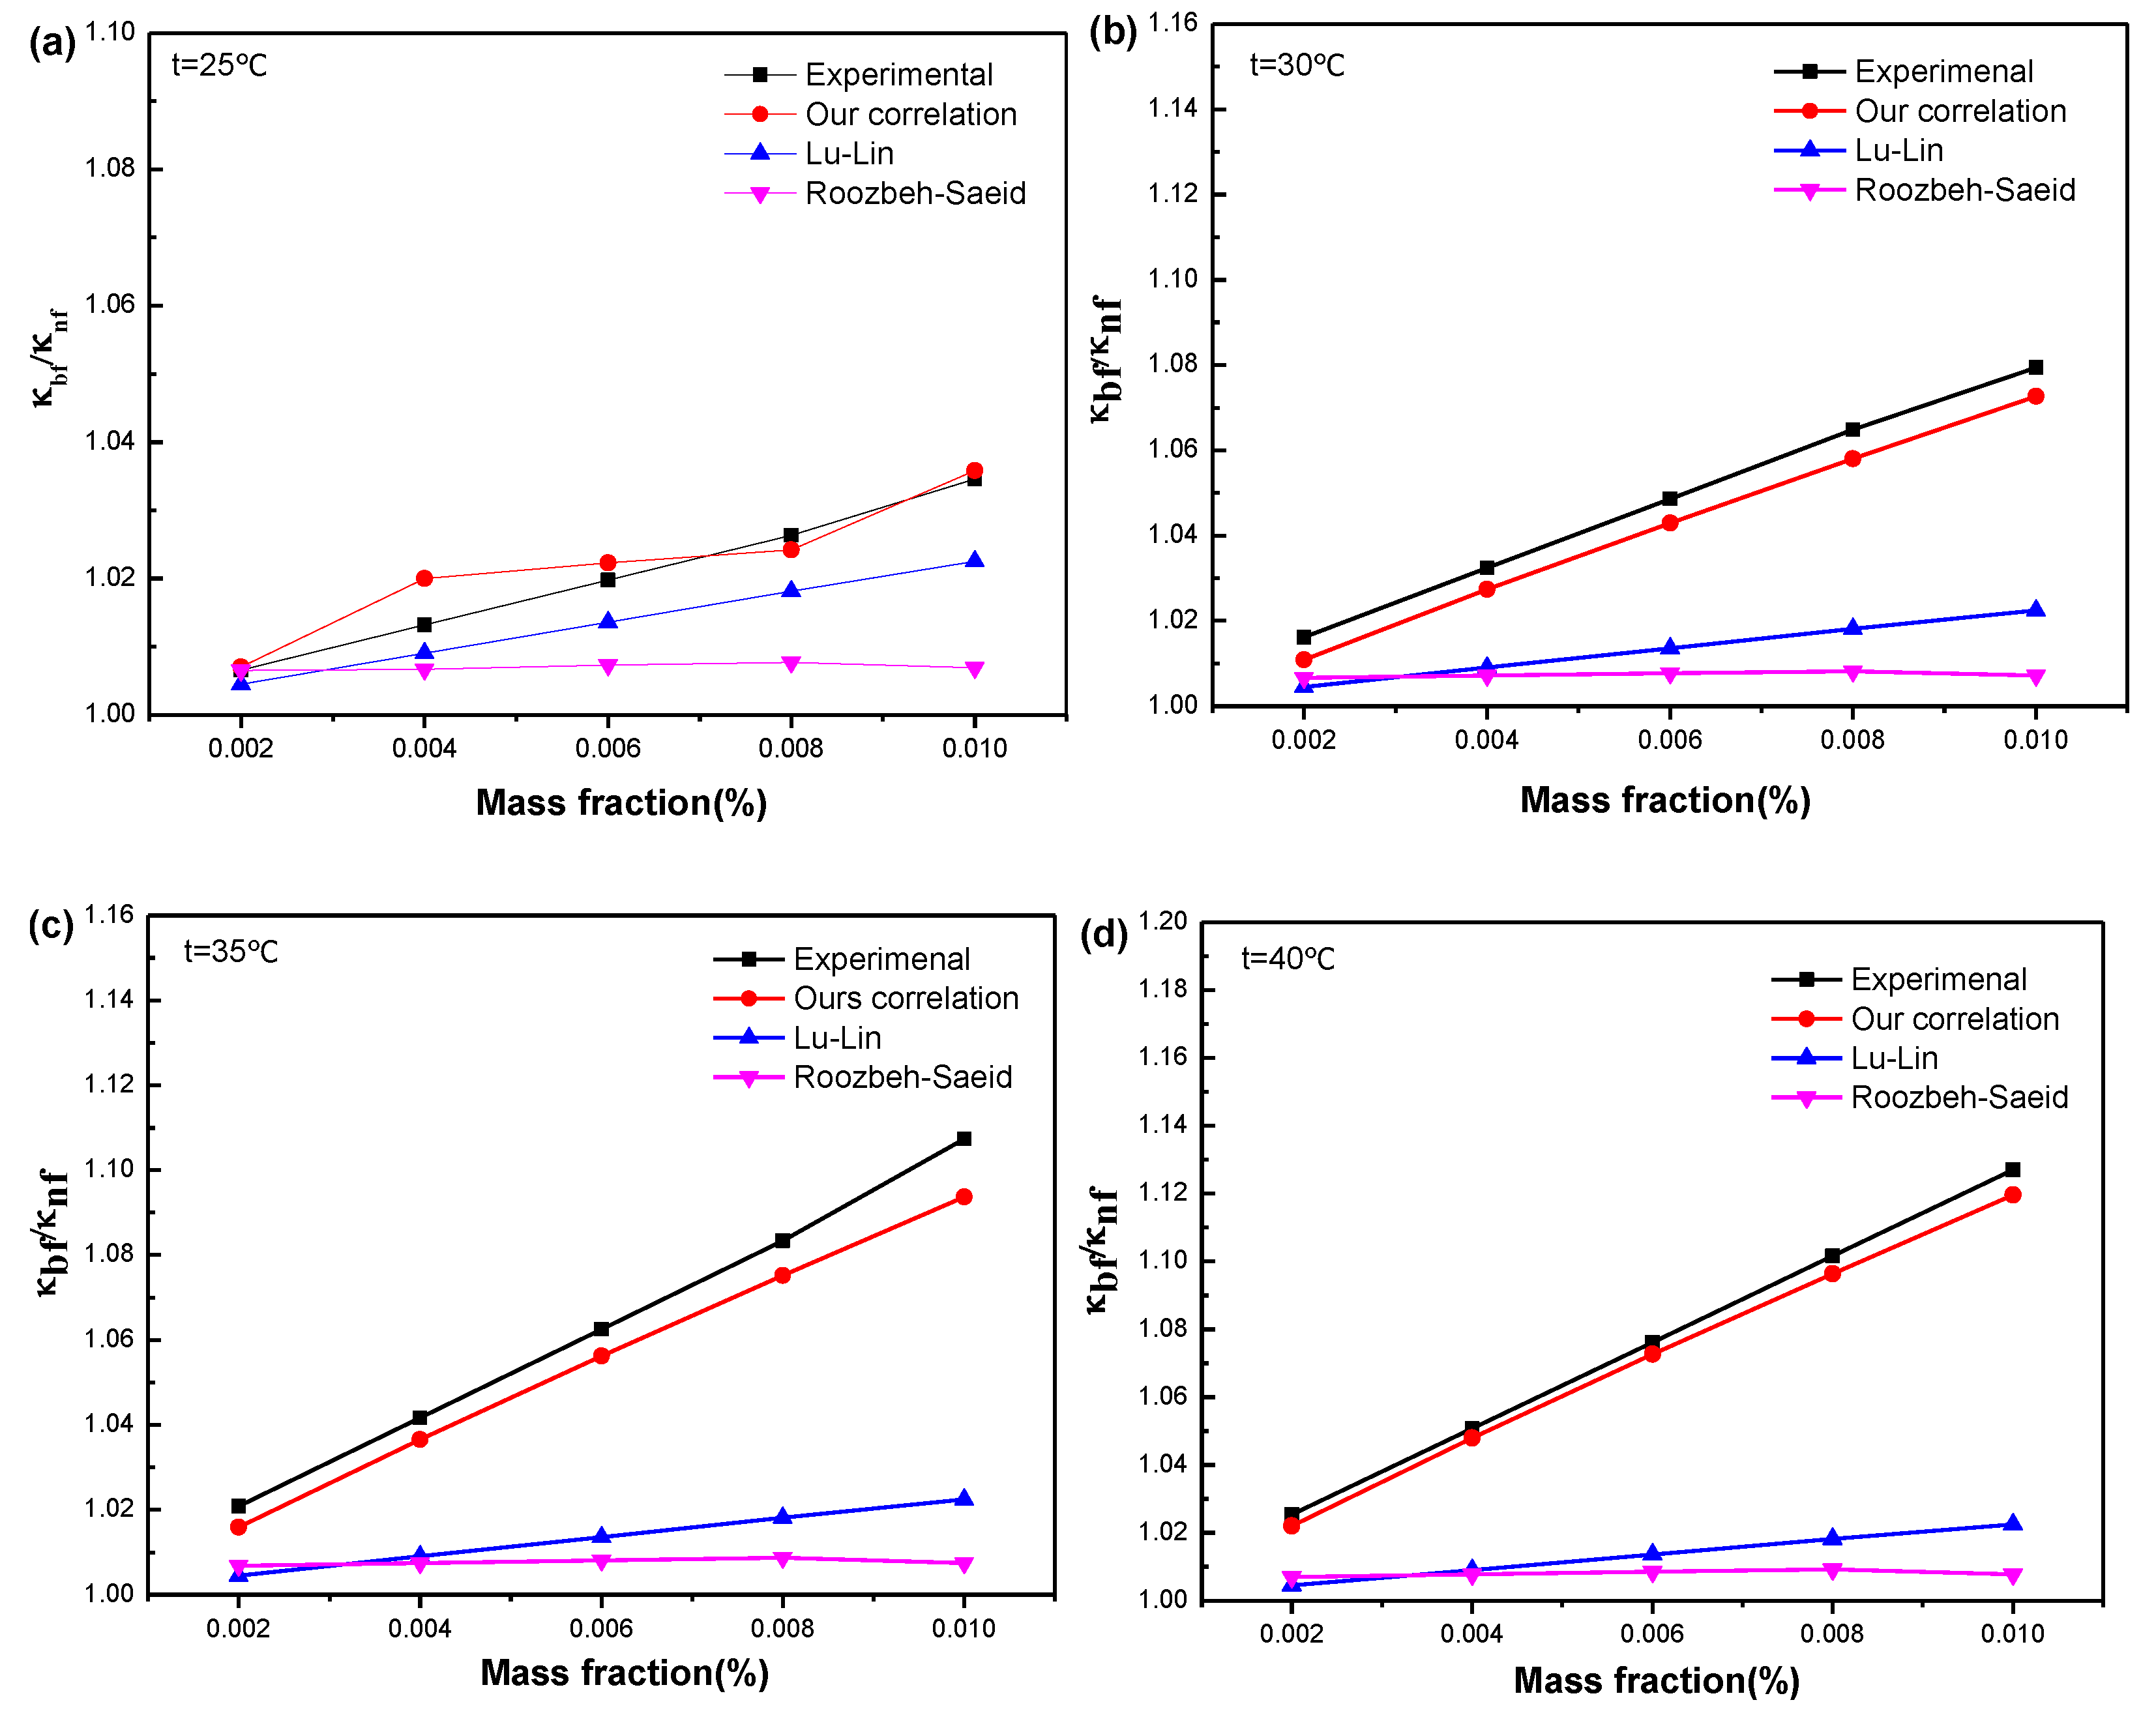
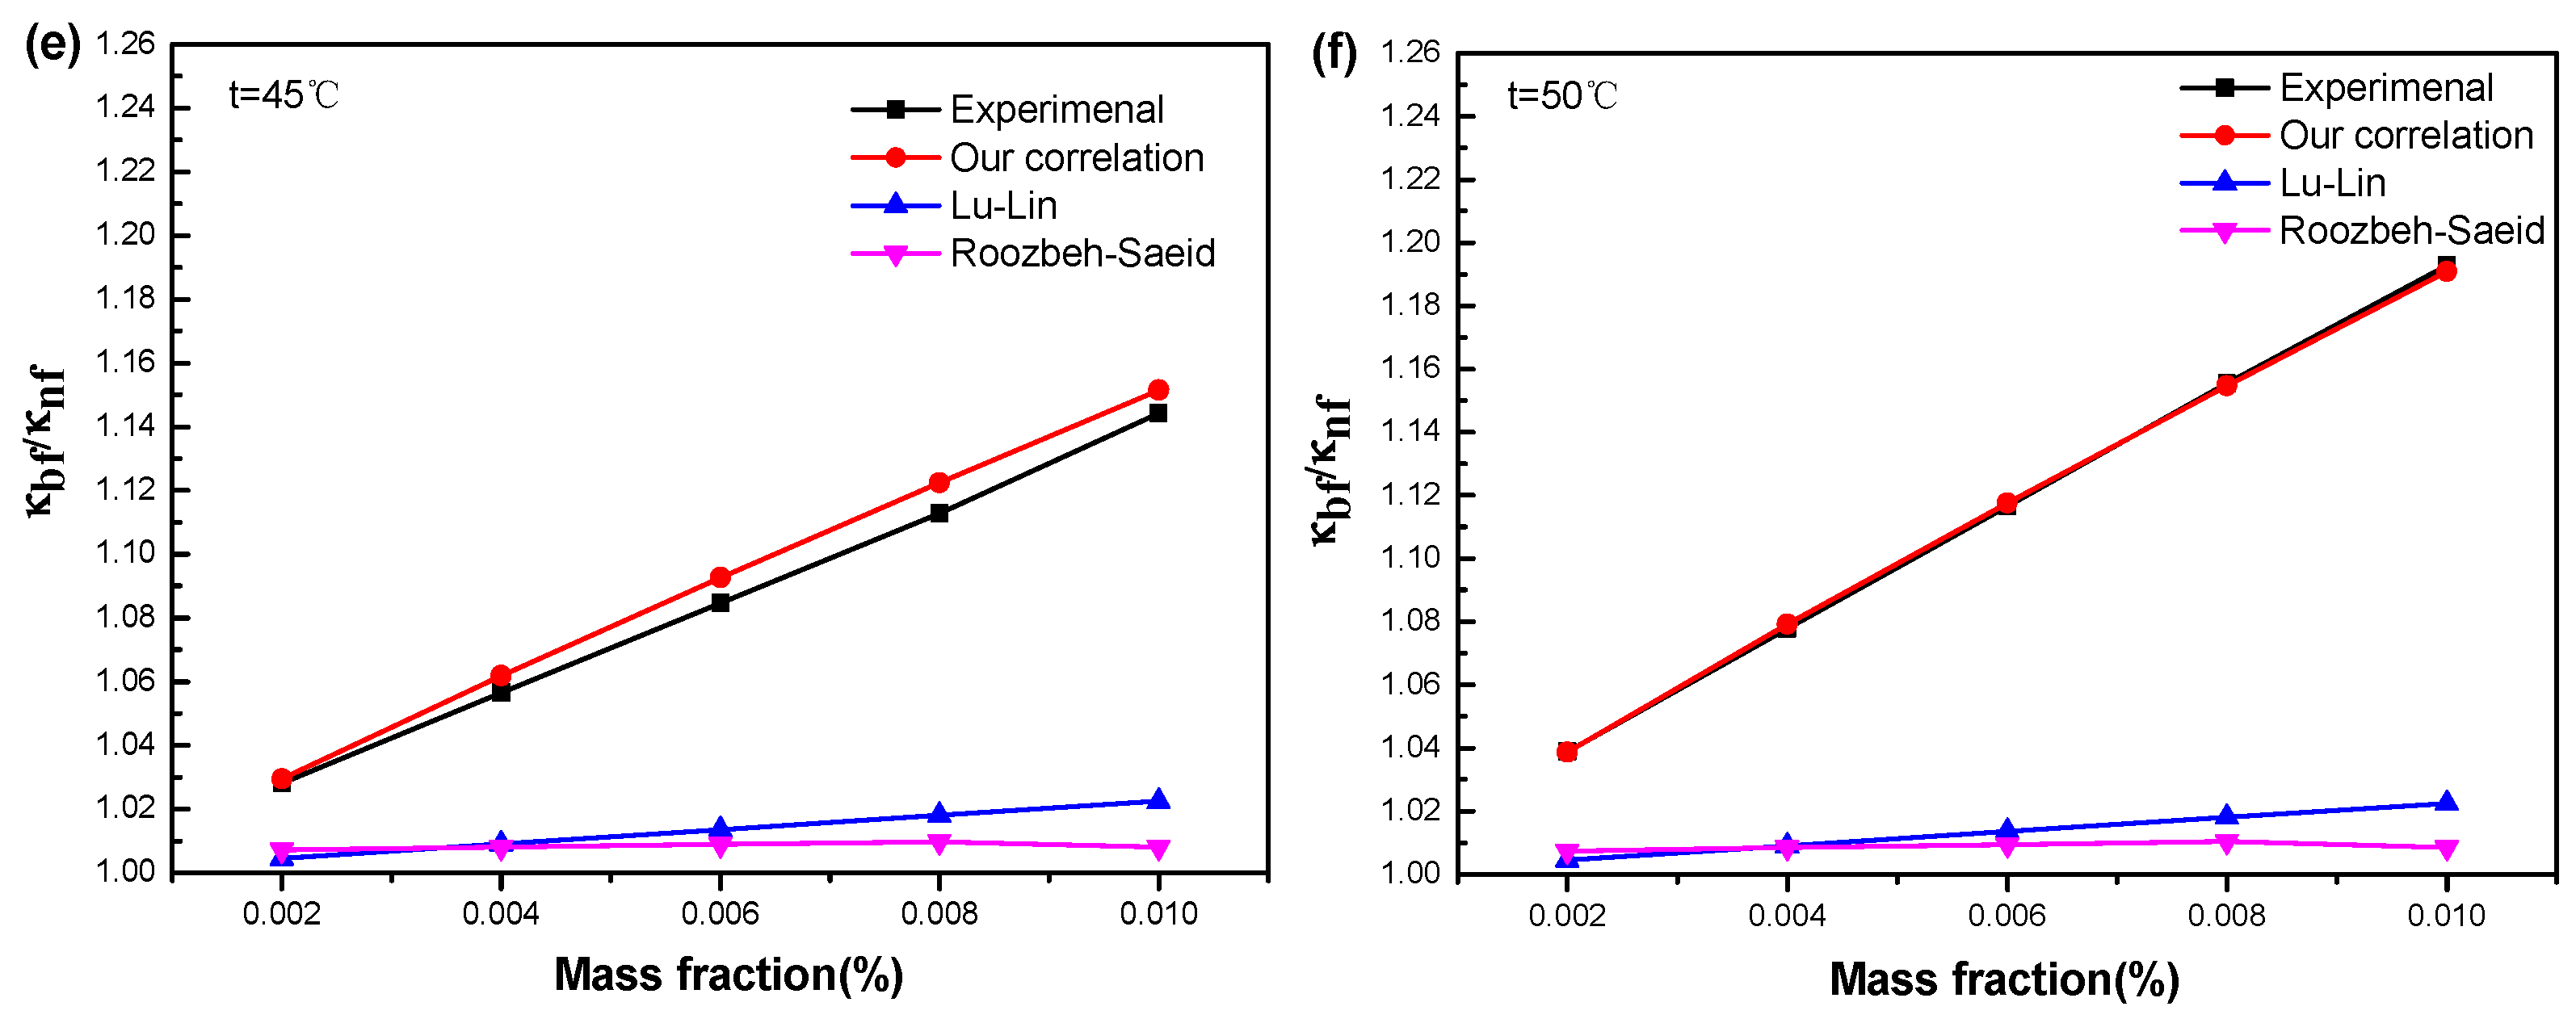
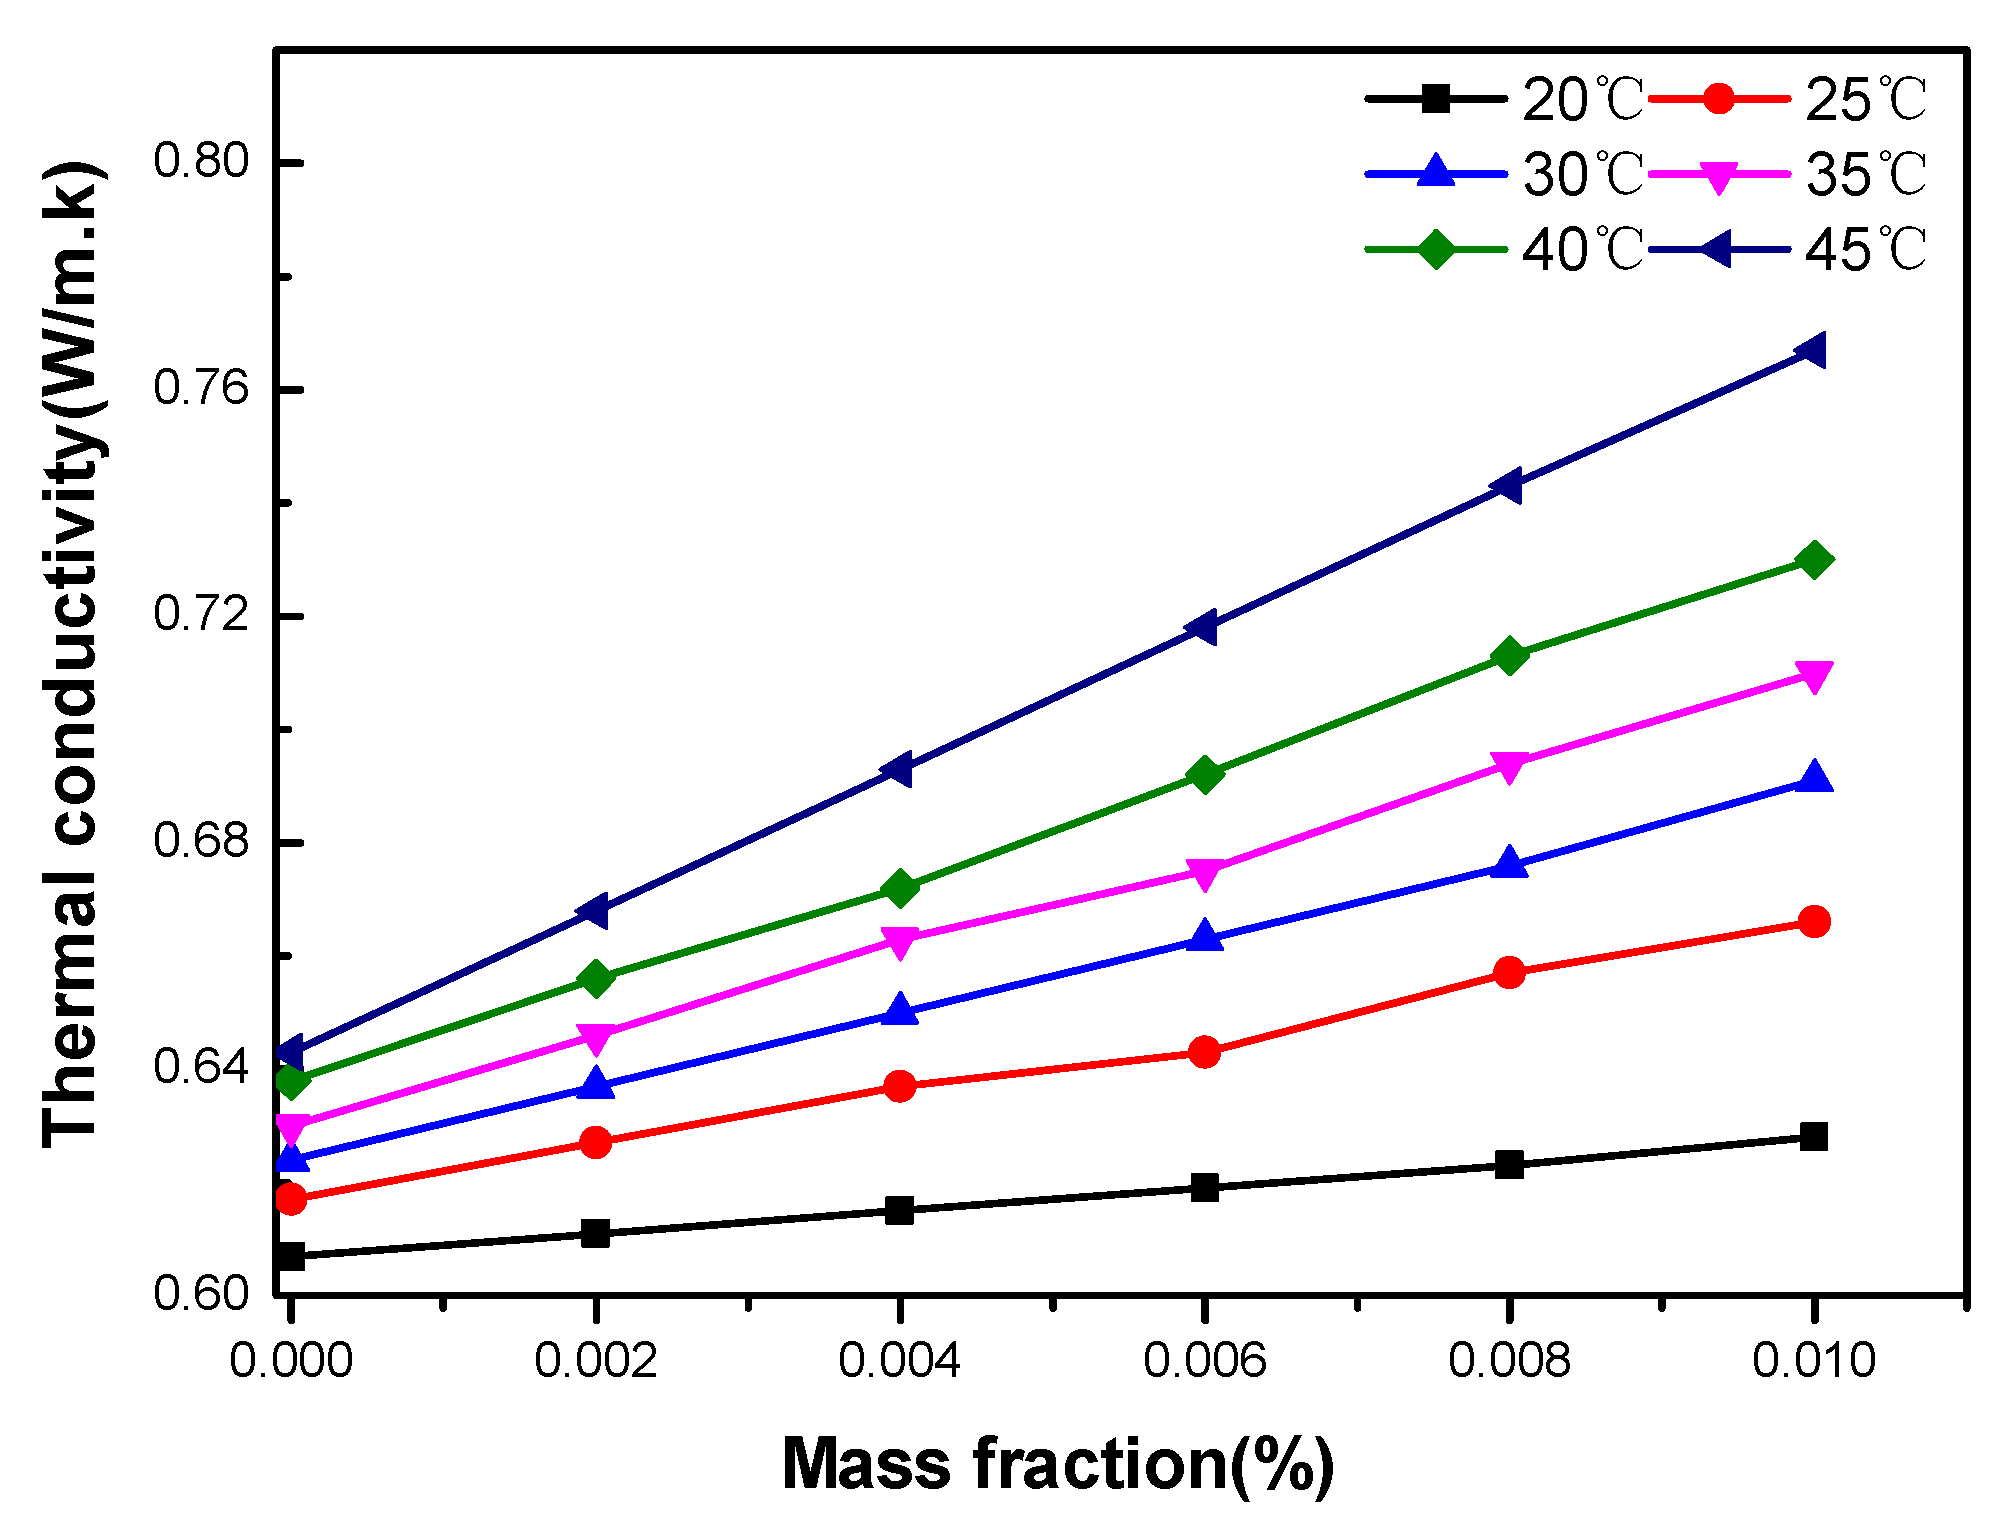
3.3.2. Effect of Particle Concentration

Figure 6 shows the thermal conductivity enhancements of water-based GO nanofluids as function of the particle mass fractions. The results show that the thermal conductivities of nanofluids increase with increasing particle concentration. The mass fraction of nanoparticles strongly affects the thermal conductivity of nanofluids. It is believed that when the nanoparticles are dispersed in the base fluid on a nanometer scale, an increase in the particle concentration increases the number of particles, thereby increasing the area of the contact interface between the particles and the base fluid, which, in turn, enhances the heat transfer of nanofluid. However, when the particle concentration increases to a certain level, the particles agglomerate, the stability of the suspension decreases and the viscosity increases, which finally weakens the heat transfer performance of the nanofluid.

3.3.3. Existing Models for the Effective Thermal Conductivity of Nanofluid

Figure 7 shows the comparison between our experimental results and those calculated based on the formula proposed in the literature [18,19]. The temperature range is 25–50 °C, and the mass concentration range is 0.002–0.010%. Lin et al. proposed a formula for calculating the relative thermal conductivity of nanofluids [18]. As shown in Equation (1), they focused on the effect of particle concentration and believed that the effect of temperature is negligible:
k n f k b f = 1 + 2.25 φ + 2.27 φ 2
where k n f is the thermal conductivity of nanofluids, k b f is the thermal conductivity of base nanofluids and φ is the mass concentration percentage of nanofluid. In this equation, temperature is ignored, however, as our experimental results demonstrate, temperature has a great effect on the thermal conductivity of nanofluids. As a result, a more accurate equation is proposed by Roozbeh Saeid (RS) [20]:
k n f k b f = 0.0031 ( T 1.185 ) ( φ 0.863 ) + 1.006
where k n f is the thermal conductivity of nanofluids, k b f is the thermal conductivity of base nanofluids, φ is the mass concentration percentage of nanofluid and t is the temperature of nanofluid. The Equation (2) relates the relative thermal conductivity with temperature and particle concentration, which are two key factors affecting the relative thermal conductivity. As can be seen in Figure 7, this equation has better accuracy in the range of higher concentration, but it has a larger error for lower concentration nanofluids.

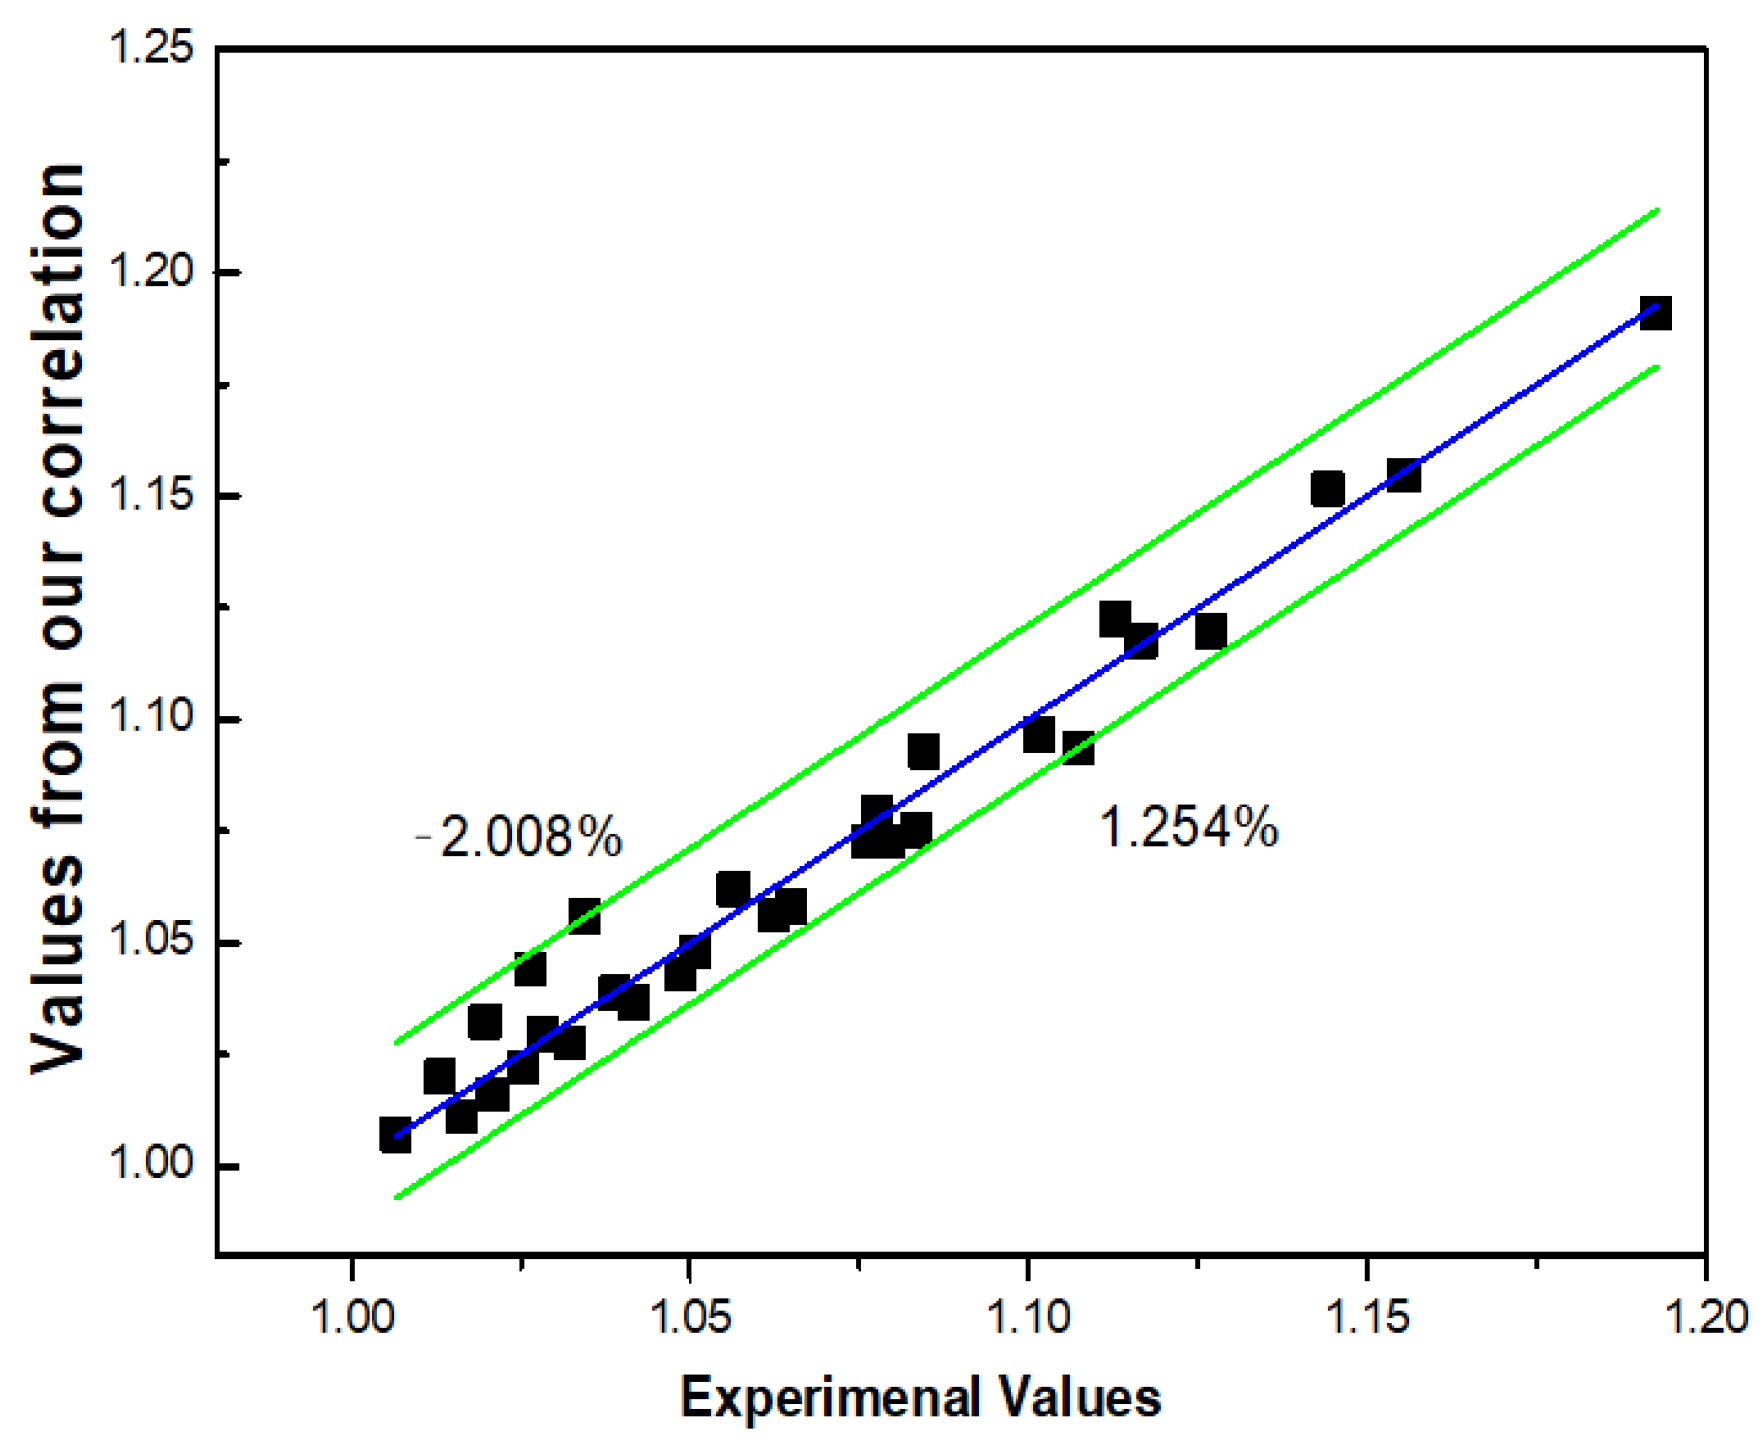
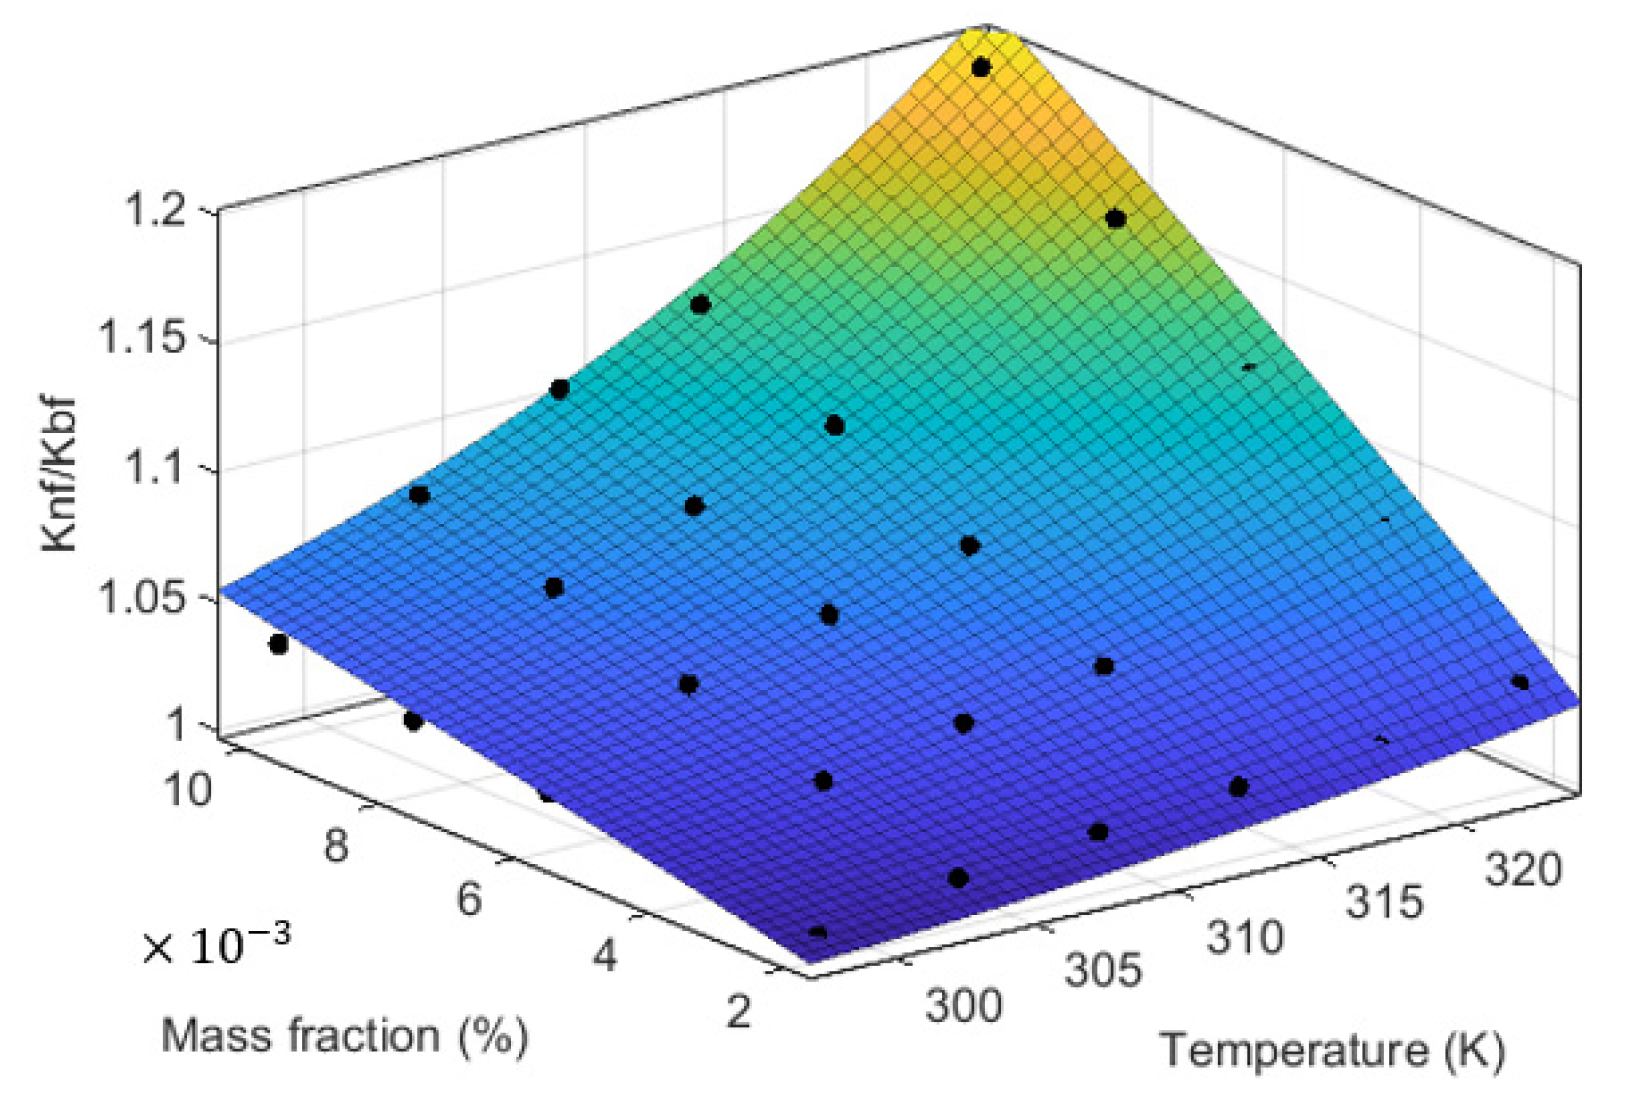
3.3.4. Our Proposed Model

The above results show that both the theoretically predicted values are still significantly deviated from the experimentally measured values of thermal conductivity. In order to accurately predict thermal conductivity values of GO nanofluids for practical applications such as its promising applications in solar collectors, it is necessary to propose a more comprehensive and accurate model.
To consider more factors which influence thermal conductivity of GO nanofluids, we propose an equation format to correlate the thermal conductivity as a function of temperature T and mass concentration percentage φ, with four coefficients from a to b to modify each term in the thermal conductivity equation. The new format of equation is shown as follows:
k n f k b f = a ( T T 0 ) b ( φ c ) + d
where k n f is the thermal conductivity of nanofluids, k b f is the thermal conductivity of base nanofluids, φ is the mass concentration percentage of nanofluid, T is the temperature of nanofluid and T 0 is the constant value of equilibrium dimension temperature, here taken as 273.15 k; a–d are all undetermined parameters. Using the experimental data for fitting, the final expression of the present model can be obtained as follows:
k n f k b f = 1.171 ( T 273.15 ) 14.12 ( φ 0.9004 ) + 0.992 ,     R s q r = 0.97
The above correlation characterizes the relative thermal conductivity k n f / k b f versus temperature T and mass concentration percentage φ . The three-dimensional coordinate diagram of this equation is shown in Figure 8.
In order to verify the accuracy of our proposed correlation, the experimentally measured value is compared with the correlation value, and the results are shown in Figure 9. According to the comparison, the absolute value of the maximum relative deviation is only 2.008%. This demonstrates that the output data of our correlation are reliable, which can be used to predict the thermal conductivity of graphene oxide nanofluids. As shown by the Figure 9, our proposed model is reasonably in better agreement with the experimental results than those compared with the two previously reported correlation models.

4. Conclusions

In this study, the viscosity and thermal conductivity of graphene oxide nanofluids were measured. The range of temperature is 25–50 °C and the mass concentrations are 0.002%, 0.004%, 0.006%, 0.008% and 0.010%, respectively. Agglomeration and sedimentation of the prepared nanofluids after standing for 20 days were not observed, showing the good stability of the prepared graphene oxide–water nanofluid. Our results show that with an increase in temperature, the dynamic viscosity of nanofluids decreases, but the thermal conductivity increases. We demonstrate that graphene oxide nanofluids can improve the heat transfer performance, especially at high temperature. The reason for thermal conductivity increasing can be attributed to the increased Brownian motion of nanoparticles and the enhanced molecular kinetic energy with the increase in temperature. The enhanced nanoparticle collision finally results in improved thermal conductivity. The highest thermal conductivity increase is obtained when the nanofluid concentration is 0.01% and the temperature is 50 °C. Finally, and most importantly, considering the inaccuracy of the existing experimental correlations to the predicted values of thermal conductivity, we propose our own mathematical model of correlation and carry out a series of tests to verify its accuracy. The experimental correlations with temperature and concentration as independent variables show good agreement and accuracy with the experimental data. It is worth noting that our correlation is in fact a semi-empirical one, which is based on our experimental data over five kinds of graphene oxide nanofluids, with a mass fraction of 0.002% to 0.01%, which have been studied in the temperature range of 25–50 °C. Therefore, the model is strictly reliable in terms of volume fraction and temperature working within this range. Fortunately, with this range combined with the reported data for higher temperatures, we can ensure that our model can be a useful tool for most of the application cases.

Author Contributions

Conceptualization, L.M.; methodology, X.M.; software, X.S.; validation, X.M. and X.S.; formal analysis, D.J.; writing—original draft preparation, X.M.; writing—review and editing, L.M.; supervision and funding acquisition, L.M. All authors have read and agreed to the published version of the manuscript.

Funding

This research was funded by the National Key Research and Development Program of China (2018YFB1502000), the Royal Society Newton Advanced Fellowship grant (NAF\R1\191163) and The Youth Innovation Team of Shaanxi Universities.

Acknowledgments

The authors gratefully acknowledge the financial support of the National Key Research and Development Program of China (2018YFB1502000), the Royal Society Newton Advanced Fellowship grant (NAF\R1\191163) and The Youth Innovation Team of Shaanxi Universities.

Conflicts of Interest

The authors declare no conflict of interest that could have appeared to influence the work reported in this paper.

References

  1. Gonçalves, I.; Souza, R.; Coutinho, G.; Miranda, J.; Moita, A.; Pereira, J.; Moreira, A.; Lima, R. Thermal Conductivity of Nanofluids: A Review on Prediction Models, Controversies and Challenges. Appl. Sci. 2021, 11, 2525. [Google Scholar] [CrossRef]
  2. Yu, S.-P.; Lue, Y.-F.; Teng, T.-P.; Hsieh, H.-K.; Huang, C.-C. Enhanced Heat Transfer Performance of the Tube Heat Exchangers Using Carbon-Based Nanofluids. Appl. Sci. 2021, 11, 8139. [Google Scholar] [CrossRef]
  3. Jin, J.Y.; Hatami, M.; Jing, D.W. Experimental investigation and prediction of the thermal conductivity of water-based oxide nanofluids with low volume fractions. J. Therm. Anal. Calorim. 2019, 135, 257–269. [Google Scholar] [CrossRef]
  4. Kleinstreuer, C.; Yu, F. Experimental and theoretical studies of nanofluid thermal conductivity enhancement: A review. Nanoscale Res. Lett. 2011, 6, 229. [Google Scholar] [CrossRef] [Green Version]
  5. Mehrali, M.; Latibari, S.T.; Mehrali, M.; Mahlia, T.M.I.; Metselaar, H.S.C. Preparation and properties of highly conductive palmitic acid/graphene oxide composites as thermal energy storage materials. Energy 2013, 58, 628–634. [Google Scholar] [CrossRef]
  6. Baby, T.T.; Ramaprabhu, S. Enhanced convective heat transfer using graphene dispersed nanofluids. Nanoscale Res. Lett. 2011, 6, 289–299. [Google Scholar] [CrossRef] [PubMed] [Green Version]
  7. Chen, L.; Xie, H. Surfactant-free nanofluids containing double- and single-walled carbon nanotubes functionalized by a wet-mechanochemical reaction. Thermochim. Acta 2010, 497, 67–71. [Google Scholar] [CrossRef]
  8. Wakif, A.; Zaydan, M.; Alshomrani, A.S.; Muhammad, T.; Sehaqui, R. New insights into the dynamics of alumina-(60% ethylene glycol + 40% water) over an isothermal stretching sheet using a renovated Buongiorno’s approach: A numerical GDQLLM analysis. Int. Commun. Heat Mass Transf. 2022, 133, 105937. [Google Scholar] [CrossRef]
  9. Nayak, M.K.; Wakif, A.; Animasaun, I.L.; Alaoui, M.S.H. Numerical Differential Quadrature Examination of Steady Mixed Convection Nanofluid Flows Over an Isothermal Thin Needle Conveying Metallic and Metallic Oxide Nanomaterials: A Comparative Investigation. Arab. J. Sci. Eng. 2020, 45, 5331–5346. [Google Scholar] [CrossRef]
  10. Zaydan, M.; Wakif, A.; Alshomrani, I.L.; Khan, U.; Baleanu, D.; Sehaqui, R. Significances of blowing and suction processes on the occurrence of thermo-magneto-convection phenomenon in a narrow nanofluidic medium: A revised Buongiorno’s nanofluid model. Case Stud. Therm. Eng. 2022, 22, 100726. [Google Scholar] [CrossRef]
  11. Rasool, G.; Wakif, A. Numerical spectral examination of EMHD mixed convective flow of second-grade nanofluid towards a vertical Riga plate using an advanced version of the revised Buongiorno’s nanofluid model. J. Therm. Anal. Calorim. 2021, 143, 2379–2393. [Google Scholar] [CrossRef]
  12. Xia, W.F.; Alshomrani, A.S.; Wakif, A.; Shah, N.A.; Yook, S.-J. Gear-generalized differential quadrature analysis of oscillatory convective Taylor-Couette flows of second-grade fluids subject to Lorentz and Darcy-Forchheimer quadratic drag forces. Int. Commun. Heat Mass Transf. 2021, 126, 105395. [Google Scholar] [CrossRef]
  13. Wakif, A.; Animasaun, I.L.; Khan, U.; Shah, N.A.; Thumma, T. Dynamics of radiative-reactive Walters-b fluid due to mixed convection conveying gyrotactic microorganisms, tiny particles experience haphazard motion, thermo-migration, and Lorentz force. Phys. Scr. 2021, 96, 125239. [Google Scholar] [CrossRef]
  14. Alghamdi, M.; Wakif, A.; Thumm, T.; Khan, U.; Baleanu, D.; Rasool, G. Significance of variability in magnetic field strength and heat source on the radiative-convective motion of sodium alginate-based nanofluid within a Darcy-Brinkman porous structure bounded vertically by an irregular slender surface. Case Stud. Therm. Eng. 2021, 28, 101428. [Google Scholar] [CrossRef]
  15. Ghozatloo, A.; Shariaty-Niasar, M.; Rashidi, A.M. Preparation of nanofluids from functionalized Graphene by new alkaline method and study on the thermal conductivity and stability. Int. Commun. Heat Mass Transf. 2013, 42, 89–94. [Google Scholar] [CrossRef]
  16. Jing, D.W.; Hu, Y.; Liu, M.C.; Wei, J.J.; Guo, L.J. Preparation of highly dispersed nanofluid and CFD study of its utilization in a concentrating PV/T system. Sol. Energy 2015, 112, 30–40. [Google Scholar] [CrossRef]
  17. Sun, L.; Zhao, Q.Y.; Zhang, Y.M.; Gao, W.; Jing, D.W. Insights into the rheological behavior of ethanol-based metal oxide nanofluids. J. Mol. Liq. 2021, 323, 115006. [Google Scholar] [CrossRef]
  18. Chopkar, M.; Sudarshan, S.; Das, P.; Manna, I. Effect of Particle Size on Thermal Conductivity of Nanofluid. Met. Mater. Trans. 2008, 39, 1535–1542. [Google Scholar] [CrossRef]
  19. Lu, S.-Y.; Lin, H.-C. Effective conductivity of composites containing aligned spheroidal inclusions of finite conductivity. J. Appl. Phys. 1996, 79, 6761. [Google Scholar] [CrossRef]
  20. Taherialekouhi, R.; Rasouli, S.; Khosravi, A. An experimental study on stability and thermal conductivity of water-graphene oxide/aluminum oxide nanoparticles as a cooling hybrid nanofluid. Int. J. Heat Mass Transf. 2019, 145, 118751. [Google Scholar] [CrossRef]
Figure 1. Nanofluids with different concentrations (a): 0 d and (b): 20 d.
Applsci 12 03567 g001
Figure 2. (a) UV–Vis absorption spectra of GO nanofluids with different concentrations and (b) relationship between mass concentration and maximum absorption.
Applsci 12 03567 g002
Figure 3. (a) Zeta potential of 0.002% GO nanofluid and (b) particle size distribution intensity curve of 0.002% GO nanofluid.
Applsci 12 03567 g003
Figure 4. Relationship between viscosity and shear rate of nanofluids (ae) GO–water 0.002%, 0.004% 0.006%, 0.008% and 0.010% and (f) relationship between temperature and dynamic viscosity.
Applsci 12 03567 g004
Figure 5. Thermal conductivity of GO–water nanofluid versus temperature. (a): absolute, (b): relative to water.
Applsci 12 03567 g005
Figure 6. Thermal conductivity of GO–water nanofluid versus mass fraction at various temperatures.
Applsci 12 03567 g006
Figure 7. Comparison of experimental data for GO/DI-water-based nanofluids with results from models. (af) under temperature of 25, 30, 35, 40, 45 and 50 °C, respectively.
Applsci 12 03567 g007aApplsci 12 03567 g007b
Figure 8. Three-dimension diagram of the proposed correlation.
Applsci 12 03567 g008
Figure 9. Deviation between the output value of the correlation and the experimentally measured value.
Applsci 12 03567 g009
Publisher’s Note: MDPI stays neutral with regard to jurisdictional claims in published maps and institutional affiliations.

