Abstract
Parkinson’s disease (PD) is an increasingly prevalent and currently incurable neurodegenerative disorder. The aggregation of the amyloid disordered protein α-synuclein (Syn) has been implicated in the development of PD. In the literature, it has been suggested that tyrosine residues of Syn play an important role in the interactions established during the fibrillation process. Herein, the prevalence of the referred interactions under shear stress conditions of Nα-acetyl-L-tyrosinamide (NAYA) and of Syn solutions by using membrane centrifugal filters with different cut-off of 200 nm, 100 kDa, 50 kDa and 30 kDa, under centrifugation conditions, were investigated. In order to determine the nature of the interactions involving the protein tyrosine residues the NAYA compound, which mimics the peptide bonds in protein and also possesses a tyrosyl group similar to the tyrosyl groups found in the Syn protein molecular structure, was used. It is expected that for a small molecule, such as NAYA, no molecular association occurs, contrary to what exists in the Syn protein solutions, which can more adequately retrieve the type of interactions formed, involving the tyrosyl group. Therefore, sensing the tyrosyl group absorption, spectroscopic techniques, in particular, were used. For NAYA, an intramolecular interaction between the tyrosyl group and the peptide bond was evidenced. For NAYA and Syn, it was observed that decreasing the membrane centrifugal filters pore size, under centrifugation conditions, was concomitant with the minimization of the intramolecular interactions between the tyrosyl group and the peptide bond. With this, it is likely to assume that shear stress conditions in the Syn solutions propel protein aggregation by a less strained protein backbone. Contrary to the centrifugation of NAYA solutions, centrifuging Syn solutions revealed molecular association and a progressive exposure of protein tyrosyl groups to water. Thus, we can also infer that shear stress conditions in the Syn solutions cause the protein tyrosyl groups to not intervene in the protein aggregation.
1. Introduction
α-Synuclein (Syn) aggregation is implicated in a range of neurodegenerative diseases, including Parkinson’s disease, multiple system atrophy, and dementia with Lewy bodies [1,2,3]. There are a large number of triggers that potentiate the aggregation of this disordered protein [4] and even its solutions are affected by several factors [5], which make it difficult to control this protein in solution studies. Furthermore, it has been suggested that tyrosine (Tyr, Y) residues of Syn play an important role in intermolecular interactions during the fibrillation process [6]. Due to this, the modifications of tyrosine residues through various in vivo studies have been known to affect the fibrillation propensity [7,8,9]. In particular, substitution of Tyr133 by alanine (A) resulted in the absence of fibrillation, whereas the individual Y125A and Y136A mutants showed limited inhibition [8]. Replacement of Tyr39 by alanine also resulted in substantial inhibition of fibrillation [8]. It was recently reported that Syn tyrosyl groups, in the Syn molecular structure, establish very early intermolecular interactions most probably with aspartates and glutamates protein residues and that the intermolecular interactions’ strength varies with the solution pH as well as with the concentration of the protein in solution [10]. Herein, NAYA solutions were investigated using UV absorption spectroscopy. NAYA, being a small molecule, was found to develop in its structure an intramolecular interaction, involving the tyrosyl group and the peptide bond. Both NAYA and Syn protein solutions were investigated under shear stress conditions by using membrane centrifugal filters with different cut-off of 200 nm, 100 kDa, 50 kDa and 30 kDa, under centrifugation conditions. For NAYA and Syn, under shear stress conditions the decrease in the intramolecular contacts established between the tyrosyl group and the peptide bond was observed. Furthermore, in particular, molecular association was observed when centrifuging Syn solutions, and a progressive exposure of the protein tyrosyl groups to a more hydrophilic environment was noted. Overall, shear stress promotes Syn aggregation by developing a less strained protein backbone and protein tyrosyl groups also appear to progressively sense a more hydrophilic environment and, therefore, they do not seem to be involved in the Syn aggregation [11].
2. Materials and Methods
2.1. Materials
All chemicals, including the compound Nα-acetyl-L-tyrosinamide (NAYA), were of analytical grade and obtained from Sigma-Aldrich, St. Louis, MO, USA.
2.2. α-Synuclein Expression and Purification
The pT7-7 plasmid containing the human Syn sequence (kindly provided by Professor Doctor T. Outeiro, IMM, University of Lisbon) was used to overexpress Syn in Escherichia coli BL21 (DE3) bacteria. Syn was purified as previously described [10,12,13]. Briefly, Syn was purified by boiling the cell homogenate, which precipitates most cellular proteins, leaving Syn as the major component of the soluble fraction [14]. This boiled lysate was loaded onto an anion-exchange column (Q-Sepharose, Pharmacia), and Syn eluted with NaCl (0–1 M gradient, Syn eluted at approximately 0.3 M). The selected fractions were pooled and further purified by size-exclusion chromatography (Superdex 75, Pharmacia). The desired fractions were once again pooled and reduced until a certain concentration and then dialyzed against water overnight. The final dialyzed solution was lyophilized and stored at −80 °C until use. Protein purity was assessed by 13% SDS-PAGE gels in the presence of 2-mercaptoethanol (denaturing gels) and the fractions resulting from both anion-exchange and size exclusion chromatographic procedures revealed one band at 18 kDa [15] (for more details, please see the Supplementary Materials (SM)).
2.3. Centrifugal Filtration of NAYA and of α-Synuclein Protein Samples
The NAYA compound or the lyophilized Syn protein was normally dissolved in 1 mL of tris-HCl buffer (10 mM, pH 7) and the resulting solution was centrifuged at 4 °C in order to remove possible high molecular weight aggregates (such as the Syn protein) [16] by using Sartorius (Vivaspin 2) centrifugal filters—cut-off of 200 nm, 100 kDa, 50 kDa and 30 kDa. All centrifugal filters were pre-washed with tris-HCl buffer (10 mM, pH 7). The centrifugation was monitored so that most of the sample was in the filtrate and the retained volume was minimal. After this procedure, the concentration of NAYA or of Syn was determined spectrophotometrically by employing the molar absorption coefficients of 1490 M−1 cm−1 at 275 nm or 5974 M−1 cm−1 at 275 nm, respectively (for NAYA—6.704 mL mg−1 cm−1 and a molecular weight of 222.24 gmol−1 and for Syn—0.413 mL mg−1 cm−1 and a molecular weight of 14,460 Da).
2.4. Spectroscopic Methods
2.4.1. UV Absorption
Ultraviolet absorption spectra were measured using a Beckman DU-70 or an Agilent Cary 8454 UV-Visible spectrophotometers. Quartz fused cells with 5 mm or with 10 mm light path were used and all spectra were acquired after appropriate solvent background subtraction [10,12].
2.4.2. Dynamic Light Scattering (DLS)
Particle diffusion coefficients were measured by DLS using a Zetasizer Nano ZS instrument (He-Ne red laser (633 nm), Malvern Instruments). The apparatus is equipped with a temperature-controlled quartz Suprasil measurement cell, an automatic laser attenuator, and an avalanche photodiode detector. The position of the latter is located 173° relative to the laser source, which ensures backscattering detection. Experiments were driven by the Dispersion Technology software from Malvern Instruments. Particle diffusion coefficients were derived from analysis of the obtained intensity autocorrelation function. The corresponding polymodal (intensity-based) distributions in the (hydrodynamic) size of equivalent hard spheres were evaluated on the basis of the Stokes–Einstein equation. The protein concentration of 33.5 µM (A275nm = 0.2) at solution pH 7 was optimized for DLS experiments [10,13], in order to ensure that the instrument count rates were in the interval of 200–500 kcps (kilo counts per second). All the material used was carefully cleaned and manipulated to avoid dust particles as well as solutions of the buffer and diluted HCl that were previously filtered using 0.22 μm pore filters. 1 mL of protein solutions in 10 mM tris-HCl with a protein concentration of 33.5 μM at pH 7 (prepared with ultrapure Milli-Q water) was transferred to a quartz cuvette (Hellma Analytics—QS 10.00 mm) and experiments were performed at 20.0 °C. Protein solution pH was adjusted before measurement.
2.4.3. Fluorescence Emission Spectroscopy
The intrinsic fluorescence emission was recorded using a SPEX Fluorolog 212I spectrofluorometer. The excitation monochromator was set at 275 nm and the emitted light collected at 305 nm. Fluorescence cuvettes with 5 mm were used and time scans of 1000 s were collected in S/R mode [12].
3. Results and Discussion
Before the UV absorption spectra can be presented for Syn solutions, under centrifugation conditions, it becomes necessary to analyze the UV absorption spectra obtained for the Nα-acetyl-L-tyrosinamide (NAYA) parent compound for NAYA solutions, under the same centrifugation conditions. NAYA is a small molecule (MW = 222.24 gmol−1) when compared to the Syn protein (14,460 Da), but NAYA mimics the peptide bond of proteins and possesses a tyrosyl group similarly to the tyrosyl groups, found in the Syn protein molecular structure. In Figure 1A the UV absorption spectra for the NAYA compound is presented, revealing the aromatic and the peptide bond bands, when increasing the NAYA concentration in solution. It is clear from this figure that both tyrosine bands with maximums at 275 and at ca. 223 nm increased their absorbance when increasing the NAYA compound concentration. Notoriously, the bands corresponding to the peptide bond and to the tyrosyl group with maximum absorption at ca. 223 nm present a small shift of the maximum of their absorption towards longer wavelengths for the same solution conditions (Figure 1A). The shift towards longer wavelengths in UV spectra in aqueous solutions with variations of the solution concentration has been recently noticed [17]. The authors observed such a phenomenon and concluded that the shift towards longer wavelengths of the UV spectrum makes the concentration and absorbance deviate from Lambert-Beer’s law [17]. It appeared that NAYA in aqueous solution presents irregularity of the electronic transition due to the absorption of UV light. Fortunately, the NAYA concentrations employed here were low and the corresponding concentration range used was small (6.71 × 10⁻⁵ M to 3.36 × 10⁻⁴ M), in comparison to the concentrations used in the above mentioned study [17]. This situation retrieves the small shift observed towards longer wavelengths (of few nanometers) for the absorption bands in the far UV absorption spectra (Figure 1A) and, therefore, minimizes the impact of the referred effects related to the variations of the NAYA concentration in the UV absorption spectra and in the corresponding quantitative analysis that was performed (Figure 1B,C). Moreover, in Figure 1B it can be seen that both the peptide bond and the tyrosine bands absorbance variations are linear but the variation of the peptide bond absorbance maximum is less pronounced in comparison to that of the tyrosyl group absorbance maximum at ca. 223 nm. This can be due to some influence of the tyrosine absorption in the absorption of the peptide bond with increasing the NAYA concentration. It is worth noting that since at 205 nm the molar extinction coefficient of the tyrosyl group (8500 M−1 cm−1) [18] is much higher than that of the peptide bond (2780 M−1 cm−1) [19], increased absorbance at ca. 223 nm should be expected for the tyrosyl group where the maximum appears when compared to the absorbance at ca. 205 nm related to the peptide bond. In fact, it can be seen in Figure 1B that both the tyrosyl group and the peptide bond showed roughly similar absorbance when the absorbance of the NAYA parent compound at 275 nm is ca. 0.4 (2.69 × 10⁻⁴ M). This can indeed be accounted for some influence of the tyrosyl group absorption in the absorption of the peptide bond in the NAYA compound, as mentioned before. In Figure 1C, the determined areas of the absorption bands corresponding to the partially resolved peptide bond and the tyrosyl group with maximum absorption at 275 nm are presented as a function of the NAYA concentration in solution. A correlation between the area of the absorption of the tyrosyl group band with a maximum at 275 nm and the area of the absorption of the partially resolved peptide bond band, when increasing the NAYA concentration, exists (Figure 1C); thus meaning that there is evidence for the formation of an intramolecular interaction between the NAYA tyrosyl group and the NAYA peptide bond, for NAYA solutions in the aqueous buffer 10 mM tris-HCl (pH 7).
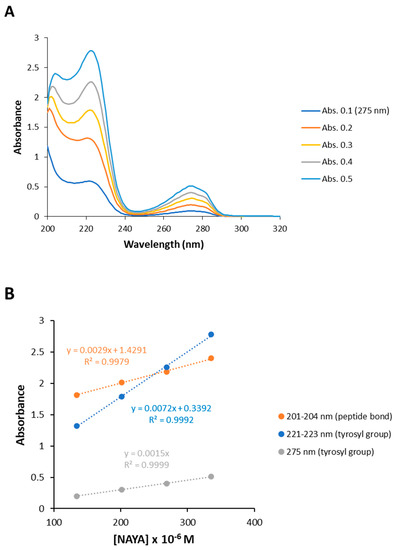
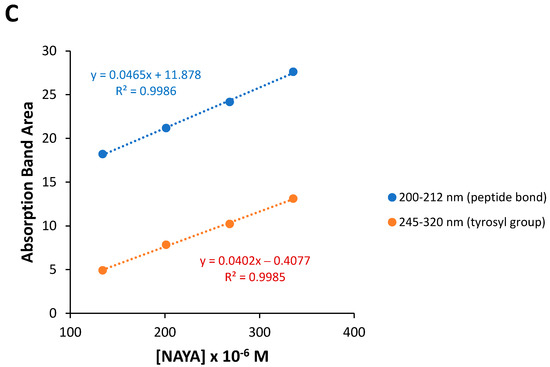
Figure 1.
(A) UV absorption spectra of the NAYA compound when increasing its concentration in solution (10 mM tris-HCl, pH 7). (B) Representation of the variations of the peptide bond band and of the tyrosyl group bands absorbance maximums as a function of the NAYA concentration (10 mM tris-HCl, pH 7). (C) Absorption band area determined for the partially resolved peptide bond and for the tyrosyl group bands (bands shown in the UV absorption spectra displayed in (A)) as a function of the NAYA concentration (10 mM tris-HCl, pH 7).
When centrifuging NAYA solutions, a UV spectral perturbation at 290–320 nm occurs, i.e., in the NAYA tyrosyl group absorption band with the maximum at 275 nm (Figure 2A). This UV spectral perturbation occurs, particularly when membrane centrifugal filters with 100 kDa, 50 kDa and 30 kDa cut-off are used, under centrifugation conditions (Figure 2A). It might be the case that, when using the referred membrane centrifugal filters with smaller pore size, the strained intramolecular interaction between the NAYA tyrosyl group and the NAYA peptide bond become evidenced. Further inspection of Figure 2A revealed that the UV spectral perturbation at 290–320 nm decreases when decreasing the membrane centrifugal filters pore size used. This indicates the progressive disruption of the intramolecular contacts in the NAYA molecular structure. Although no NAYA molecular association is expected to occur. In Figure 2B, the normalized far UV absorption spectra of NAYA compound solutions by using membrane centrifugal filters with the cut-off of 200 nm, 100 kDa, 50 kDa and 30 kDa, under centrifugation conditions, is shown. These normalized far UV spectra revealed a quasi-imperceptible blue shift (<1 nm) of the peptide bond when the NAYA compound solutions were submitted to the referred membrane centrifugal filters with decreasing cut-off. For comparative purposes, in Figure 2C the far UV absorption spectra for the NAYA compound aqueous solutions containing the 1,4-dioxane (Dx) nonpolar aprotic and water miscible compound are shown. In the latter representation, it was not possible to normalize the absorbance values at 205 nm or so, i.e., corresponding to the peptide bond absorption, due to the high absorption at the referred wavelengths but, it can still be inferred that when decreasing the Dx content (% v/v), the partial absorption band presents a blue shift (Figure 2C). Meaning, the quasi-imperceptible blue shift observed in Figure 2B indicates that the peptide bond in the NAYA compound is sensing a more polar environment when NAYA solutions are subjected to membrane centrifugal filters with decreasing cut-off. This is in agreement with the progressive disruption of the intramolecular interactions between the NAYA tyrosyl group and the NAYA peptide bond. In Figure 2D, the calculated absorbance of different spectra of the UV spectra presented in Figure 2A is represented, when several membrane centrifugal filters of 200 nm, 100 kDa, 50 kDa and 30 kDa cut-off were used, in comparison to when no membrane centrifugal filters were used. Inspection of Figure 2D reveals bands with maximums at ca. 291 nm.
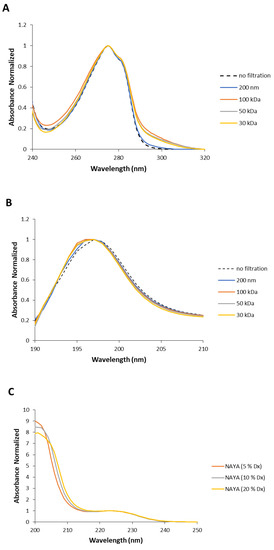
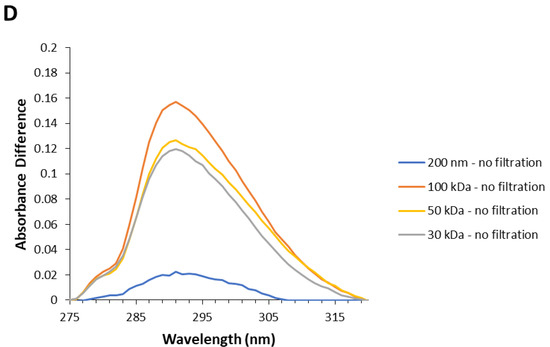
Figure 2.
(A) Normalized UV absorption spectra of NAYA compound solutions (10 mM tris-HCl, pH 7) with no filtration and subjected to membrane centrifugal filters with different cut-off (200 nm, 100 kDa, 50 kDa and 30 kDa). In the latter representation, the NAYA solutions possessed optical densities at 275 nm of ca. 0.1. (B) Normalized far UV absorption spectra of the NAYA compound solutions (10 mM tris-HCl, pH 7) with no filtration and subjected to membrane centrifugal filters with different cut-off (200 nm, 100 kDa, 50 kDa and 30 kDa). In the latter representation, the NAYA solutions possessed optical densities at 275 nm of ca. 0.1. (C) Normalized far UV absorption spectra of NAYA aqueous solutions containing 1,4-dioxane (Dx) (% v/v). In this representation, NAYA solutions possessed optical densities at 275 nm of ca. 0.1. (D) Calculated absorption difference spectra of NAYA solutions referred to in (A).
Understanding the UV absorption spectral characteristics of NAYA solutions with no filtration and with filtration using membrane centrifugal filters with different cut-off enabled us to discuss UV absorption spectral characteristics of Syn solutions, under the same conditions. In Figure 3A the normalized UV absorption spectra for Syn solutions prepared with no filtration and with centrifugal filtration using membrane centrifugal filters with different cut-off of 200 nm, 100 kDa, 50 kDa and 30 kDa, are represented. The UV absorption spectra of Syn solutions submitted to centrifugation were collected at 5 min after centrifugation. It is clear from Figure 3A that a spectral perturbation arises at ca. 290–340 nm, which resembles the spectral perturbation observed for the NAYA compound (Figure 2A). Another aspect is the fact that increased light scattering was noted in the Syn solution when no filtration was performed, in comparison to what was observed when the protein solutions were submitted to the mentioned centrifugation procedure (Figure 3A). The UV absorption spectra in Figure 3A is intriguing and it means that UV absorption spectroscopy of Syn solutions, as also observed for NAYA solutions, can be used to identify and to determine the nature of Syn protein tyrosyl groups interactions. Nevertheless, it cannot distinguish a priori in the Syn molecular structure which protein tyrosyl groups participate in such contacts. The normalized UV absorption spectra in Figure 3A are from Syn solutions with a similar and high optical density at 275 nm, of ca. 0.7. In Figure 3B, the normalized far UV absorption spectra for the same solutions presented in Figure 3A are shown. Still referring to Figure 3B, two overlapping bands with maximums at ca. 205 and ca. 223 nm, corresponding to the peptide bond absorption and tyrosyl group absorption bands, respectively, can be seen [10]. In fact, in Figure 3B it can be observed that both the tyrosyl group and the peptide bond showed roughly similar absorbance, which can be accounted for by some influence of the tyrosyl group absorption in the absorption of the peptide bond, in the Syn protein molecular structure. Therefore, it is of note that some influence of the protein tyrosyl groups absorption in the absorption of the protein peptide bond arises when the protein solutions are submitted to the centrifugation procedure by using membrane centrifugal filters with 200 nm, 100 kDa and 50 kDa cut-off, but not when the membrane centrifugal filter with the 30 kDa cut-off is used (Figure 3B). This result is intriguing, and it affords for the fact that there is minor or no influence of protein tyrosyl groups absorption in the absorption of the peptide bond in this latter situation. It deserves, therefore, to be said that negligible or no interactions are established with protein tyrosyl groups when the membrane centrifugal filter with the 30 kDa cut-off is used. To note that Syn monomeric protein has a molecular weight of about 14.46 kDa and, therefore, below the membrane centrifugal filters cut-off used in this study. In Figure 3C, the normalized UV absorption spectra of Syn solutions are shown, similarly as presented in Figure 3A, but the Syn solutions have here similar and low optical densities at 275 nm, of ca. 0.1. The normalized UV absorption spectra are, in general, similar to those presented in Figure 3A with the exception of the appearance of a tail in Figure 3C when the membrane centrifugal filter with the 100 kDa cut-off is used. In Figure 3D the far UV absorption spectra for the same solutions depicted in Figure 3D are presented and similar conclusions can be drawn as referred to above for Figure 3B. That is, there is minor or no influence of the absorption of protein tyrosyl groups in the absorption of the peptide bond in the Syn protein solution when the membrane centrifugal filter with the 30 kDa cut-off is used. Since it was previously referred to, the establishment of interactions between Syn protein tyrosyl groups with protein peptide bonds formed can lead us to infer that minor or no formation of interactions with the Syn protein tyrosyl groups with peptide bonds occur when Syn solutions are subjected to membrane centrifugal filters with the 30 kDa cut-off. In Figure 3E–G, the calculated difference spectra for Syn solutions using as reference the membrane centrifugal filter with the 200 nm cut-off are presented. In these figures, it can be seen that the amplitude of the calculated difference spectra with a maximum at ca. 291 nm reveals a decrease in the relation of the amplitudes from a more concentrated to a more diluted Syn solution when the membrane centrifugal filters cut-off is decreased. This result is intriguing and, for example, the calculated difference spectra 100 kDa − 200 nm shows a higher amplitude for a more diluted Syn solution when compared to what occurs for a more concentrated Syn solution (Figure 3E), which retrieves an increase in the intramolecular interactions between Syn peptide bonds and Syn tyrosyl groups. This was expected in accordance with the rationalization made for the NAYA compound, in 10 mM tris-HCl (pH 7). Nevertheless, the calculated difference spectra 30 kDa − 200 nm shows, instead, lower amplitude for a more diluted Syn solution when compared to a more concentrated Syn solution (Figure 3G). Meaning, there is a decrease in the intramolecular interactions between Syn peptide bonds and Syn tyrosyl groups. This was not to be expected in accordance with the above rationalization made for the NAYA compound, in 10 mM tris-HCl (pH 7). It appears that the phenomenon occurring in the Syn solutions is different from that predicted for NAYA solutions in 10 mM tris-HCl (pH 7), under stress induced conditions. It is worth mentioning that the above referred increase in the amplitude of the absorbance difference normalized occurred for longer wavelengths (less energetic) of the UV absorption difference spectra (ca. 320 nm to ca. 360 nm) (Figure 3G). This could mean that the “less energetic” phenomenon represents the display of long-range dynamics of the Syn tyrosyl groups. Thus, the occurrence of long-range contacts for the Syn tyrosyl groups is expected for a more concentrated protein solution and for the lowest membrane centrifugal filters used, under centrifugation conditions. The abovementioned phenomenon is one part of the scenario. The other part of the scenario is the “more energetic” phenomenon that could be the result of short-range dynamics of Syn tyrosyl groups, i.e., for lower wavelengths of the UV absorption difference spectra (ca. 291 nm to ca. 320 nm) (Figure 3G). In fact, in Figure 3G there is an overlap of the UV absorption difference spectra in the latter wavelength region mentioned, i.e., for more concentrated and for more diluted Syn solutions. This could mean that the established short-range contacts of Syn tyrosyl groups possess similar energetics, i.e., in a more concentrated and in a more diluted Syn solution, while there is significant disruption of intramolecular interactions between Syn tyrosyl groups and Syn peptide bonds in a more concentrated Syn solution, in particular. Therefore, the protein backbone energetics are comparable in both Syn solutions and the result is the formation of a simply less strained protein backbone, when Syn solutions are more concentrated, experimenting higher shear stress and, consequently, becoming more aggregated. We further decided to perform dynamic light scattering (DLS) analysis of Syn solutions in order to verify the actual state of the Syn solutions subjected to centrifugation using different membrane centrifugal filters with different cut-off.
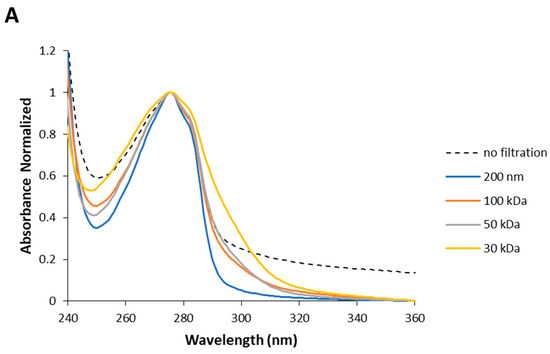
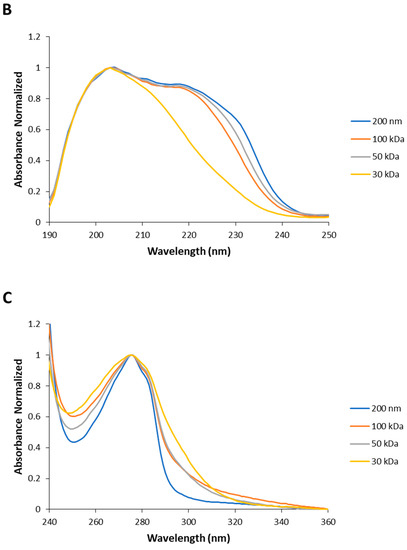
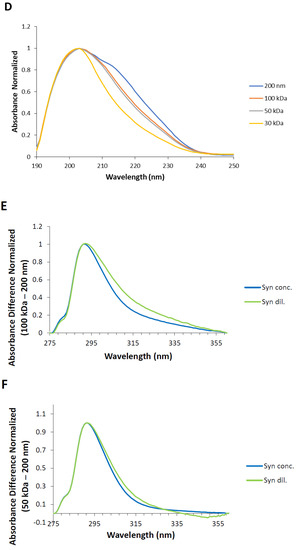
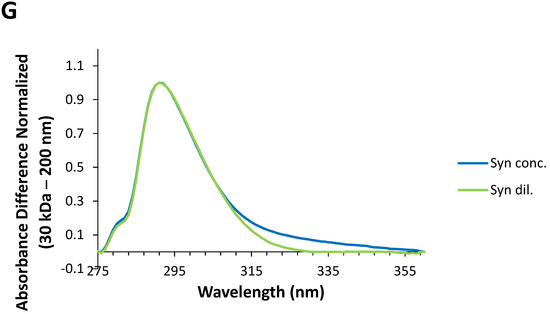
Figure 3.
(A,C) Normalized UV absorption spectra of Syn solutions (10 mM tris-HCl, pH 7) with no filtration by centrifugation and with centrifugal filtration using different membrane centrifugal filters with different cut-off of 200 nm, 100 kDa, 50 kDa and 30 kDa. (B,D) Normalized far UV absorption spectra of Syn solutions (10 mM tris-HCl, pH 7) submitted to filtration by centrifugation using different membrane centrifugal filters with different cut-off of 200 nm, 100 kDa, 50 kDa and 30 kDa. (E–G) Calculated difference spectra from the UV absorption spectra shown in (A,C). The mentioned UV absorption spectra were collected 5 min after filtration by centrifugation. For more information regarding this figure legend, please see the text.
In Figure 4A, the normalized volume distributions obtained by DLS for Syn solutions subjected to centrifugation using membrane centrifugal filters with 200 nm, 100 kDa, 50 kDa and 30 kDa cut-off as a function of the particle diameter (nm) are shown. From this figure it can be seen that the monomeric Syn protein populates the solutions and also that the normalized volume distribution is displaced towards lower sizes when decreasing the membrane centrifugal filters cut-off. This latter phenomenon has been observed in protein samples that can display interparticle and particle-solvent interactions that can cause substantial distortion in the apparent diffusion coefficients determined by DLS and hence affect the calculated hydrodynamic size [20]. These inter-protein and protein-solvent interactions are electrostatic interactions, sometimes referred to as virial effects [20]. The reduction in the particle size has been typically observed for high protein concentrations. Therefore, this means that when lowering the membrane centrifugal filters cut-off, by an increase in interactions among Syn protein monomers, leads to an increase in established intermolecular interactions (Figure 4A). In Figure 4B the volume peak area determined as a function of the membrane centrifugal filters pore size (nm) is shown [21]. From this figure, lowering the amount of the available Syn monomer species can be inferred when reducing the membrane centrifugal filters cut-off. In other words, when reducing the membrane centrifugal filters cut-off there is stress-induced in Syn protein solutions that can favor the Syn monomer species association, being also responsible for reducing the amount of the available Syn monomer species in solution (Figure 4B). Nevertheless, it should also be emphasized that accordingly to DLS measurements, we estimate the occurrence of a very low aggregation for the Syn protein and, therefore, Syn aggregated species numbers are <0.01% of the Syn species total population (mostly protein monomers).
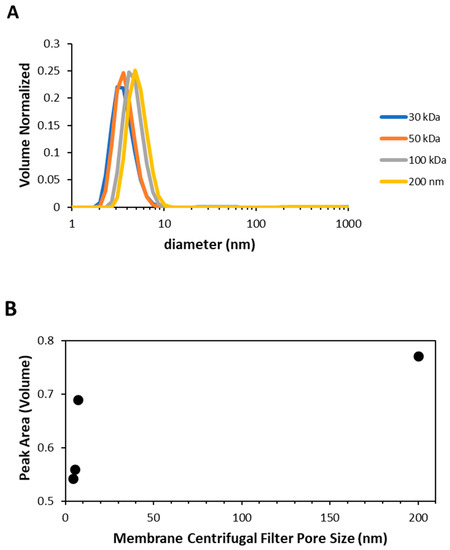
Figure 4.
(A) Average of normalized volume distributions obtained by DLS (measurements obtained during the first ca. 30 min, N ≥ 4) as a function of the particle size (nm) for Syn solutions subjected to centrifugation using membrane centrifugal filters with the 200 nm, 100 kDa, 50 kDa and 30 kDa cut-off. (B) Volume peak area obtained from the volume distributions in (A) as a function of the membrane centrifugal filters pore size (nm) [21].
Overall, for Syn solutions, in 10 mM tris-HCl (pH 7), a decrease in the formation of intramolecular interactions and an increase in the formation of intermolecular interactions when reducing the membrane centrifugal filters pore size, under centrifugation conditions (Figure 3E–G), has been proposed. The centrifugation of NAYA solutions (in 10 mM tris-HCl, pH 7) did not seem to alter the type of the interactions formed.
It deserves mentioning that the paradigm that emerges from most studies is that shear in the fluid mechanical sense is unlikely to damage most proteins by itself and that interfacial phenomena are critically important. Nevertheless, in the case of Syn, it is very likely that distortion of Syn species results, while the protein solutions go through the membrane centrifugal filters pores. Concerning the abovementioned interfacial phenomena, Syn is a disordered protein that is mostly exposed to the solvent and that can readily interact in the hydrophobic air/liquid interface, under agitation or under shear stress-imputed conditions such as those occurring during centrifugation. In our study, the gas phase of the Syn solutions was maintained constant by 50%, under centrifugation conditions. Additionally, the centrifugation parameters were roughly the same for the centrifuged protein solutions. Meaning, we are not expecting other phenomenon, besides Syn species distortion in the membrane centrifugal filters pores, to occur during centrifugation. It should be emphasized that very low Syn aggregation was observed during centrifugation of protein solutions. By DLS, the Syn aggregated species have numbers <0.01% of the Syn species total population. Furthermore, UV absorption spectroscopy was revealed to be sensitive to this very low Syn aggregation detected, which was referred to. Due to the very low amounts of Syn aggregated species, we can infer that the equilibrium conditions of the present system were not much affected.
The UV absorption spectral characterization of Syn solutions submitted to stress-induced conditions by using centrifugal filters with the decrease in their cut-off, under centrifugation conditions, revealed a spectra perturbation that was linked to the disruption of intramolecular interactions between protein tyrosyl groups and protein peptide bonds. Moreover, the concomitant increase in Syn intermolecular interactions with the decrease in the membrane centrifugal filters pore size was predicted. In order to determine the Syn tyrosyl groups exposure in such developed protein intermolecular interactions, we decided to record the first 1000 s of the Syn aggregation reaction at pH 7, by determining the intrinsic fluorescence intensity (FI) variations of the Syn solutions (Figure 5). The Syn protein contains four tyrosine residues (Y39, Y125, Y133 and Y136) and no tryptophan residue and the collected fluorescence intensity in the Syn protein should reflect the environment that the protein tyrosine residues display in the experiment. As such, if a protein tyrosine residue or protein tyrosine residues experience a more hydrophobic environment, an increase in the fluorescence quantum yield should be expected [22]. Contrary to tyrosine absorption, which is influenced by the polarity of the solvent, the fluorescence of tyrosine does not depend on the polarity of the solvent and just an increase in the fluorescence intensity is observed, as mentioned in [22]. In Figure 5, an increase in the fluorescence intensity of the Syn solutions subjected to centrifugation was noticed with increasing the membrane centrifugal filter pore size. This observation affords for the fact that with decreasing the membrane centrifugal filters pore size, there is an increase in the Syn tyrosyl groups exposure to a more hydrophilic environment.
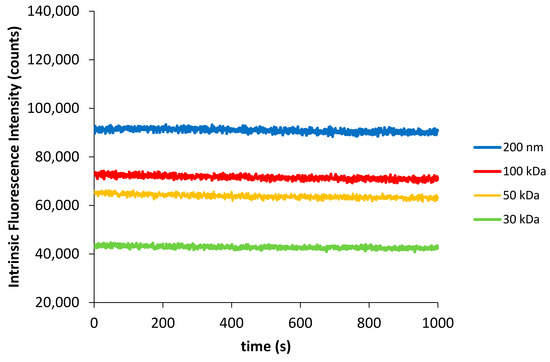
Figure 5.
Protein intrinsic fluorescence intensity (λexcitation = 275 nm and λemission = 305 nm) as a function of time for 33.5 µM Syn solutions (A275nm = 0.2) (10 mM tris-HCl) subjected to centrifugation with different membrane centrifugal filters with cut-off of 200 nm, 100 kDa, 50 kDa and 30 kDa, at pH 7. Intrinsic fluorescence intensity traces were performed in duplicate.
4. Conclusions
It was here determined that UV absorption spectroscopy, the corresponding calculated difference spectra and far UV absorption spectroscopy can be valuable tools for assessing information concerning the identification and stability of NAYA and Syn protein interactions. Evidence was here provided that NAYA, in 10 mM tris-HCl (pH 7), forms an intramolecular interaction between the NAYA tyrosyl group and the NAYA peptide bond. The centrifugation of NAYA solutions did not seem to alter the type of interactions formed. The centrifugation of Syn solutions seems to alter the type of interactions formed and it is a far more complex process when compared to the NAYA solutions centrifugation. The above mentioned protein interactions are also affected by the membrane centrifugal filters pore size used. When membrane centrifugal filters with smaller pore size are used, the formation of protein intermolecular interactions prevails over the formation of intramolecular interactions. This was due to the increase in Syn protein aggregation when using membrane centrifugal filters with smaller pore size, as confirmed by DLS results. Furthermore, the Syn interactions developed when using membrane centrifugal filters with smaller pore size indicate the increase exposure of protein tyrosyl groups to a more hydrophilic environment. In summary, shear stress conditions in Syn solutions contribute to the development of a less strained protein backbone upon protein aggregation and, moreover, the progressive watery exposed tyrosyl groups seem not to intervene in the referred aggregation process.
Supplementary Materials
The following supporting information can be downloaded at: https://www.mdpi.com/article/10.3390/app12073546/s1, Figure S1: Some of the collected fractions were applied to a SDS-PAGE (13% acrylamide) (denaturing conditions) (A) from anion-exchange chromatography and (B) from size exclusion chromatography. α-Synuclein appeared as a band at ca. 18 kDa, Figure S2: Original size exclusion chromatogram obtained of α-synuclein samples, after anion-exchange chromatography.
Author Contributions
Conceptualization, M.A.S. and M.H.F.; analysis, M.A.S.; investigation, M.A.S.; writing—original draft preparation, M.A.S. and M.H.F.; writing—review and editing, M.A.S. and M.H.F.; supervision, M.H.F.; funding acquisition, M.A.S. and M.H.F. All authors have read and agreed to the published version of the manuscript.
Funding
Post-doc grant SFRH/BPD/37016/2007, Strategic Project MARE:UIDB/04292/2020 and Portuguese Mass Spectrometry Network (LISBOA-01-0145-FEDER-022125).
Institutional Review Board Statement
Not applicable.
Informed Consent Statement
Not applicable.
Data Availability Statement
Data sharing not applicable.
Acknowledgments
We acknowledge Helena Santos lab (ITQB, UNL) for the expression and purification of the amyloid Syn protein. Marco A. Saraiva also acknowledges the FCT (Portugal) for the post-doc grant SFRH/BPD/37016/2007. We also acknowledge the support from the Strategic Project MARE:UIDB/04292/2020 and from the Portuguese Mass Spectrometry Network (LISBOA-01-0145-FEDER-022125).
Conflicts of Interest
The authors declare no conflict of interest.
References
- Stefanis, L. α-Synuclein in Parkinson’s disease. Cold Spring Harb. Perspect. Med. 2012, 2, a009399. [Google Scholar] [CrossRef] [Green Version]
- Prusiner, S.B.; Woerman, A.L.; Mordes, D.A.; Watts, J.C.; Rampersaud, R.; Berry, D.B.; Patel, S.; Oehler, A.; Lowe, J.K.; Kravitz, S.N.; et al. Evidence for α-synuclein prions causing multiple system atrophy in humans with parkinsonism. Proc. Natl. Acad. Sci. USA 2015, 112, E5308–E5317. [Google Scholar] [CrossRef] [Green Version]
- Spillantini, M.G.; Schmidt, M.L.; Lee, V.M.-Y.; Trojanowski, J.Q.; Jakes, R.; Goedert, M. α-Synuclein in Lewy bodies. Nature 1997, 388, 839–840. [Google Scholar] [CrossRef]
- Narkiewicz, J.; Giachin, G.; Legname, G. In vitro aggregation assays for the characterization of α-synuclein prion-like properties. Prion 2014, 8, 19–32. [Google Scholar] [CrossRef] [Green Version]
- Buell, A.K.; Galvagnion, C.; Gaspar, R.; Sparr, E.; Vendruscolo, M.; Knowles, T.P.J.; Linse, S.; Dobson, C.M. Solution conditions determine the relative importance of nucleation and growth processes in α-synuclein aggregation. Proc. Natl. Acad. Sci. USA 2014, 111, 7671–7676. [Google Scholar] [CrossRef] [Green Version]
- Izawa, Y.; Tateno, H.; Kameda, H.; Hirakawa, K.; Hato, K.; Yagi, H.; Hongo, K.; Mizobata, T.; Kawata, Y. Role of C-terminal negative charges and tyrosine residues in fibril formation of α-synuclein. Brain Behav. 2012, 2, 595–605. [Google Scholar] [CrossRef]
- Lamberto, G.R.; Binolfi, A.; Orcellet, M.L.; Bertoncini, C.W.; Zweckstetter, M.; Griesinger, C.; Fernandez, C.O. Structural and mechanistic basis behind the inhibitory interaction of PcTS on alpha-synuclein amyloid fibril formation. Proc. Natl. Acad. Sci. USA 2009, 106, 21057–21062. [Google Scholar] [CrossRef] [Green Version]
- Ulrih, N.P.; Barry, C.H.; Fink, A.L. Impact of Tyr to Ala mutations on alpha-synuclein fibrillation and structural properties. Biochim. Biophys. Acta 2008, 1782, 581–585. [Google Scholar] [CrossRef] [Green Version]
- Yamin, G.; Uversky, V.N.; Fink, A.L. Nitration inhibits fibrillation of human alpha-synuclein in vitro by formation of soluble oligomers. FEBS Lett. 2003, 542, 147–152. [Google Scholar] [CrossRef] [Green Version]
- Saraiva, M.A. Interpretation of α-synuclein UV absorption spectra in the peptide bond and the aromatic regions. J. Photochem. Photobiol. B 2020, 212, 112022. [Google Scholar] [CrossRef]
- Toprakcioglu, Z.; Challa, P.; Xu, C.; Knowles, T.P.J. Label-free analysis of protein aggregation and phase separation. ACS Nano 2019, 13, 13940–13948. [Google Scholar] [CrossRef]
- Saraiva, M.A.; Jorge, C.D.; Santos, H.; Maçanita, A.L. Earliest events in α-synuclein probed with the fluorescence of intrinsic tyrosines. J. Photochem. Photobiol. B 2016, 154, 16–23. [Google Scholar] [CrossRef]
- Saraiva, M.A. Evidence of the existence of micellar-like aggregates for α-synuclein. Int. J. Biol. Macromol. 2021, 177, 392–400. [Google Scholar] [CrossRef]
- Weinreb, P.H.; Zhen, W.; Poon, A.W.; Conway, K.A.; Lansbury, P.T., Jr. NACP, a protein implicated in Alzheimer’s disease and learning, is natively unfolded. Biochemistry 1996, 35, 13709–13715. [Google Scholar] [CrossRef]
- Surguchov, A. Molecular and cellular biology of synucleins. Int. Rev. Cell Mol. Biol. 2008, 270, 225–317. [Google Scholar]
- Faria, C.; Jorge, C.D.; Borges, N.; Tenreiro, S.; Outeiro, T.F.; Santos, H. Inhibition of formation of α-synuclein inclusions by mannosylglycerate in a yeast model of Parkinson’s disease. Biochim. Biophys. Acta 2013, 1830, 4065–4072. [Google Scholar] [CrossRef]
- Tong, A.; Tang, X.; Zhang, F.; Whang, B. Study on the shift of ultraviolet spectra in aqueous solution with variations of the solution concentration. Spectrochim. Acta A Mol. Biomol. Spectrosc. 2020, 234, 118259. [Google Scholar] [CrossRef]
- Rosenheck, K.; Doty, P. The far ultraviolet absorption spectra of polypeptide and protein solutions and their dependence on conformation. Proc. Natl. Acad. Sci. USA 1961, 47, 1775–1785. [Google Scholar] [CrossRef] [Green Version]
- Anthis, N.J.; Clore, G.M. Sequence-specific determination of protein and peptide concentrations by absorbance at 205 nm. Protein Sci. 2013, 22, 851–858. [Google Scholar] [CrossRef] [Green Version]
- Andreis, C.; Clauwaert, J. Photon correlation spectroscopy and light scattering of eye lens protein at high concentrations. Biophys. J. 1985, 47, 591–605. [Google Scholar] [CrossRef] [Green Version]
- Wilkinson, K.J.; Lead, J.R. Environmental Colloids and Particles: Behaviour, Separation and Characterisation; Wiley: Hoboken, NJ, USA, 2007; Chapter 4; p. 170. [Google Scholar]
- Noronha, M.; Lima, J.C.; Lamosa, P.; Santos, H.; Maycock, C.; Ventura, R.; Maçanita, A.L. Intramolecular fluorescence quenching of tyrosine by the peptide α-carbonyl group revisited. J. Phys. Chem. A 2004, 108, 2155–2166. [Google Scholar] [CrossRef]
Publisher’s Note: MDPI stays neutral with regard to jurisdictional claims in published maps and institutional affiliations. |
© 2022 by the authors. Licensee MDPI, Basel, Switzerland. This article is an open access article distributed under the terms and conditions of the Creative Commons Attribution (CC BY) license (https://creativecommons.org/licenses/by/4.0/).