Review

Multimode Physics in the Mode Locking of Semiconductor Quantum Dot Lasers

1
Télécom Paris, Institut Polytechnique de Paris, 19 Place Marguerite Perey, 91120 Palaiseau, France
2
Center for High Technology Materials, University of New-Mexico, Albuquerque, NM 87106, USA
3
Sandia National Laboratories, Albuquerque, NM 87185-1086, USA
4
Department of Electrical and Computer Engineering, University of California, Santa Barbara, CA 93106, USA
*
Author to whom correspondence should be addressed.
Appl. Sci. 2022, 12(7), 3504; https://doi.org/10.3390/app12073504
Submission received: 14 January 2022 / Revised: 16 March 2022 / Accepted: 23 March 2022 / Published: 30 March 2022
(This article belongs to the Special Issue Quantum Dot Lasers and Laser Dynamics)

Abstract

:
Quantum dot lasers are an attractive option for light sources in silicon photonic integrated circuits. Thanks to the three-dimensional charge carrier confinement in quantum dots, high material gain, low noise and large temperature stability can be achieved. This paper discusses, both theoretically and experimentally, the advantages of silicon-based quantum dot lasers for passive mode-locking applications. Using a frequency domain approach, i.e., with the laser electric field described in terms of a superposition of passive cavity eigenmodes, a precise quantitative description of the conditions for frequency comb and pulse train formation is supported, along with a concise explanation of the progression to mode locking via Adler’s equation. The path to transform-limited performance is discussed and compared to the experimental beat-note spectrum and mode-locked pulse generation. A theory/experiment comparison is also used to extract the experimental group velocity dispersion, which is a key obstacle to transform-limited performance. Finally, the linewidth enhancement contribution to the group velocity dispersion is investigated. For passively mode-locked quantum dot lasers directly grown on silicon, our experimental and theoretical investigations provide a self-consistent accounting of the multimode interactions giving rise to the locking mechanism, gain saturation, mode competition and carrier-induced refractive index.

1. Introduction

In recent years, the market for data center servers has been boosted by a huge increase in demand from the digitalization of data in commercial and home applications, including media and social networks. Optical interconnects play a crucial role in supporting the enormous volume of data that propagates in short- and long-haul fiber-optic networks. Presently, optical interconnect bandwidth and power consumption contribute to a bottleneck limiting further increase in transmission capacity. Dense wavelength-division multiplexing (DWDM) technologies provide a solution to increase link capacity [1]. Silicon photonic integrated circuits (PICs) based on a mature complementary metal–oxide–semiconductor (CMOS) industry is paving the way with low-cost and energy-efficient solutions [2].
DWDM requires high-performance on-chip laser sources. Mode-locked (ML) lasers producing optical frequency combs are ideal for DWDM systems owing to their small footprint and low power consumption [3,4]. Pulsed ML lasers are also highly desired for applications including optical time-division multiplexing [5], metrology [6], LIDAR systems for self-driving automobiles [7] and optical clocks for distribution and recovery in future computer processors [8].
A quantum dot (QD) medium is regarded as an important option for monolithically integrated light sources and photodiodes in silicon photonic PICs due to its improved tolerance for dislocations arising during the epitaxial growth of III–V on silicon [9,10,11]. In addition, the three-dimensional charge carrier confinement in QDs contributes to high material gain [12], low noise [13] and remarkable temperature stability [10]. Additionally, the inherently low linewidth enhancement factor is important, which results in a high degree of tolerance for chip-scale back reflections [14,15]. In terms of mode locking, a recent study revealed that QDs are beneficial for generating ultra-short ML pulses and supporting a high transmission rate over 4 Tbits/s [16]. Moreover, rich QD optical nonlinearities, specifically a high χ ( 3 ) coefficient from four-wave mixing (FWM), is found to be sufficiently strong to overcome group velocity dispersion and result in self-mode locking. A self-ML, single-section laser has a significantly smaller footprint and less electronic complexity than a typical two-section ML laser with forward- and reverse-bias sections [17]. In the near future, QD FWM may generate quantum states of light for quantum photonic integrated circuits (QPICs) [18].
On the basis of the above arguments, our experimental and theoretical studies focus on passively ML QD lasers epitaxially grown on silicon. Mode locking in both single- and multi-section diode lasers is typically described in the time domain or traveling wave domain, because it has the advantage of giving a physical picture of pulse train formation [19]. We have, instead, returned to the earlier complimentary frequency domain description [20]. There are several motivations, including a direct connection of optical nonlinearities to electronic structure via multimode semiclassical laser theory, where the quantum mechanical electron–hole polarization treats the locking mechanism, gain saturation, mode competition and carrier-induced refractive index on an equal footing [21,22]. Equally important and useful from using the frequency-based approach is that it allows a precise and physically intuitive description of the mode locking process to be made from the Adler equation perspective [23].
Section 2 describes the frequency domain approach. Three important advantages are discussed. Section 2.1 describes a precise quantitative description of the conditions for frequency comb and pulse train formation. Section 2.2 presents a concise explanation of the progression to mode locking via Adler’s equation. Section 2.3 shows the equation for the mode-locking strength derived from multimode laser theory. It allows the computation of the mode-locking coefficient with band structure properties as input parameters. Section 2.4 presents the FWM process of an epitaxial QD laser using both the simulation and the experiment. The case for another commercial quantum well (QW) laser is investigated for comparison. Section 3 discusses the path to transform the limited performance. Section 3.1 compares the experimental beat-note spectrum and mode-locked pulse to theory and to the expected ideal transform-limited result. Section 3.2 uses the theory/experiment comparison to extract the experimental group velocity dispersion, which is the key obstacle to transform-limited performance. Section 3.3 discusses the importance of the linewidth enhancement contribution to the group velocity dispersion and suggests its mitigation via QD active medium engineering.

2. Multimode Mode-Locking Approach

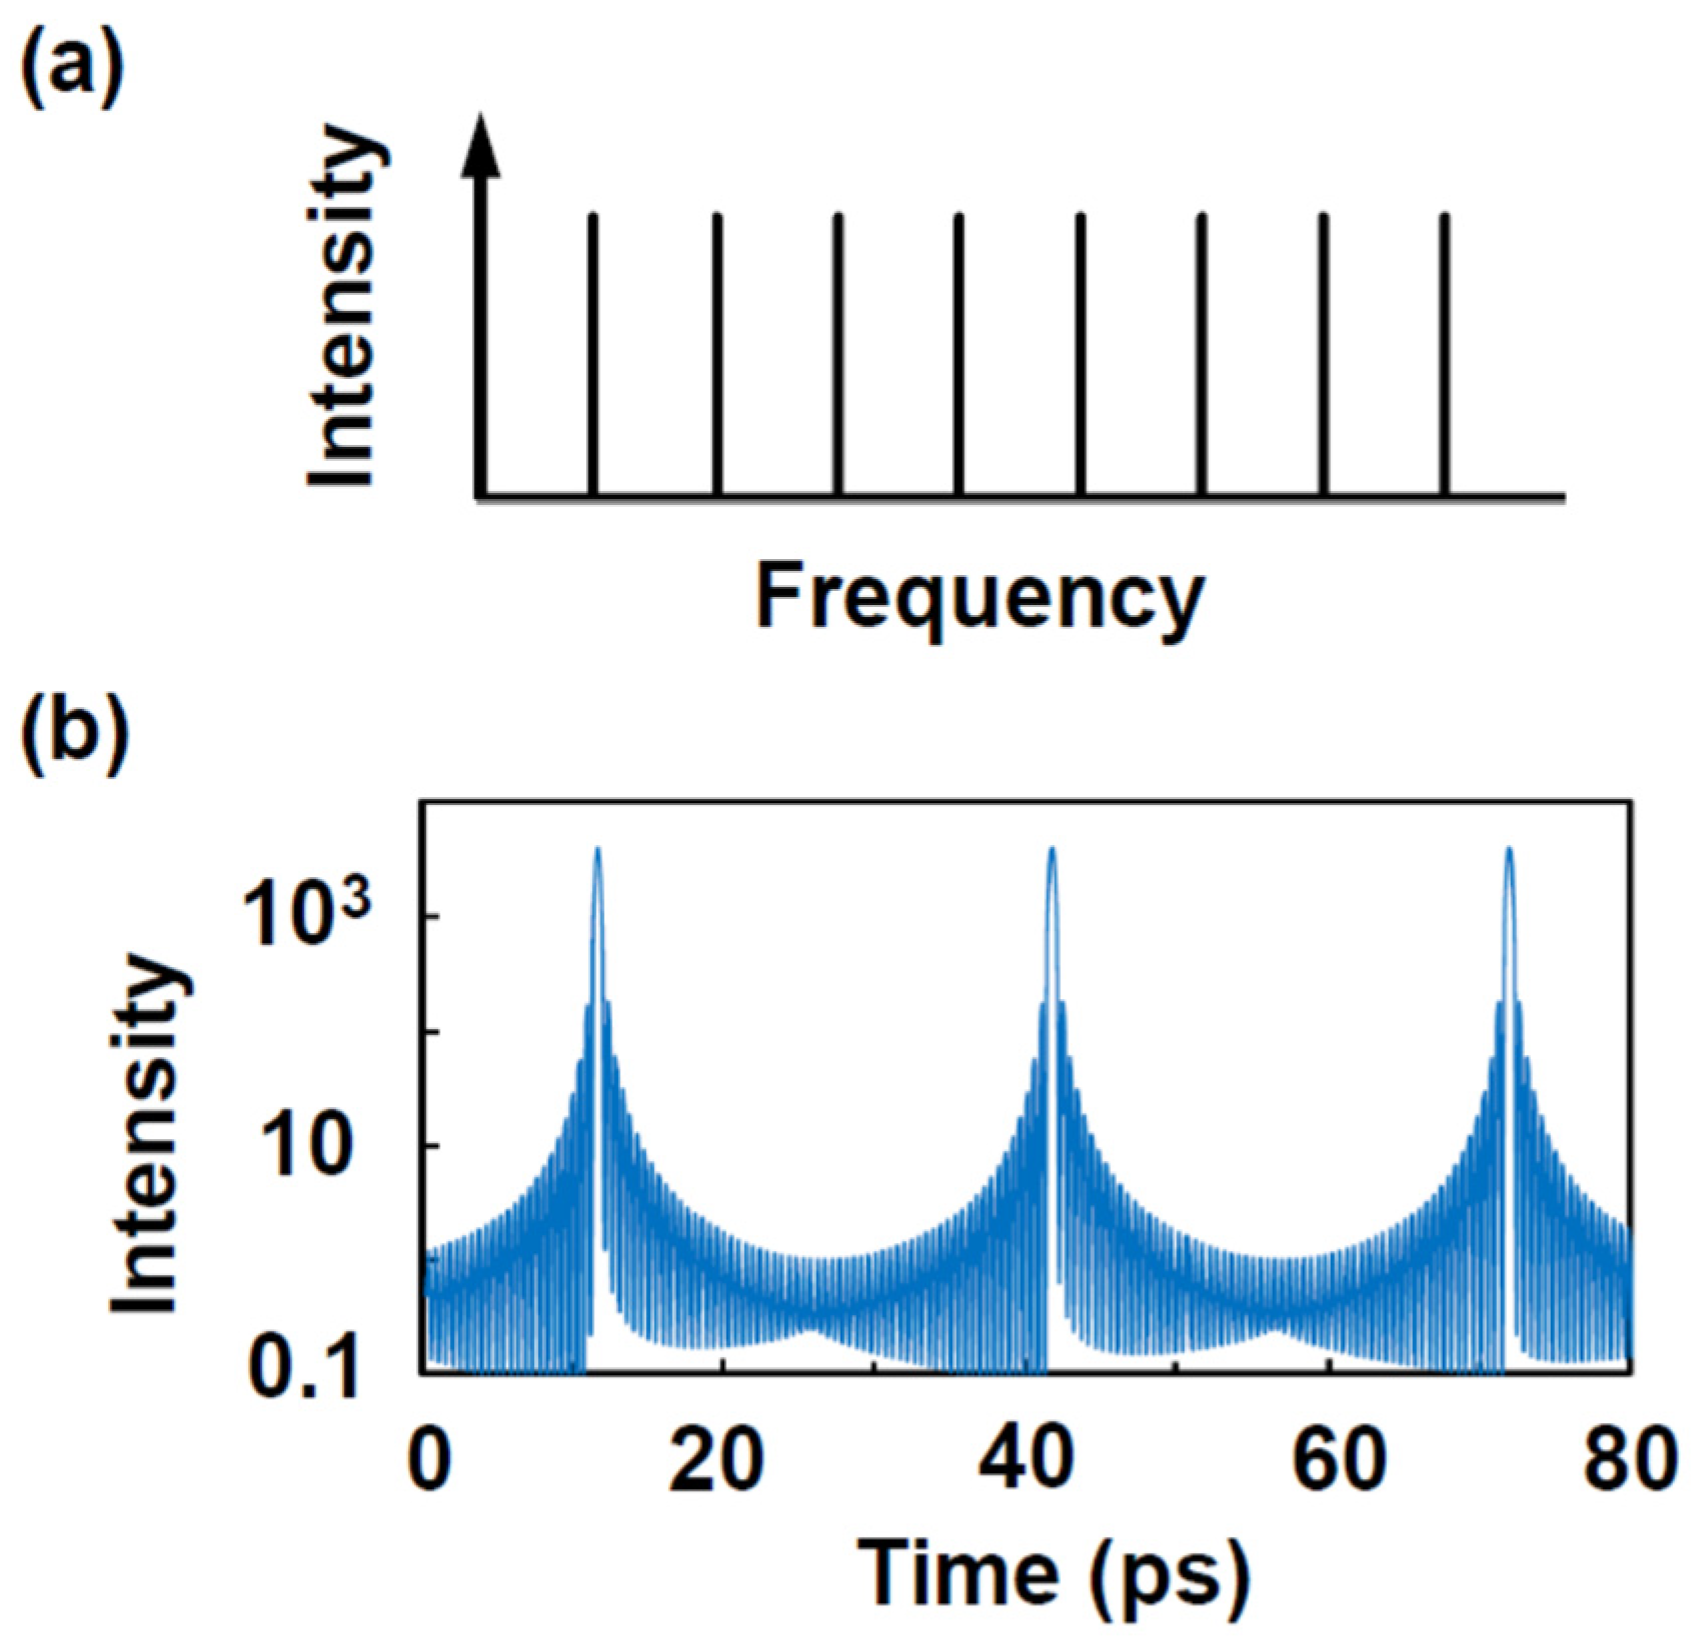
2.1. Conditions for Frequency Comb and Pulse Train Formation

For this discussion, we describe the intracavity laser field as a superposition of the passive cavity modes   u n ( z ) :
E ( z , t ) = n E n ( t ) u n ( z ) c o s [ ψ n ( t ) ]
where E n ( t ) and ψ n ( t ) are the mode amplitude and phase, and the summation is over all lasing modes. One has a frequency comb when:
ψ n ( t ) = ( ν 0 + n Δ ) t + ϕ n  
where v0 is a reference frequency, ϕ n is the time-independent part of ψ n and the frequency differences between adjacent lasing modes are equal and given by the beat-note Δ (Figure 1a). One has a mode-locked pulse train (Figure 1b) when in addition in Equation (2), and the phases are equal, i.e.,
ϕ 0 = ϕ 1 = ϕ 3 =  
Note that Equation (3) is sufficient but not necessary. The passive cavity resonance satisfies Ω m = m c / ( 2 L n B ) , where m is the mode number, c is the speed of light in vacuum, L is the cavity length and nB is the background refractive index. A useful quantity for characterizing material dispersion and for optical design is the derivative d n B / d λ n , where the wavelength λ m = 2 L / m [24]. We found from Equation (1) that a constant d n B / d λ n may also result in a transform-limited pulse train.

2.2. Progression to Mode-Locking Adler’s Equation

The mode-locking conditions in Equations (2) and (3) do not occur naturally because of group velocity dispersion experienced by the laser field. At a minimum, there are contributions from the passive waveguide material and from the carrier-induced refractive index change in the active region. A comparison of the mode spectra in Figure 2a shows the net effect of these contributions. In the upper spectrum with no dispersion, one has a frequency comb, i.e., an equal beat-note between adjacent modes. The shifts indicated in the lower spectrum with dispersion show differences in the beat-notes between adjacent modes. In this case, one has neither a frequency comb nor a mode-locked pulse train.
A concise description of the path towards mode locking comes from Adler’s equation [23]:
d ψ d t = a + b s i n ψ  
which has been very useful in studies involving frequency locking, e.g., the synchronization of clocks, the locking of lasers (both mutually and via external injection), deadband in laser gyroscopes, etc. The beauty of Equation (4) is that it contains only two parameters: a for the obstacle and b for the fix. With mode locking, d ψ / d t is the difference between two beat-notes, a is the corresponding difference due to dispersion and b is the locking coefficient.
To illustrate how Adler’s equation gives a well-defined progression towards locking, we consider three adjacent modes n = −1, 0, and 1 (see Figure 2a). When a > b, numerically integrating Equation (4) gives d ψ / d t a , with modifications from b s i n ψ , as shown by the solid curve in Figure 2b. When a < b, ψ initially increases according to ψ = a t . However, when b s i n ψ = a (which is, of course, possible only when ba), d ψ / d t = 0 . This causes ψ to remain constant and, consequently, because of Equation (4), d ψ / d t stays as zero, i.e., the system stays locked (dashed curve in Figure 2b). Without locking, the phase ψ increases constantly, as shown by the solid curve in Figure 2c. With locking, it assumes the value:
ψ = s i n 1 ( a b )  
as shown by the dashed curve in Figure 2c.
Of course, the production of a frequency comb or pulse train involves many lasing modes. Then, one has many Adler’s equations, each for the difference between two beat-notes. In practice, one tracks the phase of each lasing mode ψ n , which, from a semiclassical laser theory derivation, evolves according to ψ ˙ n = a n + m b n m s i n ( ψ n ψ m ) [21,22]. One looks for steady state solutions where the difference ψ ˙ n ψ ˙ n 1 ψ ˙ m + ψ ˙ m 1 vanishes for all combinations of n and m for a frequency comb to occur. The steady-state phase difference ψ n ψ n 1 ψ m + ψ m 1 for all combinations of n and m determines the closeness to a transform-limited mode-locked pulse performance
As an example, we can look at a simulation involving 11 lasing modes. For an, we assume only dispersion from GaAs, so that the passive cavity frequency for the mth mode is Ω m = m c / ( 2 L n G a A s ) , where m ranges from 1900 to 2100 for lasing around 1.315 µm in a cavity of length 1.33 nm. For the refractive index n G a A s ( λ ) , we use the Sellmeier-type function with coefficients extracted from GaAs experiments [24].
With b ≥ 5.0 MHz, one obtains Equation (2) for −5 ≤ n ≤ 5. Figure 3a shows the modification to the beat-note, with the creation of a flat section (lock band) between n = −5 and 5. A Fourier transformation of E ( z , t ) 2 will show an infinitely narrow resonance at the radio frequency (RF) of 30.60 GHz, indicating a perfect frequency comb. However, a mode-locked pulse train may not result, as depicted in Figure 3b, because the condition specified by Equation (3) is unsatisfied. It is only by increasing the locking coefficient b to reduce the differences in phase, as given by Equation (5), that the pulses approach the transform limit (see Figure 3c,d).

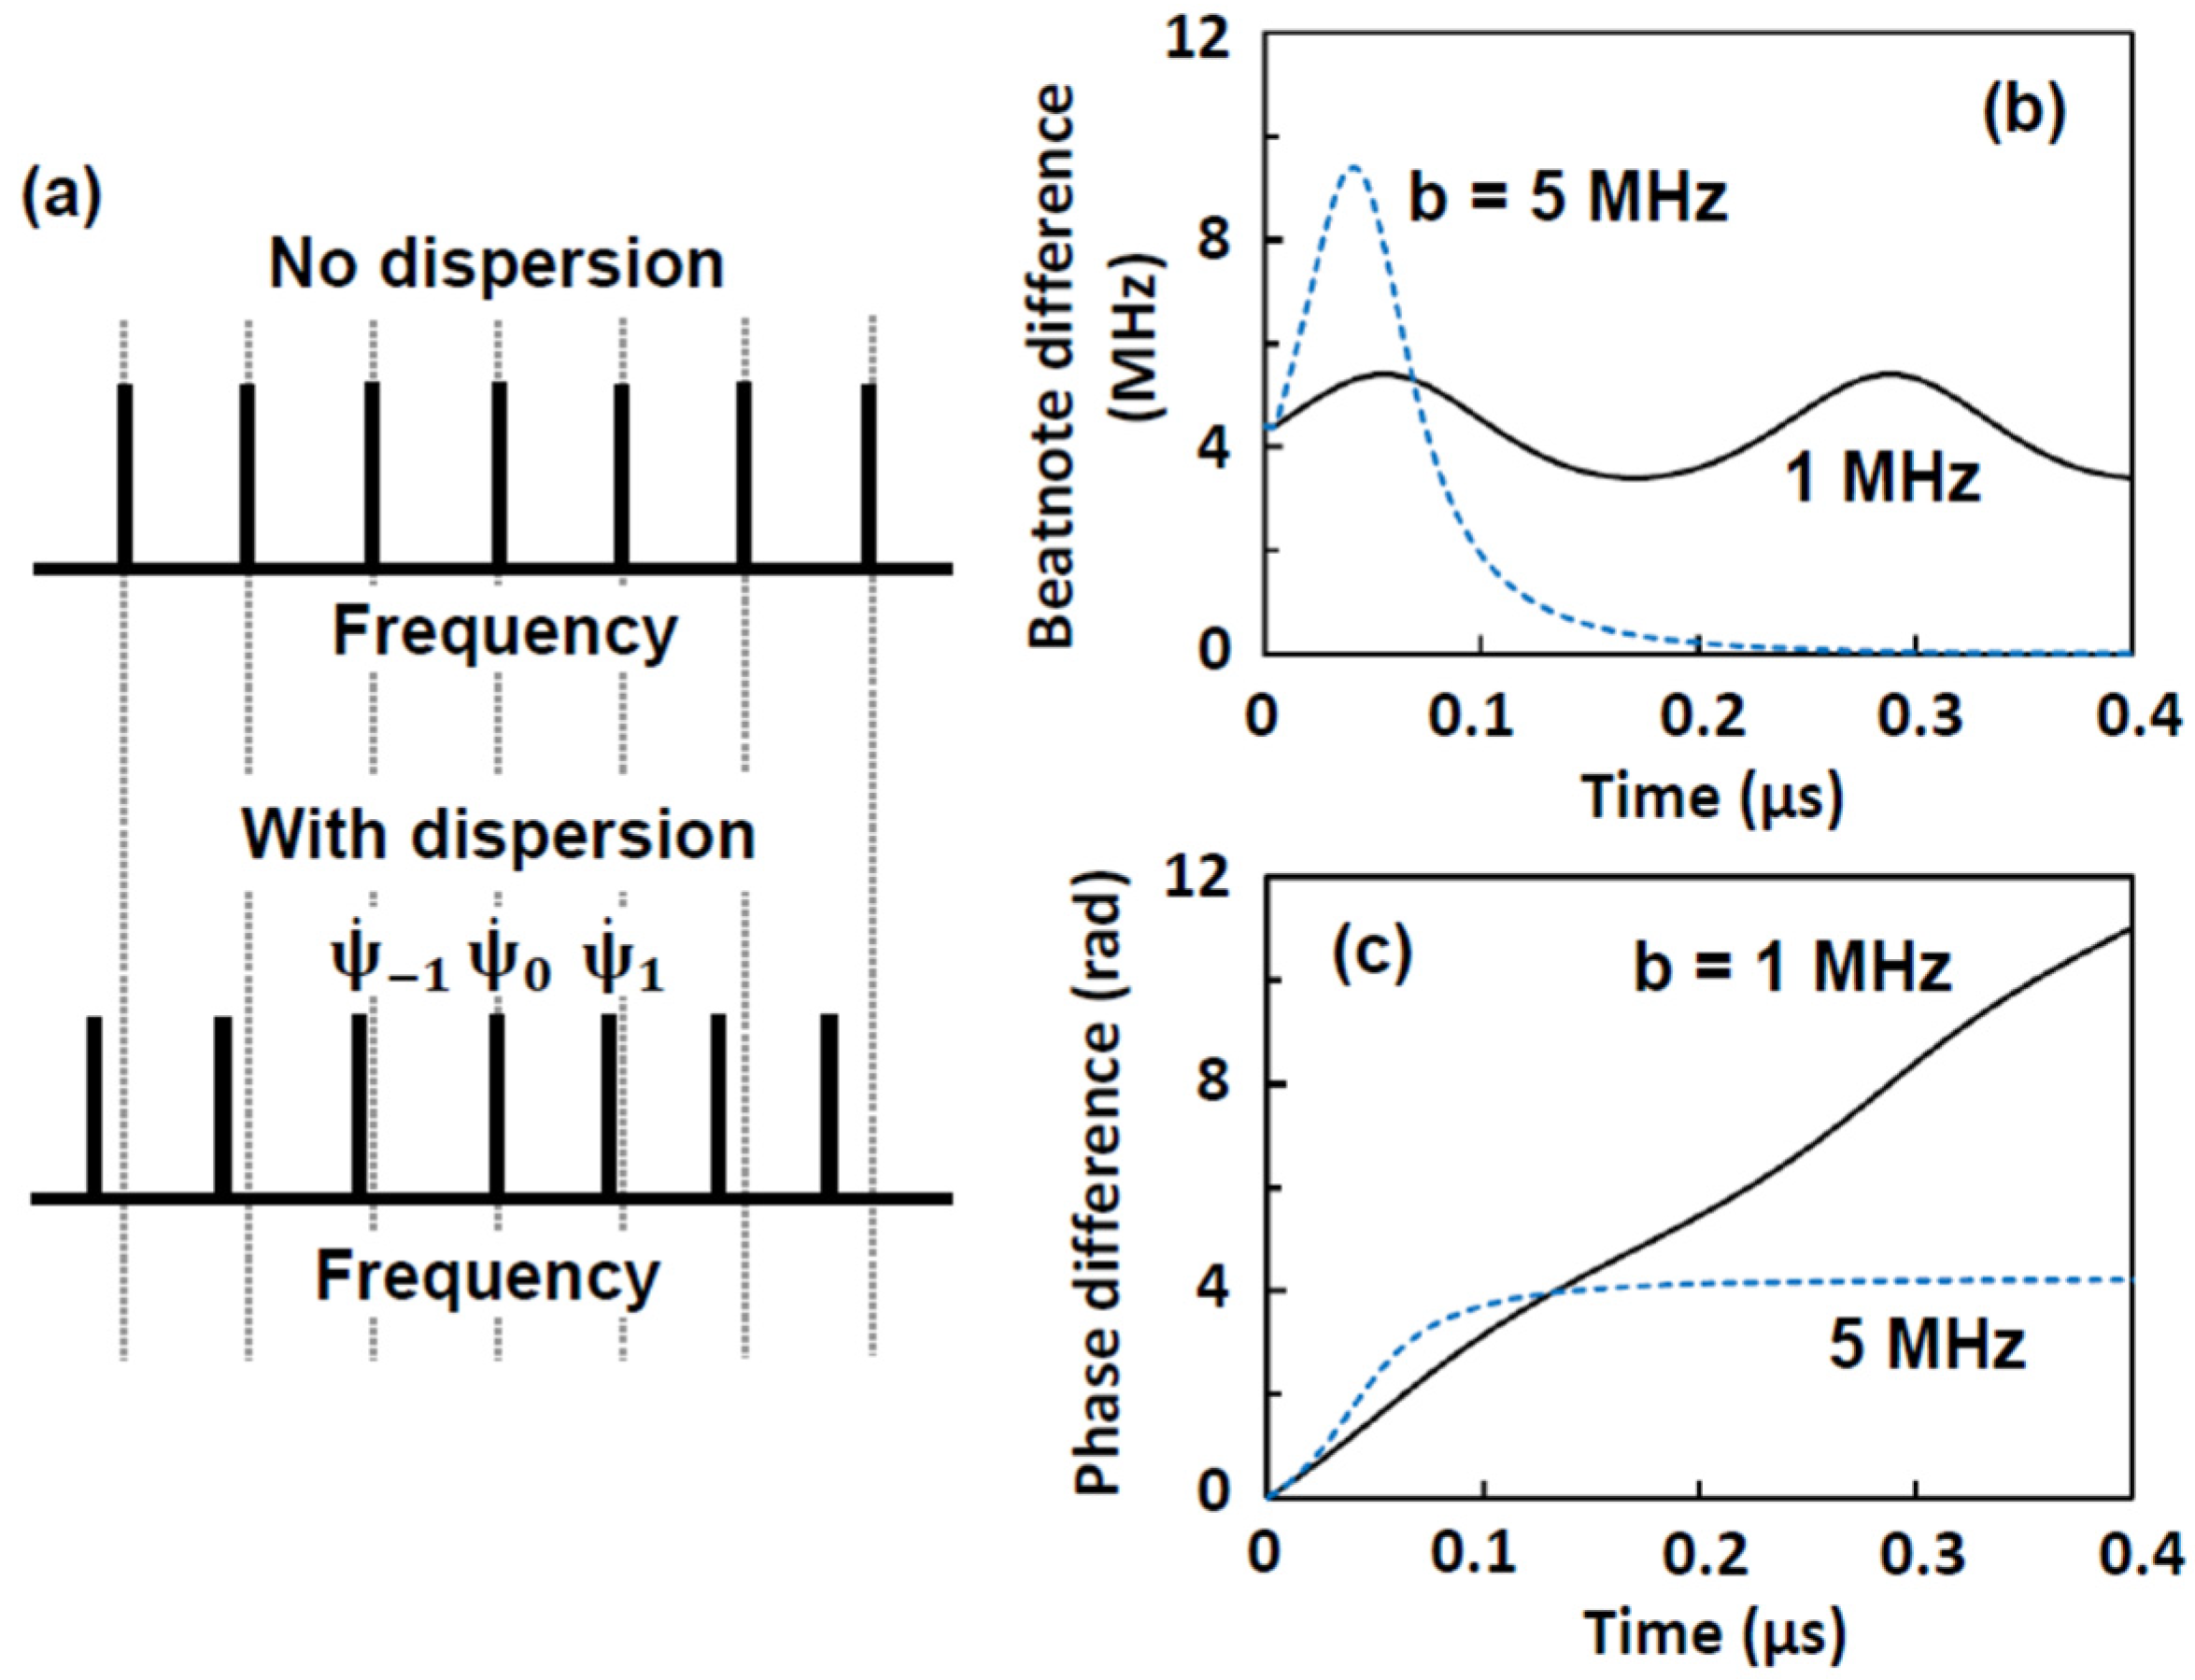
2.3. Physics of the Locking Mechanism

To investigate the physical origin of the locking coefficient b, we generalize Adler’s equation with the help of multimode semiclassical laser theory to obtain [22]:
ψ ˙ n = Ω n + σ n τ n ε n 2 m n τ n , m ε m 2
{ n , m , m } I m [ ϑ n n m m e i ψ n n m m ] ε n ( t ) ε m ( t ) ε m ( t ) ε n 1 ( t )  
where the right-hand side of the first line corresponds to a in Equation (4) and the locking coefficient b is contained within the expression in the second line. The uncluttered appearance of Equation (6) is obtained by defining a dimensionless electric field amplitude ε n = E n / 2 γ , where γ is the dephasing rate, is the electron–hole dipole matrix element, En is the modal electric field amplitude in Equation (1) and is the Planck constant divide by 2 π . In the equation, Ω n is the passive cavity frequency including waveguide dispersion, and the remaining terms describe the carrier-induced refractive index change and its correction due to saturation, according to the coefficients σ n and τ n , respectively. [21,22]. In the second line, the bracket { } denotes summing up only the combinations of n , m , m not included in the terms in the first line. The phase difference,
ψ n n m m = ψ n ψ n + ψ m ψ m
and associated coefficient ϑ n n m m come from the relative phase angle contributions, either from the saturable absorber in a two-section laser or from four-wave mixing in the gain medium in a single-section laser. The general equations for ϑ n n m m for both homogeneously broadened lasers and Doppler-broadened lasers may be found in early laser physics papers and textbooks [21]. The equation, specifically for an inhomogeneously broadened QD gain medium, is given in one of our recent papers [22]. The equation of motion for ψ n n m m for a given set of indices has the form of Adler’s equation in Equation (4). In the numerical model, we track directly the set of Equation (6) and look for steady-state solutions where d ψ n . n + 1 , m , m + 1 / d t vanishes for a combination of indices.
According to multimode laser theory, ϑ n n m m includes spatial and spectral hole burning, with input parameters involving electronic structure, material constants and carrier relaxation rates. An examination of the expression for ϑ n n m m indicates that spatial hole burning dominates in a two-section laser with a saturable absorber, while spectral hole burning is important in determining the strength of self-mode locking in a single-section laser.
Lastly, unlike Adler’s equation, the locking term in Equation (6) contains the electric field amplitudes, giving rise to rich dynamical behaviors. To allow the treatment of these behaviors, the model has additional equations of motion that are solved simultaneously with that for the laser phase. They are:
ε ˙ n = [ g n s a t Ω 0 2 Q ] ε n  
d N d t = η J e ( 1 N 2 N Q D ( 2 d ) ) γ n r N 4 ε 0 d Ω 0 ( γ n B ) 2 n g n s a t ( N ) ε n 2  
where,
g n s a t = g n 1 + A n ε n 2 + m n B n , m ε m 2  
is the saturated gain,   Ω 0 / Q is the passive cavity decay rate and multimode laser theory separates the gain compression to self- and cross-contributions, An and Bn,m. The total carrier density equation of motion is included to give the carrier distributions used in the evaluation of the linear and nonlinear gain medium coefficients. In Equation (9), the pump term consists of the current density J, injection efficiency from electrodes to QD states η and carrier blocking due to the exclusion principle ( 1 N / 2 N Q D ( 2 d ) ) , where N Q D ( 2 d ) is the QD density and e is the magnitude of the electron change. Additionally, in Equation (9), γ n r is the nonradiative carrier loss rate and nB is the background refractive index. In Equation (10), gn is the small signal laser gain. Details on the derivation of Equations (6)–(10), expressions for evaluating the gain medium coefficients and the input parameters, are given in an earlier report [22]. The calculation of band structure parameters, such as conduction and valence band dispersion and dipole matrix element, is given by k·p theory [25] The scattering rates entering into the expression for the gain and refractive index coefficients are taken from quantum kinetic calculations of InAs quantum dots [26].

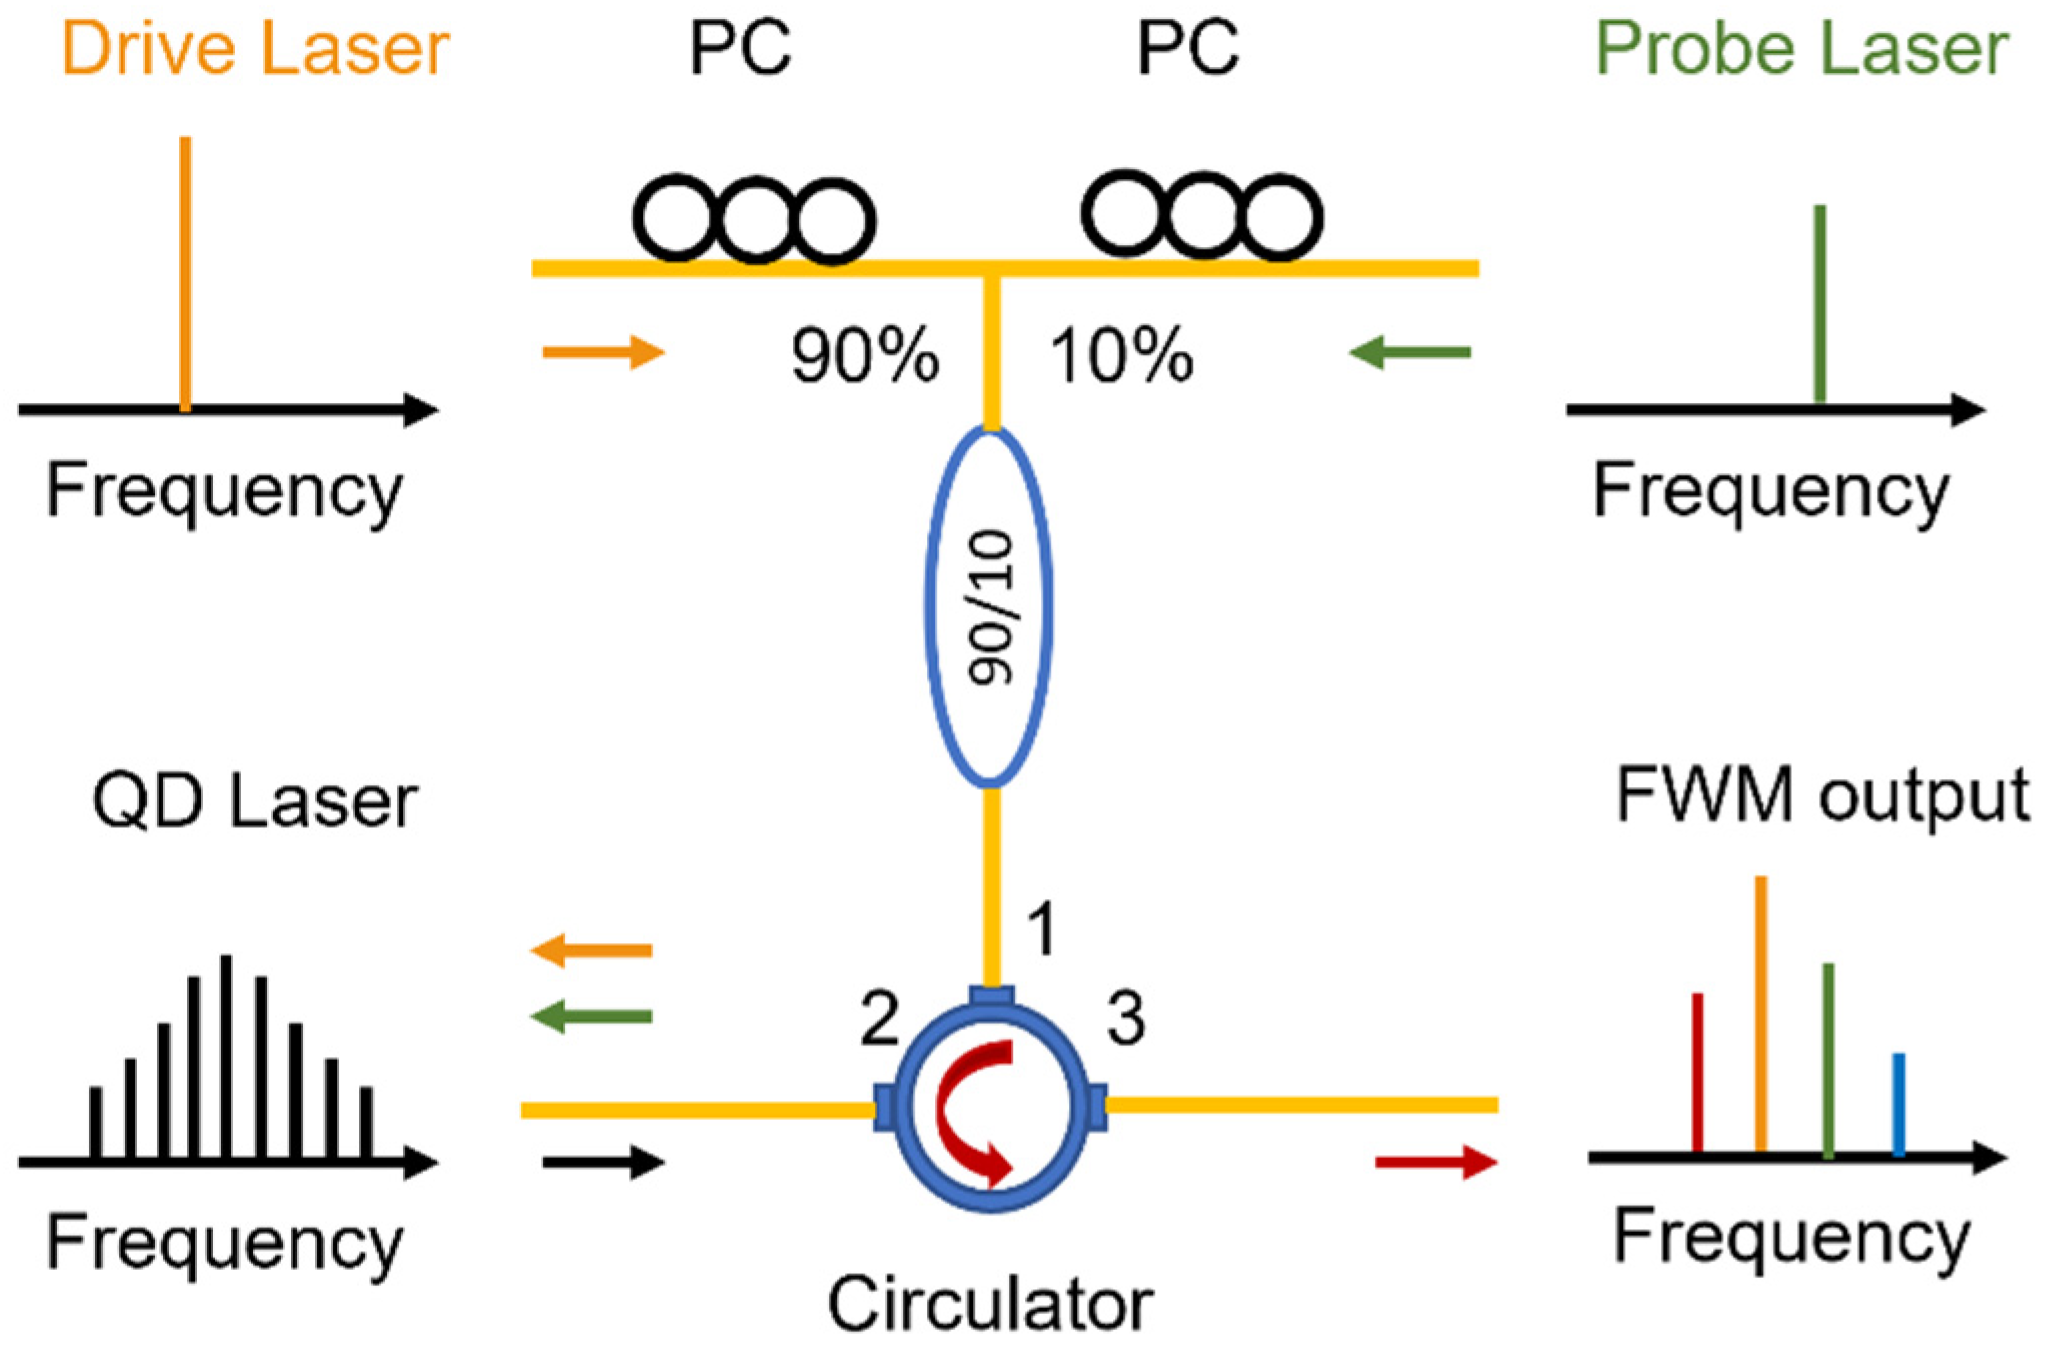
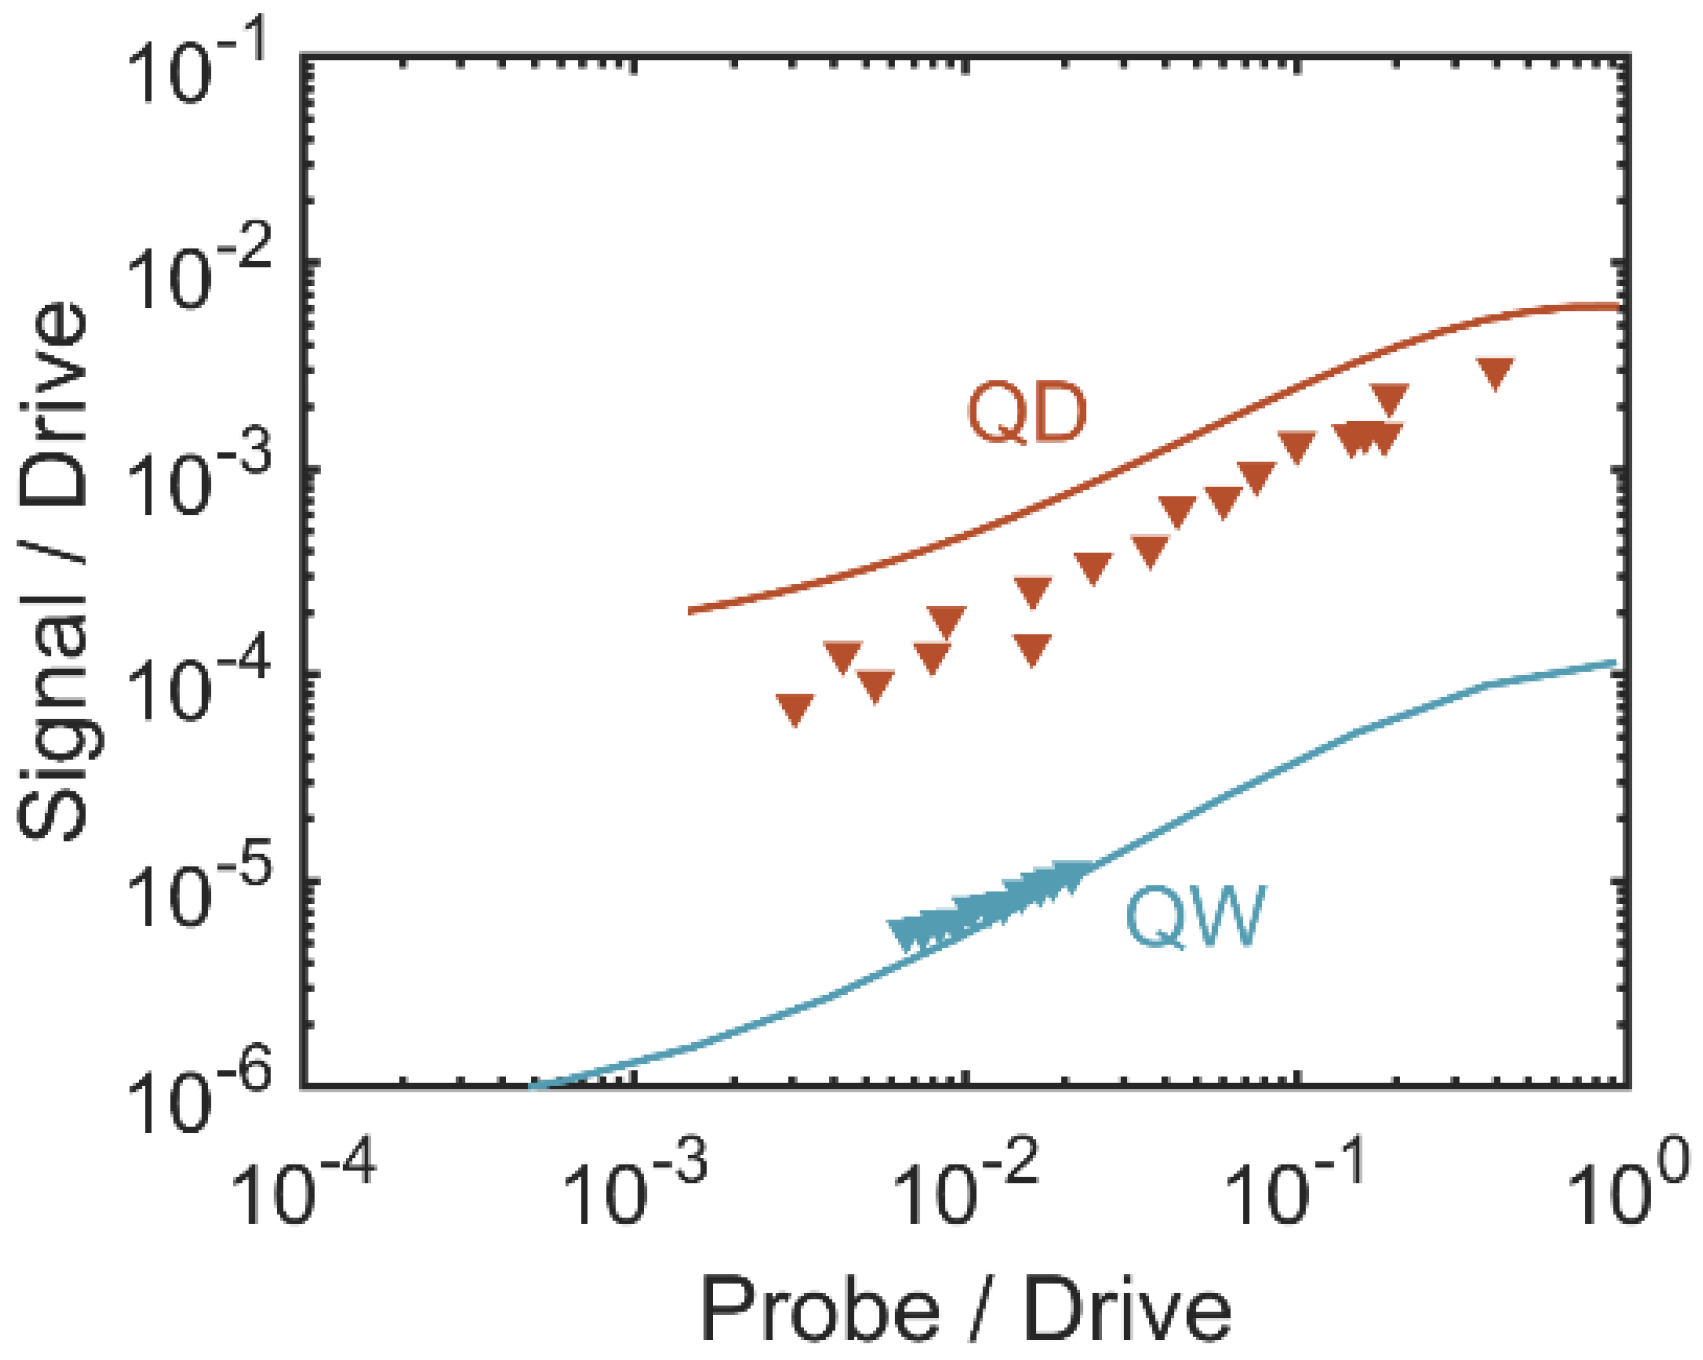
2.4. Enhanced Frequency Conversion Efficiency

In this paragraph, FWM experiments are performed on both QD and QW lasers. The QD Fabry–Perot (FP) laser is directly grown on silicon. Further details about the structure have already been published elsewhere [12]. The QW laser is a commercial FP laser provided by Almae Technologies. Figure 4 depicts the experimental setup for the nondegenerate pump–probe FWM operation. To maximize the FWM efficiency, two single-frequency tunable sources with narrow linewidths serve as the drive and the probe photons. The outputs of those two pump photons are firstly incorporated by a 90/10 fiber-based optical coupler, and then they are sent into the QD or QW laser from port 1 to port 2 of an optical circulator and a lens-end fiber. To further maximize the frequency conversion efficiency, the polarization controllers are added into the paths of the drive and the probe sources to align the polarization of these two pump photons with that of the QD/QW laser. To eliminate the back reflections from the setup, the isolation between port 2 and port 1 of the optical circulator must be higher than 30 dB. The output of the FWM light is finally coupled out from port 2 and it is sent to a high-resolution optical spectrum analyzer (OSA) through port 3. The measurements are performed at 25 °C, which is controlled by a thermoelectric cooler. Depending on the frequency of the drive and the probe photons, υ d and υ p , respectively, the FWM operation includes two processes. The Stokes case takes place when the frequency detuning Δ υ = υ p υ d is negative, whereas the case for anti-Stokes occurs at the positive frequency detuning condition.
Benefiting from the three-dimensional charge carrier confinement in QDs, the enhanced third-order nonlinear susceptibility gives rise to the improvement of FWM efficiency. In this study, the FWM efficiency is determined by the relationship between the ratio of the signal power to the drive power rsd and the ratio of the probe power to the drive power rpd. Figure 5 displays the calculated rsd as a function of the rpd for an epitaxial QD laser on Si with p-modulation doping in the active region (solid burgundy line) and for a commercial QW laser (solid jade line), with the frequency detuning Δ υ 300   GHz in the Stokes condition and the bias current fixed to twice the threshold. The calculated dependencies are performed with multimode semiclassical laser theory. The optical nonlinearities are analyzed based on a microscopic level model containing quantum mechanical electron–hole polarization. The theory gives access to the active medium nonlinearities, contributing to gain saturation, mode competition and multi-wave mixing [17]. In particular, it provides the FWM efficiency, which is plotted in Figure 5. The corresponding experimental results are performed by the different markers in the same colors. Despite the fact that the FWM efficiency of the QD laser has not attained its theoretical limit yet, it is still more than 10 times higher than that of the QW device. This remarkable improvement results from both the enhanced third-order optical nonlinearity and the p-type doping, whose presences contribute to the increase in the intensity of the signal photon in the QD laser [17]. Central to single-section ML lasers is the self-mode-locking mechanism allowed by four-wave mixing in the gain medium itself. The improved susceptibility in the QD laser is sufficient to produce stable, sub-picosecond mode-locked pulse trains in InAs QDs grown on Si. However, one clearly sees that both the susceptibility of four-wave mixing and the signal gain are noticeably lower than those of QDs.

3. Towards Transform-Limited Performance

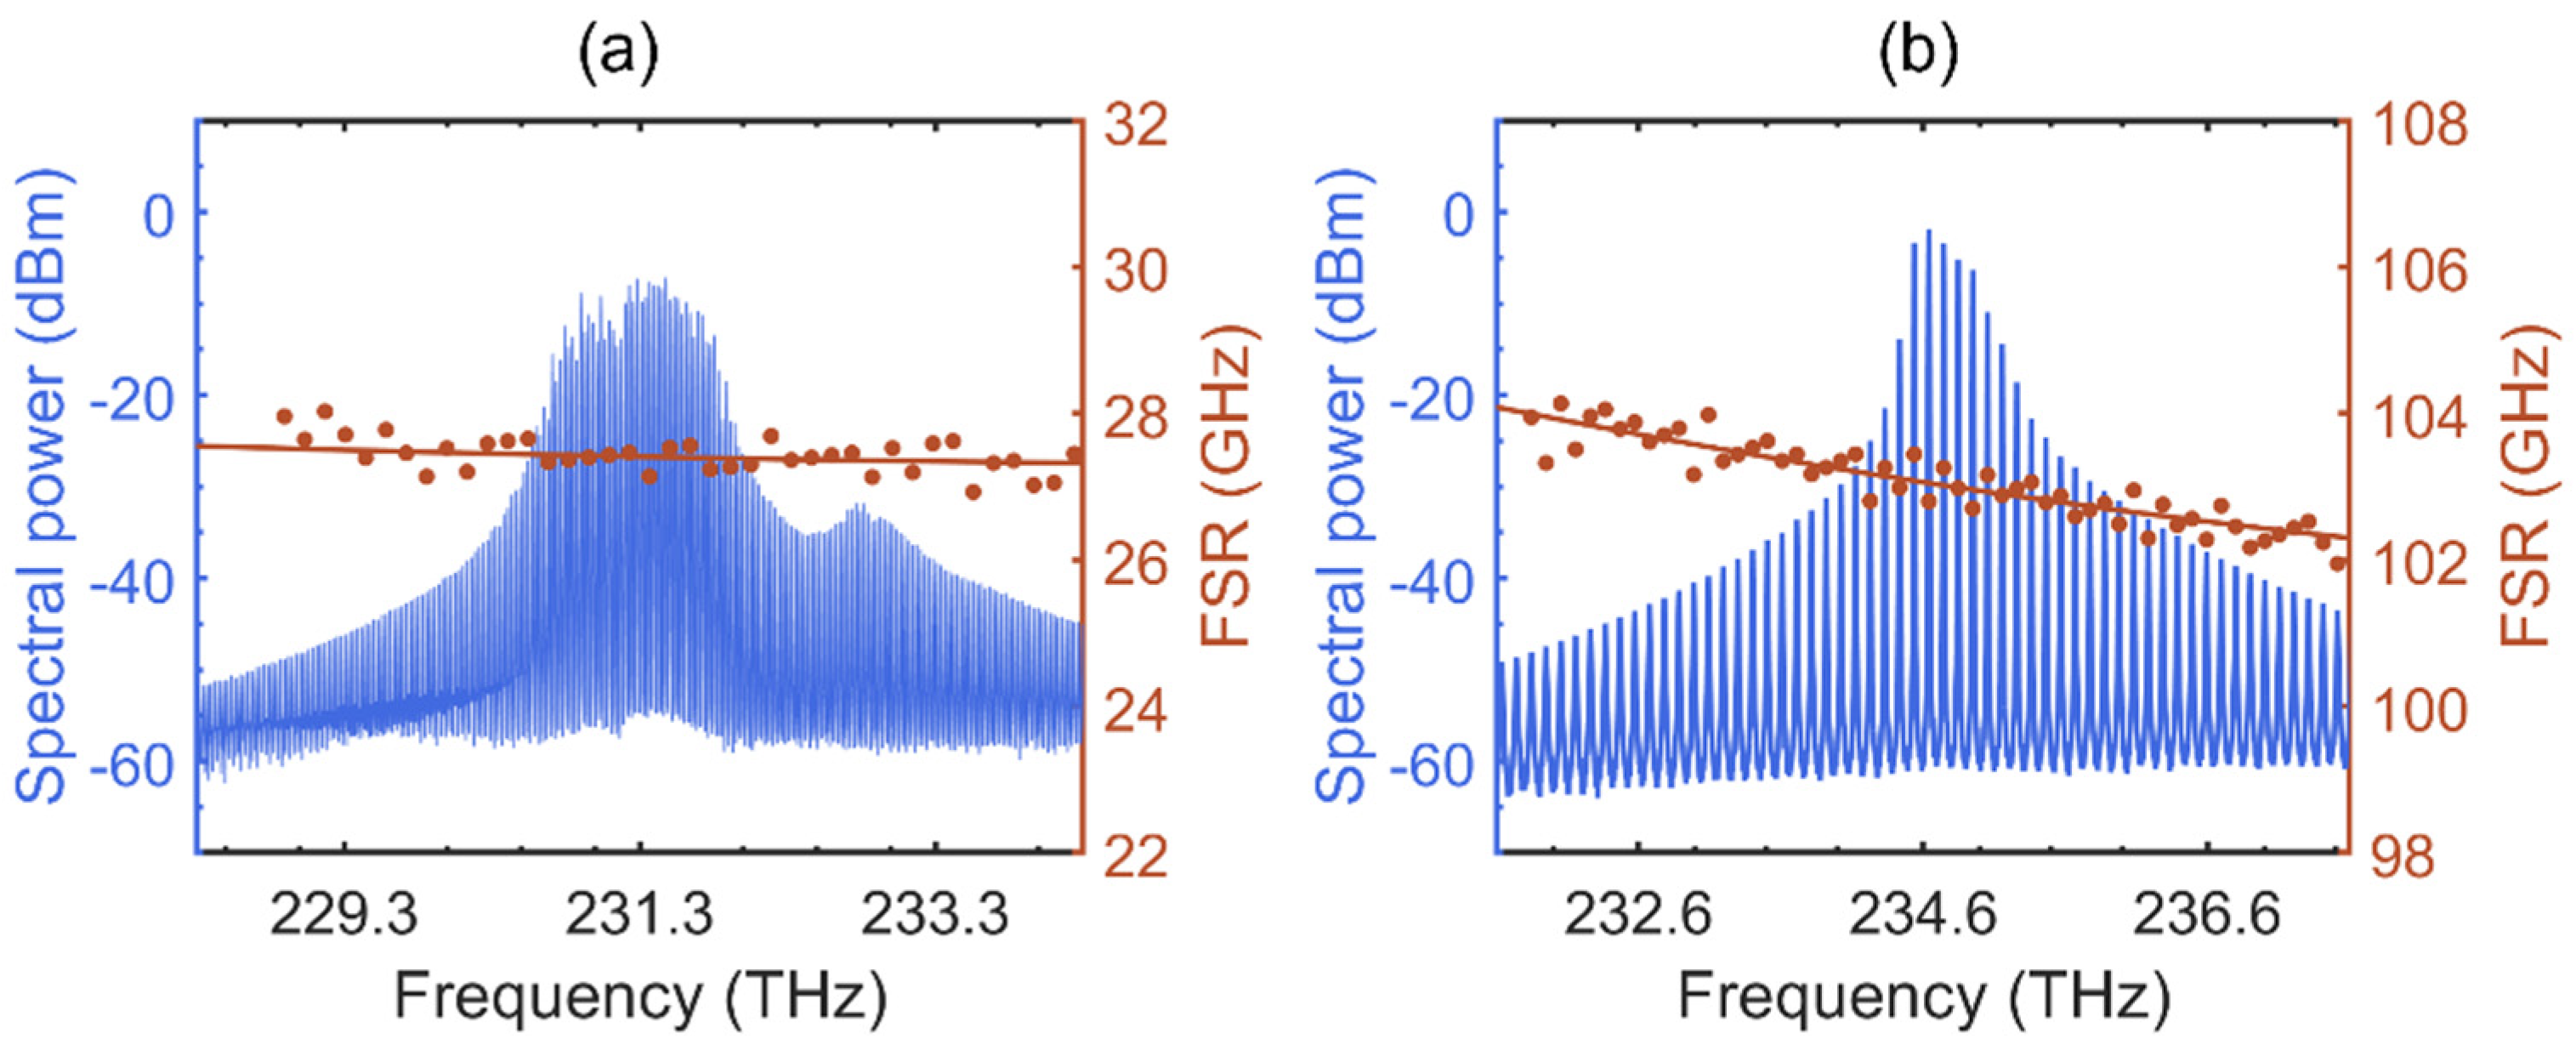
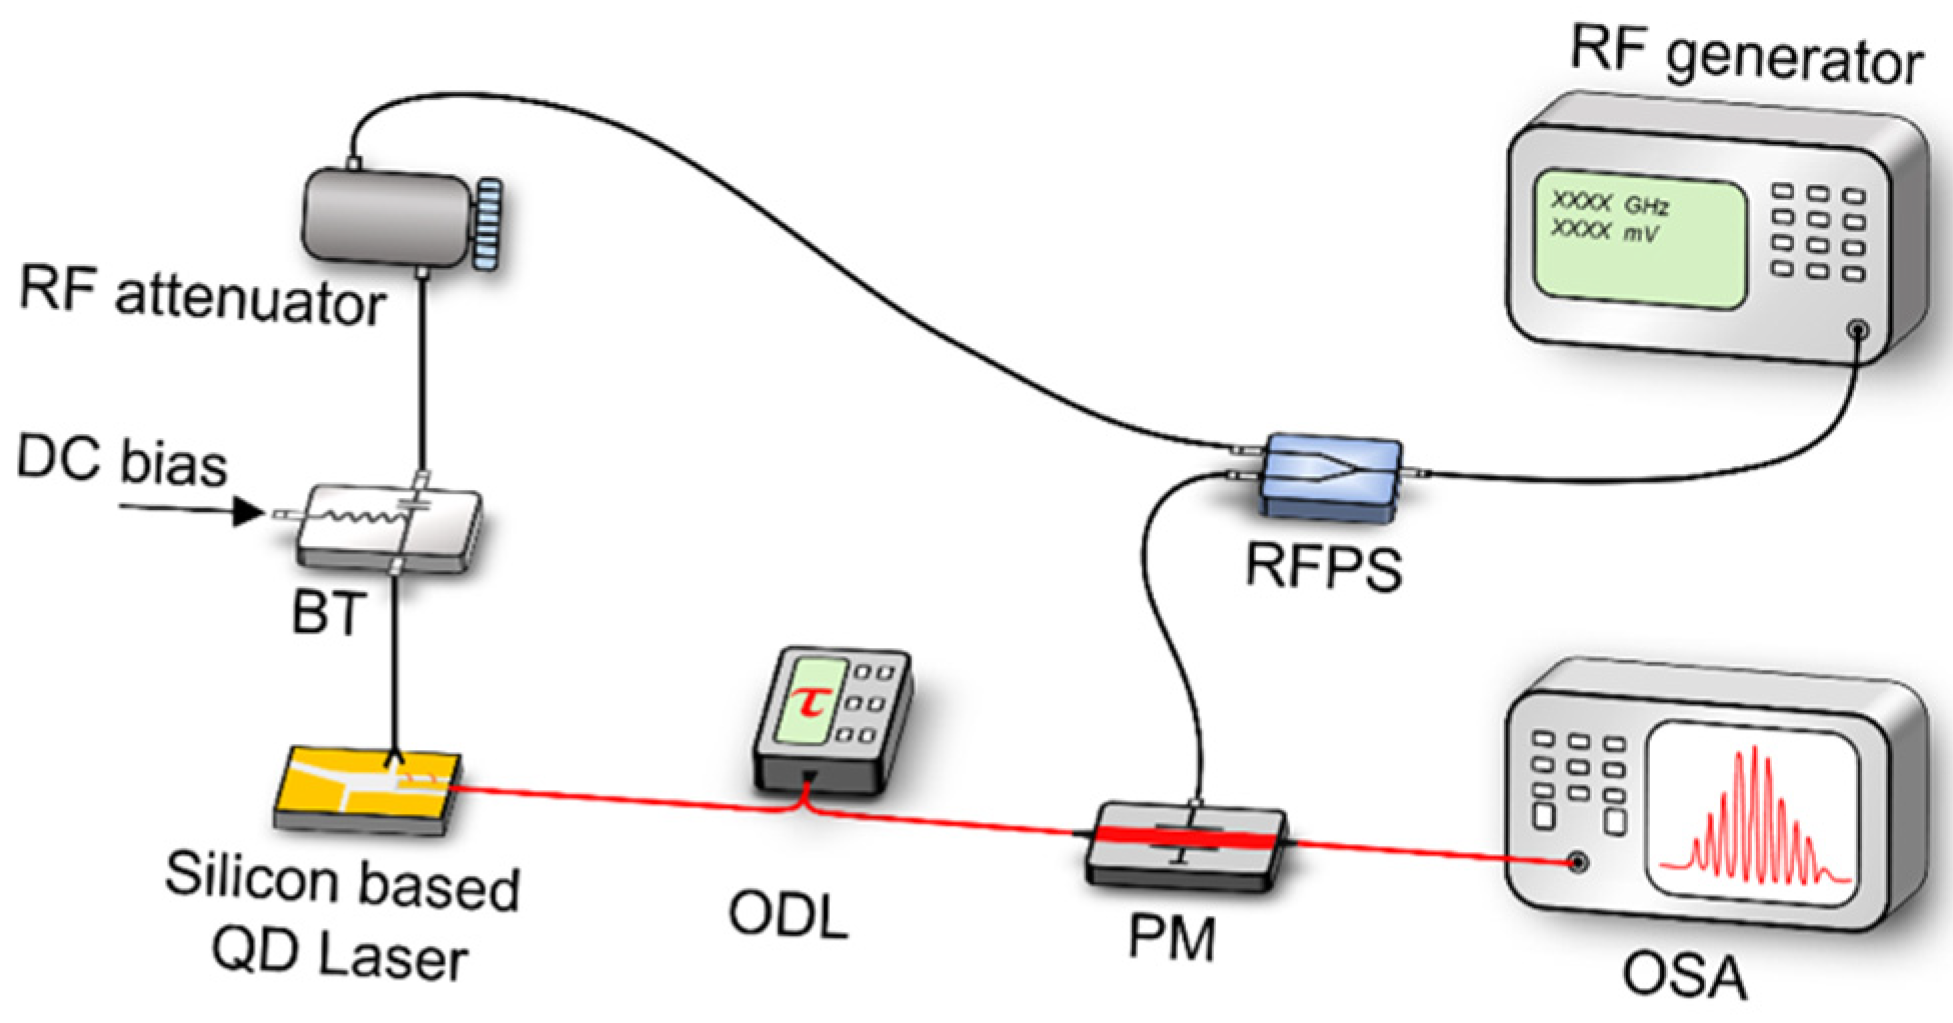
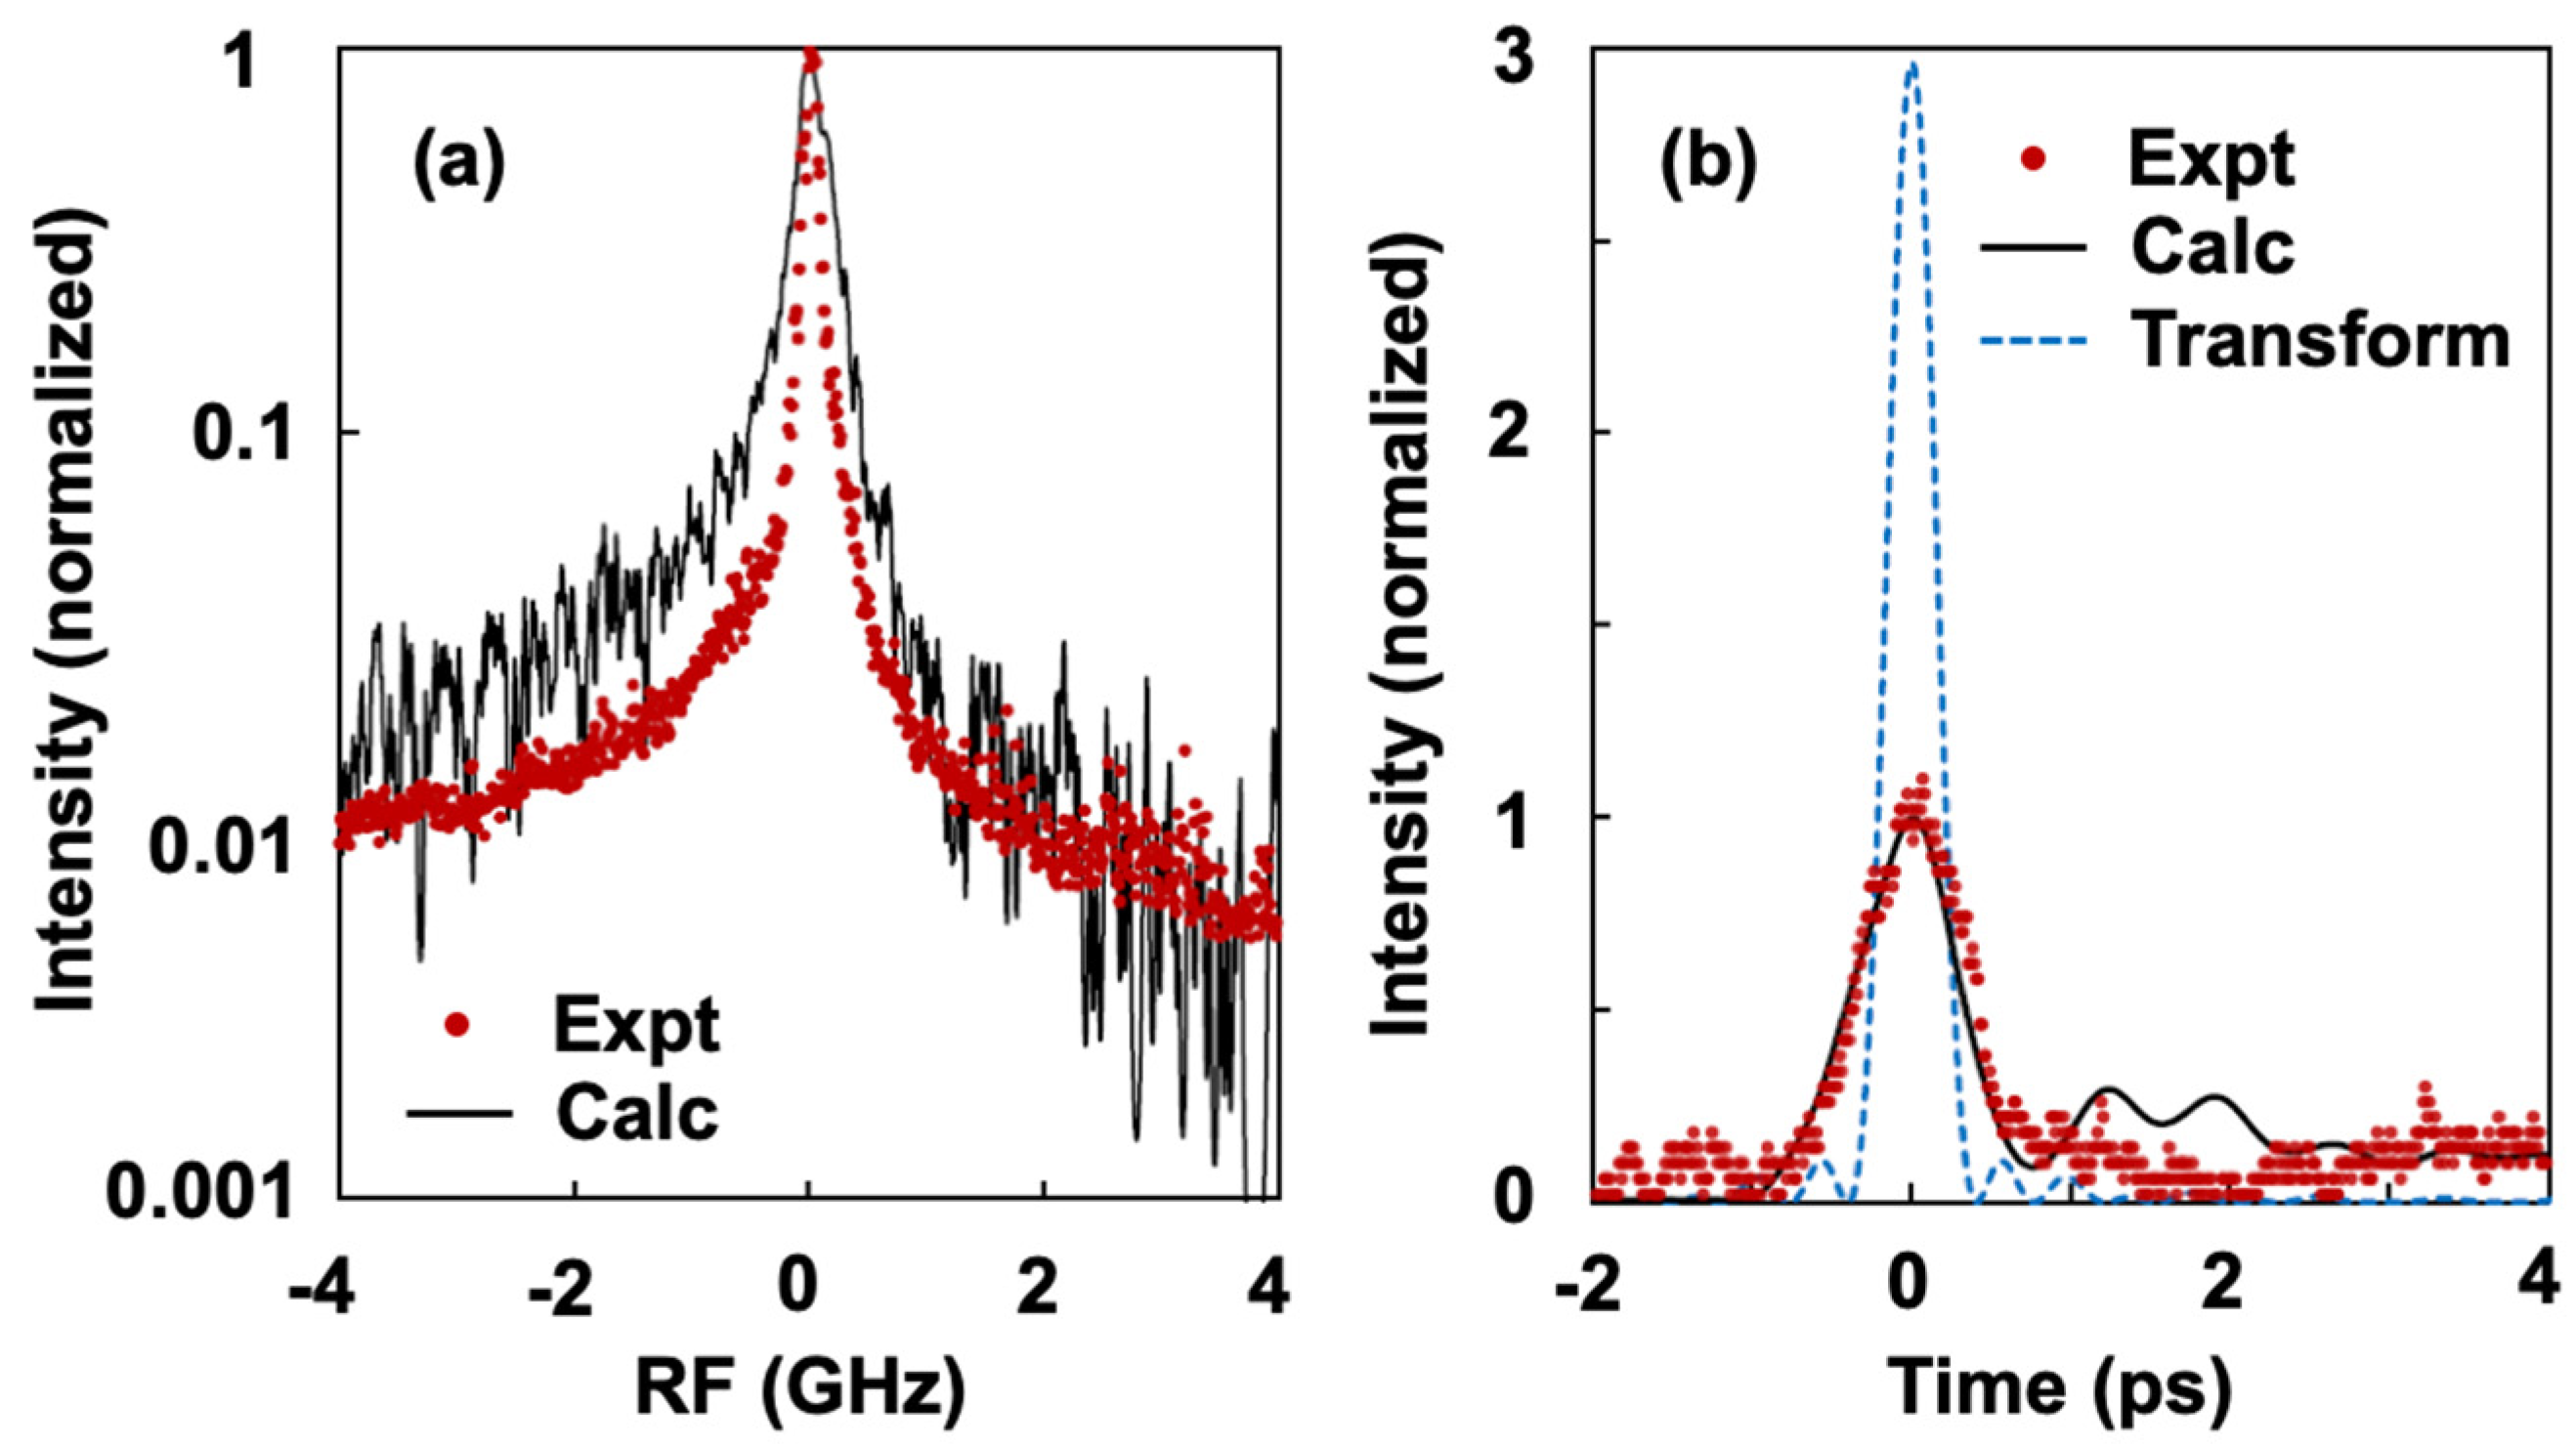
3.1. Experiment versus Transform Limit

Here, we give an example of the insight gained into experimental device performance by comparing experiment and theory. The device is a single-section InAs QD laser still epitaxially grown on silicon, with device parameters available in Refs. [12,22,27]. In Figure 6, the red curves are from measurements and the black curves are from numerically solving Equations (6), (8) and (9). The operating current for the experimental spectrum (red curve) and the calculated spectrum (black curve) is 14 times and 10 times the threshold, respectively. The calculated RF linewidth is 143 kHz, compared to the 100 kHz measured value (Figure 6a). There is also good agreement on the measure pulse shape (Figure 6b), where fitting with a sech pulse shape gives approximately 500 fs of pulse duration [28].
Reproducing the measured results with the multimode mode-locking model allows us to understand the experimental laser performance. In Figure 7a, the intensity of each cavity mode is shown by the solid gray curve. The solid black curve from theory indicates only partial locking of the beat-notes in the experimental laser, with the flat portion of the black curve covering only 30% of the cavity modes that are calculated to be above the lasing threshold. Additionally, we found that the carrier-induced refractive index change leads to a nonlinear dispersion across the lasing modes (dashed blue curve). This results in appreciable phase variation, contributing to considerable deviation from the transform limit (dashed blue curve in Figure 6b). In Figure 7a, the difference between the solid black curve and dotted red curve indicates the improvement made with the present experimental device.
At a minimum, there are contributions from the passive waveguide material and from the carrier-induced refractive index change in the active region. Figure 7b shows these contributions for the example of an InAs QD active region embedded in a GaAs waveguide. In order for the beat-notes to lock, some optical nonlinearity is necessary to overcome the dispersion. This nonlinearity may be from saturable absorption incorporated inside the optical cavity or from four-wave mixing within the gain medium itself.

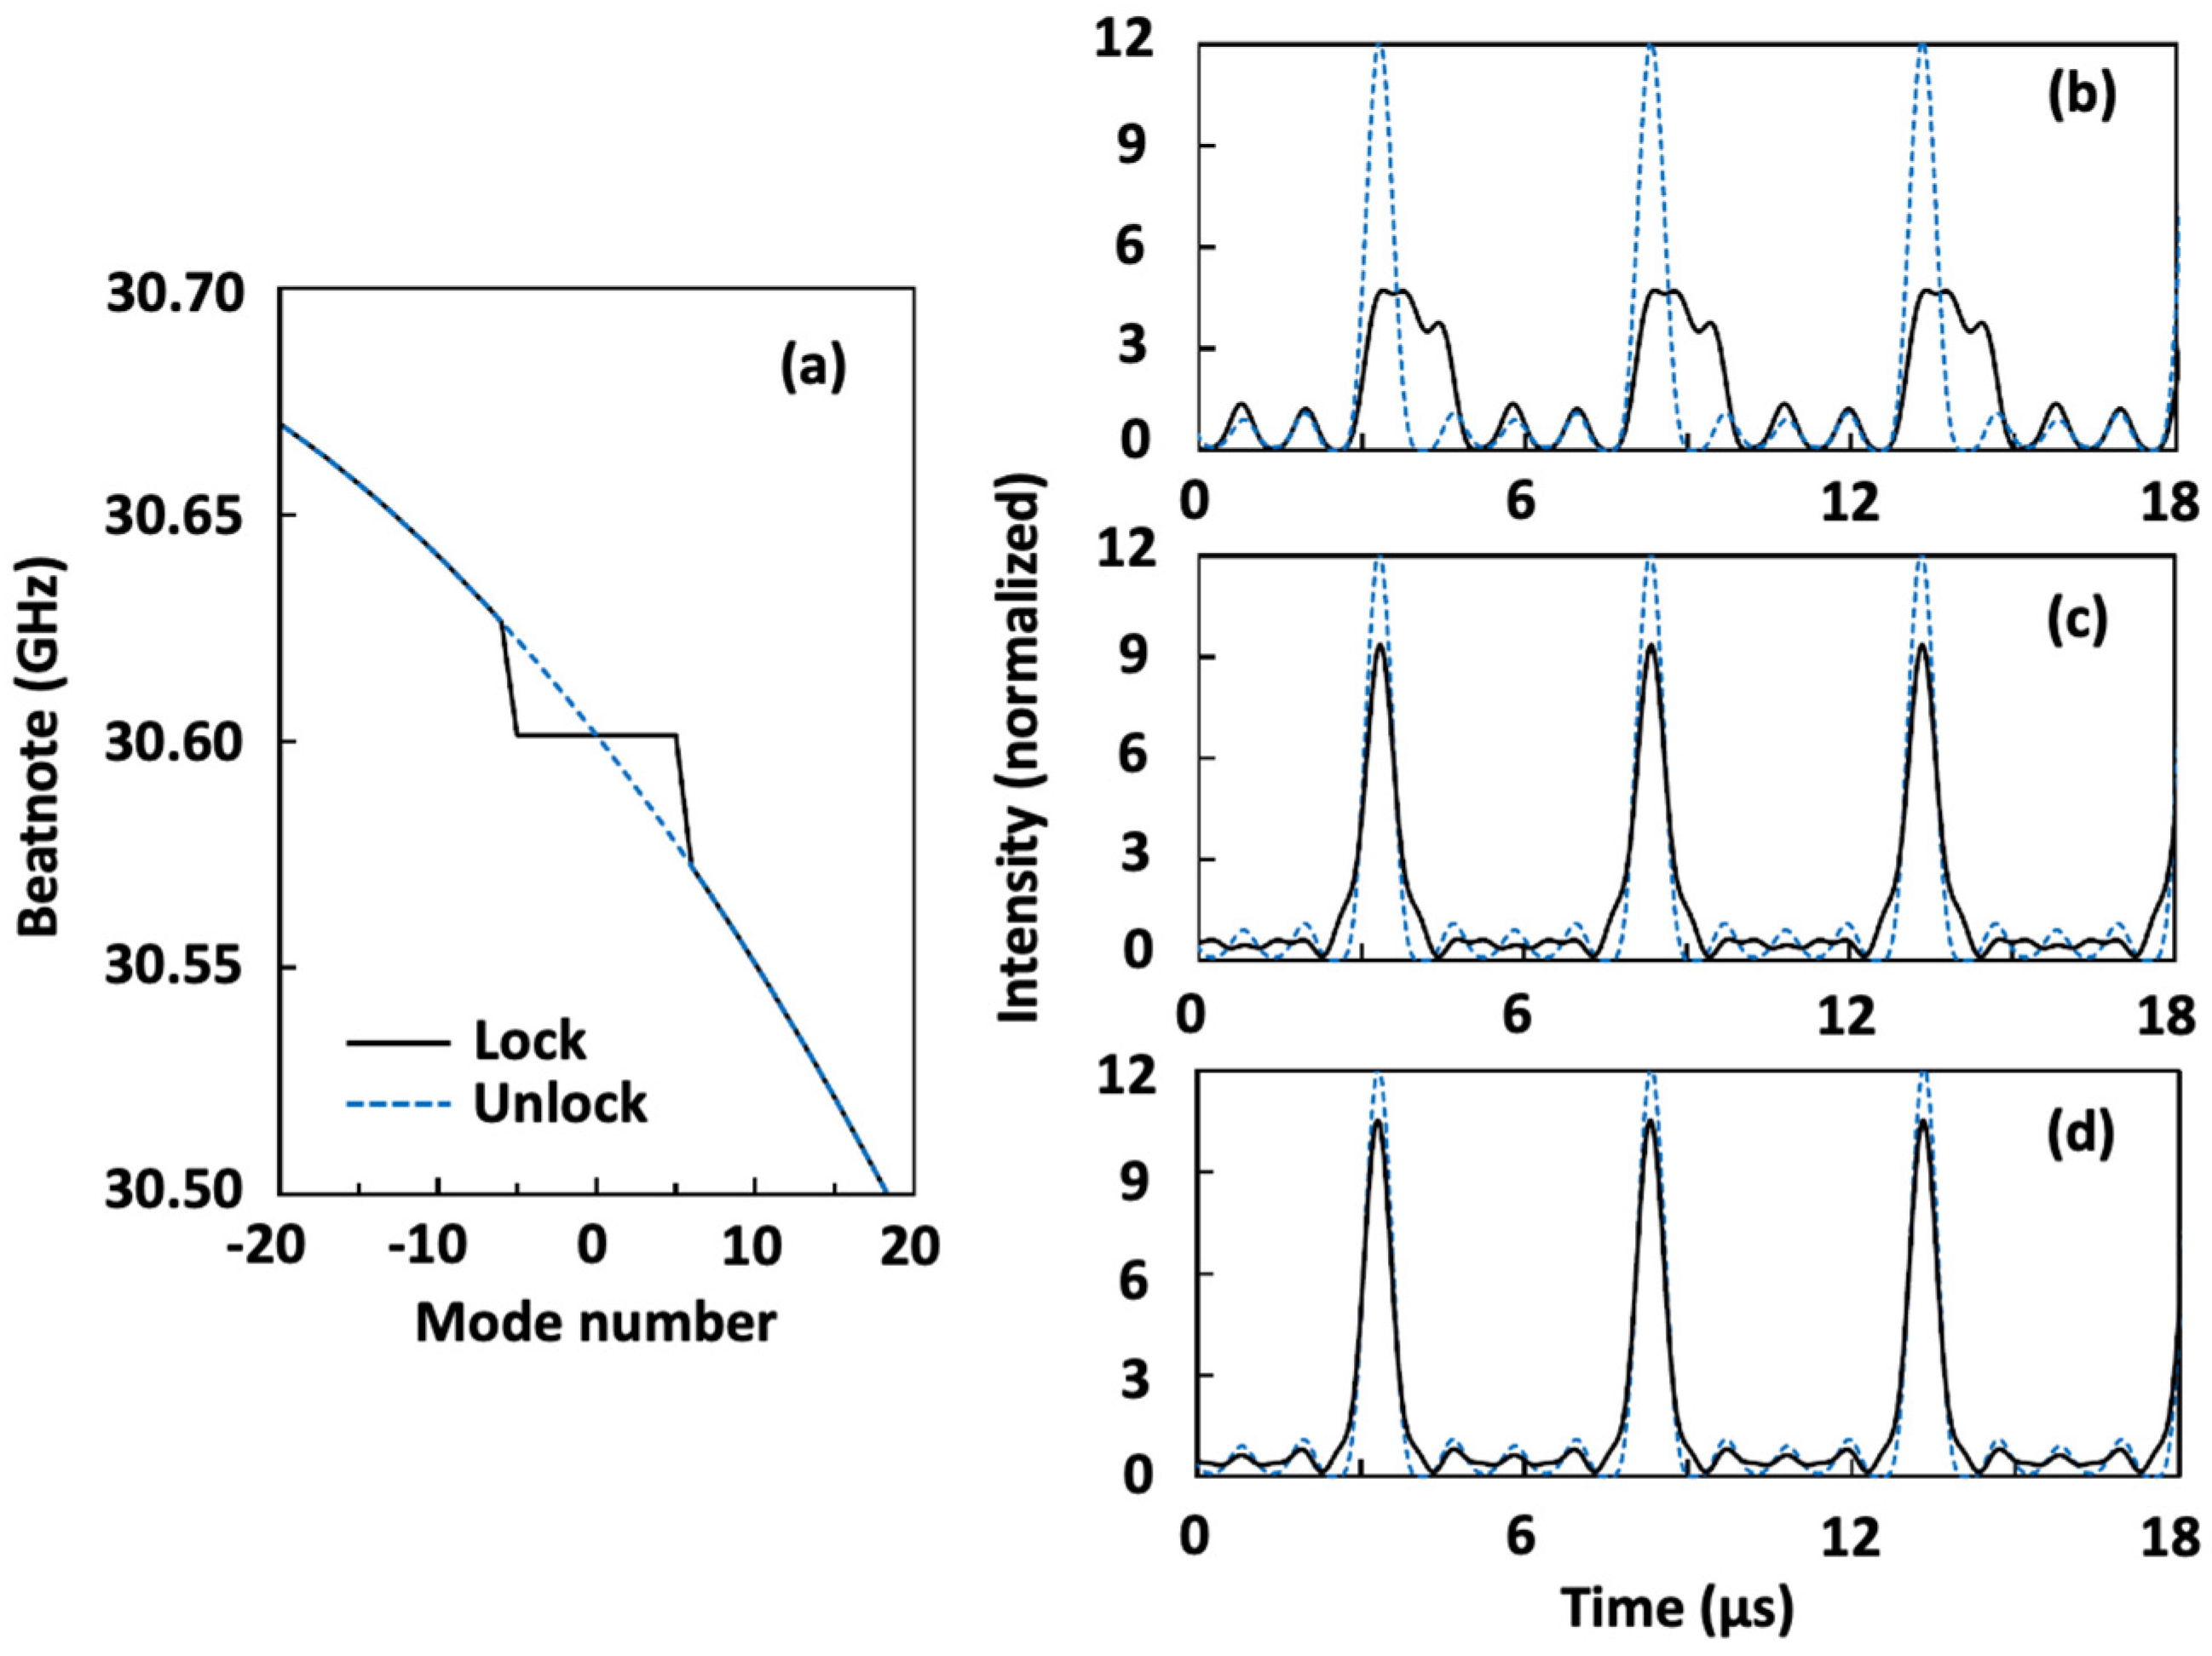
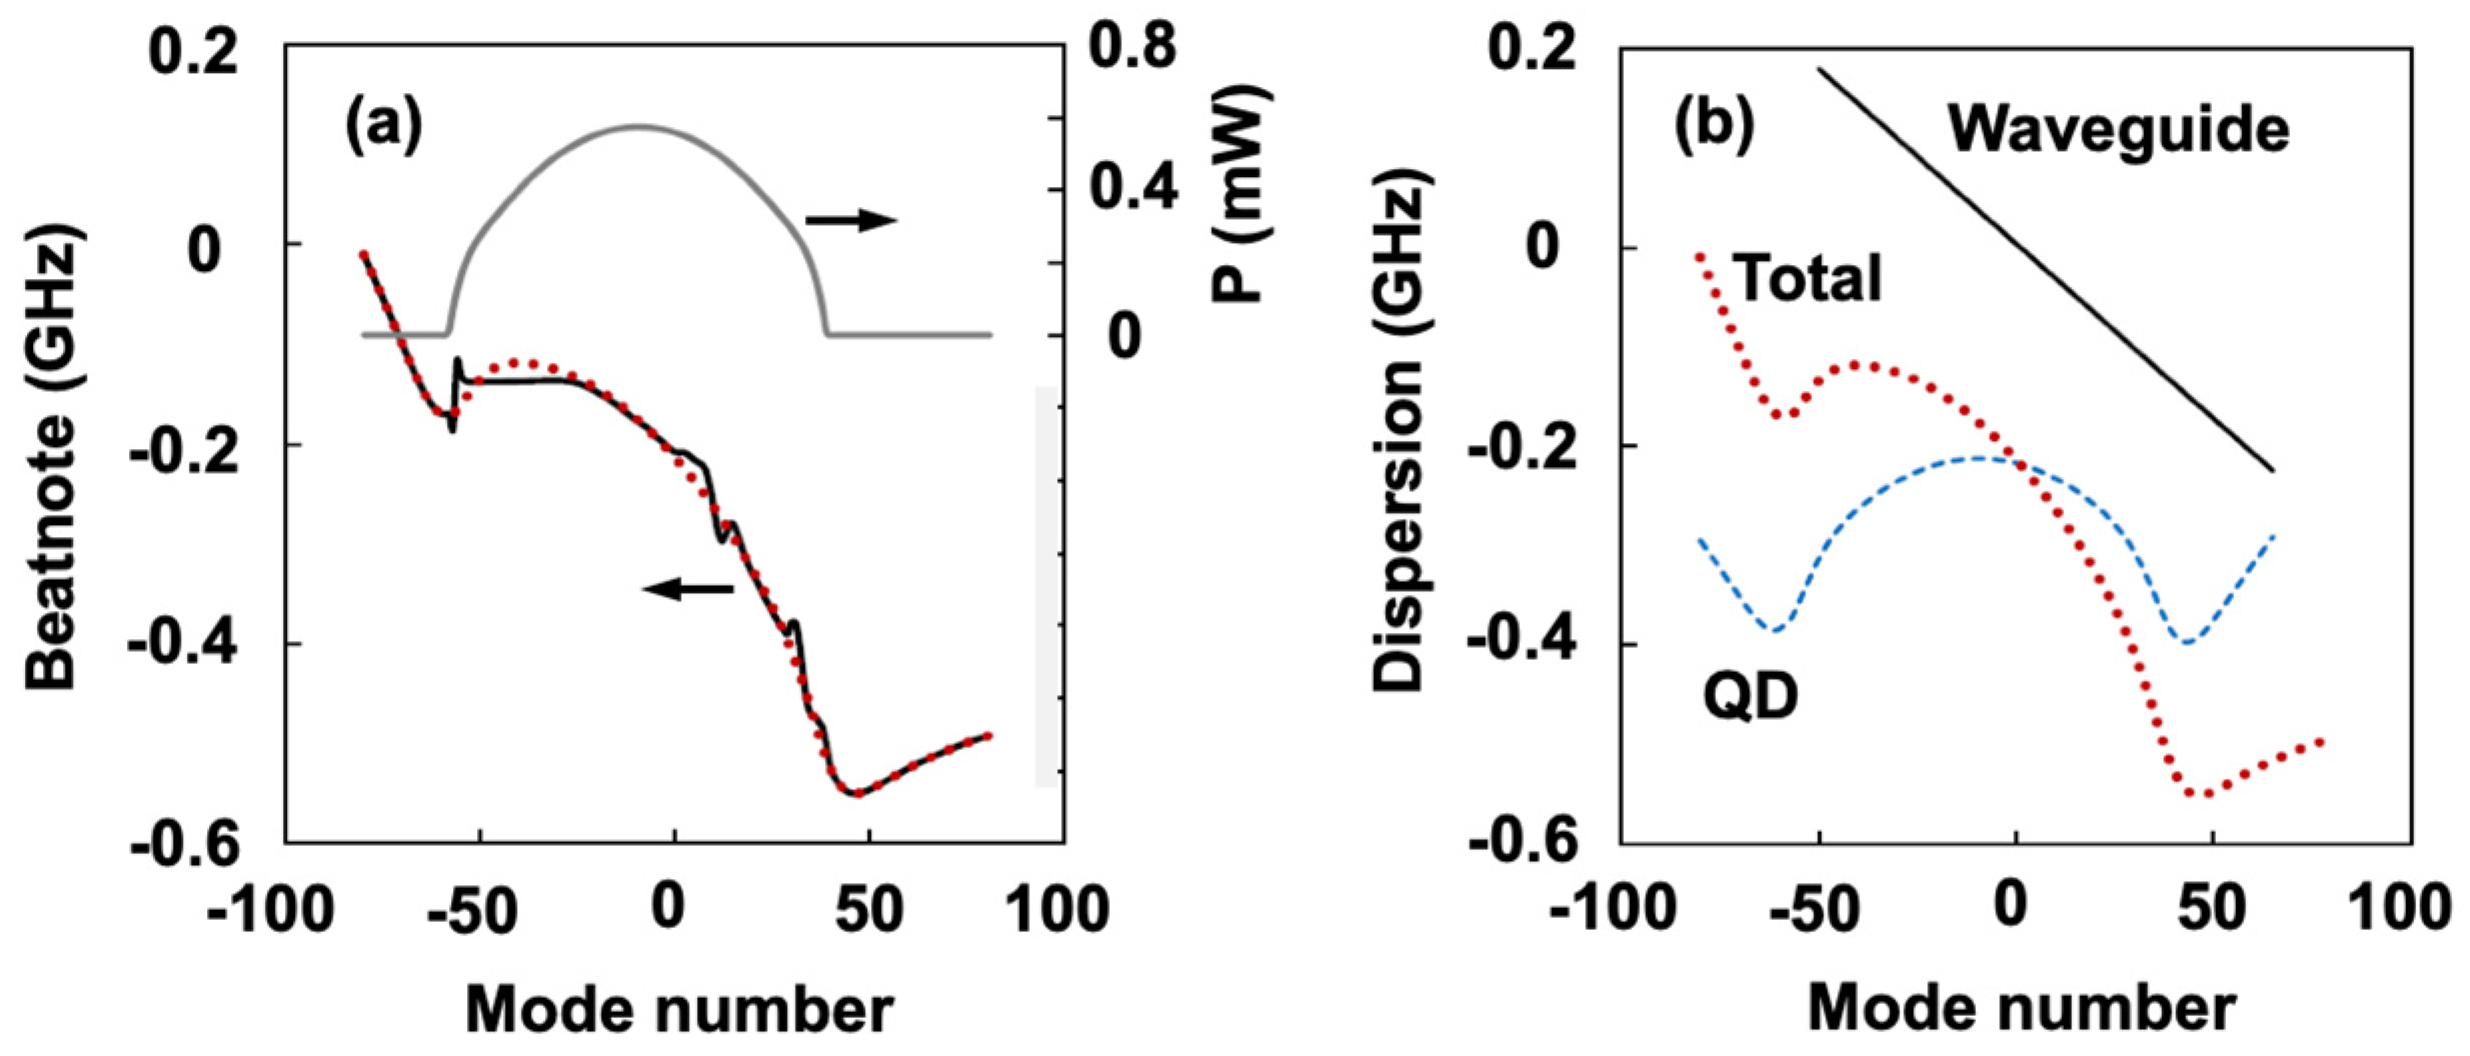
3.2. Group Velocity Dispersion

The group velocity dispersion (GVD) is regarded as a limiting factor for generating high-bandwidth optical frequency combs (OFC) due to the increased mismatch between the frequency comb modes and the cavity modes that decreases the four-wave mixing efficiency [29]. The GVD is performed by the variation of the free spectral range (FSR) of the resonant cavity with respect to the optical frequency. Such an inconvenience has been observed in both semiconductor laser-based and micro-resonator-based OFC, which is no longer negligible if the pulse duration is reduced to the level of a hundred femtoseconds [30]. It is worth stressing that a low GVD is beneficial for shortening the pulse width and increasing the optical bandwidth. Approaches such as the dual grating dispersion compensators allow for reducing the cavity dispersion, thus reducing the pulse duration by a factor of more than 15 [31]. The QD laser is known for its high efficiency in optical frequency comb generation [32]. In particular, self-mode locking (SML) has been widely observed in single-section QD or quantum-dash (QDash) lasers [27,28]; however, the SML behavior is rarely observed for the QW devices. It is worth stressing that the contribution of GVD can be a crucial factor that leads to the generation of SML from a single section QD laser. Figure 8a depicts the optical spectrum (blue) and the corresponding free spectral range (FSR, red curve) as functions of optical frequency for the single-section epitaxial QD laser on Si operating at twice the threshold current. The same measurements of a commercial QW laser are also investigated and are displayed in Figure 8b. Due to the different FP cavity lengths, the FSR of the QD laser is smaller than that of the QW device. In this study, the QD laser exhibits a low GVD in the presence of the FSR ≈ 28 GHz, which shows a high degree of stability against the variation of the optical frequency within a range of 6 THz. In contrast, the QW laser exhibits a much larger GVD than its counterpart. With the increase in optical frequency from 231.6 to 237.6 THz, its FSR reduces from 104 to 102 GHz. The ultra-low GVD, along with the rich optical nonlinearities offered by QD, thus enables the laser to generate a high-efficiency frequency comb [17]. The OFCs can, thus, take advantage of the low-dispersion semiconductor QDs to realize high-performance SML lasers.

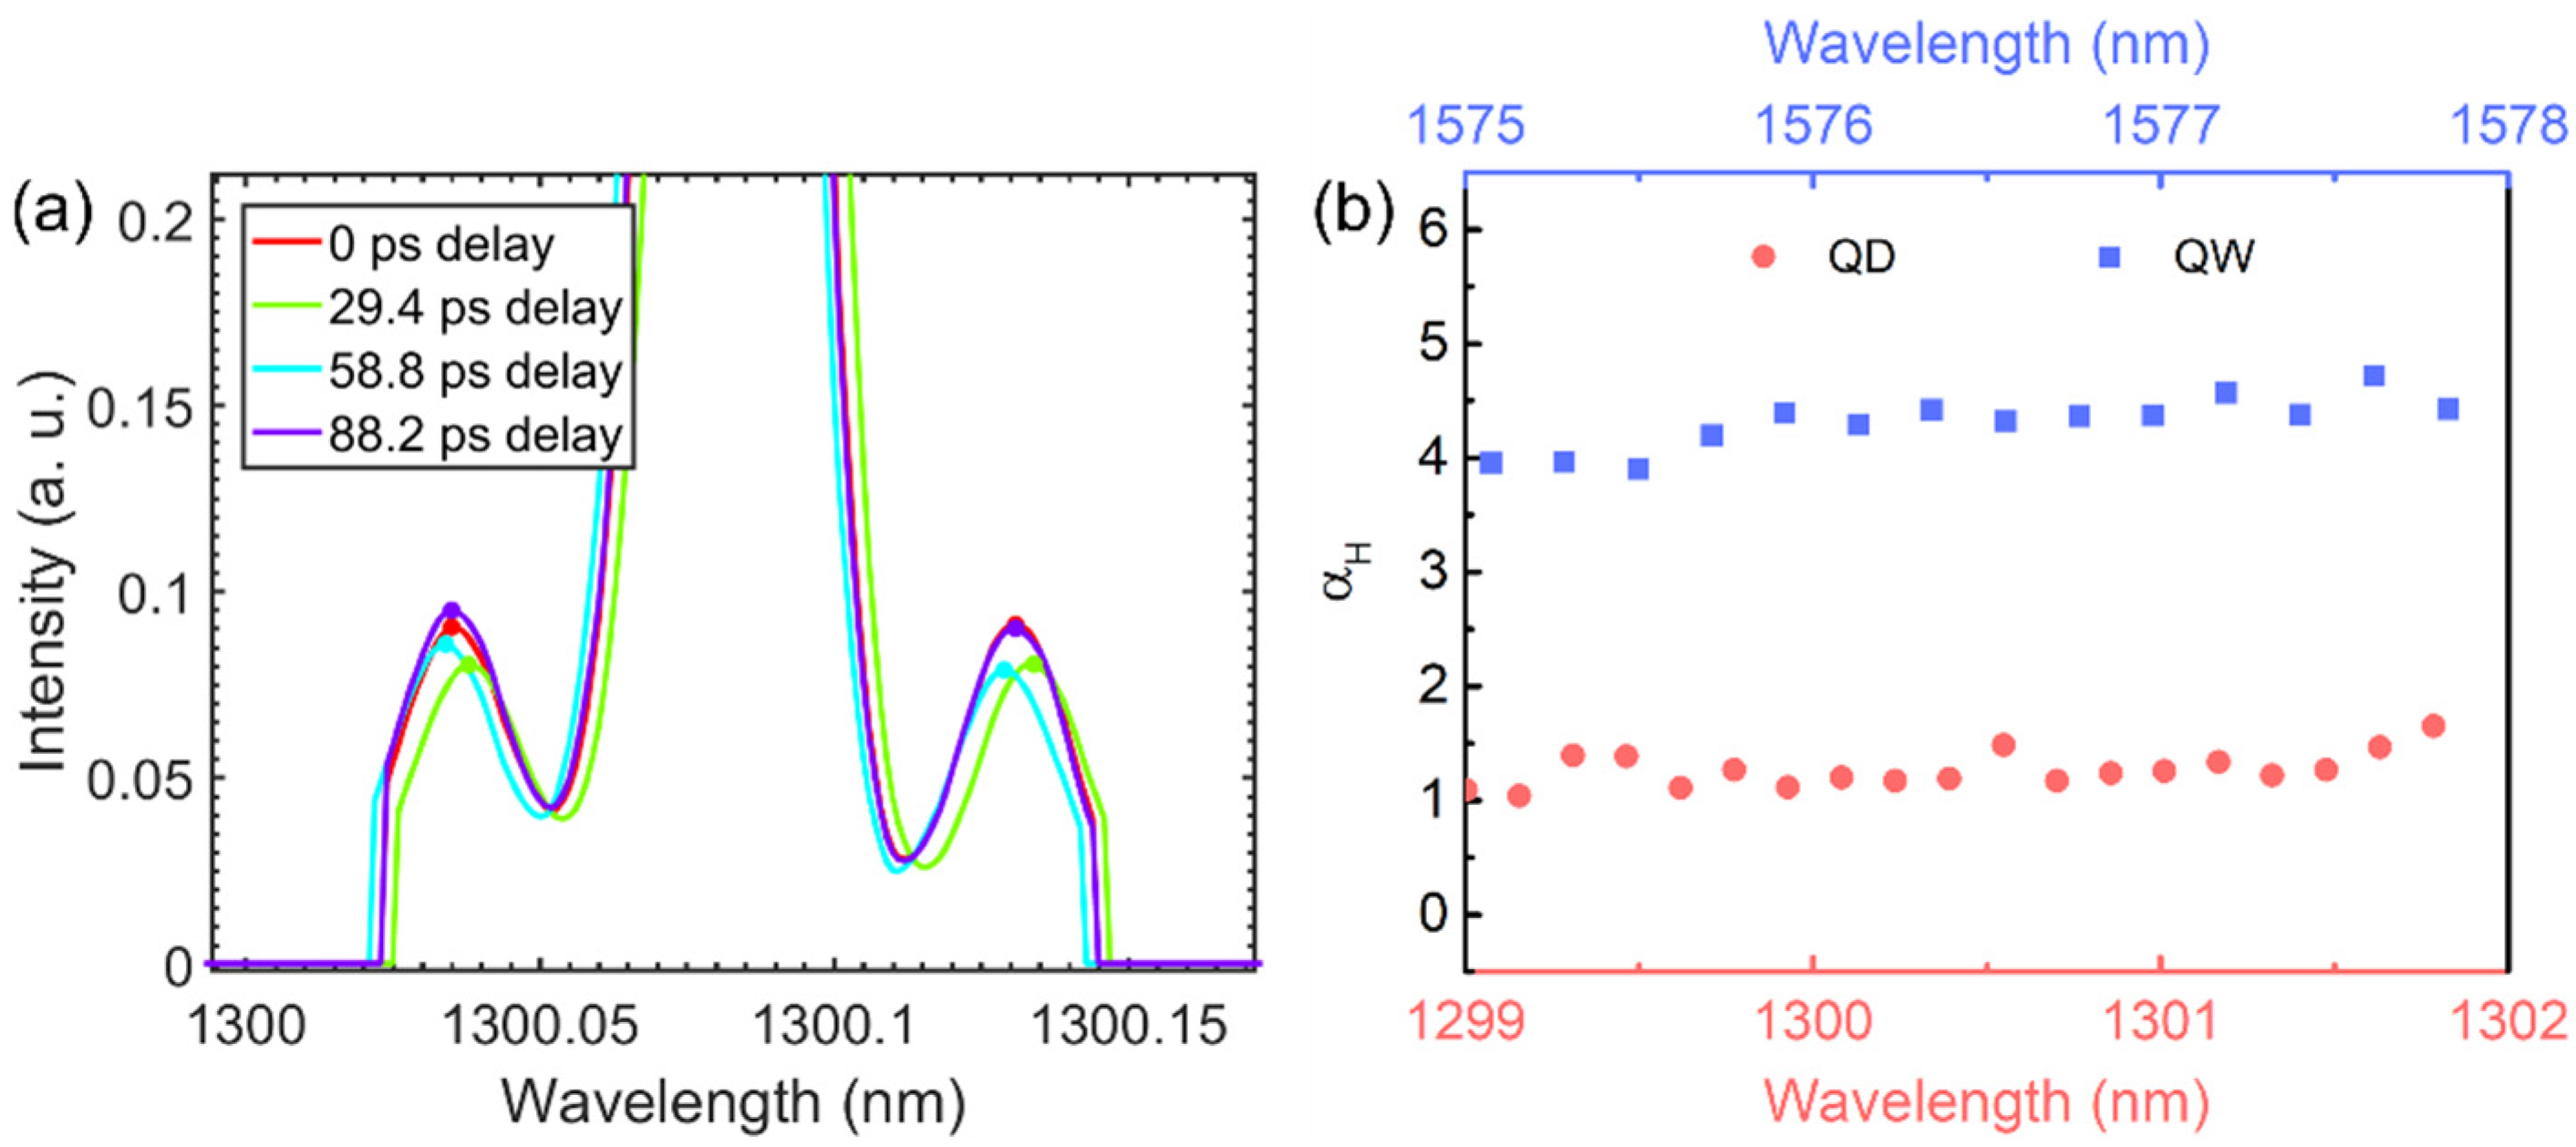
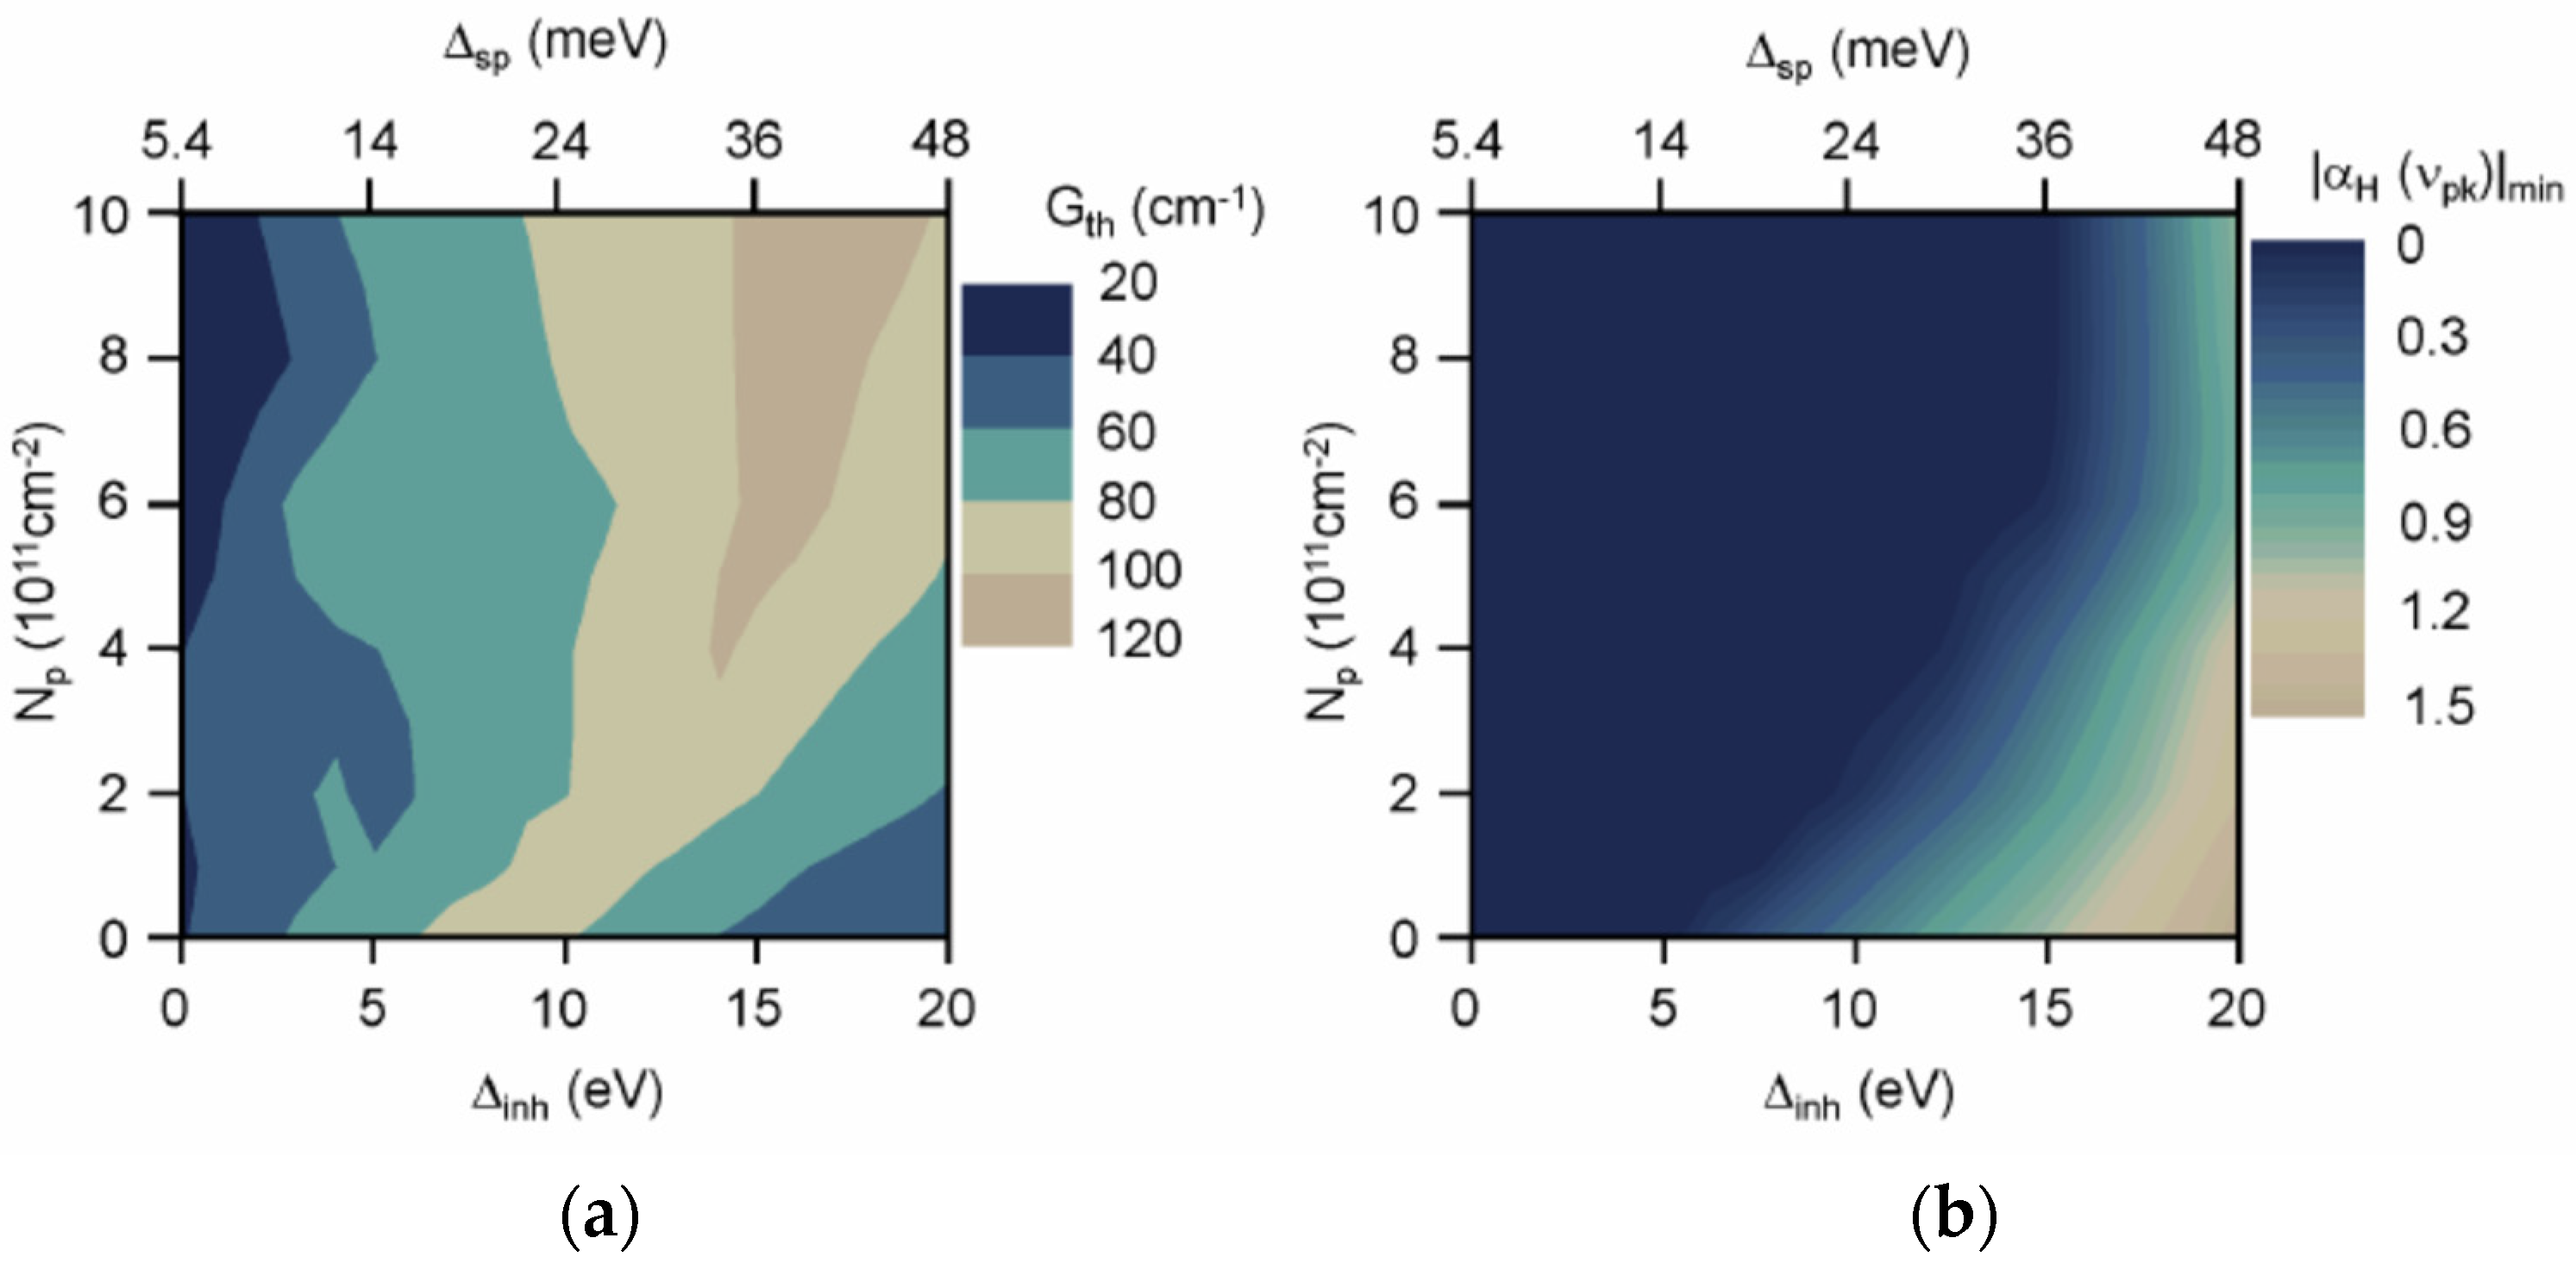
3.3. Linewidth Enhancement Factor

Amplitude phase coupling, namely, the dynamic change of the active medium refractive index in relation to changes in the gain, commonly characterized by the linewidth enhancement factor (αH factor) reflects a basic characteristics of semiconductor lasers. It is associated with several basic characteristics of the QD laser, such as linewidth, conversion efficiency of four-wave mixing and other nonlinear properties [33]. Let us stress that in our model, described in the previous sections, the contributions to the alpha factor, i.e., the real and imaginary parts of the active medium’s susceptibility, come out of the perturbation analysis in the form of the frequency pulling and linear gain, respectively. There are several ways to measure the αH-factor. Typically, the αH-factor is extracted using peak shift and intensity change to reflect the dynamics of the refractive index and gain change, which we call the amplified spontaneous emission (ASE) method [34]. While this method can extract the spectral dependence of the αH-factor, it is fundamentally restricted to the ASE regime and cannot be used to extract the αH-factor above the threshold current. Alternatively, an interferometric method relying on a Mach–Zehnder interferometer and optical injection locking can be used to extract an αH-factor above the threshold current, but both can only be applied to single-mode lasers [34]. The effective extraction of an αH-factor above the threshold current of a multimode laser helps to analyze the nonlinear dynamics with the current or wavelength. In this study, the phase modulation (PM) method is used to obtain information on the longitudinal modes of a multimode laser in order to extract an αH-factor above the threshold value [35]. Recently, the αH-factor of the quantum cascade laser was also extracted using this method [36].
In what follows, the effects of different modulation frequencies on the αH-factor are measured on a silicon-based FP QD laser. In order to confirm the advantages of such lasers, we also compare the αH-factor results with those obtained from quantum well lasers heterogeneously grown on silicon. The experimental set-up for optical phase modulation is shown in Figure 9. The QD laser was kept at an operating temperature of 30 °C during the test. The laser maintains a bias current of twice the threshold value. The two RF signals (fm) are split by the RF power divider (RFPS) and then modulate both the QD laser and the phase modulator (PM). In order to operate the laser in a small signal modulation range, the sinusoidal signal applied to the QD laser needs to be controlled by an RF attenuator. A bias tee (BT) channels the direct current pumping and RF signal transmission. Once the laser is running, the beam travels through an optical delay line (ODL) and is fed to a phase modulator to control the delay between the optical and electrical signals. With this method, an optical spectrum analyzer (OSA) records spectra at four different delays (1/(4fm)) to extract the αm-factor, which is related to the modulation frequency. These are the normalized spectra for four different delays at a modulation frequency of 8.5 GHz, as shown in Figure 10a.
The αm-factor can be obtained by extracting the intensity of the side modes using the phase modulation method [7]. The relationship between the αH-factor and the corner frequency (fc), modulation frequency (fm) and αm-factor is αm = αH [1 + (fc/fm)2]1/2 [34]. Thus, we obtain the spectral dependence αm at different modulation frequencies from 6.5 GHz to 8.5 GHz. From the above equation, the corner frequency fc ~21 GHz >> fm is calculated. Then, the αH-factor is obtained from the above equation. The spectral dependence of the αH-factor extracted for 19 longitudinal modes near the gain peak is illustrated with the red dots in Figure 10b. The αH-factor of this silicon-based epitaxial QD laser exhibits values ranging between 1.0 and 1.6 across the entire optical spectrum at twice the threshold current. Interestingly, we can compare such values with those measured on a QW laser heterogeneously grown on silicon. We observe that the αH-factor extracted from the ASE at the threshold is more than three times larger than that of the QD laser measured well above the threshold. The asymmetric variation of the gain and refractive index of the quantum well in relation to the carriers does contribute to the widely varying αH-factor, and optimizing the material and structural parameters of QD lasers has the potential to obtain an αH-factor close to zero [37]. Therefore, we can conclude that silicon-based QD lasers have much better physical parameters thanks to the near-zero αH-factor offered by the QDs, hence offering multiple ways for developing highly performing OFC generators.
In a two-section laser, there is flexibility in increasing the saturable absorption to compensate for dispersion. With a single-section laser, the ability to increase the relative phase angle terms to increase mode locking is constrained because they couple strongly to other gain medium nonlinearities, such as mode competition. This leaves reducing dispersion as the only avenue.
Fortunately, with quantum dots, the carrier-induced refractive index may be minimized with the laser design. Experiments and calculations with the linewidth enhancement factor αH found that QD lasers may be configured to operate with vanishingly small carrier-induced refractive index changes. The mapping shown in Figure 11a depicts the threshold gain at gain peak Gth as a function of the inhomogeneous width Δinh and the p-dope density Np. The corresponding mapping of the minimum linewidth enhancement factor at gain peak | α H ( υ p k ) | m i n with the same combinations is shown in Figure 11b. The calculated results show that a sizable region with a zero linewidth enhancement factor at the gain peak for combinations of inhomogeneous linewidth, p-dope density and threshold gain are reachable by present QD lasers.

4. Conclusions

In conclusion, QDs exhibit a strong potential to serve as the gain medium for on-chip laser sources. Benefiting from the quantized density of states, the QD laser has superior performance compared to QW solutions. The experiments reveal a higher FWM conversion efficiency, a lower linewidth enhancement factor and a lower GVD, which makes the QD lasers appear to be promising for self-mode-locked pulse production and high-bandwidth optical frequency comb generation. Given the results reported in this article, applications ranging from silicon-based photonic integrated circuits to integrated quantum technologies could benefit from the high-performance self-assembled semiconductor QDs.
A motivation of this review is to explain the multimode interactions that have significant roles in the mode locking of both single- and two-section lasers. Gain saturation and mode competition determine the number of modes above the lasing threshold and, hence, the maximum frequency comb bandwidth and minimum mode-locked pulse duration. Wave mixing provides the mode-locking mechanism, and its strength determines the closeness one obtains to transform-limited performance. One of our purposes is to describe the underlying physics for the general audience. Hence, we left out much of the details involving the calculations of coefficients and input parameters, which may be found in the cited publications. It is fortuitous that a mature and rigorous theory already exists for describing multimode laser physics. To go a step further, this paper discusses the application of multimode laser physics to semiconductor mode-locked lasers. Therefore, we reviewed experimental and modeling results that help distinguish the different multimode contributions, trace the physical sources (all arising with the leading term being FWM) and show device examples where the contributions may differ in strengths. As a consequence, this study paves the way for developing single-section QD lasers on silicon with remarkable RF linewidth. Last but not least, the switch from the typical time domain mode-locking treatment back to a frequency domain that was used first in mode-locking investigations may be of interest to three different audiences. One is laser device engineers, where the connection of laser performance to band structure provided by multimode laser theory is useful for designing devices. The second is the atomic, molecular and optical (AMO) community, who can see the laser physics it pioneered used in manufacturing millions of lasers per year. The third is the complex dynamics researchers, because instances of complex dynamics, such as dynamical instabilities and chaos, are very much a part of mode-locked lasing. With this invited paper, scientists, researchers and engineers can obtain a good sense of the utilizations of semiconductor QD technology for mode-locking applications.

Author Contributions

Conceptualization, F.G. and W.W.C.; methodology, F.G., W.W.C. and B.D.; software, W.W.C.; validation, W.W.C.; formal analysis, W.W.C.; investigation, B.D. and S.D.; resources, W.W.C. and B.D.; data curation, W.W.C. and B.D.; writing—original draft preparation, F.G., W.W.C., B.D., S.D., H.H. and J.B.; writing—review and editing, F.G., W.W.C., B.D. and J.B.; visualization, F.G.; supervision, F.G.; project administration, F.G., J.B. and W.W.C.; funding acquisition, F.G., J.B. and W.W.C. All authors have read and agreed to the published version of the manuscript.

Funding

The research is supported in part by the Center for Integrated Nanotechnologies (CINT) through user proposals. The authors also acknowledge funding from the DARPA PIPES contract HR0011-19-C-0083 and the Institut Mines-Télécom.

Informed Consent Statement

Not applicable.

Data Availability Statement

All relevant data are available from the authors upon reasonable request.

Acknowledgments

The authors thank Songtao Liu, Justin Norman, and Mario Dumont for fabrication assistance and useful discussions. Special thanks to H. Debregeas from Almae Technologies in France for providing the QW laser structure.

Conflicts of Interest

The authors declare no conflict of interest.

References

  1. Cheng, Q.; Bahadori, M.; Glick, M.; Rumley, S.; Bergman, K. Recent advances in optical technologies for data centers: A review. Optica 2018, 5, 1354–1370. [Google Scholar] [CrossRef]
  2. Liang, D.; Bowers, J.E. Recent Progress in Heterogeneous III-V-on-Silicon Photonic Integration. Light Adv. Manuf. 2021, 2, 59–83. [Google Scholar] [CrossRef]
  3. Chang, L.; Liu, S.; Bowers, J.E. Integrated optical frequency comb technologies. Nat. Photonics 2022, 16, 95–108. [Google Scholar] [CrossRef]
  4. Diddams, S.; Vahala, K.; Udem, T. Optical frequency combs: Coherently uniting the electromagnetic spectrum. Science 2020, 369, 6501. [Google Scholar] [CrossRef]
  5. Marsh, J.H.; Lianping, H. Mode-locked laser diodes and their monolithic integration. IEEE J. Sel. Top. Quantum Electron. 2017, 23, 1–11. [Google Scholar] [CrossRef] [Green Version]
  6. Udem, T.; Holzwarth, R.; Hänsch, T.W. Optical frequency metrology. Nature 2002, 416, 233–237. [Google Scholar] [CrossRef]
  7. Umar Piracha, M.; Nguyen, D.; Mandridis, D.; Yilmaz, T.; Ozdur, I.; Ozharar, S.; Delfyett, P.J. Range resolved lidar for long distance ranging with sub-millimeter resolution. Opt. Express 2010, 18, 7184–7189. [Google Scholar] [CrossRef] [Green Version]
  8. Newman, Z.L.; Maurice, M.; Drake, T.; Stone, J.R.; Briles, T.C.; Spencer, D.T.; Connor, F.; Li, Q.; Westly, D.; Ilic, B.R.; et al. Architecture for the photonic integration of an optical atomic clock. Optica 2019, 6, 680–685. [Google Scholar] [CrossRef] [Green Version]
  9. Lee, A.D.; Jiang, Q.; Tang, M.; Zhang, Y.; Seeds, A.J.; Liu, H. InAs/GaAs quantum-dot lasers monolithically grown on Si, Ge, and Ge-on-Si substrates. IEEE J. Sel. Top. Quantum Electron. 2013, 19, 1901107. [Google Scholar] [CrossRef]
  10. Liu, A.Y.; Chong, Z.; Norman, J.; Snyder, A.; Lubyshev, D.; Fastenau, J.M.; Liu, A.W.K.; Gossard, A.C.; Bowers, J.E. High performance continuous wave 1.3 μm quantum dot lasers on silicon. Appl. Phys. Lett. 2014, 104, 041104. [Google Scholar] [CrossRef]
  11. Bassem, T.; Kurczveil, G.; Zhang, C.; Descos, A.; Huang, Z.; Beling, A.; Campbell, J.C.; Liang, D.; Beausoleil, R.G. Indium arsenide quantum dot waveguide photodiodes heterogeneously integrated on silicon. Optica 2019, 6, 1277–1281. [Google Scholar]
  12. Norman, J.C.; Jung, D.; Zhang, Z.; Wan, Y.; Liu, S.; Shang, C.; Herrick, R.W.; Chow, W.W.; Gossard, A.C.; Bowers, J.E. A review of high-performance quantum dot lasers on silicon. IEEE J. Quantum Electron. 2019, 55, 1–11. [Google Scholar] [CrossRef]
  13. Duan, J.; Zhou, Y.; Dong, B.; Huang, H.; Norman, J.C.; Jung, D.; Zhang, Z.; Wang, C.; Bowers, J.E.; Grillot, F. Effect of p-doping on the intensity noise of epitaxial quantum dot lasers on silicon. Opt. Lett. 2020, 45, 4887–4890. [Google Scholar] [CrossRef] [PubMed]
  14. Duan, J.; Huang, H.; Dong, B.; Norman, J.C.; Zhang, Z.; Bowers, J.E.; Grillot, F. Dynamic and nonlinear properties of epitaxial quantum dot lasers on silicon for isolator-free integration. Photonics Res. 2019, 7, 1222–1228. [Google Scholar] [CrossRef]
  15. Dong, B.; Chen, J.D.; Lin, F.Y.; Norman, J.C.; Bowers, J.E.; Grillot, F. Dynamic and nonlinear properties of epitaxial quantum-dot lasers on silicon operating under long-and short-cavity feedback conditions for photonic integrated circuits. Phys. Rev. A 2021, 103, 033509. [Google Scholar] [CrossRef]
  16. Liu, S.; Wu, X.; Jung, D.; Norman, J.C.; Kennedy, M.J.; Tsang, H.K.; Gossard, A.C.; Bowers, J.E. High-channel-count 20 GHz passively mode-locked quantum dot laser directly grown on Si with 4.1 Tbit/s transmission capacity. Optica 2019, 6, 128–134. [Google Scholar] [CrossRef] [Green Version]
  17. Duan, J.; Chow, W.W.; Dong, B.; Huang, H.; Liu, S.; Norman, J.C.; Bowers, J.E.; Grillot, F. Enhanced optical nonlinearities in epitaxial quantum dots lasers on silicon for future photonic integrated systems. arXiv 2021, arXiv:2106.10871. [Google Scholar]
  18. Galan, M.; Chang, L.; Steiner, T.J.; Bowers, J.E. Chip-scale nonlinear photonics for quantum light generation. AVS Quantum Sci. 2020, 2, 041702. [Google Scholar]
  19. Haus, H.A. Theory of mode locking with a fast saturable absorber. J. Appl. Phys. 1975, 46, 3049. [Google Scholar] [CrossRef] [Green Version]
  20. Lamb, W.E., Jr. Theory of an optical maser. Phys. Rev. 1964, 134, A1429. [Google Scholar] [CrossRef]
  21. Sargent, M., III; Scully, M.O.; Lamb, W.E., Jr. Laser Physics; Addison-Wesley: Reading, MA, USA, 1974. [Google Scholar]
  22. Chow, W.W.; Liu, S.; Zhang, Z.; Bowers, J.E.; Sargent, M. Multimode description of self-mode locking in a single-section quantum-dot laser. Opt. Express 2020, 28, 5317. [Google Scholar] [CrossRef] [PubMed]
  23. Adler, R. A Study of Locking Phenomena in Oscillators. Proc. IRE 1946, 34, 351–357. [Google Scholar] [CrossRef]
  24. Skauli, T.; Kuo, P.S.; Vodopyanov, K.L.; Pinguet, T.J.; Levi, O.; Eyres, L.A.; Harris, J.S.; Fejer, M.M.; Gerard, B.; Becouarn, L.; et al. Improved dispersion relations for GaAs and applications to nonlinear optics. J. Appl. Phys. 2003, 94, 6447–6455. [Google Scholar] [CrossRef]
  25. Chow, W.W.; Koch, S.W. Semiconductor-Laser Fundamentals: Physics of the Gain Materials; Springer Science & Business Media: Berlin, Germany, 1999. [Google Scholar]
  26. Chow, W.W.; Jahnke, F. On the physics of semiconductor quantum dots for applications in lasers and quantum optics. Prog. Quantum Electron. 2013, 37, 109–184. [Google Scholar] [CrossRef]
  27. Liu, S.; Jung, D.; Norman, J.C.; Kennedy, M.J.; Gossard, A.C.; Bowers, J.E. 490 fs pulse generation from passively mode-locked single section quantum dot laser directly grown on on-axis GaP/Si. Electron. Lett. 2018, 54, 432–433. [Google Scholar] [CrossRef]
  28. Poole, P.J.; Lu, Z.; Liu, J.; Barrios, P.; Mao, Y.; Liu, G. A Performance Comparison Between Quantum Dash and Quantum Well Fabry-Perot Lasers. IEEE J. Quantum Electron. 2021, 57, 1–7. [Google Scholar] [CrossRef]
  29. Kippenberg, T.; Holzwarth, J.R.; Diddams, S.A. Microresonator-based optical frequency combs. Science 2011, 332, 555–559. [Google Scholar] [CrossRef] [PubMed]
  30. Jiao, Z.; Zhang, R.; Zhang, X.; Liu, J.; Lu, Z. Modeling of single-section quantum dot mode-locked lasers: Impact of group velocity dispersion and self-phase modulation. IEEE J. Quantum Electron. 2013, 49, 1008–1015. [Google Scholar] [CrossRef]
  31. Jimyung, K.; Myoung-Taek, C.; Delfyett, P.J. Pulse generation and compression via ground and excited states from a grating coupled passively mode-locked quantum dot two-section diode laser. Appl. Phys. Lett. 2006, 89, 261106. [Google Scholar]
  32. Rafailov, E.U.; Cataluna, M.A.; Sibbett, W. Mode-locked quantum-dot lasers. Nat. Photonics 2007, 1, 395–401. [Google Scholar] [CrossRef]
  33. Grillot, F.; Norman, J.C.; Duan, J.; Zhang, Z.; Dong, B.; Huang, H.; Chow, W.W.; Bowers, J.E. Physics and applications of quantum dot lasers for silicon photonics. Nanophotonics 2020, 9, 1271–1286. [Google Scholar] [CrossRef]
  34. Provost, J.G.; Grillot, F. Measuring the chirp and the linewidth enhancement factor of optoelectronic devices with a Mach–Zehnder interferometer. IEEE Photonics J. 2011, 3, 476–488. [Google Scholar] [CrossRef]
  35. Provost, J.G.; Martinez, A.; Shen, A.; Ramdane, A. Single step measurement of optical transmitters Henry factor using sinusoidal optical phase modulations. Opt. Express 2011, 19, 21396–21403. [Google Scholar] [CrossRef]
  36. Opacak, N.; Pilat, F.; Kazakov, D.; Cin, S.D.; Ramer, G.; Lendl, B.; Capasso, F.; Schwarz, B. Spectrally resolved linewidth enhancement factor of a semiconductor frequency comb. Optica 2021, 8, 1227–1230. [Google Scholar] [CrossRef]
  37. Chow, W.W.; Zhang, Z.; Norman, J.C.; Liu, S.; Bowers, J.E. On quantum-dot lasing at gain peak with linewidth enhancement factor αH = 0. APL Photonics 2020, 5, 026101. [Google Scholar] [CrossRef]
Figure 1. Mode-locked (a) frequency comb and (b) pulse train.
Applsci 12 03504 g001
Figure 2. (a) Effects of dispersion on the passive cavity modes. Numerical integration of Adler’s equation giving time evolution of (b) beat-note difference ( ψ ˙ 1 ψ ˙ 0 ) ( ψ ˙ 0 ψ ˙ 1 ) and (c) corresponding phase difference ( ψ 1 ψ 0 ) ( ψ 0 ψ 1 ) . The parameters are a = 4.4 MHz, b = 1.0 MHz and 5.0 MHz (solid and dashed curves, respectively).
Applsci 12 03504 g002
Figure 3. (a) Beat-note showing a lock band for modes −5 ≤ n ≤ 5 with locking coefficient b = 5.0 MHz and dispersion from GaAs [24]. The dashed curve shows the beat-notes with b = 0. (b) Intensity ( | n E n c o s [ ψ n ( t ) ] | 2 ) versus time showing progression towards transform-limited pulse train (blue dotted curves) with b increasing from 5 MHz to (c) 6 MHz and (d) 7 MHz.
Applsci 12 03504 g003
Figure 4. Experimental setup for nondegenerate four-wave mixing experiments. PC, polarization controller.
Applsci 12 03504 g004
Figure 5. Four-wave mixing efficiency with the frequency detuning in the Stokes condition Δ υ 300   GHz for the QD (burgundy) and for the QW (jade) laser. The calculated values are a solid line, and the experimental measurements are given by triangles.
Applsci 12 03504 g005
Figure 6. (a) RF spectrum and (b) mode-locked pulse from theory (solid black curves) and experiment (solid red curves). The frequency and time are referenced to the peak values. The dashed blue curve in (b) shows the transform-limited pulse based on the lasing bandwidth.
Applsci 12 03504 g006
Figure 7. (a) Effects of mode locking on beat-notes. The solid black curve is the beat-notes spread over the lasing spectrum (thin black curve). The red dotted curve is the variation in beat-note in the absence of mode locking. The solid gray curve is the mode intensities. (b) The red dotted curve is the total variation in beat-notes (same as in a). The contributions to it are from the GaAs waveguide (solid black curve) and InAs QD carrier-induced refractive index change (blue dashed curve).
Applsci 12 03504 g007
Figure 8. Optical spectrum (blue) and corresponding free spectral range (FSR) as a function of the longitudinal mode frequency (red) for (a) QD and (b) QW laser. The red solid lines are guiding lines for the FSR variation. Both devices operate at twice the threshold current.
Applsci 12 03504 g008
Figure 9. Schematics of the experimental set-up of optical phase modulation method. RFPS, radio-frequency power divider; BT, bias tee; ODL, optical delay line; PM, phase modulator; OSA, optical spectrum analyzer.
Applsci 12 03504 g009
Figure 10. (a) Normalized spectra of one longitudinal mode under four delays for the QD laser; (b) spectral dependence of the αH-factor measured for both QD (red) and QW (blue) lasers.
Applsci 12 03504 g010
Figure 11. (a) Combinations of inhomogeneous width, p-dope density and threshold gain for lasing at gain peak with minimum absolute value of αH. (b) Minimum absolute value of αH at gain peak resulting from operating with combinations in Figure 7a. Reprinted with permission from Ref. [37].
Applsci 12 03504 g011
Publisher’s Note: MDPI stays neutral with regard to jurisdictional claims in published maps and institutional affiliations.

