Article

Text Mining from Free Unstructured Text: An Experiment of Time Series Retrieval for Volcano Monitoring

by
Margherita Berardi
1,*,
Luigi Santamaria Amato
1,
Francesca Cigna
2,3,
Deodato Tapete
2 and
Mario Siciliani de Cumis
1,*
1
Italian Space Agency (ASI), Space Center “G. Colombo”, Località Terlecchia s.n.c., 75100 Matera, Italy
2
Italian Space Agency (ASI), Via del Politecnico s.n.c., 00133 Roma, Italy
3
Institute of Atmospheric Sciences and Climate (ISAC), National Research Council (CNR), Via del Fosso del Cavaliere 100, 00133 Roma, Italy
*
Authors to whom correspondence should be addressed.
Appl. Sci. 2022, 12(7), 3503; https://doi.org/10.3390/app12073503
Submission received: 21 February 2022 / Revised: 26 March 2022 / Accepted: 28 March 2022 / Published: 30 March 2022
(This article belongs to the Special Issue Data Mining and Machine Learning in Multimedia Databases)

Abstract

:
Volcanic activity may influence climate parameters and impact people safety, and hence monitoring its characteristic indicators and their temporal evolution is crucial. Several databases, communications and literature providing data, information and updates on active volcanoes worldwide are available, and will likely increase in the future. Consequently, information extraction and text mining techniques aiming to efficiently analyze such databases and gather data and parameters of interest on a specific volcano can play an important role in this applied science field. This work presents a natural language processing (NLP) system that we developed to extract geochemical and geophysical data from free unstructured text included in monitoring reports and operational bulletins issued by volcanological observatories in HTML, PDF and MS Word formats. The NLP system enables the extraction of relevant gas parameters (e.g., SO2 and CO2 flux) from the text, and was tested on a series of 2839 daily and weekly bulletins published online between 2015 and 2021 for the Stromboli volcano (Italy). The experiment shows that the system proves capable in the extraction of the time series of a set of user-defined parameters that can be later analyzed and interpreted by specialists in relation with other monitoring and geospatial data. The text mining system can potentially be tuned to extract other target parameters from this and other databases.

1. Introduction

Volcanic activity may influence climate parameters and impact people safety via direct and cascading effects and processes (e.g., the recent Hunga-Tonga-Hunga-Ha’apai eruption and the induced tsunami in Tonga; the eruption of the Cumbre Vieja volcano on the island of La Palma that caused lava to reach the Atlantic Ocean and the consequent release of toxic gases). For this reason, integrated systems for volcanic-related parameter monitoring based on satellite Earth observation tools, airborne sensors and ground instrument networks are of fundamental importance to achieve a comprehensive understanding of volcanic processes (e.g., [1,2]).
Volcano monitoring datasets are not always publicly and openly accessible, though some of such information is included in periodic communications, bulletins and websites focusing on specific volcanoes worldwide. Geoscientists often have access to more reports than they can reasonably read, so they are commonly challenged in screening and filtering through reports to find relevant information. Often, these reports are collected in specialized geoscience databases; however, these may lack semi-automated services to access and retrieve specific information of interest. In this regard, the geoscience literature has become a big data “mineral resource” for text mining algorithms, and the development of automatic extraction techniques is increasingly accelerating [3,4].
The scope of this work is to investigate how text mining can relieve geoscientists of time-consuming manual reading and dataset creation tasks. In particular, we refer to a kind of workflow where scholars and specialists are involved in reading and tagging a small portion of the dataset of interest to train the algorithm, and then let the text mining method perform the rest on the whole dataset.
Text mining [5] can be defined as “the discovery by computer of new, previously unknown information, by automatically extracting information from different resources”. Information extraction (IE) is a field of text mining and involves the extraction of specific, structured information and predefined relations, as opposed to text mining, which involves the discovery of general, unsuspected information and new relations [6]. In this sense, IE can be considered a subfield of text mining, and IE activities may be successfully conducted through text mining techniques. In terms of input, IE assumes the existence of a set of documents, each following a template, i.e., describes one or more entities or events in a manner that is similar to those in other documents but differing in the details [7]. Generally, IE activity concerns processing human language texts by means of natural language processing (NLP) techniques, such as named entity recognition (NER), which involves determining the parts of a text that can be identified and categorized into pre-defined categories (i.e., entities) [8]. An output of this process is a structured database resulting from the analysis of the corpus of reports, and collecting the recognizing entities and their values (Figure 1).
Application of IE to scientific literature is a very active field of computer science. Several software and algorithms have been developed for the automated extraction of named entities from text [9]. Less attention has been paid to geological literature, though machine analysis approaches for geological documents exist and are attracting a growing interest across the community. For example, PaleoDeepDive [10] is a statistical machine reading and learning system to automatically find and extract the occurrence of fossil data from the scientific literature. It locates and extracts text, tables and figures in publications and performs compilations of structured paleontological data. In [11], the authors present a novel method for the machine reading of a stratigraphic database and published literature to find the occurrence of stromatolites in North America over geological timeline. Geological knowledge graph construction from Chinese geoscience literature has been investigated in [12]. A workflow to extract prospecting information by text mining based on convolutional neural networks in text on mineral deposits is reported in [13]. GeoDocA [14] is a geological document analysis system that applies automated text analysis techniques to assist geologists in browsing large repositories of documents and searching for documents based on relevant geological contents. It extracts and interactively visualizes contents within a report, identifies similar reports, assists the search using the auto-completion of search terms based on learnt key word associations, and extracts and visualizes figures and tables. As a last example, GNER is a framework for geologically named entity recognition using deep learning [15]. To the best of the authors’ knowledge, as of today, there is no evidence of IE applications or software for volcanological applications in the specialist literature.
In our work, we build upon existing IE approaches, with the aim to dig into the textual databases of daily and weekly bulletins that are regularly published on Stromboli volcanic activity by the National Institute of Geophysics and Volcanology (INGV) [16] and the Laboratory of Experimental Geophysics (LGS) at the Department of Earth Sciences of the University of Florence (UNIFI) [17]. Both INGV and LGS maintain volcano activity databases for Stromboli that are accessible online and contain monitoring information of different nature, such as seismic, clinometric, geochemical and geodetic. After the definition of a set of parameters of interest, the proposed NLP system aims to automatically extract measured values and their temporal characterization from text. As the output, the time series of parameters can be generated and subsequently analyzed by specialists.
In this paper, we describe the NLP system that we developed to extract geochemical and geophysical data from monitoring bulletins. The system is able to extract relevant gas parameters from free unstructured text, and can potentially be tuned for other target parameters and other databases on the web. The system generates a structured database of user-defined relevant parameters, which are thus made accessible for further use (e.g., for volcanological studies aiming to investigate the volcano behavior through a long time series of observations and data).

2. Materials and Methods

2.1. Data

Input of the proposed system is the set of textual reports produced by the two above mentioned research institutes starting from 2015 and until April 2021. The corpus consists of 2839 daily and weekly bulletins, i.e., 2562 by LGS (Table 1) and 277 by INGV (Table 2). Reports are available by URLs (uniform resource locator), and so, by means of web browsers or client applications, it is possible to access data through suitable queries.
INGV reports [16] contain values on the number of very long period (VLP) events, VLP amplitude, explosion-quake amplitude, volcanic tremor, thermal activity (using data acquired by Terra/Aqua’s MODerate resolution Imaging Spectroradiometer—MODIS, Sentinel-2’s MultiSpectral Instrument—MSI, and Sentinel-3’s Sea and Land Surface Temperature Radiometer—SLSTR), SO2 flux, CO2 flux and C/S ratio. LGS reports [17] contain information on the number of VLP events and VLP amplitude, amplitude of seismic tremor, amplitude of puffing, acoustic pressure, tiltmeters, thermal activity on the basis of transients, MODIS thermal anomalies, rockfall activity, SO2 flux, CO2 flux and C/S ratio.
To each of these values corresponds a tag (i.e., volcanic parameter) defining a textual named entity (i.e., the text encoding of a parameter). Hence, the goal of the present work was to define a solution to fill a template for each named entity as formalized in the following (in Backus Normal Form—BNF notation):
    <parameter>:=
    parameter_name: “name-string”
    parameter_value: “number”*
    institute: “institute-string”
    date: “date-expr”
  detection-site: “site-expr”

2.2. Method and System

The input reports are written in different languages (Italian, English) and sometimes, from year to year, the structure of their content changes remarkably. This inherent property of the input reports represented a challenging but also interesting feature to test the proposed NPL system on, and to assess how it performs in situations when the input documents change as a reflection of a dynamic volcanological observatory monitoring activity through time.
Nevertheless, items to be tagged had approximately the same structure. In fact, the corpus was composed by similar documents, where documents contained free-text sequences but in a preformatted way. Moreover, most of the parameters useful to monitor a volcano are numeric data, and the extraction of numeric data from text is not complex enough to require building a proper NER algorithm. This encourages the use of ‘regular expressions’ (regex). A regex is basically a special character sequence that helps to match or find other strings or sets of strings using that sequence as a search pattern. Indeed, once identified, patterns may be used in a predictable manner. Regex is one of the rule-based pattern search methods in text mining, which is based on the assumption that key information to find occurs in a recurrent form [5,7]. Indeed, this method is especially suitable for contents with significant syntactic properties (such as number, date, acronym) and for information extraction tasks where contexts around the underlying fine information are not important in locating target information.
We are interested in entity recognition on two levels. The first is for recognizing mentions of parameters within text. Once the list is built, the exact matches may be sufficient, but in other cases, stemming is necessary to match the word’s base form (i.e., lemmatization). A second level of entity recognition regards numeric values jointly to measurement units. Further step is to correctly associate the occurrence of a parameter with its value and, finally, to associate the temporal dimension. The IE task we defined is expressed through the following formal relation:
Measures(parameter, value, date)
On the basis of previous assumptions and motivations, we designed and developed a NLP system implementing the following steps:
  • Corpus download and processing;
  • Manual consultation and tagging;
  • Automatic tagging and rule base refinement;
  • Parameter validation;
  • Visual exploration of time series.
The system was developed under PyCharm 2020.3 environment on Python 3.8 interpreter (up to 3.7.2 version). The system was implemented by fully exploiting Python library capabilities. A general architecture of the system is reported in Figure 2, while Figure 3 shows the workflow implemented for the text processing phase.
Reports were automatically downloaded from remote repositories and locally stored in the file system. The task was implemented thanks to the HTTP Python library requests. A query is run against the web server. The response is a web page that is parsed by the system through the lxml Python library in order to fetch the resulting list of reports. A single download request is then performed for each item in the result set, and an entry for each new download is added in the MySQL database. In particular, we stored information about file name, file typology (weekly/daily) and temporal information (i.e., publication date, volcano observation date). Reports were in different formats (PDF, MS Word, HTML) and should be converted into plain text in order to be processed. PDF reports were converted by means of the PyMuPdf and PyPdf2 libraries, HTML reports were converted through the HTML parser implemented in the BeautifulSoup library and, for MS Word reports, the system interfaced a LibreOffice module directly. Converted text was stored in the file system in the form of TXT files.
After the download phase, expert-users performed some sessions of manual consultation of text in order to: (1) define the set of categories of relevant parameters (i.e., tags); (2) gain knowledge about recurring patterns of interest and keywords identifying parameters; and (3) catch language and content structure peculiarities to incrementally draft regular expressions useful in extracting values for parameters. This was performed by using the embedded graphical user interface (GUI) developed in our system on the PyQt5 library. After the selection of the institute issuing the bulletin and the date of interest, the user may read a report content, apply regexes and refine these when the match fails.
The GUI that allows the user to easily read and test the tagging during this manual phase is reported in Figure 4.
Given the specific focus of our experiment, the set of relevant tags defined during the manual consultation of the dataset encompassed: SO2 (value number and text about the measurement unit), CO2 (value number and text about the measurement unit), C/S (mixed text and number string), VLP events of the seismic signals (mixed text and number string) and satellite thermal anomalies (value number and text about the measurement unit).
Occurrences of a given parameter name are identified by exploiting regex skill to formalize the word’s base form and catch the word’s variations on the base form (lemmatization). Once the set of rules to tag named entities is defined, rules for tagging values should be applied in co-occurrence. In this work, regular expressions were manually drafted. In particular, a subset of reports is used for manual consultation and rule base typing. For each issuing institute (INGV and LGS), this subset comprises three months per year (25% of the total dataset). The manual process of rule composition and refinement proceeds until all of the tagging cases of this subset are covered. Further support for rule accuracy is the definition of gazetteers, such as the set of measurement units.
Once the set of rules is obtained, automatic extraction can be performed on the remaining dataset through a batch procedure. The implementation exploits Python built-in regex library. The regex algorithm tracks only one transition at one step, which means that the engine checks one character at a time. It supports backtracking, that is the ability to remember the last successful position, so that it can go back and retry if needed. In this way, the regex engine does not have to go back up to the start of the string in order to retry a second alternative. This optimizes the regex match. For this reason, in order to cover language and content structure diversity, more than one pattern is defined for the same tag. In total, in this work, 24 rules were exploited to extract relevant data.
Preliminary text processing phase consists of converting reports (PDF, MS Word, HTML) to plain text and discarding figures and tables. Text is then split into sentences and sentences into tokens. In particular, the algorithm performs a line by line scanning of the text. Each line corresponds to a single sentence in order to perform the tagging task in the context of an auto-consistent sentence. The first match per parameter is retrieved and stored as the resulting value in the database, along with temporal information and the issuing institute.
Rules are ordered on the basis of a coverage accuracy criteria computed as the number of instances for which the rule predicts correctly (i.e., support of the rule). Some simple examples of rules are:
SO2←([0–9]+)[\-\se]*[0–9]*\st/d, which states that, when an integer number or a range of numbers is followed by a space and the string “t/d” (unit of measurement), then it should be marked as a SO2 value;
CO2←([0–9]+)\sg\sm-2\sd-1, which states that, when an integer number is followed by a space and the string “g m-2 d-1” (unit of measurement), then it should be marked as a CO2 value;
VLP←([0–9]+\.*[0–9]*)\events/hour, which states that, when a decimal number is followed by a space and the string “events/hour” (unit of measurement), then it should be marked as a VLP value.
The system provides an export functionality of data from the database, which allows the operator to produce time series to visually explore at different spatial and temporal granularity. In particular, time series are produced by interfacing the Vega-lite visualization tool [18], which is a high-level grammar of interactive graphics, and it is used in the back end of several data visualization systems. In our work, the system implements a component that exports data from the MySQL database into a JSON format suitable as Vega-lite input.
In Figure 4 the automatic tagging of the LGS weekly report published on 4 March 2021 is shown. In particular, Table 3 lists the number of occurrences of the selected parameter values that the system found. The parameter labelled as “MODIS” indicates the thermal anomaly intensity, measured in MW.
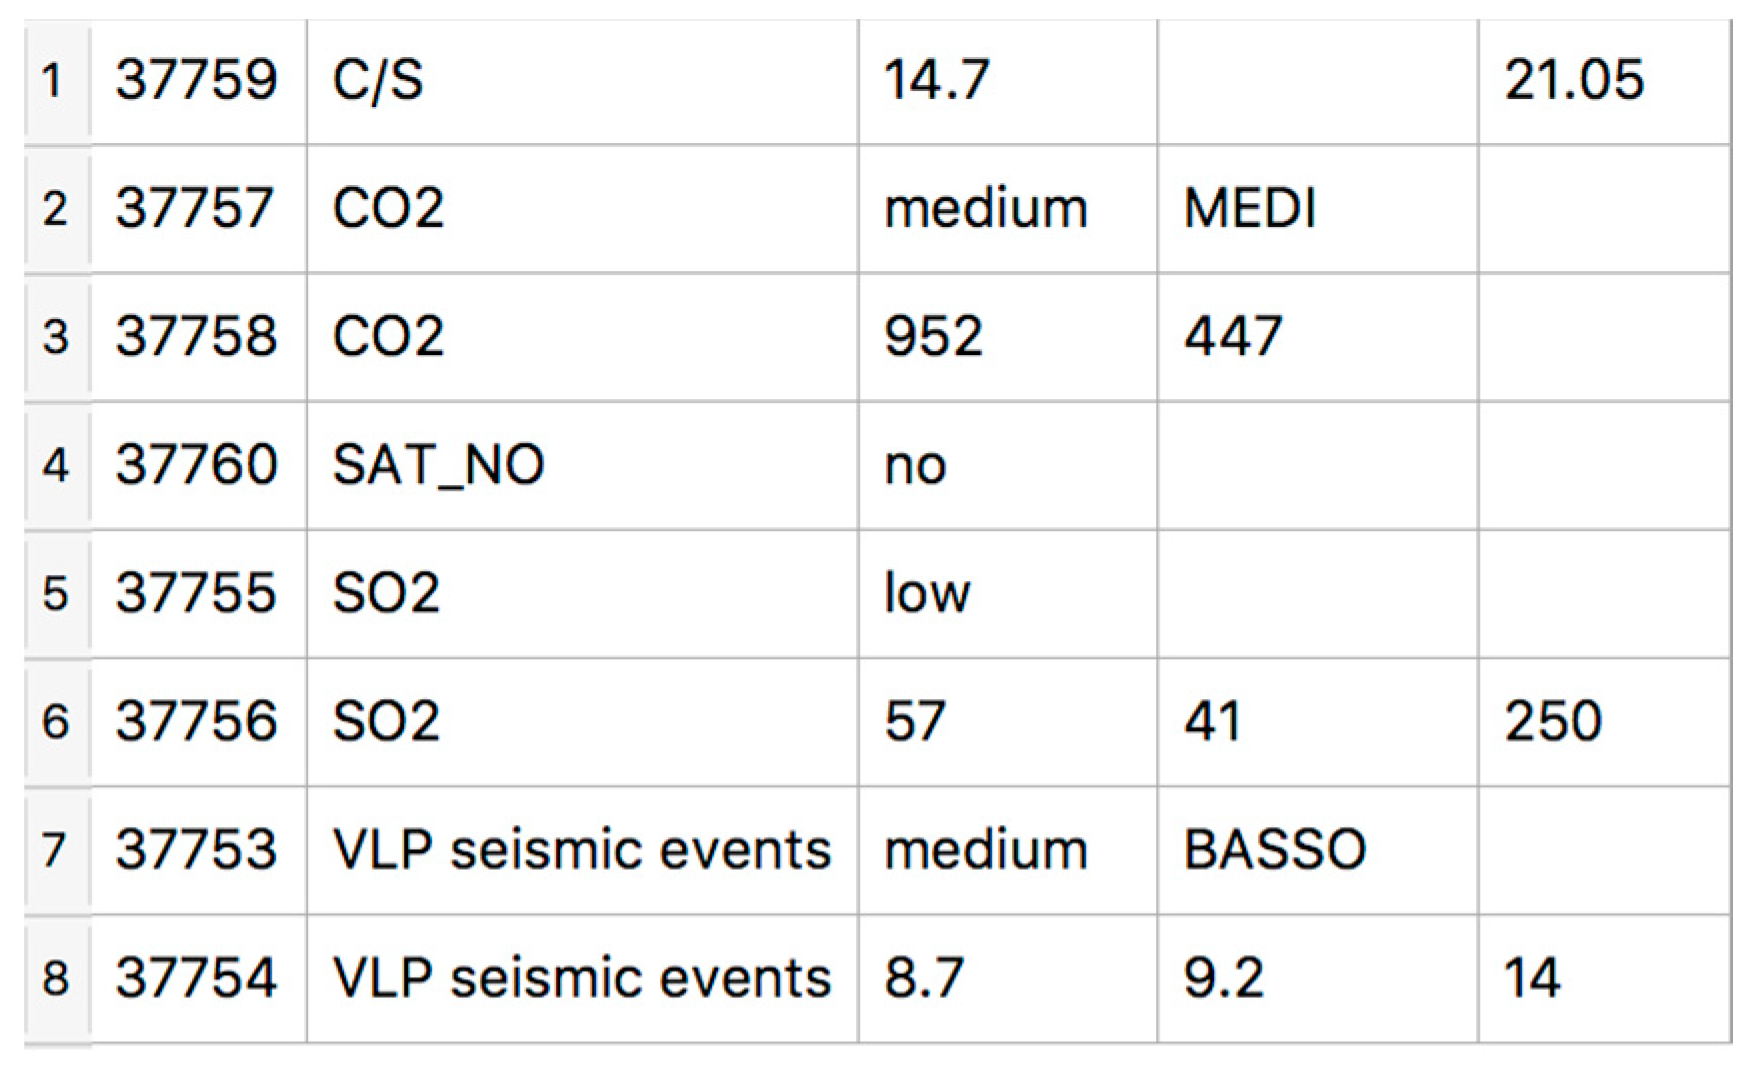
Through the GUI, users may manually modify portions of text to be tagged for a parameter, or undo a tagging operation. Results of tagging are stored in the MySQL database. In particular, tag name, tag value, tag type (i.e., quantity/quality) and reference to report id. Through the GUI, it is also possible to validate extracted information per day in order to check variability of values per issuing institute and report type (weekly/daily). For example, in Figure 5, values automatically extracted for reports available on 3 March 2021 are shown. The system found a value of 14.7 for the C/S parameter in the daily LGS bulletin and a value of 21.05 in the weekly INGV report; 952 t/d was found for the CO2 flux in the daily LGS bulletin, versus 447 t/d recorded in the weekly bulletin; for the SO2 flux, the values are 57 (daily bulletin by LGS), 41 (weekly bulletin by LGS) and 250 (weekly bulletin by INGV) t/d; for VLP, values of 8.7 (daily bulletin by LGS), 9.2 (weekly bulletin by LGS) and 14 (weekly bulletin by INGV) events/h are found.

3. Results

The dataset resulting from the automatic tagging step is composed of a total of 5017 parameter values for the LGS dataset and 669 for INGV dataset. Details are reported in Table 4 and Table 5. By exploring the dataset, we can observe that LGS texts give evidence of SO2 parameter values just starting from July 2017, whereas CO2 and C/S values start from November 2019. Most of the INGV missing values are due to text report unavailability (during July–December 2015, 2016, 2017 and 2018). The INGV CO2 parameter starting from 2019 is poorly present because the station was destroyed after the paroxysm of July 3rd. Satellite information from MODIS data actually occurs in reports starting from 2019.
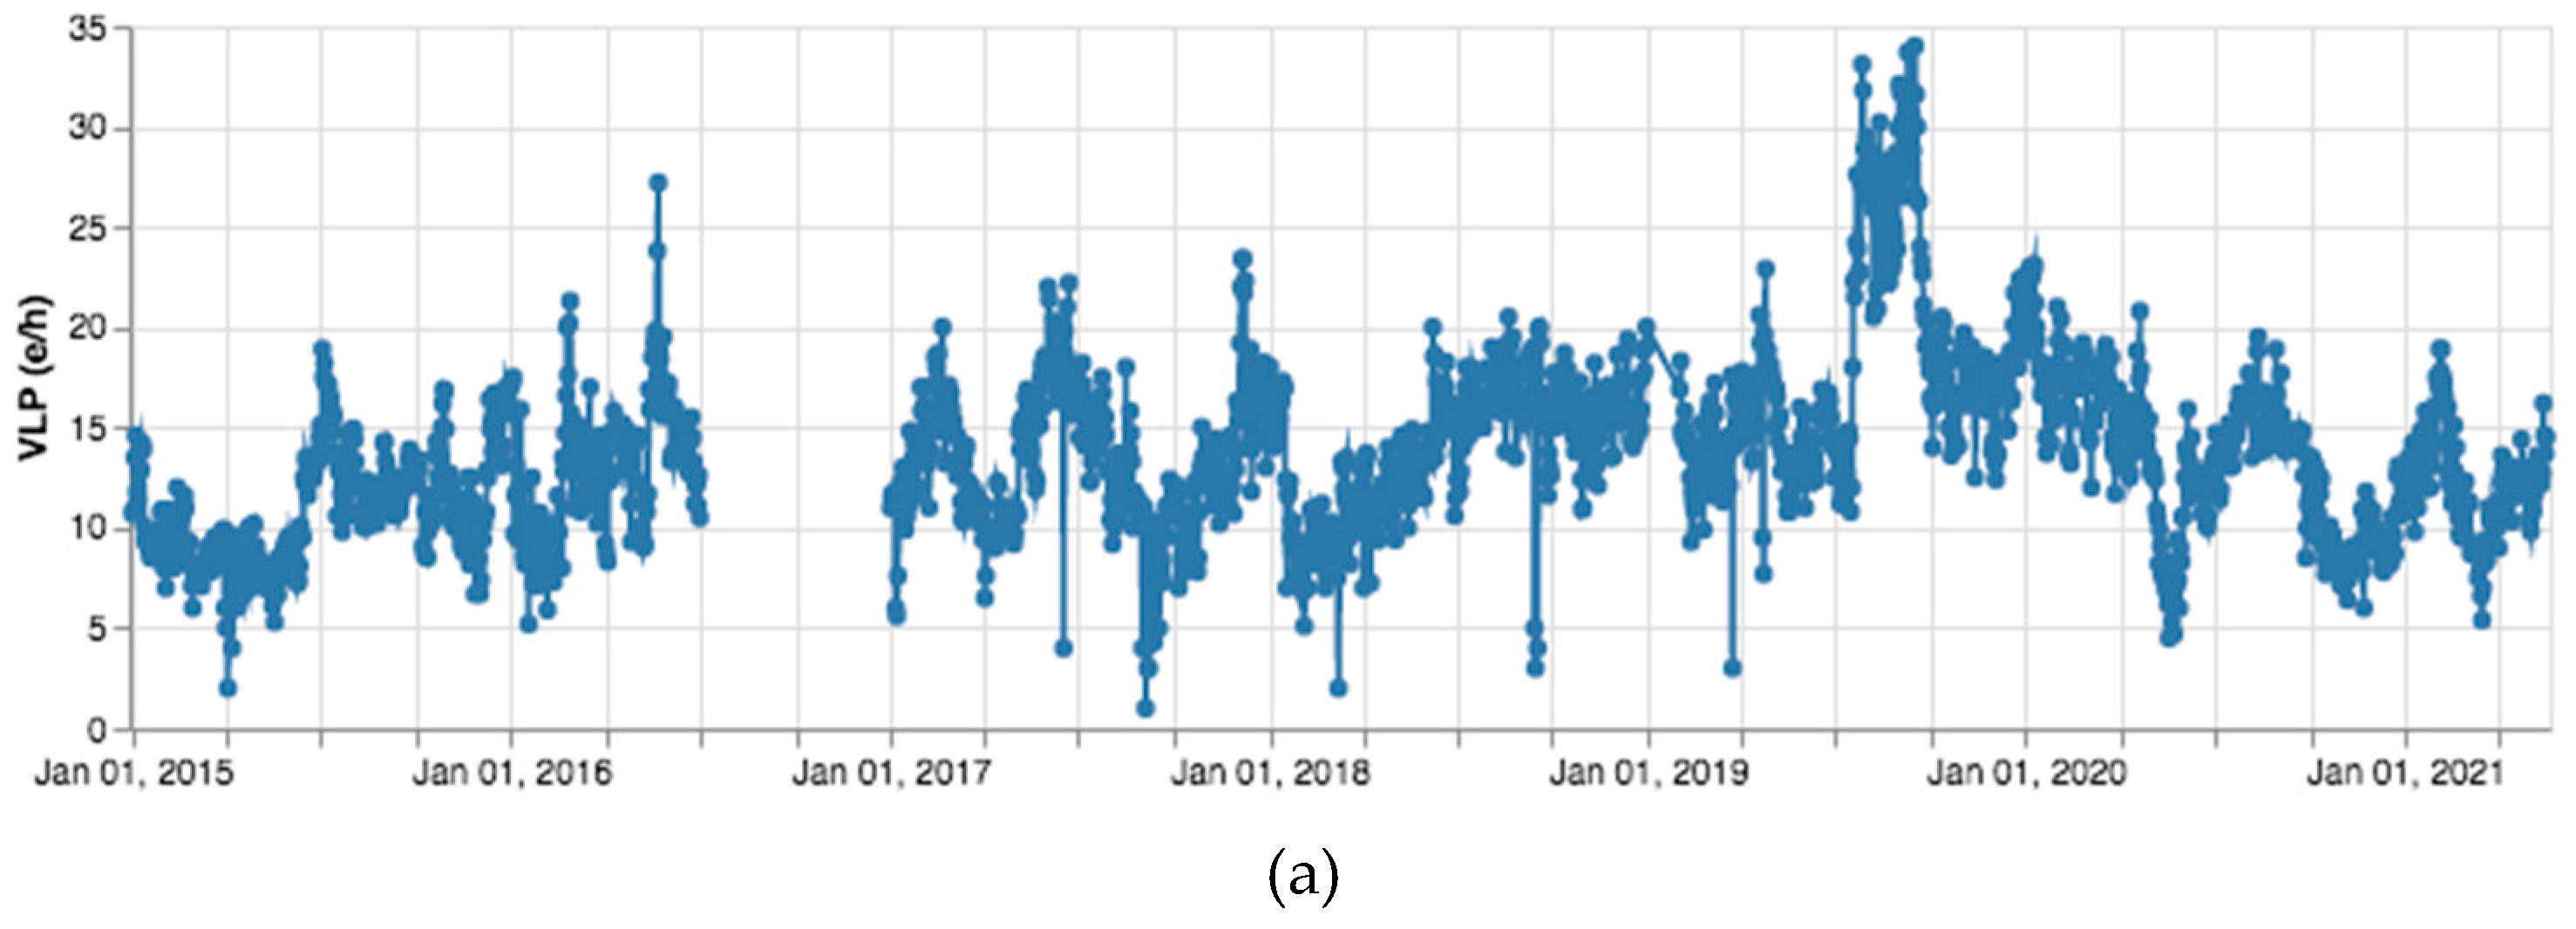
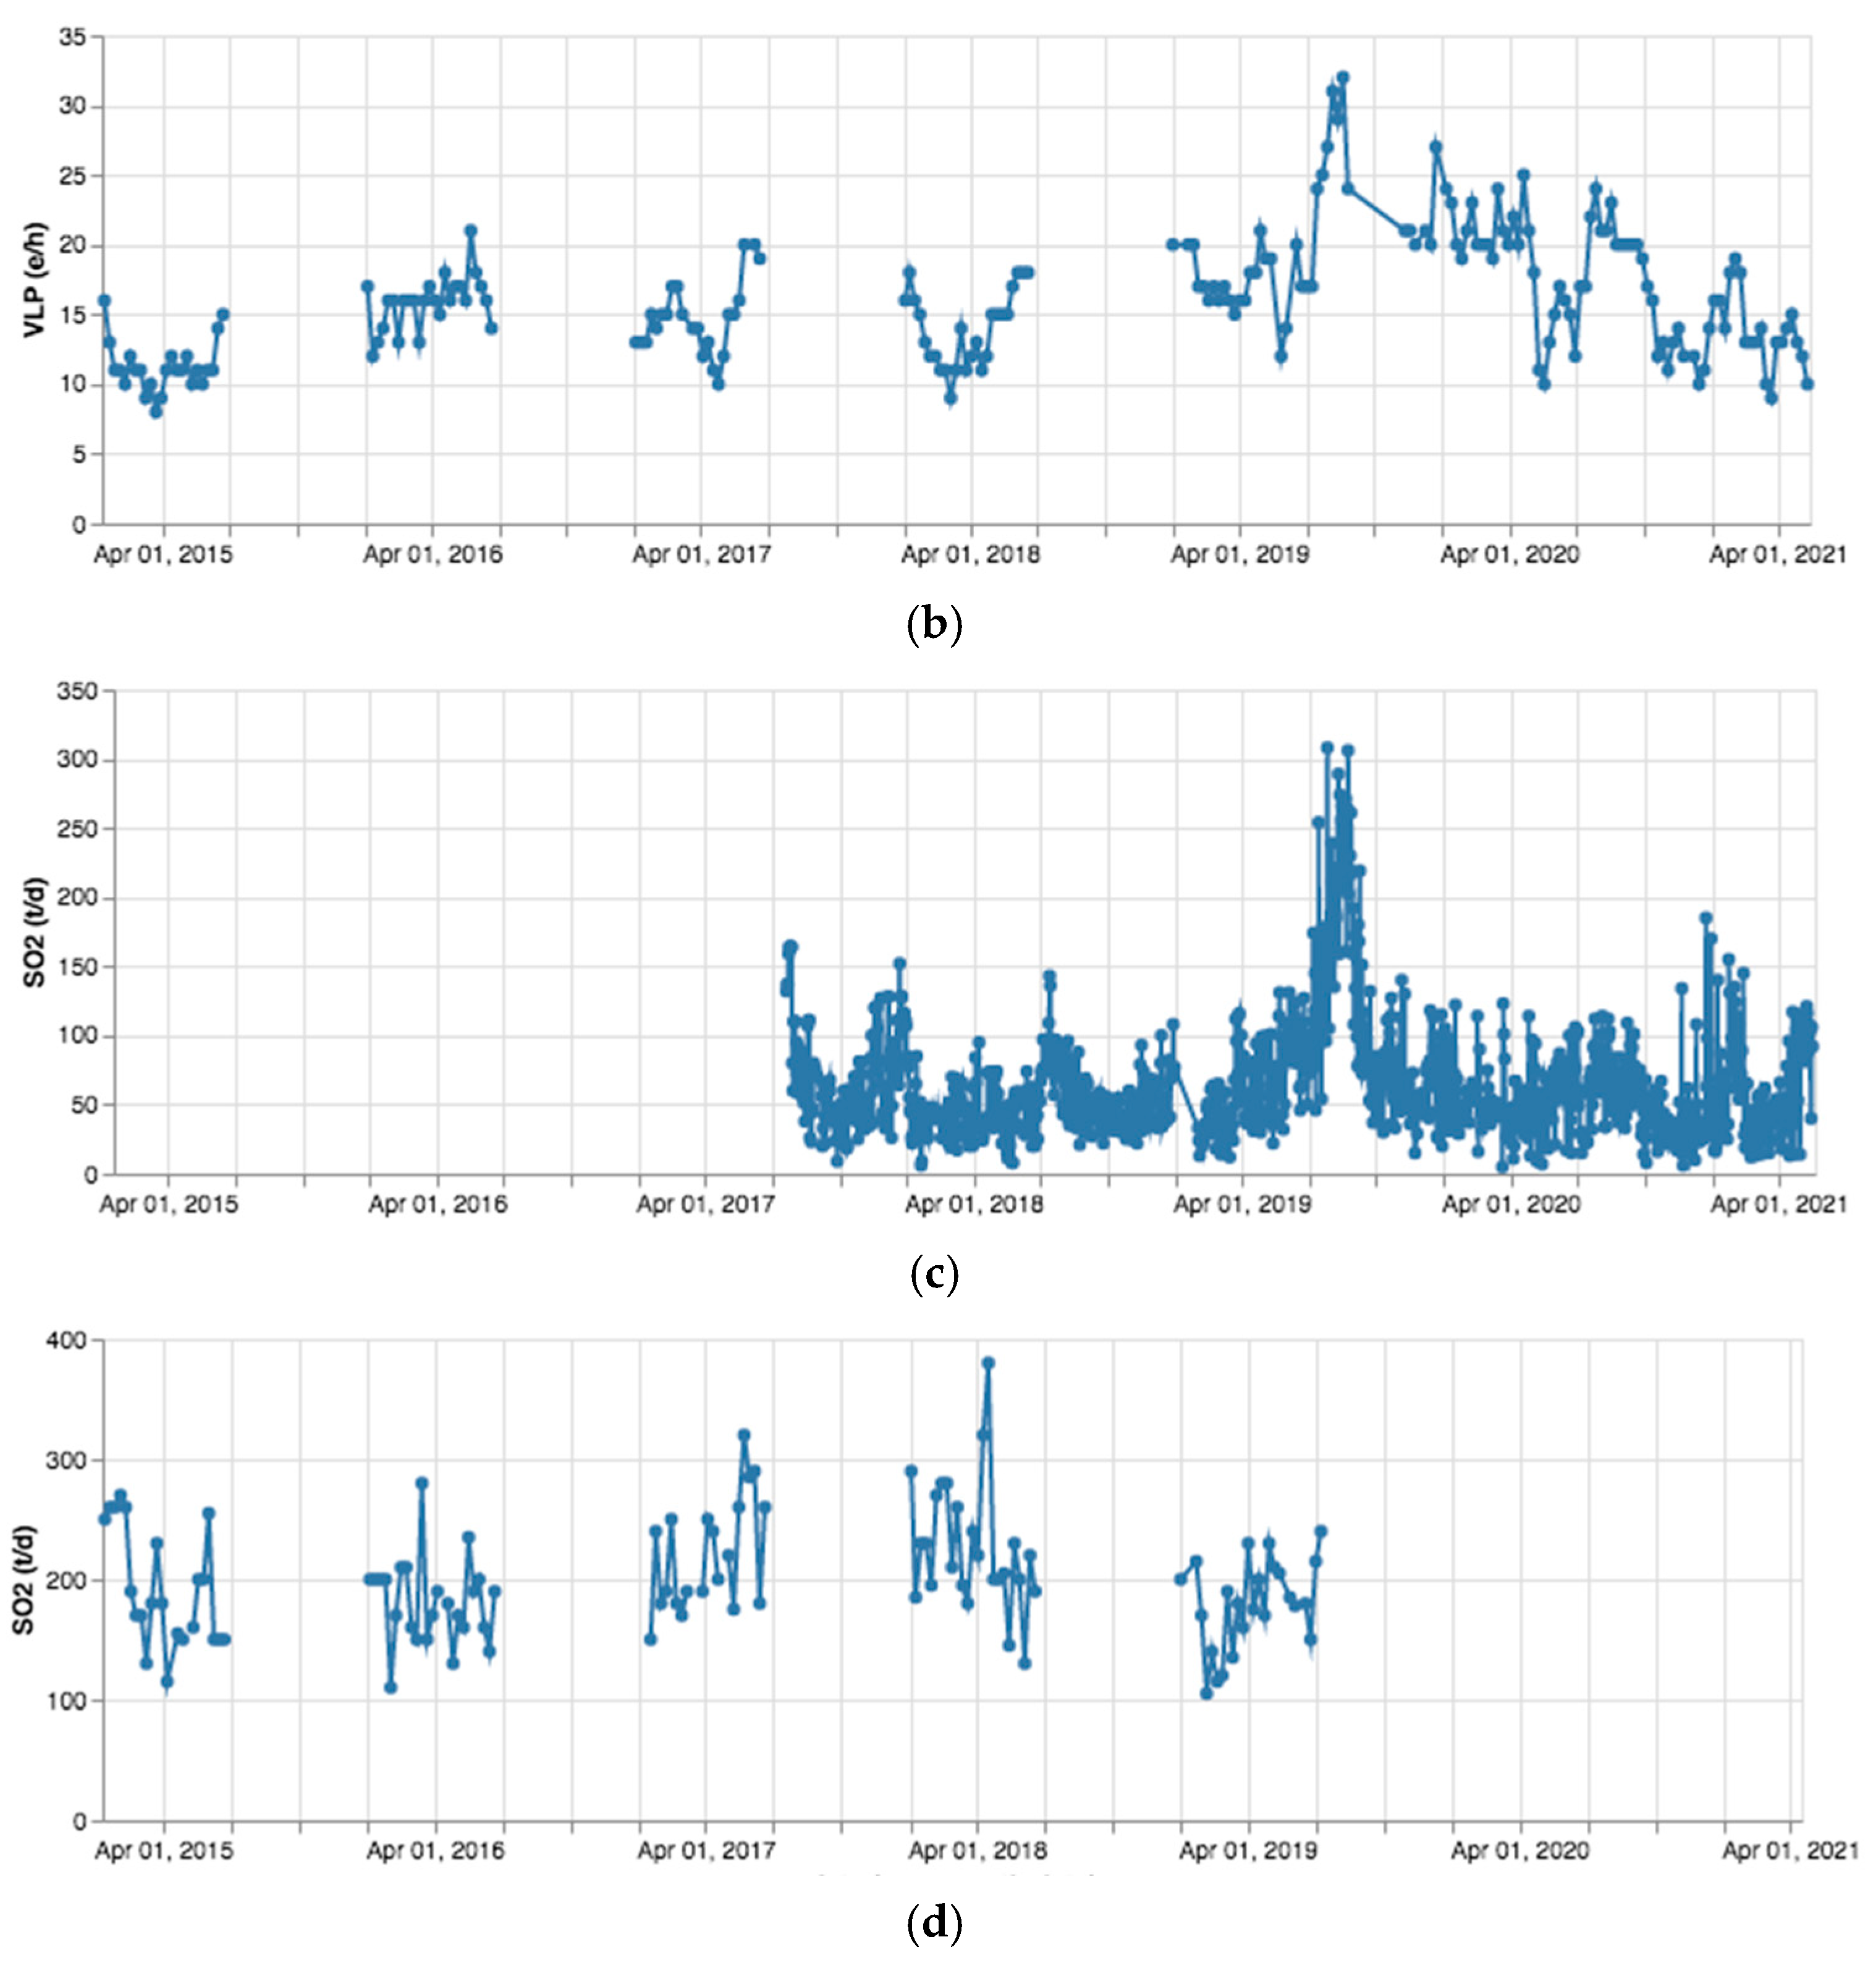
Time series for parameters concerning the whole period 2015–2021 have been generated. LGS values for daily reports (see Figure 6a,c) are considered, because these are more numerous than weekly ones. The LGS dataset presents a gap in the range July–December 2016 due to report unavailability. INGV values regard weekly reports (see Figure 6b,d). With regard to INGV, missing values are due to text report unavailability (as explained above).
In order to verify the accuracy of the automatic extraction method from a qualitative point of view, the extracted data were analyzed in the context of volcanic activity. Firstly, we performed a correlation analysis among the three main parameters: SO2, CO2 and VLP. We present results for the LGS dataset. The INGV correlation analysis dataset is omitted because of the poor availability of data.
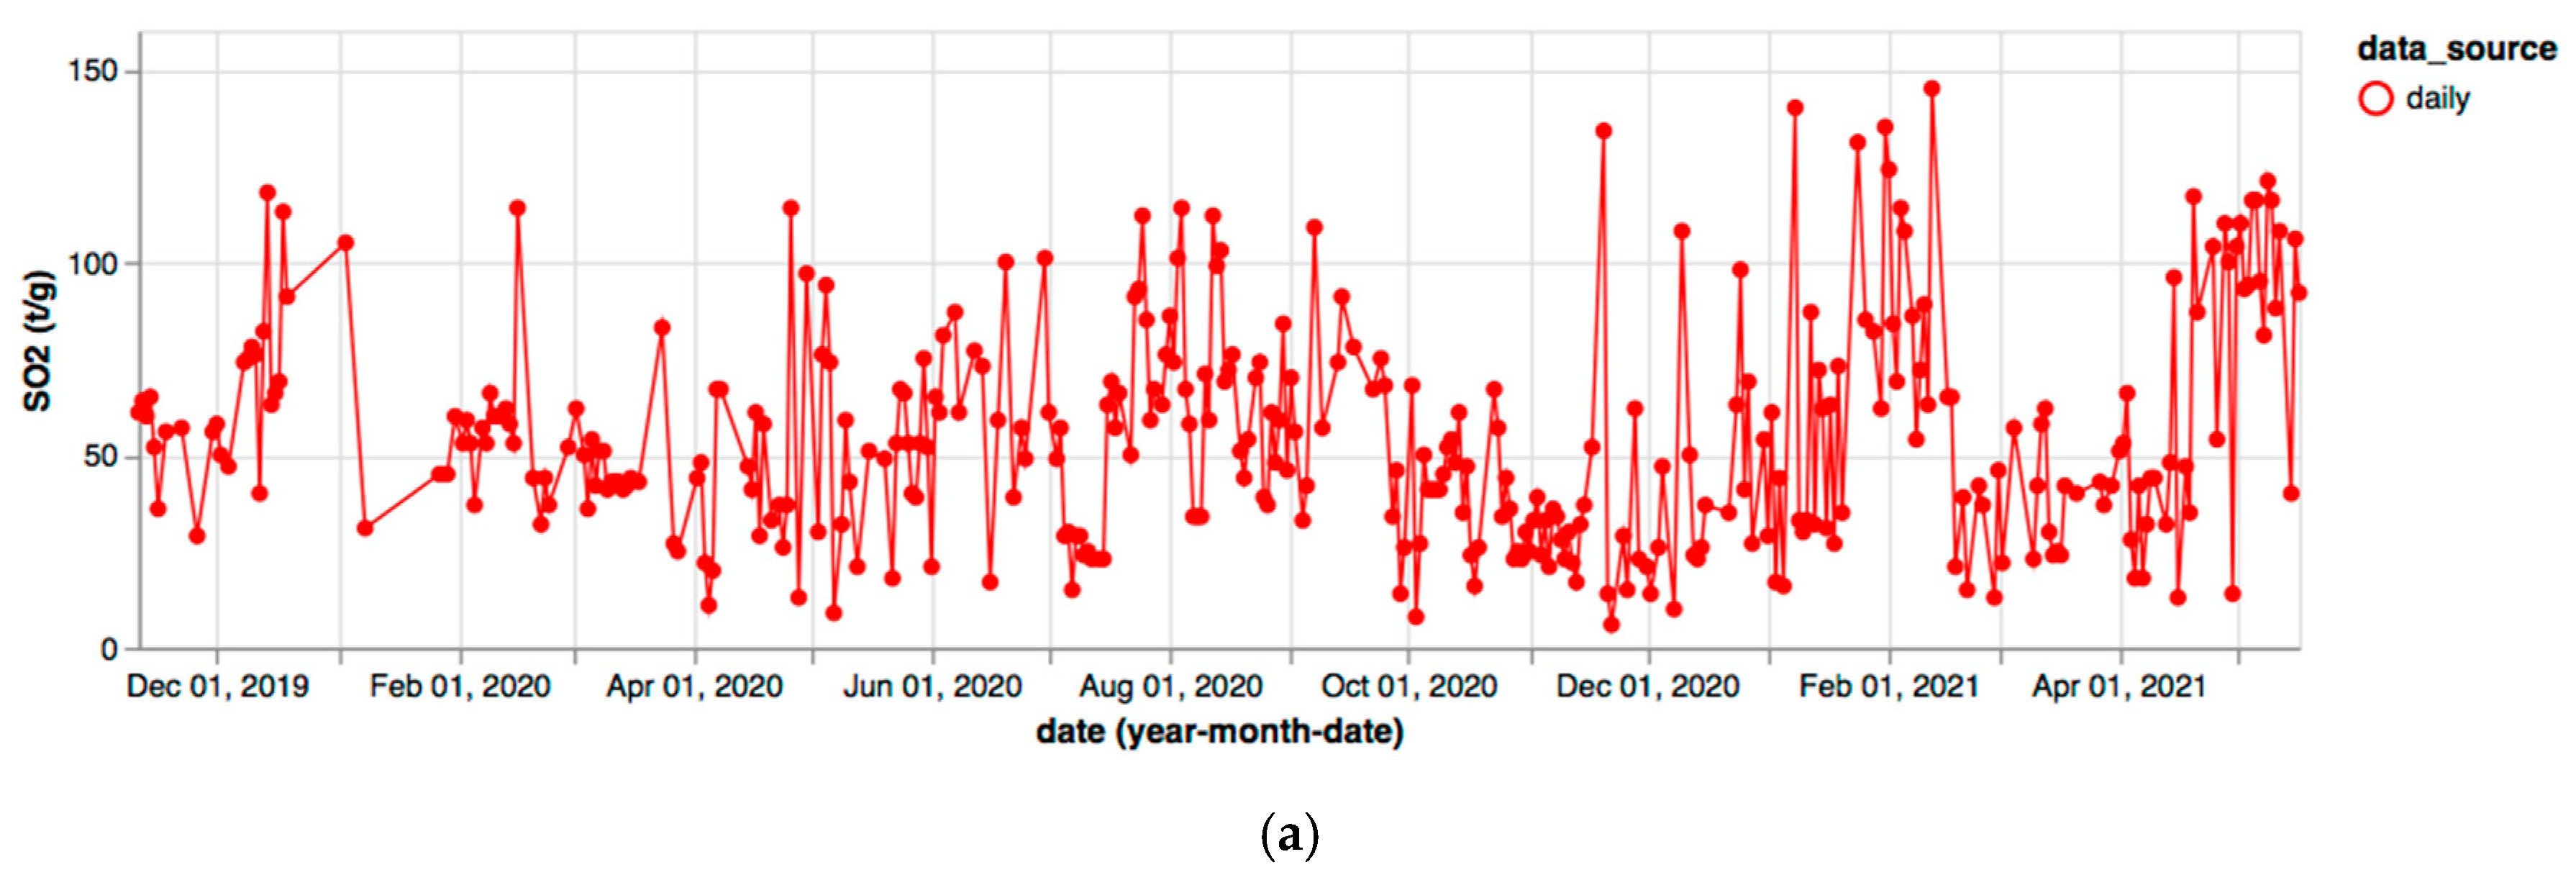
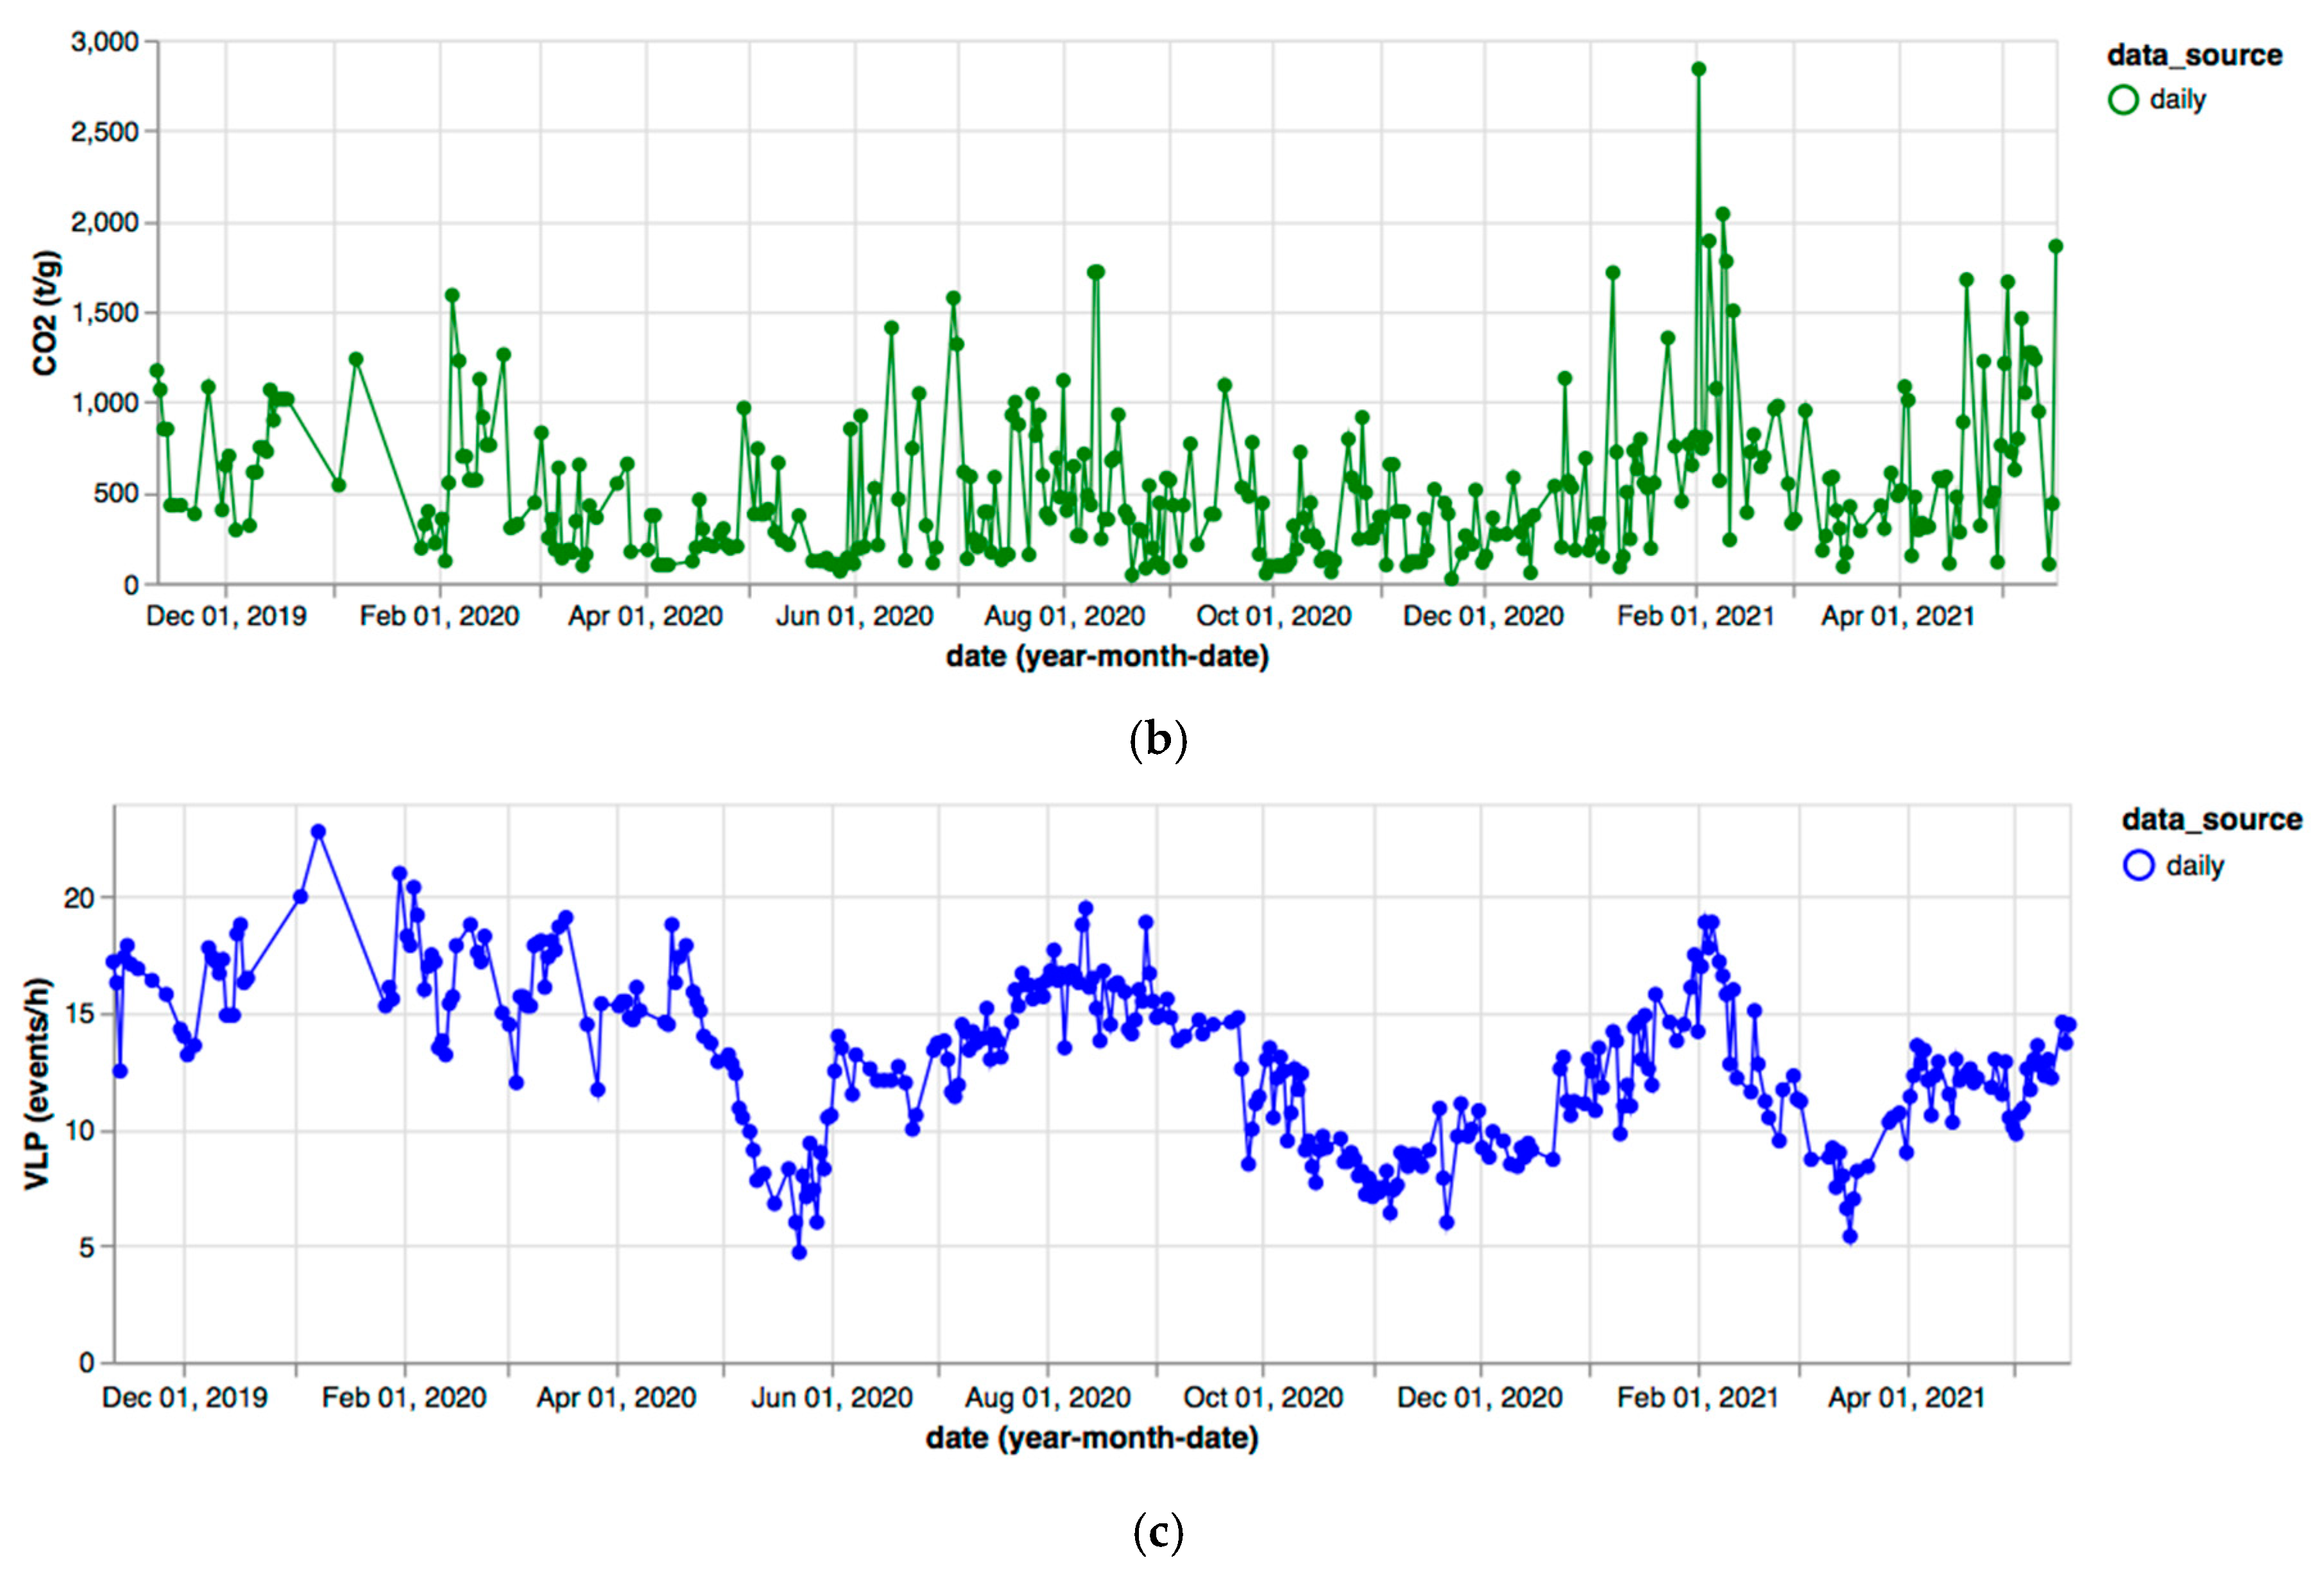
Figure 7 shows the SO2 and CO2 flux and VLP time series recorded for LGS daily in the period of November 2019–April 2021. In this time slot, a correlation analysis can be performed because the co-occurrence of values for the three parameters on the same date is highly supported.
The observable quantities, i.e., SO2 integrated mass flux and CO2 mass flux, represented in the graph show a coherent behavior over time (Figure 8).
To confirm this observation in a quantitative way, we calculated Pearson’s correlation coefficient R according to the standard definition:
R = i = 1 n x i x ¯ y i y ¯ i = 1 n x i x ¯ 2 i = 1 n y i y ¯ 2
where xi and yi are the n acquired data and x ¯ and y ¯ are their mean value.
A scatter plot for SO2 and CO2 data is reported in Figure 9, with the corresponding calculated correlation coefficient being RCO2,SO2 = 0.3036, thus indicating a positive correlation between the two variables.
In a real sample (with a finite number of datasets), R can be non-zero even if the variables are not correlated. By increasing the population, if the variables are not correlated, R will approach to zero. To understand if the value obtained for RCO2,SO2 is different from zero because of either a reduced population number or the variables are correlated, we performed a statistic simulation. We generated n = 358 (equal to the number of acquired data) pairs (CO2, SO2) randomly extracted from two Gaussian distributions having the same mean and standard deviation of the acquired data. Using the 358 extracted pairs, we calculated the corresponding correlation coefficient RCO2,SO2. The simulation (358 pairs extraction and calculation of corresponding RCO2,SO2) has been repeated 100,000 times. The histogram representing the obtained correlation is shown in Figure 10.
In the previous simulation of uncorrelated pairs (CO2, SO2), we calculated, by numerical integration, the probability p that the correlation coefficient RCO2,SO2 is 0.3036 (or larger), obtaining p < 1‰. Consequently, we can assume that the obtained value of RCO2,SO2 = 0.3036 is different from zero because of the variables correlation and not due to the sample shortage.
A similar analysis carried out on (CO2, VLP) and on (SO2, VLP) variables produced RCO2,VLP = 0.2592 and RSO2,VLP = 0.3095, respectively. Even in these cases, the probabilities of obtaining a value of correlation coefficient larger than RCO2,VLP = 0.2592 and RSO2,VLP = 0.3095 in a sample of 358 pairs of uncorrelated variables is lower than 1‰, thus confirming a correlation also for (CO2, VLP) and (SO2, VLP) value pairs.

4. Discussion

Figure 5 highlights some differences in the values provided in the two bulletins for the same parameter on the same day or same week, e.g., SO2 flux of 250 t/day in weekly INGV bulletins versus 41 t/d by LGS, and VLP of 14 events/h in weekly INGV bulletins versus 9.2 events/h reported by LGS. These differences suggest that the typology and location of the two ground-based sensor stations, as well as the reference sampling period of the bulletins, should be carefully accounted for when interpreting the extracted values. Indeed, the INGV station measures the SO2 flux through the FLAME network [19], which consists of four UV-scanning spectrometers installed near the coast of the island and intercepting the plume from a distance of 2000 m for the summit crater of Stromboli. On the other hand, LGS measures data by means of the ROC station, which is a site that allows the study of degassing activity nearer the volcano main crater, from 500 m of distance from the active vents, and also offers an optimal view of the NE sector of the crater terrace [20]. In terms of the sampling period, LGS bulletins typically refer to a Friday to Thursday weekly interval, whereas INGV data refer to Monday to Sunday intervals; hence, there is a temporal shift in the identification of the reporting weeks by the two issuing institutes.
In Figure 11, the SO2 flux measured with the FLAME network (INGV) and at the ROC site (LGS) and reported in the respective weekly bulletins published in 2019 are plotted together. The general trends characterizing the two time series are comparable. Several missing INGV values in the series are due to omissions in text reports of the July–December period.
We observe a similar trend for the SO2 flux independently of the measuring stations and their location. Moreover, seismic time series reporting the VLP parameter for the complete dataset (2015–2021) are plotted in Figure 12. Data are recorded at the STR seismo-acoustic station that is deployed close to the crater zone. The VLP parameter gives a direct measure of the explosion rate [20]. Seismic values are similar for both the sources, when available. To confirm, we calculated the Pearson’s correlation coefficient (standard definition) and obtained a 0.87 value, which demonstrates a coherent behavior of the two data series over time.
In order to further verify the accuracy of the automatic extraction method from a qualitative point of view, we consider satellite monitoring information. The system is trained to tag some keywords identifying the presence of satellite information within the monitoring bulletins. In particular, we expect to find an interesting intersection between the presence of satellite monitoring information and SO2 flux trends. For this purpose, time slots for which satellite observations are present are selected and time series of the gas flux and VLP trend are generated. In particular, we consider the LGS dataset that reports information on thermal activity based on MODIS sensor data. Considering the SO2 flux plotted in Figure 13, it is possible to observe some peaks at the end of July and August 2019. In fact, two main paroxysms were registered on 3 July and 28 August [21]. The VLP trend confirms peaks of over 25 events/h on these dates (see Figure 14). Conversely, CO2 time series are not reported because of the incompleteness due to the station destruction after the paroxysm of 3 July 2019. C/S time series are also not complete because of instrument malfunctioning (as reported in the daily LGS bulletin published on 4 July 2019).
The thermal anomalies detected by MODIS have been tagged. In Figure 15, considering the LGS dataset, we overlap the VLP rate, SO2 flux and MODIS anomalies. All the three parameters show peaks that correspond to the explosive activity of Stromboli that occurred in July 2019. Moreover, these values remain quite high in the subsequent period (late 2019). This gives evidence of the effectiveness of the tagging procedure.

5. Conclusions

In our work, we tested and applied a “text mining” method to extract geophysical and geochemical monitoring parameters from free unstructured text in daily and weekly bulletins officially issued by research institutes for the Stromboli volcano in southern Italy. The proposed natural language processing (NLP) system generates a structured database of user-defined relevant parameters and their temporal characterization, which are thus time series data available to geoscientists and specialists for further use and analysis. The system can potentially be tuned for other target parameters and other datasets published on the web. In the context of time series studies of volcanic processes, this method relieves specialists of time-consuming manual reading and dataset creation tasks. Thanks to this tool, when specialists have no access to original raw data, they are involved in a very limited way in the data extraction process. In particular, they are required to use their expertise to read and tag a small portion of the whole dataset during the training phase, while the analysis of the whole dataset is carried out by the text mining system.
This proof-of-concept exercise demonstrates the feasibility of performing a fast (and low cost) analysis of datasets available online, providing crucial information that volcanologists may further analyze and interpret for volcanological investigations and applications. In addition, in our test, we used data from bulletins that are freely accessible on the web, without the need to access internal database systems. Moreover, a simple correlation between different gas parameters has been shown. This tool could be easily integrated into the next version of our script in order to realize different kinds of automatic or semi-automatic statistical analyses to verify the performance of the extraction algorithm and workflow.
This work represents the base step for further innovative developments, such as the integration of gas monitoring data from ground-based sensor networks with other types, such as airborne and satellite (e.g., Sentinel-5P tropospheric monitoring data [22]). The information-technology-assisted integration of diverse datasets is a promising multi-scale and multi-sensor approach considering the intrinsic complexity of volcanic phenomena, and the challenge for scientists to achieve the synthesis of a multitude of monitoring data and observations.

Author Contributions

Conceptualization, M.B., L.S.A., F.C., D.T. and M.S.d.C.; software, M.B.; visualization, M.B.; validation, L.S.A., F.C., D.T. and M.S.d.C.; writing—original draft preparation, M.B., L.S.A. and M.S.d.C.; writing—review and editing, F.C. and D.T. All authors have read and agreed to the published version of the manuscript.

Funding

This research has been supported by: “OT4CLIMA” project (ARS01 00405, D.D. 2261 of 6 September 2018, PON R&I 2014–2020 and FSC) from the Ministry of University and Research (MUR) and fruitful interaction with projects MOST and WhiTech of the Italian Space Agency (ASI).

Institutional Review Board Statement

Not applicable.

Informed Consent Statement

Not applicable.

Data Availability Statement

Daily and weekly monitoring bulletins by LGS can be accessed at http://lgs.geo.unifi.it (last access on 20 February 2022), while INGV bulletins can be accessed at https://www.ct.ingv.it (last access on 20 February 2022).

Conflicts of Interest

The authors declare no conflict of interest.

References

  1. Di Traglia, F.; Calvari, S.; D’Auria, L.; Nolesini, T.; Bonaccorso, A.; Fornaciai, A.; Esposito, A.; Cristaldi, A.; Favalli, M.; Casagli, N. The 2014 effusive eruption at Stromboli: New insights from in situ and remote-sensing measurements. Remote Sens. 2018, 10, 2035. [Google Scholar] [CrossRef] [Green Version]
  2. Valade, S.; Ley, A.; Massimetti, F.; D’Hondt, O.; Laiolo, M.; Coppola, D.; Loibl, D.; Hellwich, O.; Walter, T.R. Towards Global Volcano Monitoring Using Multisensor Sentinel Missions and Artificial Intelligence: The MOUNTS Monitoring System. Remote Sens. 2019, 11, 1528. [Google Scholar] [CrossRef] [Green Version]
  3. Elsevier. Elsevier Developers-Text Mining. Available online: https://dev.elsevier.com/tecdoc_text_mining.html (accessed on 12 June 2021).
  4. Springer. Text and Data Mining at Springer Nature. Available online: https://www.springernature.com/gp/researchers/text-and-data-mining (accessed on 3 July 2021).
  5. Aggarwal, C.C.; Zhai, C.X. Mining Text Data, 1st ed.; Springer: Berlin/Heidelberg, Germany, 2012. [Google Scholar]
  6. Mullins, M. Information Extraction in Text Mining. Available online: https://cedar.wwu.edu/cgi/viewcontent.cgi?article=1003&context=computerscience_stupubs (accessed on 31 October 2021).
  7. Feldman, R.; Sanger, J. VI chapter “Information Extraction”. In The Text Mining Handbook. Advanced Approaches in Analyzing Unstructured Data; Cambridge University Press: Cambridge, UK, 2006; pp. 94–130. [Google Scholar] [CrossRef]
  8. Grishman, R.; Sundheim, B. Message Understanding Conference-6: A Brief History. COLING 1996, 96, 466–471. [Google Scholar]
  9. Schmitt, X.; Kubler, S.; Robert, J.; Papadakis, M.; LeTraon, Y. A Replicable Comparison Study of NER Software: StanfordNLP, NLTK, OpenNLP, SpaCy, Gate. In Proceedings of the 2019 Sixth International Conference on Social Networks Analysis, Management and Security (SNAMS), Granada, Spain, 22–25 October 2019; pp. 338–343. [Google Scholar] [CrossRef]
  10. Peters, S.E.; Zhang, C.; Livny, M.; Ré, C. A Machine Reading System for Assembling Synthetic Paleontological Databases. PLoS ONE 2014, 9, e113523. [Google Scholar] [CrossRef] [PubMed] [Green Version]
  11. Peters, S.E.; Husson, J.M.; Wilcots, J. The rise and fall of stromatolites in shallow marine environments. Geology 2017, 45, 487–490. [Google Scholar] [CrossRef]
  12. Wang, C.; Ma, X.; Chen, J.; Chen, J. Information extraction and knowledge graph construction from geoscience literature. Comput. Geosci. 2018, 112, 112–120. [Google Scholar] [CrossRef]
  13. Shi, L.; Jianping, C.; Jie, X. Prospecting Information Extraction by Text Mining Based on Convolutional Neural Networks–A Case Study of the Lala Copper Deposit, China. IEEE Access 2018, 6, 52286–52297. [Google Scholar] [CrossRef]
  14. Holden, E.-J.; Liu, W.; Horrocks, T.; Wang, R.; Wedge, D.; Duuring, P.; Beardsmore, T. GeoDocA—Fast Analysis of Geological Content in Mineral Exploration Reports: A Text Mining Approach. Ore Geol. Rev. 2019, 111, 102919. [Google Scholar] [CrossRef]
  15. Qiu, Q.; Xie, Z.; Wu, L.; Tao, L. GNER: A Generative Model for Geological Named Entity Recognition without Labeled Data Using Deep Learning. Earth Space Sci. 2019, 6, 931–946. [Google Scholar] [CrossRef] [Green Version]
  16. INGV Bollettini Multidisciplinari. Available online: https://www.ct.ingv.it/index.php/monitoraggio-e-sorveglianza/prodotti-del-monitoraggio/bollettini-settimanali-multidisciplinari (accessed on 3 May 2020).
  17. UNIFI LGS, Laboratory of Experimental Geophysics. Available online: http://lgs.geo.unifi.it/index.php (accessed on 3 May 2020).
  18. Vega & Vega-Lite. Available online: https://vega.github.io/ (accessed on 18 November 2020).
  19. Salerno, G.; Burton, M.; Oppenheimer, C.; Caltabiano, T.; Tsanev, V.I.; Bruno, N. Novel retrieval of volcanic SO2 abundance from ultraviolet spectra. J. Volcanol. Geotherm. Res. 2009, 181, 141–153. [Google Scholar] [CrossRef]
  20. Delle Donne, D.; Tamburello, G.; Aiuppa, A.; Bitetto, M.; Lacanna, G.; D’Aleo, R.; Ripepe, M. Exploring the explosive-effusive transition using permanent ultraviolet cameras. J. Geophys. Res. Solid Earth 2017, 122, 4377–4394. [Google Scholar] [CrossRef]
  21. Bevilacqua, A.; Bertagnini, A.; Pompilio, M.; Landi, P.; Del Carlo, P.; Di Roberto, A.; Aspinall, W.; Neri, A. Major explosions and paroxysms at Stromboli (Italy): A new historical catalog and temporal models of occurrence with uncertainty quantification. Sci. Rep. 2020, 10, 17357. [Google Scholar] [CrossRef] [PubMed]
  22. Cofano, A.; Cigna, F.; Santamaria Amato, L.; Siciliani de Cumis, M.; Tapete, D. Exploiting Sentinel-5P TROPOMI and Ground Sensor Data for the Detection of Volcanic SO2 Plumes and Activity in 2018–2021 at Stromboli, Italy. Sensors 2021, 21, 6991. [Google Scholar] [CrossRef] [PubMed]
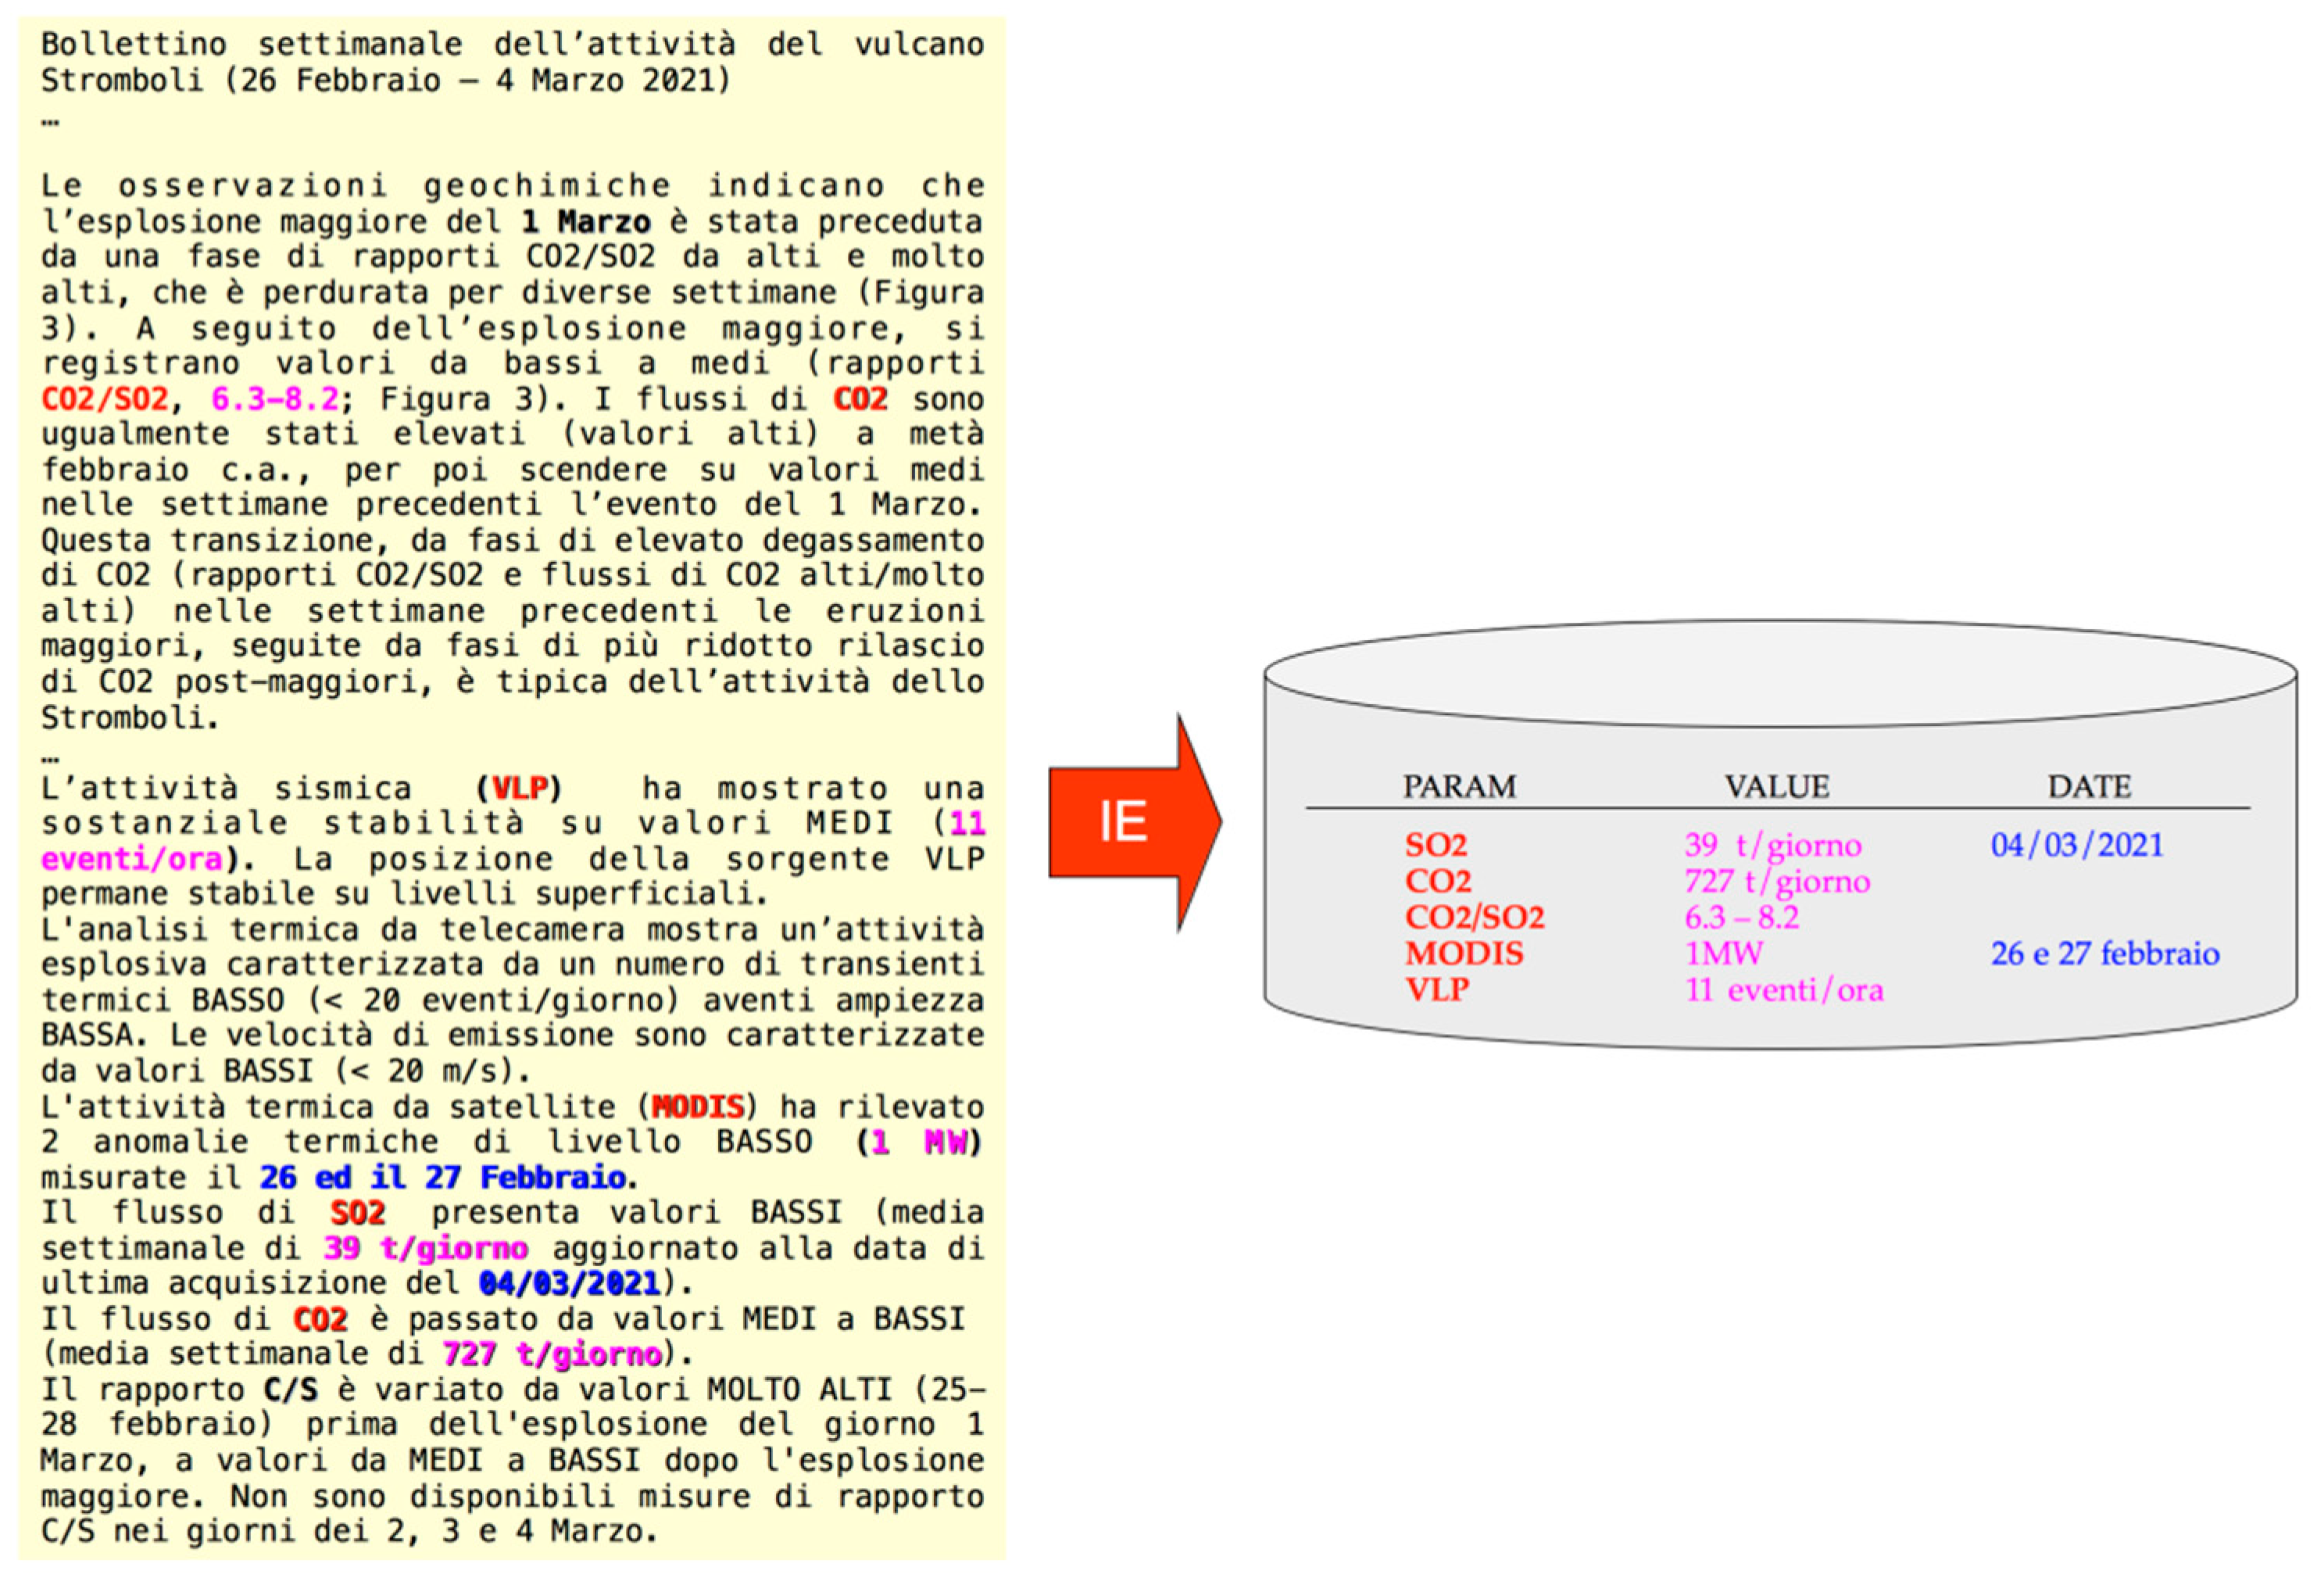
Figure 1. Information extraction: filling slots in a database from an unstructured text. On the left, the original text of the input volcanological bulletin is in Italian language. Italian terms on the right refer to: t—tons; giorno—day, eventi—events; ora—hour; febbraio—February.
Applsci 12 03503 g001
Figure 2. System architecture.
Applsci 12 03503 g002
Figure 3. System workflow for text processing steps (in red).
Applsci 12 03503 g003
Figure 4. Tagging: orange highlight is used for parameters and green for values/scores, when matched. The original text of the input volcanological bulletin is in Italian language.
Applsci 12 03503 g004
Figure 5. Validation of automatic tagging per typology (the six columns list: row number, unique ID, parameter name, and the values found in the LGS daily, LGS weekly and INGV weekly bulletins).
Applsci 12 03503 g005
Figure 6. (a) LGS, VLP parameter (events/h); (b) INGV, VLP parameter (events/h); (c) LGS, SO2 parameter (tons/day); (d) INGV, SO2 parameter (tons/day).
Applsci 12 03503 g006aApplsci 12 03503 g006b
Figure 7. (a) SO2 flux; (b) CO2 flux; (c) VLP time series extracted from LGS bulletins in 2019–2021.
Applsci 12 03503 g007aApplsci 12 03503 g007b
Figure 8. SO2 and CO2 trend over time.
Applsci 12 03503 g008
Figure 9. Correlation between SO2 and CO2.
Applsci 12 03503 g009
Figure 10. Histogram of the correlation between SO2 and CO2.
Applsci 12 03503 g010
Figure 11. Comparison of SO2 flux measurements reported in INGV and LGS weekly bulletins during 2019.
Applsci 12 03503 g011
Figure 12. Comparison of VLP events recorded in INGV and LGS bulletins in 2015–2021.
Applsci 12 03503 g012
Figure 13. SO2 flux time series for 2017–2021 with indication of activity level, extracted from LGS daily bulletins.
Applsci 12 03503 g013
Figure 14. VLP time series for 2017–2021, extracted from LGS daily bulletins.
Applsci 12 03503 g014
Figure 15. Time series of VLP, SO2 flux and thermal anomalies (the latter expressed in MW) in 2015–2021 extracted from LGS daily bulletins.
Applsci 12 03503 g015
Table 1. Number of bulletins in the LGS dataset.
YearDailyWeekly
201536551
201633542
201735848
201836351
201933245
202036452
202113719
Table 2. Number of bulletins in the INGV dataset.
YearDailyWeekly
2015024
2016025
2017024
2018025
20196939
2020052
2021019
Table 3. Tagging of the main parameters from the daily LGS bulletin for 4 March 2021.
ParameterValue
VLP11 events/h
SO239 t/d
CO2MEDIUM
CO2727 t/d
MODIS1 MW
Table 4. Number of parameter–value pairs for the LGS dataset (both weekly and daily).
YearSO2 (t/d)CO2 (t/d)C/SVLP (Events/h)MODIS (MW)
201500035822
20160001803
20171760039043
20183960038334
20193664534365160
2020383291259415145
202114912310315638
Table 5. Number of parameter–value pairs for the INGV dataset (both weekly and daily).
YearSO2 (t/d)CO2 (t/d)C/SVLP (Events/h)MODIS (MW)
201523211240
201625251250
201723234230
201825250250
2019521823746
202051095152
20211509195
Publisher’s Note: MDPI stays neutral with regard to jurisdictional claims in published maps and institutional affiliations.