Abstract
The article examines existing methods for assessing the homogeneity of feed mixes in the feed industry and agriculture. As an alternative to existing approaches, the authors offer a low-cost online technology to assess the homogeneity of feed. The feedstuff under study includes feed mixes for cattle or compound feed consisting of naturally-grown feed (green mass of freshly cut grass, haylage, corn silage, etc.) and concentrated components (grain milling, sunflower, and soybean meal). The proposed method based on an RGB camera, a diode lamp, filters, and software is approved by a preliminary study of the physical properties of feed mix components by Specim IQ hyperspectral camera and revealing characteristics of light absorption of each type of components (concentrated/natural origin). The article presents a method of processing a feed mix image fixed by an RGB camera through light filters using Matlab Image Processing Toolbox tools, namely, a Color Thresholder app and Image Region Analyzer app.
1. Introduction
Despite the rapid trend of focusing on products of plant origin in the food industry, meat and dairy livestock and cattle breeding still remains a priority agricultural activity in most countries of the world, thus forming the basis of food security.
Modern cattle farms specializing in dairy and beef production are highly automated enterprises using digitalization elements and IoT tools. Some processes, however, cannot be carried out 100% efficiently without human intervention. One of them is feeding, which is formed by a long chain of successive technological operations performed by mechanized tools, robots, and also directly by humans. First, human influence includes quality control of naturally-grown feeds (green mass of freshly cut grass, haylage, corn silage, etc.). Today, conventional “wet chemistry” methods are reduced to the preliminary selection and preparation of samples (crushing, drying, etc.) and laboratory analysis to determine protein, fat, carbohydrate, dry matter content, KDK and NDK values. They are accompanied by methods based on scanning the spectral characteristics of prepared feedstuff.
In the past three years, the portable nutrition analyzers Aurora NIR or Dinamica Generale have become the most widespread commercial solutions, enabling measuring various raw forages in the field thanks to the autonomous accumulator power system.
The instrumentation based on near-infrared reflectance spectrometry is quite functional. Similar methods are relatively common in other industries, where it is necessary to monitor the efficiency of conveyor production, control the flow of powdered mixes in pharmaceutical production, etc. [1,2,3,4].
The disadvantages of using NIR analyzers include their limited use in specially prepared rooms. Additionally, farmers have to make decisions and conduct nutritional analyses of various crops directly in the field when the intensity of natural light, especially in summer, can hinder spectral analysis. Therefore, to make a reliable analysis, it is necessary to provide complete shielding from external light. This condition requires a specially prepared room. Several studies have suggested alternative solutions using RGB cameras with software capable of detecting some essential features [4,5].
Regarding feeding efficiency in livestock farms, it is worth noting that nutritional analysis of ration components is only a preliminary stage to make total mixed rations (TMR). It is still much more important to know what kind of feed an animal gets directly from the feed table. It is vital to ensure the adequate mixing of multi-component rations intended for livestock feeding. The diet of cattle, goats, sheep, and other animals consists of naturally grown components (green mass of freshly cut grass, haylage, corn silage, etc.) and concentrated feed (including grain milling, sunflower, and soybean meal, and other components), obtained in processing plants.
The problem is the lack of automated systems to monitor the efficiency of real-time TMR preparation and give recommendations on the mixing mode, thereby ensuring the energy efficiency of feed mixers, including battery-operated robotic ones [6].
The relevance of the proposed research implies that feeding is a key factor influencing animal productivity and health by 70%. The remaining share belongs mainly to the quality of the premises and sanitary standards, so the result depends on the farmer’s ability to mix the feed raw material correctly [7,8].
A key indicator of the nutritional value of the ration is the dry matter/moisture content. The optimum level of dry matter content in TMR is estimated to be around 50%. In naturally-grown feeds, the moisture content is higher and amounts to 70%. For balancing the dry matter content and increasing the energy value of TMR, the green feed is enriched with various compound feeds with a high dry matter content and moisture levels up to 14%. Thus, when mixed, the total dry matter content of the feed is about 50%. Therefore, when non-homogeneous TMR is offered on the feed table, the animals will receive diets with different levels of energy value, which can lead to their destabilized performance and poor health [9,10,11].
In this study, we analyzed existing market solutions. Special technological equipment is used for preparing feed mixes, particularly for cattle, such as Triolette, Siloking, etc., which can both be made as trailed machines with weighing terminals regulating the proportion of the components’ self-propelled machines. Lely and Delaval even produce robotized machines that are part of the automated feed production, which do not require human intervention in preparing the feed mix on the farm. In these machines, however, the mixing process is set according to a rigidly programmed algorithm. The timing of the mixing operation is not optimally and automatically regulated [12,13].
The lack of automatic systems for monitoring the homogeneity of the feed ration in the mixers used often has negative consequences for the farmer regarding herd performance and the number of animals culled for health reasons. As previously mentioned, zootechnical considerations dictate that animals should not consume the components of the feed mix individually. The feed ration must be balanced and be a uniform, multi-component, homogeneous mix [14].
In general, the process equipment used to prepare feed on the farm and its operation modes can significantly affect the performance and health status of the animals. For example, we have analyzed a study comparing the performance of two identical livestock farms with equal genetic potential in livestock and feed rations. One farm operated a trailed feed mixer while the other used a self-propelled machine with a self-loading system, resulting in a 2.7% difference in milk yield [15,16,17,18].
Similarly, recommendations for uniformity (homogeneity) of diet are based on the fact that green fodder and concentrated components have different indicators of dry matter content and nutritional value. Therefore, unevenly mixed diets will result in unbalanced feed consumption by animals due to different levels of nutritional value, which often results in destabilized productive qualities and health problems [19,20].
A literature review revealed that controlling mix homogeneity is extremely important in many branches of the production process. NIRS technology is particularly prevalent in health care to assess powder homogeneity in pharmaceutical preparations at the raw material preparation stage. Such solutions are particularly effective for monitoring continuous powder flow in pharmaceutical production [21,22,23,24].
In particular, there is an experience in using fluorescence to assess the homogeneity of multi-component granular and bulk mixes by pre-coating them with a solution of fluorescent material. In the case of a three-component feed mix, the fluorescence homogeneity assessment method can be adequate to examine one key component [25,26,27].
The use of NIRS technology for rapid assessment of feed nutrient composition is already replacing conventional control methods based on wet chemistry due to the advantages of the non-contact, non-destructive operation and the lack of sample preparation measures [28].
It is worth noting that spectral instruments are mostly expensive, and their functionality is redundant for evaluating the homogeneity index of cattle feed mix. Vision systems, which do not require expensive equipment, such as compact spectrometers, and monitor parameters online via IoT tools, are actively introduced as diagnostic systems in production practice. For example, several studies describe the effectiveness of using RGB cameras and programmed algorithms in agriculture to detect naturally or artificially ripened bananas. Furthermore, RGB-D cameras are suitable for efficiently detecting significant objects and the preservation of fine details [29,30,31,32,33,34,35].
Sometimes, a complete system based on RGB-D cameras controlled by neural networks is used to evaluate feed intake by cows [36].
Some recent developed image processing methods allow to detect objects on RGB images with high accuracy. Those methods work well with objects on a uniform background, but have limitations in our case where objects of interest are mixed within a complex pattern [37,38].
The present study proposes an elementary system for automatic control of the component composition of feed mixes and a data processing method to determine the setting of feed mixer operation modes based on an RGB camera, light filters, a diode lamp, and software. The applied software includes the Matlab Image Processing Toolbox and, in particular, the Color Thresholder app and Image Region Analyzer app.
The proposed system performs the functions of determining:
- -
- geometric characteristics of mixed particles;
- -
- color intensity for each pixel in the image;
- -
- uniformity of color intensity distribution over each image channel.
The described set will make it possible to evaluate the homogeneity of the resulting mixes and make recommendations on the operating time of mixing units, thereby improving energy efficiency by optimizing the operating time of feed mixers.
2. Materials and Methods
2.1. Study of Spectral Characteristics of Feed Mix Components
The physical phenomenon serving as a basis for the offered method consists in measuring the image reflection ability of a forage mix surface layer.
At the preliminary laboratory study stage, it was necessary to determine spectral characteristics of components of feeding mixes, as exemplified by a cattle feed ration. This type of ration can contain natural-origin forages (grass green mass, corn silage, alfalfa haylage) and concentrated mixed fodder (consisting of grain mash, corn, and barley as rape meal and sunflower meal).
A Specim IQ (Specim, Oulu, Finland) hyperspectral camera was used in the laboratory study. Here are the camera specifications: “VNIR 400–1000 nm (CMOS)” matrix, Wave-length band 400–1000 nm, Spectral resolution FWHM 7 nm, Spectral bands 204, Spatial Sampling 512 pix.
According to the camera manufacturer’s recommendations, during the image acquisition process, a calibration plate was placed in the capture area of the lens to ensure high-quality spectral image data and maximum performance.
There are three ways of using the calibration plate:
- -
- The WR panel is included and defined from the recorded data;
- -
- WR panel is recorded before the actual data recording;
- -
- Preset WR settings to match the most common recording environment’s illuminations.
For good statistics, it was necessary to take the spectral characteristics of a single image and collect reliable data, using a setup with a hyperspectral camera (Figure 1).
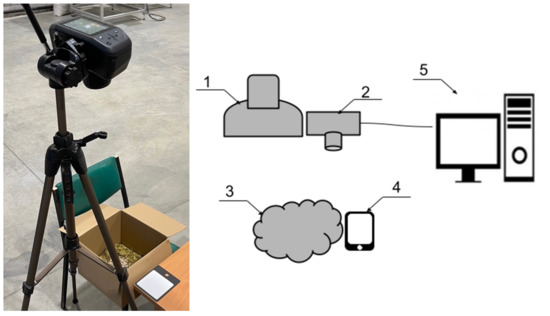
Figure 1.
Photo taken during the experiment (left), functional diagram of the laboratory installation (right): 1—illuminator, 2—hyperspectral camera, 3—sample under study, 4—calibration pad, 5—computer for image processing.
The images were recorded in a laboratory with high natural light intensity during the lunchtime hours on a clear day.
Corn silage with 70% moisture content and alfalfa haylage with 50% moisture content were taken as green fodder samples. Pellets intended for high-yielding dairy animals were used as compound feed.
2.2. Use of Fluorescence and RGB Camera to Detect Mixing Quality of Feed Mix Components
As the hyperspectral camera is an expensive device, it is not practical to equip machines for detecting mixing quality. This option would have a significant impact on the cost of production.
The proposal was to test the use of the fluorescence phenomenon. Due to the different absorption capacity values of the feed mix components, the reflective effect would also be significantly different.
Therefore, the second part of the study aimed at testing the possibility of using inexpensive devices such as an RGB camera and a set of filters to increase the contrast of the obtained image and assess the effectiveness of preparing the feed mix by counting pixels.
To ensure convenient image acquisition, we assembled a frame made of aluminum profiles and capable of changing the focal distance. To provide the required spectral range, LED illumination with a blue light filter and a Basler ace RGB camera-acA5472-17uc (Basler AG, Ahrensburg, Germany) with a yellow light filter were used:
- -
- Sensor IMX183;
- -
- Shutter Rolling Shutter;
- -
- Sensor Size 13.1 mm × 8.8 mm;
- -
- Resolution (H × V) 5472 px × 3648 px;
- -
- Resolution 20 MP;
- -
- Pixel Size (H × V) 2.4 µm × 2.4 µm.
We assembled a more compact bench to check the possibility of detecting the homogeneity of feed mixes under real conditions using similar filters (Figure 2). Here an RGB camera replaced a smartphone to ensure video streaming to a personal computer, where MATLAB algorithms processed the image.
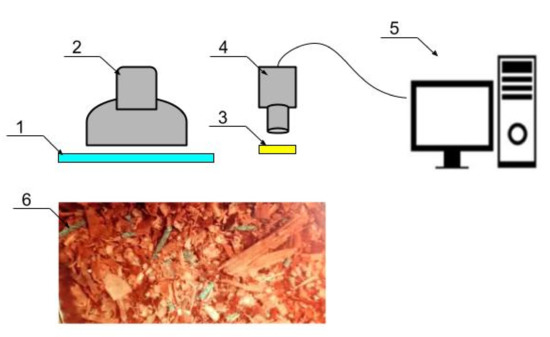
Figure 2.
Schematic diagram of the experimental installation. 1—blue filter, 2—diode lamp, 3—yellow filter, 4—RGB camera, 5—computer with Matlab program, 6—sample image fixed through light filters.
For the laboratory experiment, we assembled a bench that included an LED illuminator with a light filter to excite fluorescence and improve the contrast of the feed mix by increasing the reflectivity, a camera with a lens and a filter mounted on it, a computer to process the information, and a TMR container.
The bench shown, was fixed to the feed car mixer side, where video images were recorded. Then the broadcasted video image was processed using MATLAB software with the Image Processing Toolbox extension algorithms, namely, the Color Thresholder app and Image Region Analyzer app.
Color Thresholder app can select areas in an image based on color characteristics of pixels. The app helps create a binary segmentation mask for a color image. Color Thresholder supports four image representation spaces: RGB, HSV, YCbCr.
Image Region Analyzer app identifies regions in a binary image and determines their characteristics. The output is presented in a table form, which is suitable for quickly sorting and filtering the areas for further analysis.
3. Results
3.1. Laboratory Experiment and Field Trials
First, we obtained spectral characteristics of the components of the cattle fodder mix: feed and mixed fodder.
A fundamental difference is that the active absorption of green fodder is observed in the range from 600 to 700 nm (Figure 3), which is explained by the physical phenomenon caused by chlorophylls contained in green fodder that actively absorb light.
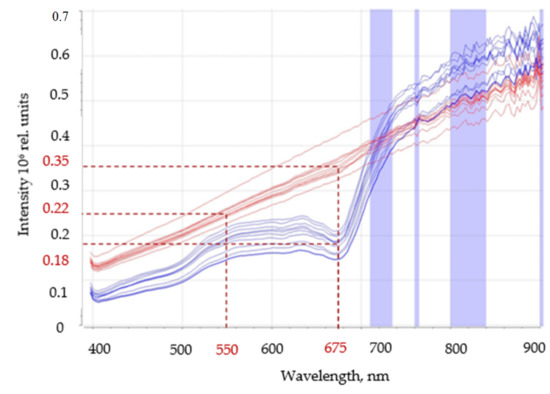
Figure 3.
Spectral characteristics of the tested components of the feed mix.
In Figure 3, the red line represents the spectral characteristics of the concentrated feed mix examined, while the blue line represents the spectral characteristics of maize silage.
According to the graph in the absorption zone, the average difference in the intensity of light reflection from mixed fodder and green fodder is a maximum of 0.17 rel. units. At the same time, in the region of 550 nm, the difference is a minimal − 0.04 rel. units.
By focusing the light source onto the feed mix in the range from 600 to 700 nm, it is thus possible, with the help of an RGB camera and a set of light filters, to detect a uniform reflectance distribution of the feed mix. Indirect indicators provided information on the quality of mixed feed and thus, helped select optimum energy-saving modes of machine operation and assured the quality of the obtained mixes.
Using Albedo 4.0.23 software and image processing made it possible to get a two-colored contrast picture, where green fodder absorbing the light source is shown in a black color, in the band from 600 to 700 nm, and mixed fodder is shown in white (Figure 4).
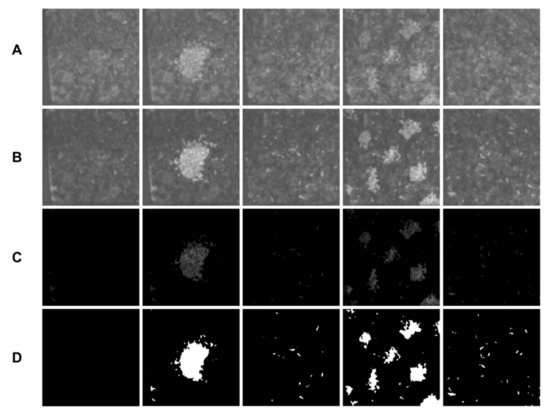
Figure 4.
Fixed TMR images (from green and mixed fodder) in different mixing states: A—images at 672 nm spectral slice, B—images at 554 nm spectral slice, C—subtraction result, D—binarized images, (first column—images without mixed fodder).
After acquiring hyperspectral camera images, image samples were taken and processed using Albedo 4.0. software. The software helped clearly show the image sequences of green fodder and concentrate feed and determine their spectral characteristics.
3.2. Use of RGB Camera to Detect Mixing Quality of a Feed Mix
The determined chlorophyll absorption capacity in green forages enables us to detect the homogeneity of forage mixes using cheaper fluorescence methods.
The obtained statistical characteristics of the number and size of areas determine the uniformity of feed mixing. The developed system will ensure the mixing of feed components directly in a robot feeder at the final stage of cattle feeding. Quality control of the mix composition will reduce costs on feeding due to the optimized amount of mixed fodder. It will also increase the cattle’s productive life through a more balanced diet.
Production tests were carried out on an operating farm. During the tests, a camera with illumination was installed on the feeder wagon. Observations were made during the preparation of the feed mix and then after feed distribution. The machine moved over the feeding table to detect unmixed portions of the feed mixture (Figure 5).
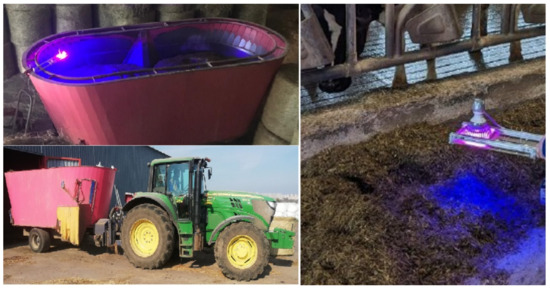
Figure 5.
Process of getting images with fluorescence excitation of feed mix components on a farm.
The physical property of light absorption and light filters enabled us to increase the contrast in the image captured by the RGB camera. The mixed feed got a pronounced green color, and the green fodder acquired duller colors. Based on this, we estimated the homogeneity of the feed mix surface layer.
It was necessary to highlight the green color in the image to highlight the mixed feed. For this purpose, use was made of the point cloud available in the app program, characterizing all the colors presented in the image. We used the polygon “Region of Interest” tool to select the points in the point cloud representing the shades of green.
The resulting statistical characteristics on the number and size of regions indicate how evenly the feed is mixed.
Several signs indicated improper forage mixing. The first sign is the size of the areas. The maximum area corresponding to a single feed particle is 250 pixels. Areas with a larger area indicate that two or more particles are adjacent.
More than two areas of up to 500 pixels or at least one area of more than 500 pixels was taken as an outlier.
The absence of fodder particles in any part of the image can also indicate anomalies. To detect such anomalies, the image is divided into nine parts, and in each part, the area of white spots is summed up. If the difference between the spot area and the image average exceeds the permissible value, it is also considered a deviation.
3.3. Processing of the Results Obtained
When analyzing the mixture through a filter, the feed fluorescence was visible both from the camera image and with the unaided eye.
To facilitate data processing, we binarized the image based on the selected areas for further analysis. The binarized image is a two-dimensional matrix consisting of zeros and ones, where the ones represent the areas of interest.
The binarized images were loaded into the Image Region Analyzer app where areas were identified and their characteristics determined. Region parameter tables, such as dimensions, position, and orientation, according to Figure 6, were made with the application:
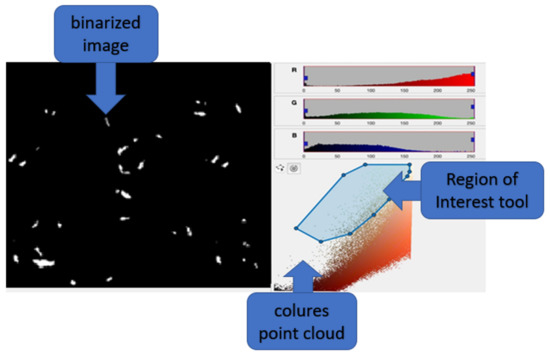
Figure 6.
Processing of binarized TMR images.
The quantity and size of objects in the binarized image allow us to judge the uniformity of feed mixing. Signs were found indicating that the feed was not properly mixed. A qualitative assessment of indicators of signs is reduced to the definition of areas in the points of objects (compound feed) and the calculation of their areas. For this purpose, a unique algorithm was developed for detecting such objects, calculating their area and density.
For the above binarized images of size [N,M] the matrix p(i,j) is used to denote each pixel and the value of coordinates (i,j) in the image, where 0 ≤ i < N and 0 ≤ j < M. Pixels p(i-1,j), p(i,j-1), p(i + 1,j) and p(i,j + 1) are adjacent to pixel p(i,j) and are called four adjacent pixels of pixel p(i,j). The four neighboring pixels, together with the pixels p(i-1,j-1), p(i + 1,j-1), p(i-1,j + 1) and p(i + 1,j + 1), are called the eight neighboring pixels of pixel p(i,j). Two points of an object «s» and «t» are called four connected (eight connected) if a trajectory exists consisting of the points of the object , , …, in such a way that and , and for all , and are four adjacent (eight adjacent) to each other. A point cloud of an object in an image is called a four-connected (eight-connected) component in a binary image if, and only if, any of the two pixels in the set is four-connected (eight-connected). The associated component is the desired object (compound feed). The area of object , , is defined as the number of pixels in object and is calculated using the formula:
An eight-connected object indicates a denser distribution of compound feed, a four-connected object indicates a less dense distribution. An indicator of unevenness may be the absence of feed particles in any part of the image. To detect such anomalies, the image is divided into nine parts and the area of white areas is summed up in each. Detection of more than 90% of four connected objects evenly distributed across the image indicates high-quality mixing on the feed table. If the difference between the area of the part and the average of the image differs more than the permissible value, this is considered a deviation from the norm:
is the average area for the i-th binarized image;
K is the mixing quality indicator (1 is qualitative, 0 is not qualitative), L is an acceptable value.
The developed system will allow to introduce control into the final stage of feeding cattle for mixing the components of the feed mixture directly in the feed dispenser robot. The quality control of the mixture will reduce the feeding costs associated with the issuance of an additional amount of compound feed. It will also increase the productive longevity of cattle through a more balanced diet.
4. Discussion
The identified absorption features of the green mass in the TMR will help implement the proposed method of controlling the homogeneity of feed mixes by using fluorescence.
The shortcomings of the existing methods based on Infrared spectroscopy include the measurement time. To obtain the result, it is necessary to accumulate the spectrum indicators at different frequencies [39].
The proposed method has a number of advantages:
- -
- speed of information processing;
- -
- simplicity of constructive implementation;
- -
- the possibility of monitoring the homogeneity of mixtures with similar characteristics in another industry.
However, the method based on the visible range does not allow to evaluate the nutritional value of feed, which can be attributed to disadvantages.
Color areas responsible for the feed were highlighted on the images obtained during the tests using the Color Thresholder app. The use of different color spaces showed no significant advantage. The RGB space was used as the most familiar and required no additional analysis. The resulting video was transmitted to the machine operator’s smartphone in a real-time mode. In turn, the operator adjusted the operating time of the mixing unit. Such a system could be upgraded to a fully autonomous solution and installed on a robotic feeder or a feed wagon, which would select the optimum operating time of the mixer and ensure energy saving.
5. Conclusions
Based on theoretical and experimental studies, we found that different absorption/reflection light flux levels of the feed mix components and materials determine the homogeneity of produced mixes of natural-origin components (green mass of freshly mowed grass, haylage, corn silage, etc.) and concentrated components (grain milling, sunflower and soybean meal).
Unlike existing systems based on NIR analyzers and spectrometers, the proposed approach based on an RGB camera with filters and a diode lamp has a lower implementation cost and performs online measurements using IoT technology.
This theoretical and experimental base will further develop more reliable and accurate technological solutions, acting as decision-making tools or as feedback sensors for automated and robotic machines producing multicomponent mixes.
The shortcomings of the existing methods based on Infrared spectroscopy include the measurement time. To obtain the result, it is necessary to accumulate the spectrum indicators at different frequencies.
The proposed method has a number of advantages:
- -
- speed of information processing;
- -
- simplicity of constructive implementation;
- -
- the possibility of monitoring the homogeneity of mixtures with similar characteristics in another industry.
However, the method based on the visible range does not allow to evaluate the nutritional value of feed, which can be attributed to disadvantages.
The system will evaluate the homogeneity of the resulting mixes and make recommendations on the operating time of the mixing units, thereby improving energy efficiency by optimizing the operating time.
Author Contributions
Conceptualization and methodology, A.Y.I., E.A.N.; validation, D.Y.P.; formal analysis, A.G.A.; investigation and resources, E.A.N.; writing—original draft preparation, D.Y.P., E.A.N.; writing—review and editing, visualization, E.A.N.; supervision and funding acquisition, D.Y.P.; project administration, A.G.A. All authors have read and agreed to the published version of the manuscript.
Funding
This work was supported by a grant of the Ministry of Science and Higher Education of the Russian Federation for large scientific projects in priority areas of scientific and technological development (grant number 075-15-2020-774).
Institutional Review Board Statement
Not applicable.
Informed Consent Statement
Not applicable.
Data Availability Statement
Not applicable.
Conflicts of Interest
The authors declare no conflict of interest. The funders had no role in the design of the study; in the collection, analyses, or interpretation of data; in the writing of the manuscript, or in the decision to publish the results.
References
- Fountas, S.; Carli, G.; Sørensen, C.; Tsiropoulos, Z.; Cavalaris, C.; Vatsanidou, A.; Liakos, B.; Canavari, M.; Wiebensohn, J.; Tisserye, B. Farm management information systems: Current situation and future perspectives. Comput. Electron. Agric. 2015, 115, 40–50. [Google Scholar] [CrossRef]
- Zi, L.; Cong, X.; Peng, Y.; Chen, X. RGB-D Saliency Object Detection Based on Adaptive Manifolds Filtering. In Chinese Intelligent Automation Conference; Springer: Singapore, 2019; Volume 586, pp. 174–181. [Google Scholar] [CrossRef]
- Bezen, R.; Edan, Y.; Halachmi, I. Computer vision system for measuring individual cow feed intake using RGB-D camera and deep learning algorithms. Comput. Electron. Agric. 2020, 172, 105345. [Google Scholar] [CrossRef]
- Müller, A.; Rukin, I.; Falldorf, C.; Bergmann, R. Multicolor Holographic Display of 3D Scenes Using Referenceless Phase Holography (RELPH). Photonics 2021, 8, 247. [Google Scholar] [CrossRef]
- Zhou, W.; Yuan, C. Model of Image Color Difference and Partial Based On RGB Color Distribution Measuring. Int. J. Grid Distrib. Comput. 2016, 9, 231–240. [Google Scholar] [CrossRef]
- Rego, G.; Ferrero, F.; Valledor, M.; Campo, J.C.; Forcada, S.; Royo, L.J.; Soldado, A. A portable IoT NIR spectroscopic system to analyze the quality of dairy farm forage. Comput. Electron. Agric. 2020, 175, 105578. [Google Scholar] [CrossRef]
- Buza, M.; Holden, L.; White, R.; Ishler, V. Evaluating the effect of ration composition on income over feed cost and milk yield. J. Dairy Sci. 2014, 97, 3073–3080. [Google Scholar] [CrossRef]
- Bargo, F.; Muller, L.; Delahoy, J.; Cassidy, T. Milk Response to Concentrate Supplementation of High Producing Dairy Cows Grazing at Two Pasture Allowances. J. Dairy Sci. 2002, 85, 1777–1792. [Google Scholar] [CrossRef]
- Bloch, V.; Levit, H.; Halachmi, I. Assessing the potential of photogrammetry to monitor feed intake of dairy cows. J. Dairy Research. 2019, 1, 34–39. [Google Scholar] [CrossRef]
- Krawczel, P.; Klaiber, L.; Thibeau, S.; Dann, H. Technical note: Data loggers are a valid method for assessing the feeding behavior of dairy cows using the Calan Broadbent Feeding System. J. Dairy Sci. 2012, 95, 4452–4456. [Google Scholar] [CrossRef]
- Bach, A.; Iglesias, C.; Busto, I. Technical Note: A Computerized System for Monitoring Feeding Behavior and Individual Feed Intake of Dairy Cattle. J. Dairy Sci. 2004, 87, 4207–4209. [Google Scholar] [CrossRef]
- Schneider, L.; Volkmann, N.; Kemper, N.; Spindler, B. Feeding Behavior of Fattening Bulls Fed Six Times per Day Using an Automatic Feeding System. Front. Veter- Sci. 2020, 7, 43. [Google Scholar] [CrossRef] [PubMed]
- Martin, N.; Russelle, M.; Powell, J.; Sniffen, C.; Smith, S.; Tricarico, J.; Grant, R. Invited review: Sustainable forage and grain crop production for the US dairy industry. J. Dairy Sci. 2017, 100, 9479–9494. [Google Scholar] [CrossRef] [PubMed]
- Bach, A.; Valls, N.; Solans, A.; Torrent, T. Associations Between Nondietary Factors and Dairy Herd Performance. J. Dairy Sci. 2008, 91, 3259–3267. [Google Scholar] [CrossRef] [PubMed]
- Pavkin, D.Y.; Nikitin, E.A.; Zobov, V.A. Robotic System for Maintenance of Feed Table for Livestock Complexes. Agric. Mach. Technol. 2020, 14, 33–38. [Google Scholar] [CrossRef]
- Nikitin, E.; Vim, F.S.A.C. Food table robotic maintenance system at animal production units. Mach. Equip. Rural Area 2020. [Google Scholar] [CrossRef]
- Sirovatka, V.; Dorokhov, A.; Kirsanov, V.; Pavkin, D.; Nikitin, E. Study results of the on-board weight control system as exem-plified by feed mixture preparation using a trailed feed mixer-and-distributor. E3S Web of Conferences. In Proceedings of the XIII International Scientific and Practical Conference “State and Prospects for the Development of Agribusiness—INTERAGROMASH, Rostovon-Don, Russia, 26–28 February 2020. Don State Technical University. [Google Scholar] [CrossRef]
- Mithun, B.S.; Shinde, S.; Bhavsar, K.; Chowdhury, A.; Mukhopadhyay, S.; Gupta, K.; Bhowmick, B.; Kimbahune, S. Non-destructive method to detect artificially ripened banana using hyperspectral sensing and RGB imaging. Sens. Agric. Food Qual. Saf. X. 2018, 10665, 106650. [Google Scholar] [CrossRef]
- Reger, M.; Bernhardt, H.; Stumpenhausen, J. Navigation and personal protection in automatic feeding systems. Actual Tasks Agric. Eng. 2017, 45, 523–530. [Google Scholar]
- Moallem, U.; Lifshitz, L. Accuracy and homogeneity of total mixed rations processed through trailer mixer or self-propelled mixer, and effects on the yields of high-yielding dairy cows. Anim. Feed Sci. Technol. 2020, 270, 114708. [Google Scholar] [CrossRef]
- Li, Y.; Anderson, C.A.; Drennen, J.K.; Airiau, C.; Igne, B. Development of an In-Line Near-Infrared Method for Blend Content Uniformity Assessment in a Tablet Feed Frame. Appl. Spectrosc. 2019, 73, 1028–1040. [Google Scholar] [CrossRef]
- Alam, A.; Shi, Z.; Drennen, J.K.; Anderson, C.A. In-line monitoring and optimization of powder flow in a simulated continuous process using transmission near infrared spectroscopy. Int. J. Pharm. 2017, 526, 199–208. [Google Scholar] [CrossRef]
- Keim, J.; Charles, H.; AlOmar, D. Prediction of crude protein and neutral detergent fibre concentration in residues of in situ ruminal degradation of pasture samples by near-infrared spectroscopy (NIRS). Anim. Prod. Sci. 2016, 56, 1504–1511. [Google Scholar] [CrossRef]
- Matuszek, D. Fluorescence method for the assessment of homogeneity of granular mixtures. J. Central Eur. Agric. 2017, 18, 851–863. [Google Scholar] [CrossRef][Green Version]
- Matuszek, D.; Biłos, Ł. Use of fluorescent tracers for the assessment of the homogeneity of multicomponent granular feed mixtures. Przem. Chem. 2017, 96, 2356–2359. [Google Scholar] [CrossRef]
- Matuszek, D.; Wojtkiewicz, K. Application of fluorescent markers for homogeneity assessment of grain mixtures based on maize content. Chem. Process Eng. 2017, 38, 505–512. [Google Scholar] [CrossRef]
- Modroño, S.; Soldado, A.; Fernandez, A.M.; de la Roza-Delgado, B. Handheld NIRS sensors for routine compound feed quality control: Real time analysis and field monitoring. Talanta 2017, 162, 597–603. [Google Scholar] [CrossRef] [PubMed]
- Foca, G.; Masino, F.; Antonelli, A.; Ulrici, A. Prediction of compositional and sensory characteristics using RGB digital images and multivariate calibration techniques. Anal. Chim. Acta 2011, 706, 238–245. [Google Scholar] [CrossRef] [PubMed]
- Chen, Z.; Wang, F.; Zhang, P.; Ke, C.; Zhu, Y.; Cao, W.; Jiang, H. Skewed distribution of leaf color RGB model and application of skewed parameters in leaf color description model. Plant Methods 2020, 16, 23–28. [Google Scholar] [CrossRef]
- Xu, H.; Ying, Y. Citrus fruit recognition using color image analysis. Proc. SPIE 5608, Intelligent Robots and Computer Vision XXII: Algorithms, Techniques, and Active Vision, Philadelphia, PA, USA, 25 October 2004; pp. 321–328. [Google Scholar] [CrossRef]
- Xu, H.; Jiang, G.; Yu, M.; Luo, T. A Color Image Watermarking Based on Tensor Analysis. IEEE Access 2018, 6, 51500–51514. [Google Scholar] [CrossRef]
- Sun, X.; Zhao, L. RGB Pixel Brightness Characteristics of Linked Color Imaging in Early Gastric Cancer: A Pilot Study. Gastroenterol. Res. Pr. 2020, 2020, 2105874–7. [Google Scholar] [CrossRef]
- Lukac, R.; Plataniotis, K. Color filter arrays: Design and performance analysis. IEEE Trans. Consum. Electron. 2005, 51, 1260–1267. [Google Scholar] [CrossRef]
- Halachmi, I.; Ben Meir, Y.; Miron, J.; Maltz, E. Feeding behavior improves prediction of dairy cow voluntary feed intake but cannot serve as the sole indicator. Animal 2016, 10, 1501–1506. [Google Scholar] [CrossRef]
- Chapinal, N.; Veira, D.; Weary, D.; Von Keyserlingk, M. Technical Note: Validation of a System for Monitoring Individual Feeding and Drinking Behavior and Intake in Group-Housed Cattle. J. Dairy Sci. 2007, 90, 5732–5736. [Google Scholar] [CrossRef] [PubMed]
- Fernández-Ahumada, E.; Garrido-Varo, A.; Guerrero-Ginel, J.E. Feasibility of Diode-Array Instruments To Carry Near-Infrared Spectroscopy from Laboratory to Feed Process Control. J. Agric. Food Chem. 2008, 56, 3185–3192. [Google Scholar] [CrossRef] [PubMed]
- Ding, K.; Xiao, L.; Weng, G. Active contours driven by region-scalable fitting and optimized Laplacian of Gaussian energy for image segmentation. Signal Process. 2017, 134, 224–233. [Google Scholar] [CrossRef]
- Jin, R.; Weng, G. Active contours driven by adaptive functions and fuzzy c-means energy for fast image segmentation. Signal Process. 2019, 163, 1–10. [Google Scholar] [CrossRef]
- Sun, H.; Xing, Z.Z.; Zhang, Z.Y.; Ma, X.Y.; Long, Y.W.; Liu, N.; Li, M.Z. Visualization Analysis of Crop Spectral Index Based on RGB-NIR Image Matching. Spectrosc. Spectr. Anal. 2019, 11, 3493–3500. [Google Scholar] [CrossRef]
Publisher’s Note: MDPI stays neutral with regard to jurisdictional claims in published maps and institutional affiliations. |
© 2022 by the authors. Licensee MDPI, Basel, Switzerland. This article is an open access article distributed under the terms and conditions of the Creative Commons Attribution (CC BY) license (https://creativecommons.org/licenses/by/4.0/).