Article

A Practical Model Study on the Mechanism of Clay Landslide under Static Loads: From the Perspective of Major Crack–Stress–Displacement

1
School of Civil Engineering, Chongqing University, Chongqing 400045, China
2
Key Laboratory of New Technology for Construction of Cities in Mountain Area, Ministry of Education, Chongqing University, Chongqing 400045, China
*
Author to whom correspondence should be addressed.
Appl. Sci. 2022, 12(7), 3224; https://doi.org/10.3390/app12073224
Submission received: 3 March 2022 / Revised: 16 March 2022 / Accepted: 19 March 2022 / Published: 22 March 2022

Abstract

:
Stability assessment of cracked clay slopes has been a research hotspot in geotechnical engineering in recent years. The assessment work should include crack initiation/development and stability evaluation. However, there has been no universal method for predicting crack evolution until now. In addition, scholars have paid little attention to the coupling relationship between the evolution of cracks and the progressive failure process of macroscopic clay slopes and have seldom studied the ubiquitous diagonal cracks in clay slopes. In this work, the stress mechanism for initiation and development of major cracks was derived based on unsaturated soil mechanics and critical state soil mechanics considering the tensile, compression, and shear properties of clay. The correctness of the proposed theory was verified by constructing a large-scale, arc-shaped slip surface clay slope model. In the model test, earth pressure cells and displacement gauge were employed to monitor development of stresses within the clay slope and horizontal displacement of the slope shoulder, respectively, under the set load sequence. The results showed that the stress mechanism proposed in this paper could judge not only vertical cracks but also diagonal cracks. Horizontal stresses near the primary crack appeared as a result of stress saltation. The locations and depths of the major cracks could be determined by analyzing the differences in horizontal stress between adjacent measuring points under the same load step. The development of major crack–horizontal stress–displacement had intrinsic consistency, and the initiation and development of major cracks aggravated changes in displacement and horizontal stresses. The perspective of major crack–stress–displacement is helpful to wholly grasp the progressive failure process of cracked clay slopes and provide a reference for prediction of clay landslides.

1. Introduction

Clays exist widely in basins or river terraces of Southwest, East, and North China. In these areas, clay is widely used in the construction of earthworks, such as earth-filled dams, highway, and railway embankments. Under the influence of loading [1], dry–wet cycles [2], differential settlements [3], soil–rock mixture [4], and other factors, numerous fissures or cracks appear in clay. The cracks not only change the hydromechanical properties of the soil [5] but also significantly reduce the strength of the soil and the structural integrity of the soil slope [6,7,8], and even pose a major threat to the stability of the clay slope as part of the slip surface [9]. Cracks are one of the principal predisposing factors of landslides [10]. In terms of geomorphic features, the evolution of clay landslides is often accompanied by the initiation and development of cracks [11]. Therefore, the stability assessment of a cracked clay slope should actually include two aspects, namely crack initiation/development and stability analysis.
The development of fracture mechanics provides an effective method to study the cracks of soil samples. However, fracture mechanics can only deal with the propagation of known cracks [12] and cannot explain the initiation mechanism of cracks. Moreover, the size effect is a prominent feature of fracture mechanics [13], which cannot be directly applied to the analysis of cracks of a soil slope. The stress state is a key factor that determines the initiation and development of cracks [14,15]. Soil mechanics has been used to explain the cracking behavior and mechanism of clay [13,16], and it is generally believed that the initiation and development of clay cracks are controlled by tensile strength [15,17,18,19]. Based on unsaturated soil mechanics, Morris et al. [20] proposed an analytical equation of crack depth caused by tensile stress under K0 condition. Kodikara and Choi [21] developed a simplified analytical model for desiccation cracking of clay layers considering the foundation constraints and tensile failure. Ma et al. [22] derived the cracking state equation in the form of stress expression. In addition, Deng et al. [23] studied the formation process of shrinkage cracks on unsaturated clay surface based on a modified finite element program. He et al. [24] studied the initiation and development process of transverse cracks in a dam by numerical simulation.
However, these studies have the following limitations: (1) the background of these studies was clay desiccation cracking, and they were based on linear elasticity or settlement theory; (2) there is a big gap between the proposed crack depth models and actual projects; and (3) the indoor desiccation cracking research based on slurry clay is not suitable for clay cracking in a general sense [25]. In another words, there is no universal method so far for predicting crack formation and development.
In the stability analysis of a fractured slope, a crack means the presence of a discontinuous surface. Compared to the use of numerical simulation methods (such as finite element method, finite difference method, etc.), research on analytical methods have shown greater potential for success [26]. In recent years, more studies have been conducted on fractured slope stability by employing the upper bound theorem of limit analysis. Based on the log-spiral failure mechanism of clay slopes, Utili [27] studied the adverse effects of open cracks on slope stability during drying and water filling. Michalowski [28] considered not only open cracks but also the effects of cracks formed as part of the failure mechanism (formation cracks). The research by Gao et al. [29] showed that disregarding the influence of formation cracks will underestimate the safety of clay slopes. In addition, some scholars have studied the anisotropy of strength parameters [30], pore water pressures [31], earthquakes [32,33], three-dimensional slopes [34], and other situations, which have promoted the development of slope stability assessment methods.
Nevertheless, the upper-bound analysis method has also some shortcomings: (1) the method regards the soil as an ideal rigid, perfectly plastic body and considers that the deformation of the soil mass only occurs in the thin shear zone (failure surface) [35], which cannot reflect the internal deformation mechanism of the soil; (2) the method considers instantaneous failure where the yield condition is reached simultaneously along the entire failure surface [28], which can hardly reflect the progressive failure process widely existing in clay slopes; and (3) crack development cannot be simulated by limit analysis [36]. Furthermore, cracks in clay slopes may take on nonvertical plane shapes. For example, diagonal cracks are one of the common distribution patterns of clay cracks in Chengdu, Hefei, and Nanjing in China [37,38]. Unfortunately, in previous stability analyses of fractured slopes, the crack was assumed as vertical, so the nonvertical crack mode in clay is still poorly understood [27,39].
There is a close relationship between the stress field, displacement field, and slope stability [40]. By not giving sufficient stress to this fact, previous studies on the stress and deformation characteristics of slopes have been limited [41]. In the literature of stability assessment of fissured clay slopes, little attention has been paid to the coupling analysis of the initiation and development of cracks and the macroscopic progressive failure process of slopes. The mechanism leading to cracking involves the reduction of soil stress level [20,42], and the occurrence of landslide is always related to the perturbation of the equilibrium relationship between the stress and strength of the slope materials [43]. Previous studies have rarely paid attention to internal stress variations of fractured clay slopes in the progressive failure process.
The main purpose of this work was to study (1) the relationship between the initiation and development of major cracks and stress changes in clay slopes under static loads; (2) the internal relationship between major cracks, stress, and displacement variations during the progressive failure process of clay slopes. To this end, the stress mechanism of major crack initiation and development in unsaturated clay under tensile and shear failure is firstly derived in Section 2. Section 3 describes the model test conducted on a large-scale clay slope with arc-shaped slip surface to monitor changes in horizontal and vertical stresses in the slip mass and the development of slope shoulder displacement under the action of the set load sequence. Finally, the experimental and monitoring results are analyzed and discussed in Section 4.

2. Stress Mechanism of Major Crack Initiation and Development

The occurrence of clay landslides are usually controlled by major cracks [28]. Cracks are the result of many factors, and tension is only one of the possible causes. At present, tensile failure is frequently the sole failure criterion employed by studies on soil cracking [44]. Soil belongs to a kind of friction material and mainly shows shear failure. Therefore, it is necessary to consider the tensile, compressive, and shear properties of soil during the initiation and development of clay cracks. When studying soil cracking from the perspective of stress, the first thing to do is to define the yield characteristics of the soils in the stress regions related to the cracking process. This study adopted the Mohr–Coulomb (M–C) criterion commonly used in stress perturbations caused by static loads. Critical state soil mechanics is often used to judge soil cracking [45]. When shear failure of the unsaturated soil reaches the limit state, the following applies [46]:
σ 1 σ 3 = 6 c cos φ 3 sin φ + [ ( σ 1 + σ 3 2 u a ) + χ ( u a u w ) ] 6 sin φ 3 sin φ
There is an extended M–C criterion for unsaturated soils when shear failure occurs:
σ 3 u a = 1 sin φ 1 + sin φ ( σ 1 u a ) 2 cos φ 1 + sin φ [ c + χ ( u a u w ) tan φ ]
Combining Equations (1) and (2) results in the following:
σ 3 u a = [ c / tan φ + χ ( u a u w ) ] = t
In Equations (1)–(3), σ 1 and σ 3 are the maximum and minimum principal stresses, respectively; c is the effective cohesion; φ is the effective internal friction angle; u a and u w are the pore air pressure and pore water pressure, respectively; and χ is the parameter related to the matrix suction ( u a u w ) . t * = c / tan φ + χ ( u a u w ) is the M–C criterion tensile strength of unsaturated soil.
Under the condition of constant matrix suction, the normal stress σ in [47] can be replaced with the net normal stress ( σ u a ) to obtain Equation (4). This replacement is based on two considerations. First, Baker’s analysis is based on normal stress; second, despite the fact that the failure surface shape of the M–C criterion for unsaturated soils is controlled by the dual stress variables ( u a u w ) and ( σ u a ) , ( u a u w ) is a function of saturation and the permeability coefficient of the clay is very small. When the saturation of a certain place in the clay does not change significantly, that is, ( u a u w ) remains basically unchanged, and the failure surface of the M–C criterion of unsaturated soil is projected on the shear stress and net normal stress plane, it still has the same form as the classic M–C criterion.
σ 3 u a = 1 sin φ m cos 2 φ m [ ( σ u a ) c m cos φ m ]
In Equation (4), φ m and c m are the effective internal friction angle and effective cohesion after strength reduction, respectively, which are determined by tan φ m = tan φ / f and c m = c / f , where f is the reduction factor.
The net normal stress should not be less than the tensile strength:
σ 3 u a t
The actual tensile strength t of the soil is not larger than t , that is, 0 t t , where t is determined by Equation (3). Substituting Equation (5) into Equation (4) produces the following:
σ u a [ cos φ m ( t cos φ m 1 sin φ m c m ) ] = T
where T = T ( c , φ , t , f ) = cos φ m [ t cos φ m / ( 1 sin φ m ) c m ] .
The condition for the intact soil to start to appear with a tensile crack is as follows [48]:
σ u a T
We assume that the compressive stress is positive according to the soil mechanics sign convention. From the viewpoint of continuum mechanics, σ u a = 0 or Δ ( σ u a ) = 0 exists in the continuous changes in stresses from σ u a > 0 to σ u a T < 0 .
The shear strain field of intensely fissured clays is very similar to that of unfissured clays [49,50]. Shortly before the peak deviator stress, the shear band is formed and cracks begin to occur; thereafter, the shear band develops further and the cracks gradually extend and connect; long after the peak stress, shear failure occurs. When shear deformation develops to a certain extent, a shear band characterized by shear element will appear [51]. Taking into account the softening of geomaterials, the shear stress–strain relationship of the M–C criterion can be simplified to a linear form [52]. When the shear element is in a plastic state, the following applies [53]:
d τ d ε s = G s ( σ u a p a ) n   { > 0 < 0   ( τ r < τ < τ f ) ( τ r < τ < τ f + )  
where G s is a small amount that tapers to zero; p a is the standard atmospheric pressure; n is the compression index, which is a positive value; ε s is the shear strain; τ r is the residual shear strength; τ f and τ f + are the pre- and post-peak shear stress, respectively.
Equation (7) modified the formula in [53], replacing σ with σ u a and dividing the peak shear stress τ f into two parts ( τ f and τ f + ) to determine the value of d τ / d ε s . The reason for dividing τ f into two parts is because the simplified linear form of the shear stress–strain differential relationship is not continuous at τ f , so the value at d τ / d ε s does not exist. The replacement of stress is based on similar (but not the same) nonlinear shear stress–strain relationship with saturated soil and the extended M–C criterion projected on the plane of shear stress and net normal stress. Although the shear stress–strain curve is nonlinear, the constitutive equation of soil must satisfy the continuous and smooth conditions [35]. Thus, the curve is approximately smooth at τ f and d τ / d ε s = 0 , thereby Δ τ = 0 or Δ ( σ u a ) = 0 exists when it is extremely close to τ f (or shear cracks generate).
Cracks in soil occur successively rather than simultaneously [14,54]. When cracks in soil develop with depth, tensile cracks will eventually stop developing due to increase in effective stress. At a certain depth inside the soil, the tip of the tensile crack will change from a tensile state to a compressive state. If the shear crack occurs at this time, Δ ( σ u a ) = 0 will still exist. Considering the stress conditions that exist immediately after the crack is formed [55], the stress distribution on the walls of a crack still has the abovementioned situation. In summary, the principal stress-based Δ ( σ u a ) = 0 can be set as the stress mechanism of the initiation and development of major cracks. This also means that there will be a sudden change in stress near the crack.
The numerical simulation methods in [17,18,19,56] to simulate the initiation and development of cracks demonstrate the correctness of the principal stress-based criterion in this work. The yield criterion used in most slope analyses is the M–C function [57]. In contrast, however, the yield conditions in tensile stress field are mostly nonlinear, and the M–C criterion may have some limitations in explaining the soil behavior under tensile stress. When the strength envelope is nonlinear, it is very difficult to find the specified value of the material function in the deformation field. Therefore, the nonlinear strength envelope is first replaced by linear approximation in the literature, and material constant is used instead of material function [58]. The authors of [47] carried out such an approximate substitution in their analysis.
In the practical monitoring of slope engineering, it is often difficult to measure the shear stress when the earth pressure cell (EPC), the most commonly used stress monitoring tool, is utilized, and the measured σ x and σ z are not necessarily the principal stresses. In classical plastic mechanics, under the plane strain condition where the principal stress axis rotation is not considered, if Δ ( σ u a ) is abbreviated as Δ σ , the following exists when the soil unit is in the limit state:
Δ σ x = Δ σ 1 + Δ σ 3 Δ σ z = k Δ σ 3 Δ σ z
where σ x and σ z are the horizontal and vertical stresses, respectively; the constant k = 1 + tan 2 ( π / 4 + φ / 2 ) ; and φ is the internal friction angle.

3. Model Experiment

Although other types of strata may exist beneath the clay layers in basins or river terraces, when the clay layers are relatively deep, the slip surfaces of the clay landslides are usually circular type or log-spiral type. In this model test, an arc-shaped slip surface with a radius of about 3.7 m was constructed. The slide bed was constructed using MU20 shale bricks and M5 cement mortar (cement/sand = 1:1), and the slip surface was plastered with the same proportion of cement mortar. After that, the soil slope was filled. The size of the entire slope model is shown in Figure 1. The whole test model was carried out in a model box welded by square steel tubes with a net size of 4.5 m × 2.0 m × 1.6 m (length × width × height).
The soil slope was filled by layered and uniform compaction, and about 8 tons of remolded clay was used. During the test, the stress changes in the middle plane of the model (see Figure 1) were monitored. During the soil filling process, a total of 15 groups of EPCs with orthogonal directions were buried in five rows at the stress monitoring points, as shown in Figure 2. The horizontal and vertical EPCs were used to monitor the vertical and horizontal stresses, respectively, at the measuring points during the loading process. In order to ensure the EPCs maintain better contact with the surrounding soils and transfer tensile stresses, the gaps between each EPC and the soils were filled with cement bentonite grouting [41].
The load sequence applied to the test was 5, 10, 20, 30, 40, 60, 80, 100, 120, 140, and 150 kN. After a certain level of load, the next level of load was applied after the displacement gauge at the slope shoulder of the stabilized monitoring plane. The liquid limit and the plasticity index of the model clay (derived from Chongqing) were 30.33% and 13.13%, respectively. The model clay included the illite and montmorillonite clay minerals. The sieving curve and physical and mechanical parameters of the test soil are shown in Figure 3 and Table 1, respectively. For more information on detailed filling process of the model slope and test loading system, see Hou et al. [59].

4. Results and Discussion

4.1. Major Cracks and Displacement

For the convenience of presentation, the ratio of the unit load to the slope shoulder displacement is defined as the deformation rate (DR hereafter). According to DRs, the landslide evolution process can be divided into four stages, namely compression, uniform, acceleration, and failure stages.
(1) Compression stage (0–40 kN): The deformation of the soil slope at this stage was mainly manifested in the obvious compression of the soils under the bearing plate and small horizontal displacement at the slope shoulder, as shown in Figure 4a. At the end of this stage, the slope shoulder displacement was 1.44 mm, and the average value of DRs was 0.033. No cracks were observed at this stage.
(2) Uniform stage (40–100 kN): While the soil slope was gradually compacted, there was an obvious horizontal displacement change at the slope shoulder. The DRs of the soil slope under each step were in the range of 0.12–0.15, the deformation of the slope showed a certain degree of stability, and the average value of DRs was 0.144. When the load reached 100 kN, a vertical crack appeared at the rear edge of the loading position, as shown in Figure 4b.
(3) Acceleration stage (100–140 kN): The slope shoulder displacement increased rapidly, reaching 21.61 mm. The average value of the DRs was 0.289, which was nearly 9 times that of the compression stage. The DRs increased from 0.264 to 0.313, showing the characteristics of accelerated deformation. At this stage, as load increased, the vertical crack at the trailing edge continued to develop downward and the width of the crack gradually increased, as shown in Figure 4c. When it was 120 kN, a crack began to appear in the soils under the front edge of the bearing plate, and the crack gradually extended toward the toe of the slope as load continued. With the development of the front edge crack, the slope shoulder displacement further intensified.
(4) Failure stage (140–150 kN): At this stage, the DR increased sharply to 0.793, and the slope slid down along the slip surface. The test loading system could no longer maintain a stable load and landslide occurred, as shown in Figure 4d.
As can be seen, the progressive development of slope displacement was closely related to the initiation–development process of cracks. When there were no cracks, the slope displacement increased slowly or uniformly. When cracks appeared on the rear edge of the bearing plate (corresponding to 100 kN), the displacement began to increase rapidly. Further development of vertical cracks at the rear edge and the appearance (corresponding to 120 kN) and expansion of new cracks at the front edge caused the slope displacement to increase sharply.

4.1.1. Factors Affecting the Development of Cracks in Clay Slopes

There are many factors affecting the development of cracks in clay slopes, and these have been preliminarily explained in the introduction. Soil is a complex granular material, and its mechanical behavior is closely related to its stress state. From the perspective of micromechanics, fissures are ubiquitous in the soil, and there is closure and connection of fissures in soils during the stress variation process. Although there may be plenty of fissures in the slope, the primary cracks are generally related to the failure mechanism [28]. This study focused on the initiation and development of major cracks of a clay slope under vertical static loads.
At present, with regard to the influence of open cracks and formation cracks on slope stability, the literature on the subject is mostly divided into three considerations, namely situations where cracks are of known depth and unknown location, situations where cracks are of known location and unknown depth, and situations where cracks are of unknown depth and unknown location. This study considered the most unfavorable scenario where both the location and the depth of the crack are unknown [26]. In addition, the precise measurement and implications of the particular width of a crack is a very complex issue [54], and this study did not do any research on this subject.

4.1.2. Influence of Preset Slip Surface and Loading Mode

In the theoretical analysis of the stability of cracked clay slopes, scholars generally construct a log-spiral slip surface. The arc-shaped slip surface constructed in this model test is similar to the slip surface type in the abovementioned theoretical analysis, and the circular arc failure surface is a common failure form of clay slopes. The depth of the vertical crack at the rear edge of the clay slope is restricted as it is affected by the fixed slip surface. During the cracking process, the soil mass is accompanied by stress release [54], and the stress redistribution near the vertical crack complicates the stress field of the soil mass on the rear edge of the clay slope to a certain extent.
In addition to monitoring the development of horizontal displacement on the slope shoulder, the displacement under the bearing plate was also monitored. The compression of soils under the bearing plate was about 7 mm at 5 kN and about 16 mm at 100 kN. Even though the loading test was carried out two weeks after the completion of filling, the soil was not completely consolidated. The two major cracks observed in the test were affected by the differential settlement to a certain extent.

4.2. Major Cracks and Stress Variations

4.2.1. Evolution of Major Cracks with Horizontal and Vertical Stresses

The purpose of EPC 51 was to monitor the stress changes in the slip surface at the toe of the slope. During the test loading process, EPC 42 was damaged, and no valid data were collected. Therefore, we took the horizontal stress changes in the first three layers and the slip surface for analysis, as shown in Figure 5. The development of stresses also showed progressiveness. In order to compare the four stages of displacements with the development stages of stresses, 40, 100, and 140 kN are given in Figure 5. In order to investigate the relationship between stress changes and displacement development more intuitively and to avoid repetition in the meantime, the slope shoulder displacement monitored by the displacement gauge is only marked in Figure 5a.
As can be seen in Figure 5, as the load increased, the horizontal stress showed an overall increasing trend. The horizontal stress curves had relatively obvious inflection points at 100 and 140 kN (corresponding to inflection points A and B, respectively), and the curves displayed a more obvious three-stage process. In Table 2, analysis of the slopes of the horizontal stress curves of the first three layers showed that, except for the measuring points 11, 21, and 31 constrained by the left slip surface, overall, the closer to the center of the bearing plate, the faster the increase in horizontal stress. As shown in Figure 5a–c, compared to other measuring points, the horizontal stress values of the measuring points directly under the bearing plate were larger overall. These findings demonstrate that in the entire soil slope, the distribution characteristic of the horizontal stresses was large at the back and small at the front. For the convenience of the following description, the area directly under the bearing plate is defined as the “loading zone”.
The first stage (corresponding to compression stage and uniform stage of displacement) was 0–100 kN. Before inflection point A, the horizontal stresses of each measuring point showed a linear increase. The third stage (corresponding to the failure stage of displacement) was 140–150 kN, and landslide occurred at this stage. After the inflection point B, the horizontal stresses of each measuring point dropped significantly, which is shown in Table 2 as negative slope of curve values.
The second stage (corresponding to acceleration stage of displacement) was 100–140 kN. After inflection point A, horizontal stresses at this stage generally increased rapidly, as shown in Figure 5 and Table 2. In the 100–140 kN stage, the trailing edge crack continued to deepen and widen until it reached the slip surface. Yield failure occurred in the soils near the trailing edge crack. When loading continued, the stress tended to transfer from the loading zone to the soils without yield failure in the direction of the slope surface, and the front edge crack appeared later (at 120 kN). Therefore, only a few measuring points (such as measuring point 12 in Figure 5a, point 23 in Figure 5b, and points 32 and 33 in Figure 5c) inside the soil exhibited small inflection points at 120 kN. This phenomenon is mainly caused by stress concentration in the vicinity of the crack [42,60]. Compared to other measuring points inside the soil, measuring points 11, 21, 31, and 41 along the slip surface were more sensitive to the appearance of front edge crack, which is depicted as small inflection points at 120 kN in Figure 5d. Combining the displacement characteristics of the slope, it can be seen that the appearance of front edge crack aggravated the progressive failure of the slope along the slip surface to some extent, and the appearance of small inflection points on the horizontal stress curves along the slip surface was the response to the front edge crack.
As shown in Figure 5d, the initial horizontal stress values of each measuring point along the slip surface (except measuring points 41 and 51) were basically the same. During the loading process, the closer to the lower part of the slip surface, the greater was the horizontal stress value of the measuring point. This indicates that the horizontal stresses gradually accumulated along the slip surface during the slope failure process. Combined with the abovementioned horizontal stress distribution characteristics, it can be seen that the landslide process was progressive.
From the above analysis, we can conclude that the horizontal stress change process was consistent with the slope crack development process. As for the monitoring points near the slope surface (such as points 14, 24, and 34), there was no inflection point A. On the one hand, these points were far from the loading center and were less affected by the loading; on the other hand, they were in a partially unconfined stress state.
Compared with the horizontal stresses, the vertical stresses were much larger and basically maintained linear growth as the load increased from 0 to 140 kN, as shown in Table 2. Affected by the vertical loading mode, the stages of the vertical stresses were not obvious.

4.2.2. Locations and Depths of the Major Cracks

Three main parameters need to be analyzed during the formation and propagation of major cracks [14], namely the stress level, the crack initiation, and the direction and length of crack propagation. The first factor was discussed in Section 2. In practical terms, we are unlikely to investigate the stress change process of the soil unit point by point, and burying more sensors in the soil slope will also face the problem of high cost. The progressive failure process of a soil slope is also a process of stress transfer and redistribution in the soils. During the loading process of this test, Δ σ z changes linearly (shown in Table 2). Combined with Equation (8), the sudden change of the principal stress near the crack would inevitably lead to the sudden change in Δ σ x . When investigating the stress changes in two adjacent measuring points under the same load step, the measuring points on both sides of the crack should show the phenomenon of discontinuous stress transfer.
The stress analysis during the aforementioned loading process showed that for the progressive failure process of the clay slope, the changes in horizontal stresses were more sensitive than those of vertical stresses. When investigating the locations and depths of the cracks, horizontal stresses were adopted. The horizontal stress differences between two adjacent measuring points in the same layer of the soil slope are shown in Figure 6. Both the fourth and fifth layers were not analyzed because there was only one available stress monitoring point.
The difference curves were generally below the zero line, indicating that the distribution characteristics of the horizontal stresses in the soil slope were large in the rear part and small in the front part centered on the loading position. Curves 13–14, 23–24, and 33–34 basically remained linear in the 0–140 kN stage because the corresponding measuring points were in the nonyielding zone during the loading process, and the stress transfer process always follows the elastic or elastoplastic law. The difference curves basically stayed linear during 0–100 kN, possibly because the measuring points were not affected by cracks in this stage.
In the first layer, there was an obvious turning point in the difference curve 11–12 at 100 kN, indicating that it was affected by the trailing edge crack. The difference curve 12–13 showed a linear transfer form before 120 kN, and deflection occurred at 120–140 kN, indicating that it was affected by the front edge crack. In the second layer, the difference curve 21–22 increased during the 100–120 kN period, certifying that no cracks appeared between the measuring points 21 and 22, and the trailing edge crack appeared on the left side of the measuring point 21. During the period of 100–120 kN, the horizontal stress differences between measuring points 23 and 22 changed from a positive value to a negative value, indicating that the front edge crack passed through the area between the two measuring points. In the third layer, the difference curve 31–32 was always negative, and the slopes of the curve did not change significantly during the period of 100–140 kN, demonstrating that there was no crack between the two measurement points. However, the differences between measuring points 33 and 32 changed from zero to an increasingly obvious negative value during the period of 0–100 kN, demonstrating that there was a crack passing between the two measuring points. As for curves 11–12 and 21–22, they remained level during 100–140 and 120–140 kN, respectively, which might have been affected by the plastic zones in the loading process.
Two major cracks were obtained through the difference analysis of horizontal stresses (or transfer process analysis). The first major crack (trailing edge crack) was near the measuring point 11 and on the left side of the measuring point 21. The second major crack (front edge crack) passed through the following areas from top to bottom: between points 12 and 13, between points 22 and 23, and between points 32 and 33. The determined positions and depths of the two cracks were basically the same as those observed in the experiment.

4.2.3. Rationality and Correctness of the Test Method to Monitor the Evolution of the Major Cracks

FLAC3D was used in this study to conduct numerical simulation of the test loading process (as shown in Figure 7). The slope model was divided into three parts: slip mass, slip surface, and slide bed. The parameters are shown in Table 1. The shear strength parameters of these three parts met the requirements of the smallest slip surface, followed by the slip mass and the largest slide bed [61]. In Table 1, the parameters of the slip mass were obtained from the normally consolidated drained triaxial compression tests of remolded clay samples, and the parameters of the slide bed were referenced from Yong et al. [62].
Before the occurrence of cracks, the soil slope can be regarded as a continuum without stress concentration [18], and its critical sliding surface is usually determined by the peak shear strength of the clay. The most influential factors on the characteristics of cracked clay are the direction and strength of cracking [63], and the available shear strength of cracks is equal to the peak strength of the normally consolidated drainage specimens [64]. In this study, the maximum difference between the simulated horizontal displacement of the slope shoulder and the measured displacement was 2.60 mm (140 kN), the maximum difference between the horizontal stresses at the slip surface was 8.68% (140 kN at point 31), and the difference between the horizontal stresses at the other measuring points was no more than 4.13%, indicating that the numerical simulation results were in good agreement with the measured results.
Uniaxial and triaxial tests of clay samples have shown that fissured clays and unfissured clays have two fracture modes, namely opening and sliding, but they are different in diverse parts of the samples [49,60]. As shown in Figure 7, in this test, the trailing edge crack was of the tension–shear type, while the front edge crack was of the shear type. In this experiment, the front edge of the bearing plate appeared as a diagonal crack with a biased downslope direction. This might have been caused by the rotation of the principal stress axes of the soil units during the loading process, where the crack deviated from the vertical direction with deepening.
The M–C criterion is an ideal plastic criterion. When reaching tensile strength or shear strength, the soil yields. Although the development law of plastic zone in the soil slope is basically consistent with crack propagation, the experimental phenomena of crack generation and the numerical simulation in Figure 7 show that yielding is a necessary but insufficient condition for crack generation. The progressive failure process of clay slope is more sensitive to changes in horizontal stresses. In this study, stress saltation was obtained by horizontal stress increment analysis, and the cracking of soil was then analyzed. On this basis, the locations and depths of the major cracks were obtained. Taking into account the different changes in Δ σ 3 at different measuring points of diverse depths, the discontinuity of Δ σ x saltation in the stress transfer process between the two adjacent measuring points near the crack is represented by the changes from a negative value to an even smaller negative value, from a positive value to a negative value, or from zero to a negative value. This can be illustrated by the changes in horizontal stress increments between points 12 and 13, 22 and 23, and 32 and 33 during the front edge crack propagation.
The location and depth of a crack are critical to slope stability, but the location of the crack has the greatest influence [28], and in most cases, the depth of the crack cannot be accurately estimated [27]. Burying too many EPCs would destroy the integrity of the soil slope and make the test results unreliable. In this test, the adjacent EPCs were 30–60 cm apart in the horizontal direction. Therefore, while the stress increment analysis of the horizontal earth pressures could determine which two EPCs the crack appeared between, it could not determine the exact horizontal position of the crack. Each row of EPCs was 20–30 cm apart in height, so only the approximate depths of cracks could be determined. In addition, EPC 42 was damaged during the test and no available data were collected on it, so the situation of cracks in the fourth layer could not be analyzed. In engineered slope monitoring, it is neither economical nor necessary to embed too many sensors. For the size of the landslide model in this study, the determination of the locations and depths of the major cracks was relatively accurate.

4.3. Intrinsic Consistency of the Evolution of Major Cracks, Displacements, and Horizontal Stresses

PA = 100 kN and PB = 140 kN were the limit loads of displacement and stress changes corresponding to the initial loads in the acceleration and failure stages, respectively. The difference was that the displacement had a compression stage (0–40 kN) and a uniform stage (40–100 kN), while the changes in horizontal stresses only had three stages and basically kept a linear increase in the 0–100 kN period. In addition, although the appearance and development of the trailing edge crack aggravated the rapid growth of displacement, it was not obvious on the displacement monitoring curve (see Figure 5a). It did, however, show inflection points in the process of horizontal stress changes. This not only illustrates the presence of synchronization between crack development and horizontal stress changes but also demonstrates the rationality of crack research based on the stress angle. Analysis of the previous test results indicated that changes in horizontal stresses could also reflect the progressive landslide process. Therefore, the propagation of the major cracks and the progressive changes in displacement and horizontal stresses were intrinsically consistent, and the propagation of major cracks intensified the changes in displacement and horizontal stresses.

5. Conclusions and Suggestions

After carefully investigating the methods for stability assessment of cracked clay slopes and considering the drawbacks and deficiencies of currently available methods, an effective, practical, and relatively accurate stress mechanism of major crack initiation and development is proposed in this paper. A large-scale, arc-shaped slip surface clay slope model was constructed to verify the correctness of the proposed theory. Stress changes in the clay slope and the development of slope shoulder displacements under the set load sequence were monitored by EPCs and a displacement gauge. Based on the stress mechanism of major cracks, the locations and depths of the major cracks were determined. The relationships between the development of major cracks, stresses, and displacements during the progressive failure of a landslide were studied. The main conclusions and suggestions are as follows:
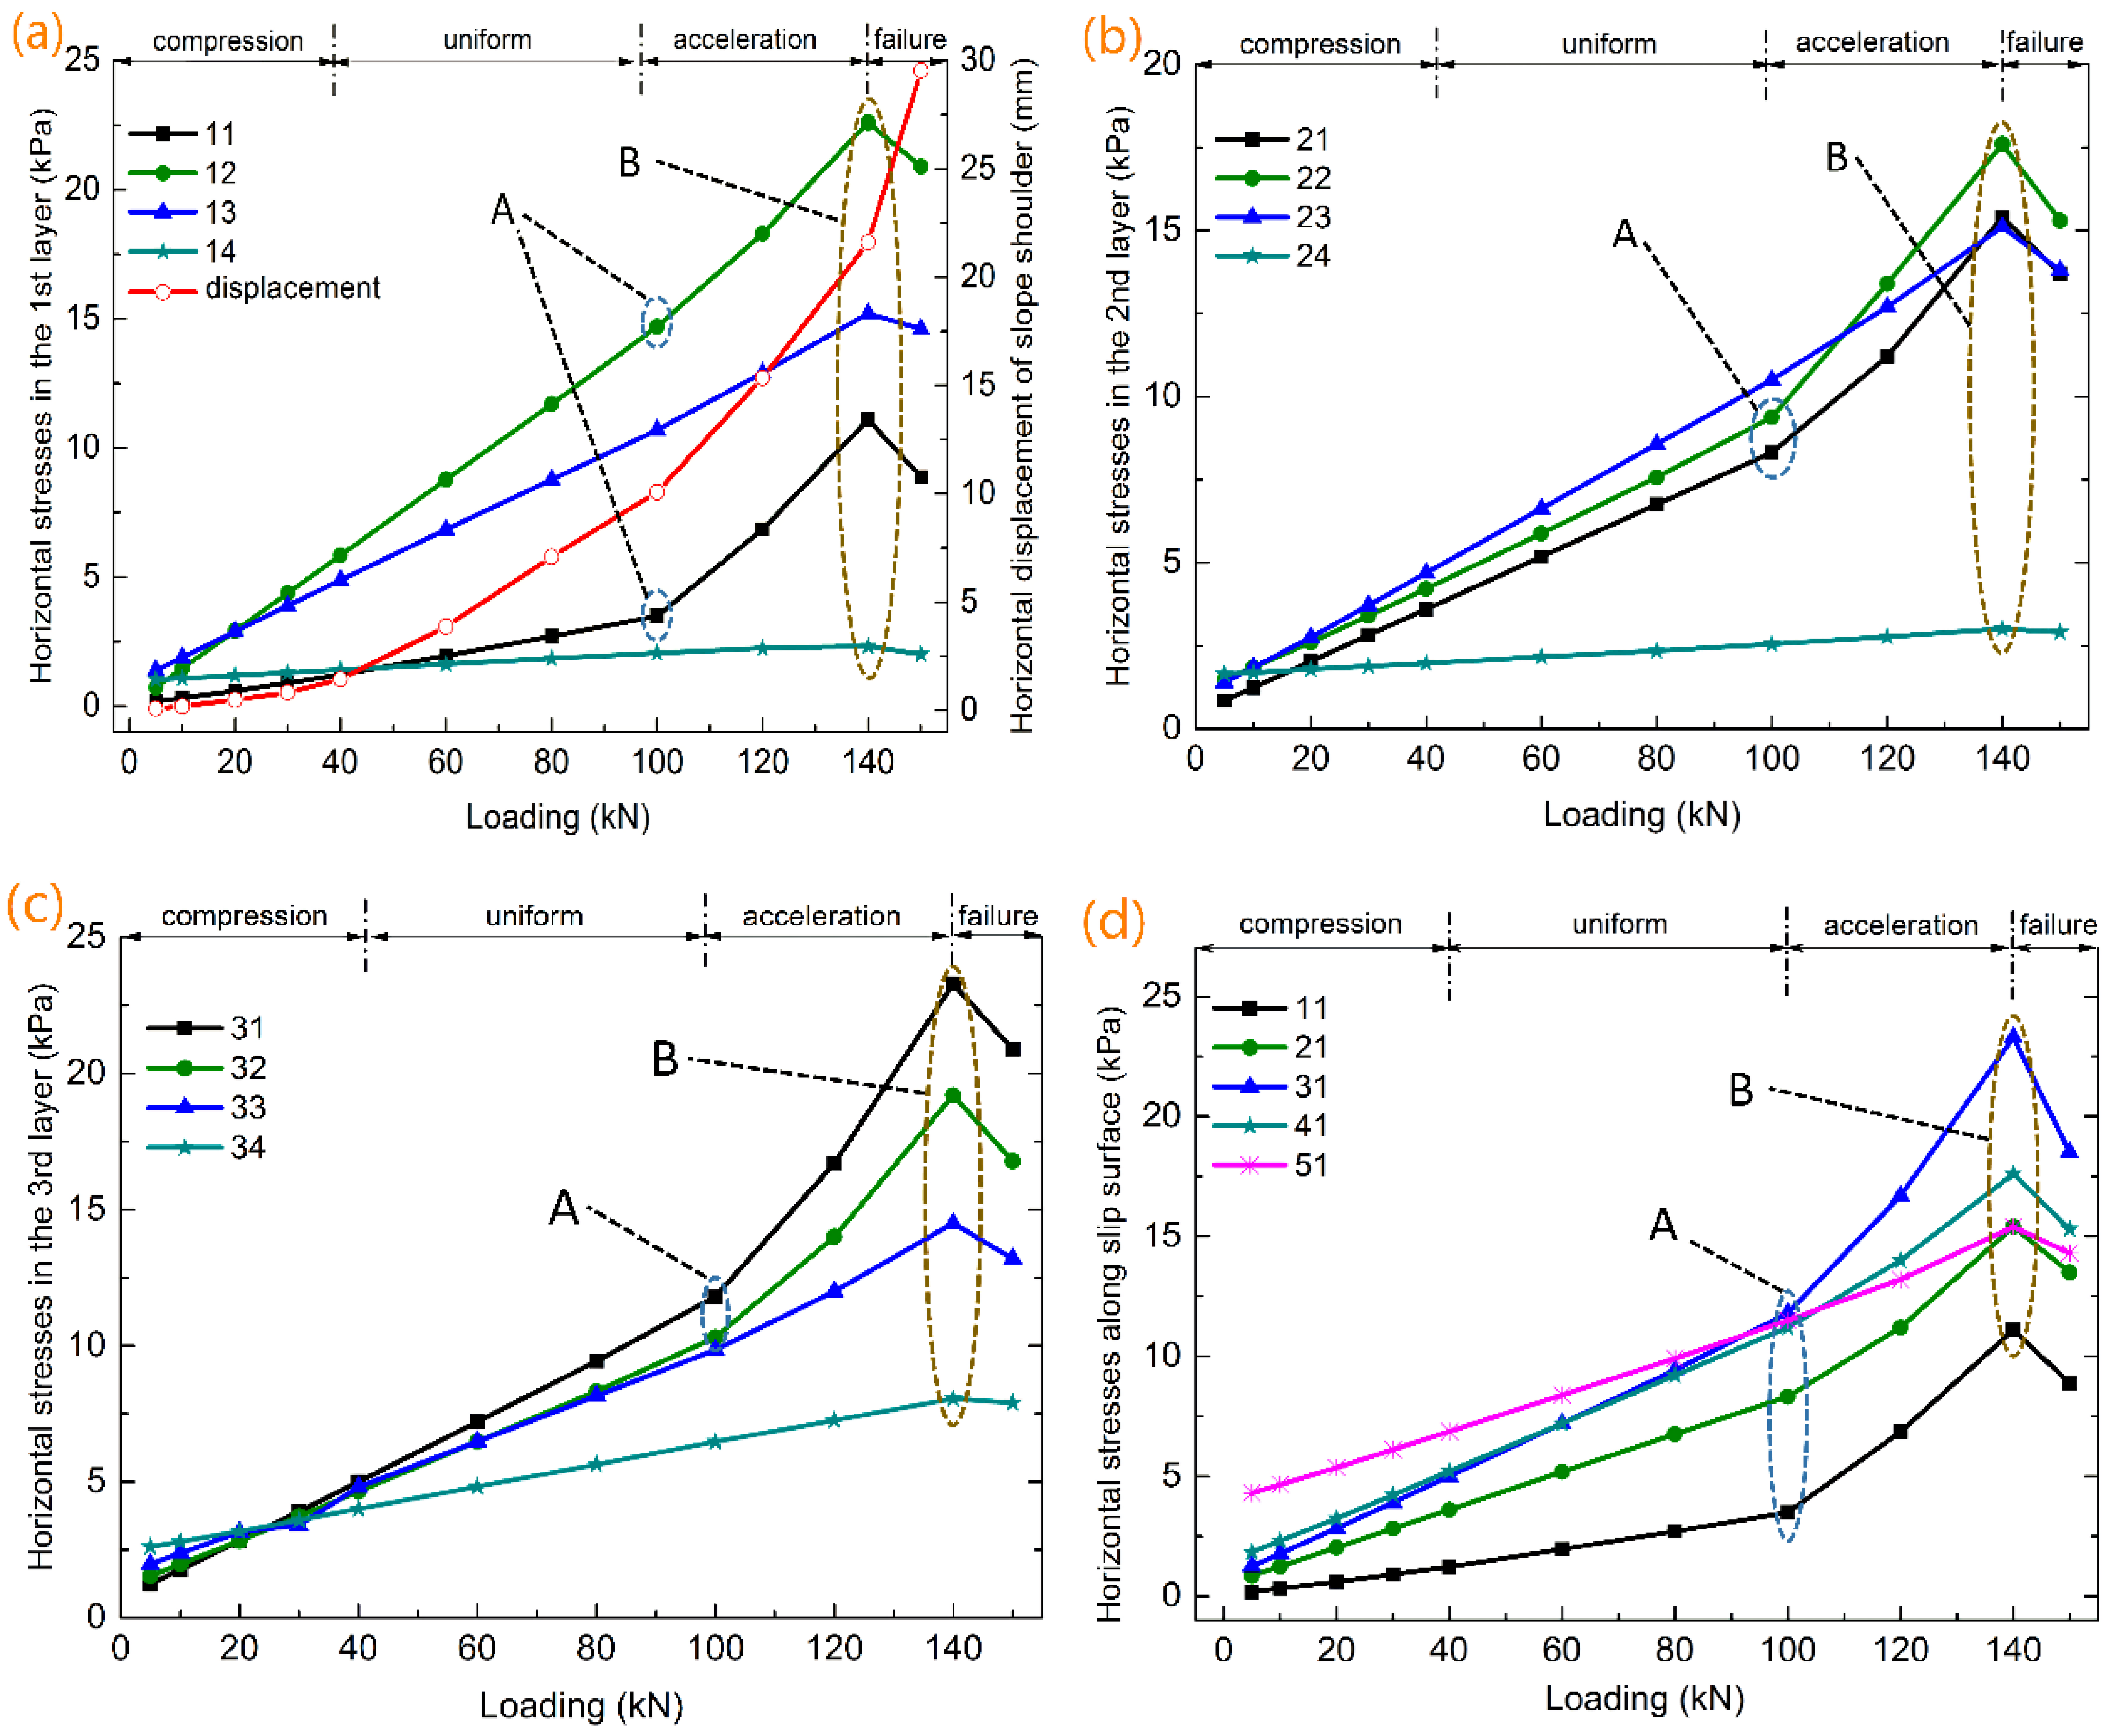
  • The development process of major cracks is inherently consistent with the variation processes of horizontal stresses near the major cracks and slope shoulder displacements. In addition, the limit loads of horizontal stresses and displacements are consistent. When no cracks appear, the displacements increase slowly or uniformly, while the horizontal stresses increase uniformly. When a trailing edge crack occurs, the development of horizontal stresses and slope shoulder displacements begin to accelerate in general. The occurrence of the front edge crack causes the horizontal stresses of the nearby measuring points to appear as inflection points. At the same time, the slope shoulder displacements develop rapidly.
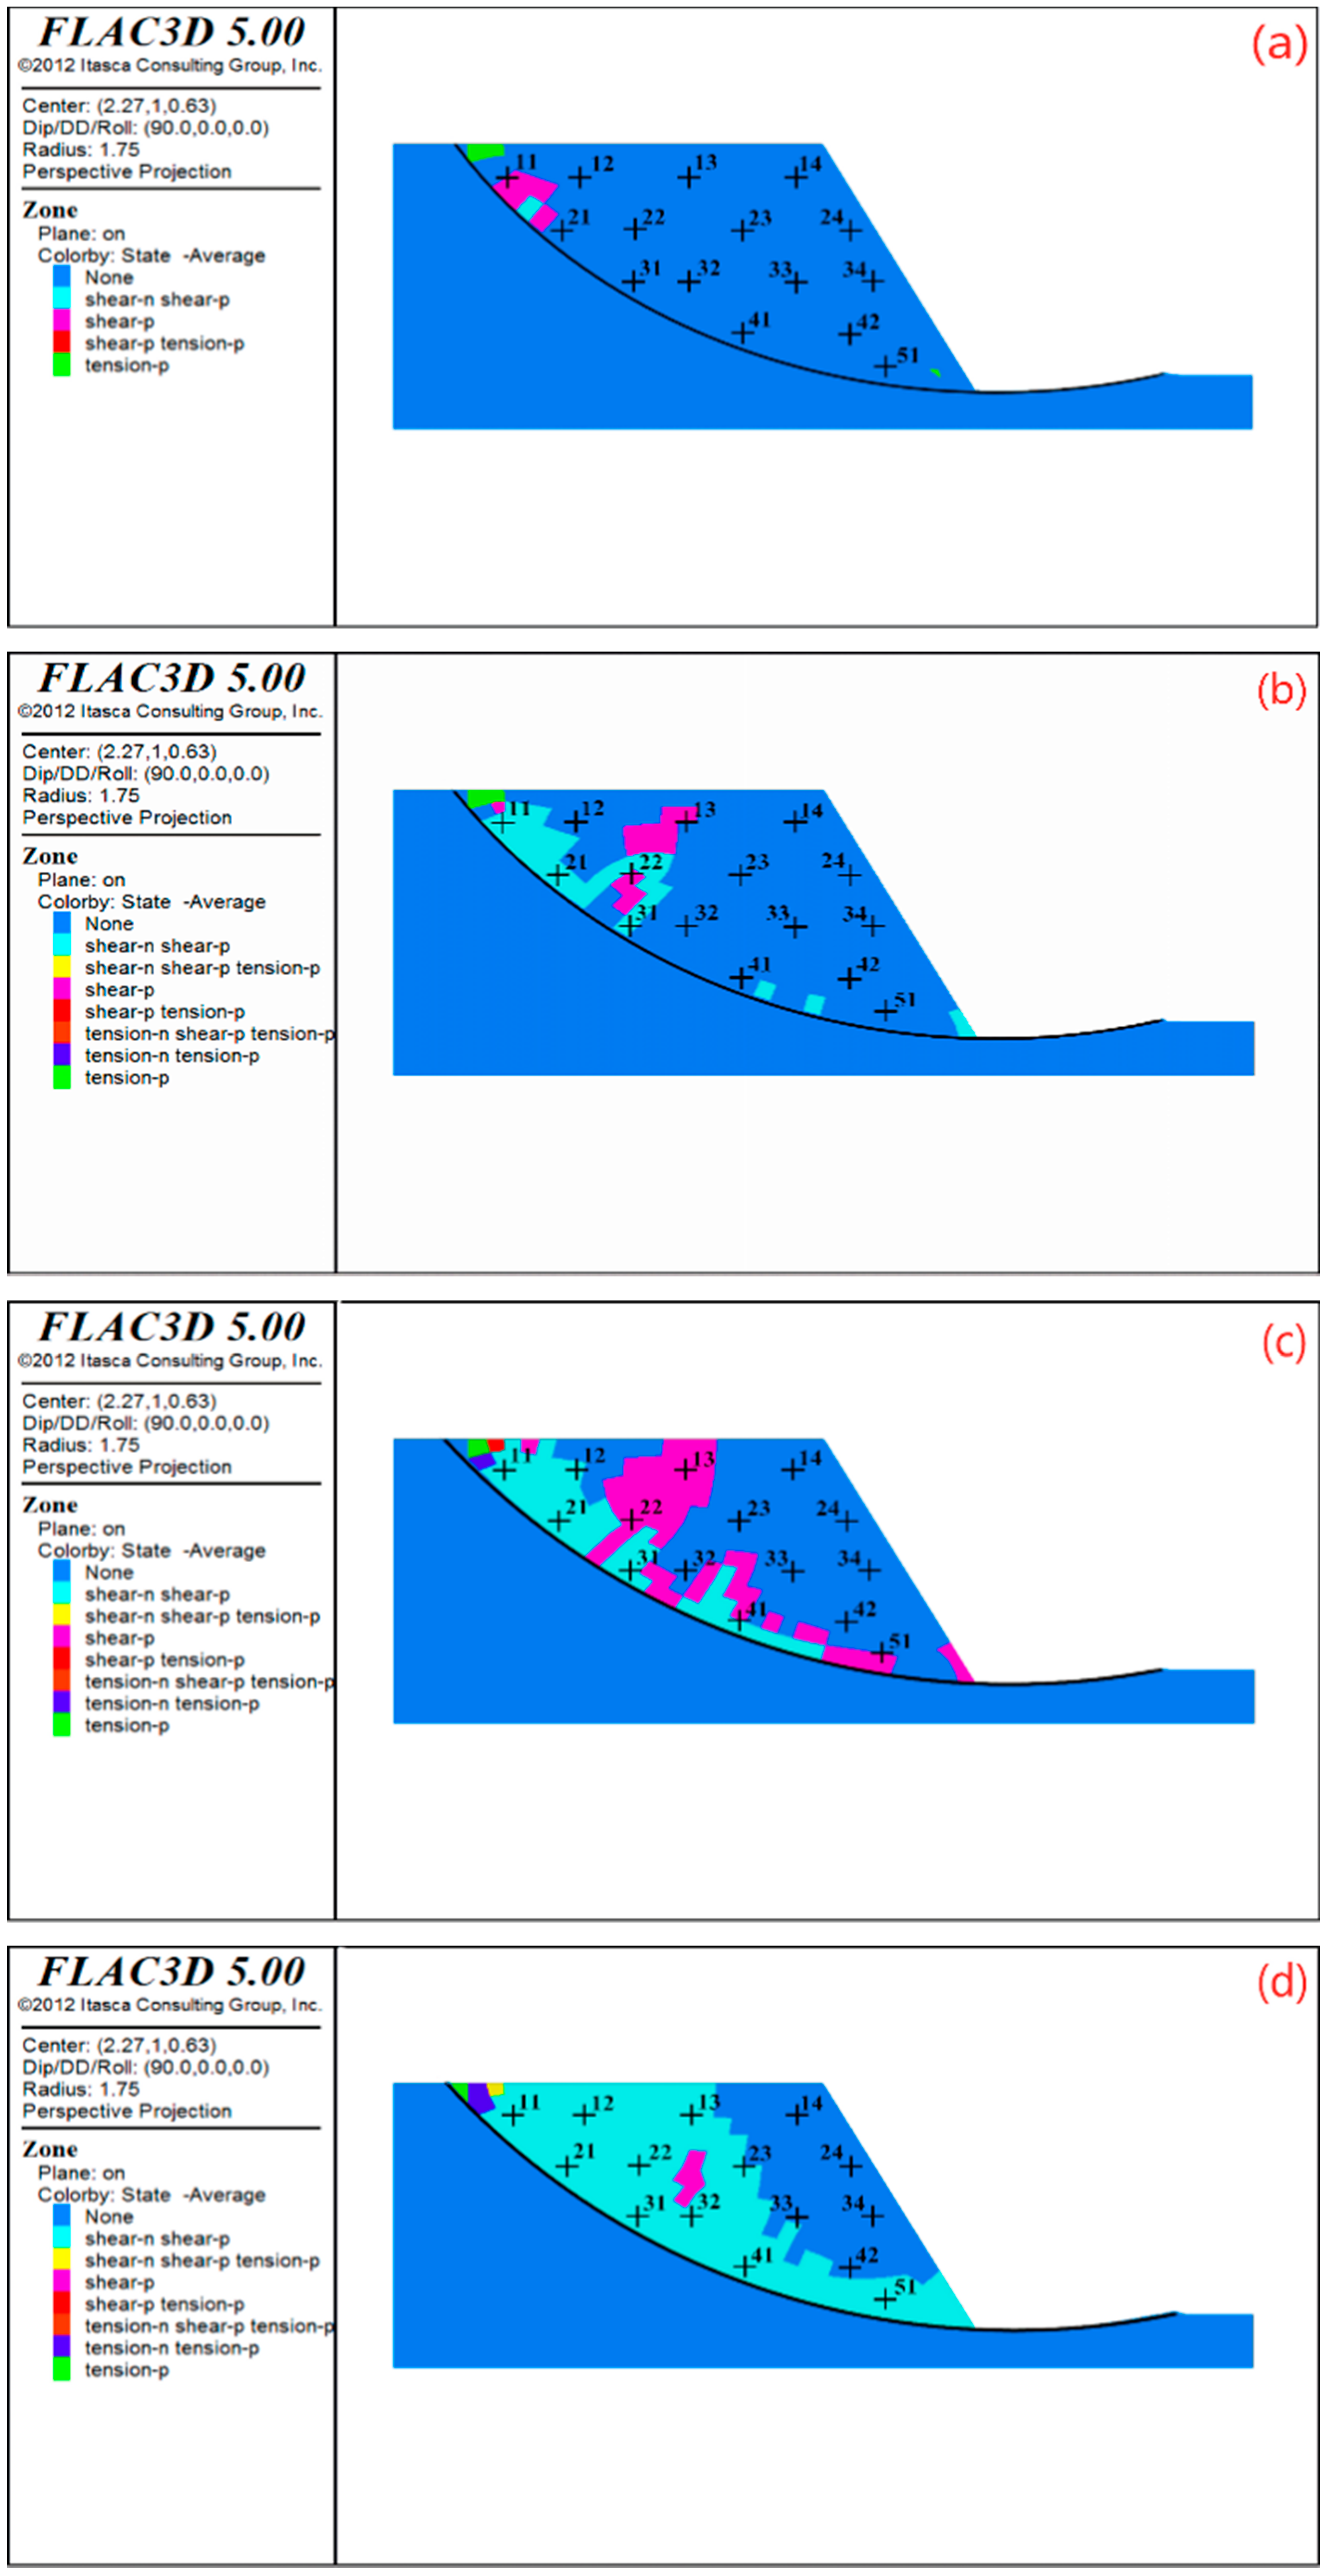
  • In the process of stress transfer and redistribution under loading, the horizontal stresses near the major cracks appear as inflection points and accelerated growth. The locations and depths of the major cracks could be determined by analyzing the horizontal stress differences between adjacent measuring points. It is recommended that horizontal stresses be used to reflect the development process of major cracks.
  • Due to the proximity to the slip surface, the appearance and development of the tension–shear vertical crack at the trailing edge have a more significant impact on the displacement of the slope shoulder and the horizontal stresses. Compared to the front edge shear diagonal crack, the trailing edge crack has a greater impact on the landslide.
The perspective of major crack–stress–displacement extends the existing methods for assessing the stability of cracked clay slopes, which is helpful in grasping the relationship between the internal stress variation characteristics of clay soil mass and the macroscopic deformation characteristics of clay slope in the progressive failure process, and also provides a certain reference for landslide prediction. In the future, the authors will extend the theory discussed in this paper to relatively complex strata and working conditions (such as rainfall, earthquake, etc.) and apply it to actual engineering slope monitoring.

Author Contributions

Conceptualization and methodology, H.H. and Z.Z.; experiment, H.H., B.W. and W.Z.; data processing, B.W.; original draft, H.H.; writing and editing draft, H.H. and Z.Z. All authors have read and agreed to the published version of the manuscript.

Funding

This work was funded by the National Natural Science Foundation of China, grant numbers 51478066 and 51178488.

Institutional Review Board Statement

Not applicable.

Informed Consent Statement

Not applicable.

Data Availability Statement

The data used to support the findings of this paper are available from the corresponding author upon request.

Acknowledgments

The authors greatly thank Baoyun Zhao, Tongqing Wu, and Ziyun Li from the School of Civil Engineering and Architecture, Chongqing University of Science and Technology, and Zhenyang Feng, Yong Zheng, Honglin Liu, and Feng Xiao, from the School of Civil Engineering, Chongqing University, for their help during the experiment.

Conflicts of Interest

The authors declare no conflict of interest.

References

  1. Keller, T.; Lamand, M.; Peth, S.; Berli, M.; Delenne, J.Y.; Baumgarten, W.; Rabbel, W.; Radja, F.; Rajchenbach, J.; Selvadurai, A.P.S.; et al. An interdisciplinary approach towards improved understanding of soil deformation during compaction. Soil Tillage Res. 2013, 128, 61–80. [Google Scholar] [CrossRef] [Green Version]
  2. Viswanadham, B.; Rajesh, S. Centrifuge model tests on clay based engineered barriers subjected to differential settlements. Appl. Clay Sci. 2009, 42, 460–472. [Google Scholar] [CrossRef]
  3. Tang, C.S.; Wang, D.Y.; Zhu, C.; Zhou, Q.Y.; Xu, S.K.; Shi, B. Characterizing drying-induced clayey soil desiccation cracking process using electrical resistivity method. Appl. Clay Sci. 2018, 152, 101–112. [Google Scholar] [CrossRef]
  4. Hu, F.; Li, Z.; Tian, Y.; Hu, R. Failure patterns and morphological soil–rock interface characteristics of frozen soil–rock mixtures under compression and tension. Appl. Sci. 2021, 11, 461. [Google Scholar] [CrossRef]
  5. Cheng, Q.; Tang, C.S.; Xu, D.; Zeng, H.; Shi, B. Water infiltration in a cracked soil considering effect of drying-wetting cycles. J. Hydrol. 2021, 593, 125640. [Google Scholar] [CrossRef]
  6. Sima, J.; Jiang, M.; Zhou, C. Numerical simulation of desiccation cracking in a thin clay layer using 3D discrete element modeling. Comput. Geotech. 2014, 56, 168–180. [Google Scholar] [CrossRef]
  7. Ren, J.H.; Li, X.J.; Zhao, K. Quantitative analysis of relationships between crack characteristics and properties of soda-saline soils in Songnen Plain, China. Chin. Geogr. Sci. 2015, 25, 591–601. [Google Scholar] [CrossRef]
  8. Cheng, Q.; Tang, C.S.; Chen, Z.G.; El-Maarry, M.R.; Zeng, H.; Shi, B. Tensile behavior of clayey soils during desiccation cracking process. Eng. Geol. 2020, 279, 105909. [Google Scholar] [CrossRef]
  9. Li, J.H.; Lu, Z.; Guo, L.B.; Zhang, L.M. Experimental study on soil-water characteristic curve for silty clay with desiccation cracks. Eng. Geol. 2017, 218, 70–76. [Google Scholar] [CrossRef]
  10. Feng, L.C.; Lang, X.Q. Experimental study on the mechanism of landslip crevices. J. Lanzhou Univ. 1980, 1, 120–130. [Google Scholar]
  11. Yu, J. Selection of parameters and method to determine forecasting standards for landslide. Chin. J. Geol. Hazard Control 1992, 3, 39–47. [Google Scholar]
  12. Chen, T.L.; Zhou, C.; Shen, Z.J. Analysis of deformation characteristics of clay. Rock Soil Mech. 2004, 25, 522–528. [Google Scholar]
  13. Lakshmikantha, M.R.; Prat, P.C.; Ledesma, A. Experimental evidence of size effect in soil cracking. Can. Geotech. J. 2012, 49, 264–284. [Google Scholar] [CrossRef]
  14. Levatti, H.U.; Prat, P.C.; Ledesma, A. Numerical and experimental study of initiation and propagation of desiccation cracks in clayey soils. Comput. Geotech. 2019, 105, 155–167. [Google Scholar] [CrossRef]
  15. Konrad, J.M.; Ayad, R. An idealized framework for the analysis of cohesive soils undergoing desiccation. Can. Geotech. J. 1997, 34, 477–488. [Google Scholar] [CrossRef]
  16. Yan, S.; Guo, B.; Chu, J.; Sun, L. Mechanism study and model tests on soft clay cracking. In Proceedings of the Geo-Shanghai 2014, Shanghai, China, 26–28 May 2014; ASCE Press: Reston, VA, USA, 2014; pp. 184–193. [Google Scholar]
  17. Trabelsi, H.; Jamei, M.; Zenzri, H.; Olivella, S. Crack patterns in clayey soils: Experiments and modeling. Int. J. Numer. Anal. Methods Geomech. 2012, 36, 1410–1433. [Google Scholar] [CrossRef]
  18. Lee, F.H.; Lo, K.W.; Lee, S.L. Tension crack development in soils. J. Geotech. Eng. 1988, 114, 915–929. [Google Scholar] [CrossRef]
  19. Vogel, H.J.; Hoffmann, H.; Leopold, A.; Roth, K. Studies of crack dynamics in clay soil II. A physically based model for crack formation. Geoderma 2005, 125, 213–223. [Google Scholar] [CrossRef]
  20. Morris, P.H.; Graham, J.; Williams, D.J. Cracking in drying soils. Can. Geotech. J. 1992, 29, 263–277. [Google Scholar] [CrossRef]
  21. Kodikara, J.K.; Choi, X. A simplified analytical model for desiccation cracking of clay layers in laboratory tests. In Proceedings of the Fourth International Conference on Unsaturated Soils, Carefree, AZ, USA, 2–6 April 2006; ASCE Press: Reston, VA, USA, 2006; pp. 2558–2569. [Google Scholar]
  22. Ma, J.; Chen, S.X.; Yu, F.; Feng, M.G. Experimental research on crack evolution process in fissured clay. Rock Soil Mech. 2007, 28, 2203–2208. [Google Scholar]
  23. Deng, G.; Shen, Z.J.; Yang, D.Q. Numerical simulation of crack formation due to desiccation in clay surface. Chin. J. Geotech. Eng. 2006, 28, 241–248. [Google Scholar]
  24. He, K.; Song, C.; Fell, R. Numerical modelling of transverse cracking in embankment dams. Comput. Geotech. 2021, 132, 104028. [Google Scholar] [CrossRef]
  25. Kitsunezaki, S. Crack growth and plastic relaxation in a drying paste layer. J. Phys. Soc. Jpn. 2010, 79, 124802. [Google Scholar] [CrossRef]
  26. Utili, S.; Abd, A.H. On the stability of fissured slopes subject to seismic action. Int. J. Numer. Anal. Methods Geomech. 2016, 40, 785–806. [Google Scholar] [CrossRef]
  27. Utili, S. Investigation by limit analysis on the stability of slopes with cracks. Géotechnique 2013, 63, 140–154. [Google Scholar] [CrossRef]
  28. Michalowski, R.L. Stability assessment of slopes with cracks using limit analysis. Can. Geotech. J. 2013, 50, 1011–1021. [Google Scholar] [CrossRef]
  29. Gao, Y.F.; Song, W.Z.; Zhang, F.; Qin, H.Y. Limit analysis of slopes with cracks: Comparisons of results. Eng. Geol. 2015, 188, 97–100. [Google Scholar] [CrossRef]
  30. Stockton, E.; Leshchinsky, B.A.; Olsen, M.J.; Evans, T.M. Influence of both anisotropic friction and cohesion on the formation of tension cracks and stability of slopes. Eng. Geol. 2019, 249, 31–44. [Google Scholar] [CrossRef]
  31. Li, Y.; Yang, X. Stability analysis of crack slope considering nonlinearity and water pressure. KSCE J. Civ. Eng. 2015, 20, 2289–2296. [Google Scholar] [CrossRef]
  32. Zhao, L.H.; Cheng, X.; Dan, H.C.; Tang, Z.P.; Zhang, Y. Effect of the vertical earthquake component on permanent seismic displacement of soil slopes based on the nonlinear Mohr–Coulomb failure criterion. Soils Found. 2017, 57, 237–251. [Google Scholar] [CrossRef]
  33. Zhao, L.H.; Cheng, X.; Li, L.; Chen, J.Q.; Zhang, Y.B. Seismic displacement along a log-spiral failure surface with crack using rock Hoek–Brown failure criterion. Soil Dyn. Earthq. Eng. 2017, 99, 74–85. [Google Scholar] [CrossRef]
  34. Li, Z.W.; Yang, X.L.; Li, T.Z. Static and seismic stability assessment of 3D slopes with cracks. Eng. Geol. 2020, 265, 105450. [Google Scholar] [CrossRef]
  35. Zheng, Y.R.; Kong, L. Geotechnical Plastic Mechanics; China Architecture and Building Press: Beijing, China, 2010. [Google Scholar]
  36. Michalowski, R.L. Reply to the discussion by Utili on “Stability assessment of slopes with cracks using limit analysis”. Can. Geotech. J. 2014, 51, 826–827. [Google Scholar] [CrossRef]
  37. Hu, X.W.; Li, Q.F.; Zhao, Z.S.; Kong, D.F. Mechanical properties of fissured clay. Chin. J. Geotech. Eng. 1994, 16, 81–88. [Google Scholar]
  38. Ma, H.S.; Hu, X.W. Numerical simulation research on fissure effect of clay masses. J. Mineral. Petrol. 1998, 18, 182–184. [Google Scholar]
  39. Abd, A.H.; Utili, S. Design of geosynthetic-reinforced slopes in cohesive backfills. Geotext. Geomembr. 2017, 45, 627–641. [Google Scholar] [CrossRef]
  40. Huang, R.Q. Geodynamical process and stability control of high rock slope development. Chin. J. Rock Mech. Eng. 2008, 27, 1525–1544. [Google Scholar]
  41. Leung, A.K.; Ng, C.W.W. Field investigation of deformation characteristics and stress mobilisation of a soil slope. Landslides 2016, 13, 229–240. [Google Scholar] [CrossRef] [Green Version]
  42. Vesga, L.F.; Vallejo, L.E.; Lobo-Guerrero, S. DEM analysis of the crack propagation in brittle clays under uniaxial compression tests. Int. J. Numer. Anal. Methods 2008, 32, 1405–1415. [Google Scholar] [CrossRef]
  43. Yalcin, A. The effects of clay on landslides: A case study. Appl. Clay Sci. 2007, 38, 77–85. [Google Scholar] [CrossRef]
  44. Gui, Y.L.; Zhao, Z.Y.; Kodikara, J.; Bui, H.H.; Yang, S.Q. Numerical modelling of laboratory soil desiccation cracking using UDEC with a mix-mode cohesive fracture model. Eng. Geol. 2016, 202, 14–23. [Google Scholar] [CrossRef]
  45. Xu, L.; Coop, M.R. Influence of structure on the behavior of a saturated clayey loess. Can. Geotech. J. 2016, 53, 1026–1037. [Google Scholar] [CrossRef]
  46. Lu, N.; Likos, W.J. Unsaturated Soil Mechanics; John Wiley and Sons: Hoboken, NJ, USA, 2004. [Google Scholar]
  47. Baker, R. Sufficient conditions for existence of physically significant solutions in limiting equilibrium slope stability analysis. Int. J. Solids Struct. 2003, 40, 3717–3735. [Google Scholar] [CrossRef]
  48. Baker, R. Tensile strength, tension cracks, and stability of slopes. Soils Found. 1981, 21, 1–17. [Google Scholar] [CrossRef] [Green Version]
  49. Vitone, C.; Cotecchia, F.; Desruse, J.; Viggiani, G. An approach to the interpretation of the mechanical behaviour of intensely fissured clays. Soils Found. 2009, 49, 355–368. [Google Scholar] [CrossRef] [Green Version]
  50. Vitone, C.; Viggiani, G.; Cotecchia, F.; Hall, S.A. Localized deformation in intensely fissured clays studied by 2D digital image correlation. Acta Geotech. 2013, 8, 247–263. [Google Scholar] [CrossRef]
  51. Zhang, G.; Hu, Y.; Wang, L.P. Behaviour and mechanism of failure process of soil slopes. Environ. Earth Sci. 2015, 73, 1701–1713. [Google Scholar] [CrossRef]
  52. Liu, C.N.; Wu, C.C. Integrating GIS and stress transfer mechanism in mapping rainfall-triggered landslide susceptibility. Eng. Geol. 2008, 101, 60–74. [Google Scholar] [CrossRef]
  53. Zhang, G.; Hu, Y. Numerical modeling of failure process of soil slopes. Int. J. Geomech. 2017, 17, 6016031. [Google Scholar] [CrossRef]
  54. Sun, J.C.; Wang, G.Q.; Sun, Q.C. Crack spacing of unsaturated soils in the critical state. Chin. Sci. Bull. 2009, 54, 2008–2012. [Google Scholar] [CrossRef] [Green Version]
  55. Lachenbruch, A.H. Depth and spacing of tension cracks. J. Geophys. Res. 1961, 66, 4273–4292. [Google Scholar] [CrossRef]
  56. Ayad, R.; Konrad, J.M.; Soulié, M. Desiccation of a sensitive clay: Application of the model CRACK. Can. Geotech. J. 1997, 34, 943–951. [Google Scholar] [CrossRef]
  57. Michalowski, R.L. Stability of intact slopes with tensile strength cut-off. Géotechnique 2017, 67, 720–727. [Google Scholar] [CrossRef]
  58. Michalowski, R.L.; Utili, S. Stability of intact slopes with tensile strength cut-off: Discussion. Géotechnique 2019, 69, 1123–1126. [Google Scholar] [CrossRef]
  59. Hou, H.J.; Wang, B.; Deng, Q.X.; Zhu, Z.W.; Xiao, F. Model experimental study on stress transfer and redistribution in a clay landslide under surcharge Load. Adv. Mater. Sci. Eng. 2020, 2020, 4269043. [Google Scholar] [CrossRef]
  60. Vallejo, L.E. Fracture criteria for fissured clays under mixed-mode loading. In Proceedings of the Geo-Frontiers Congress 2011, Dallas, TX, USA, 13–16 March 2011; ASCE Press: Reston, VA, USA, 2011; pp. 3858–3867. [Google Scholar]
  61. Lu, Y.F.; Huang, X.B.; Liu, D.F. Distribution characteristics of force and stability analysis of slope. Chin. J. Geotech. Eng. 2017, 39, 1321–1329. [Google Scholar]
  62. Yong, R.; Hu, X.L.; Tang, H.M.; Li, C.D.; Ma, J.W.; Song, Y.J. Model testing and numerical simulation study of evolutionary process of thrust load caused landslide. Rock Soil Mech. 2013, 34, 3018–3027. [Google Scholar]
  63. Cotecchia, F.; Vitone, C.; Santaloia, F.; Pedone, G.; Bottiglieri, O. Slope instability processes in intensely fissured clays: Case histories in the Southern Apennines. Landslides 2015, 12, 877–893. [Google Scholar] [CrossRef]
  64. Skempton, A.W. First-time slides in over-consolidated clays. Géotechnique 1970, 20, 320–324. [Google Scholar] [CrossRef]
Figure 1. Shape, size, loading position, and monitoring plane of the model slope (unit: mm). The model slope lies above the horizontal planes x and y. z is the vertical coordinate with a positive upward direction. The inset is the test loading system. The red area is the part that is cut off after the filling of the model soil is completed.
Applsci 12 03224 g001
Figure 2. Position layout of EPCs and displacement gauge in monitoring plane (unit: mm). Each EPC is characterized by two digits, and the first digit represents the layer on which the corresponding EPC rests.
Applsci 12 03224 g002
Figure 3. Particle size distribution of the used clay in the model test. The abscissae are in the form of logarithms, and the ordinates are mass percentages. After being air-dried and grounded, the clay was sieved through 5, 2, 0.5, 0.25, and 0.075 mm sieves in sequence. When the particle size was less than 0.075 mm, a pipette method was adopted.
Applsci 12 03224 g003
Figure 4. Typical development stages of landslide under laboratory conditions: (a) compressive deformation stage (0–40 kN), (b) crack generation (100 kN), (c) crack development stage (100–140 kN), and (d) slope failure stage (140–150 kN).
Applsci 12 03224 g004
Figure 5. Relationships between horizontal stresses and loads for (a) the first layer, (b) the second layer, (c) the third layer, and (d) along the slip surface.
Applsci 12 03224 g005
Figure 6. Horizontal stress difference curves of lateral adjacent monitoring points. Using i and j to represent the measuring point, the difference curve i-j represents the horizontal stress at point j minus the horizontal stress at point i under the same load step.
Applsci 12 03224 g006
Figure 7. Plastic zones in the model soil slope for (a) 100, (b) 120, (c) 140, and (d) 150 kN. The plus signs “+” indicate the stress monitoring points in the model test.
Applsci 12 03224 g007
Table 1. Physical and mechanical parameters of the model test materials.
NameUnit WeightEffective CohesionEffective Friction AngleYoung’s ModulusPoisson’s Ratio
(kN/m3)(kPa)(°)(MPa)
Slip Mass19.8816.0021.001.00 × 1090.30
Slide Bed30.005.00 × 10335.001.00 × 1090.30
Sliding SurfaceCohesionFriction AngleNormal StiffnessTangential StiffnessDilation Angle
(kPa)(°)(MPa)(MPa)(°)
0.8018.002.0020.0018.00
Table 2. Relationship between the slope of stress curve at each measuring point and the distance to the loading center.
Monitoring
Point
Distance from
Loading Center/m
Slope of Stress Curve (Mean Value)Vertical Stress Slope (0–140 kN)
0–100 kN100–140 kN140–150 kN
110.50.0330.190−0.2230.222
120.10.1470.198−0.1710.494
130.50.0990.113−0.0600.264
141.10.0110.007−0.0310.004
210.20.0790.177−0.1700.422
220.20.0820.206−0.2300.400
230.80.0950.115−0.1300.070
241.40.0090.012−0.0100.009
310.20.1080.288−0.2410.302
320.50.0910.223−0.2420.179
331.10.0820.116−0.1300.051
341.50.0400.039−0.0150.037
410.80.0980.160−0.2300.117
511.60.0750.098−0.1100.058
Publisher’s Note: MDPI stays neutral with regard to jurisdictional claims in published maps and institutional affiliations.

