Article

Steel Cruciform Sample with Nitrided Arms Achieves Higher Plastic Strain in the Gauge Region

by
Grzegorz Mitukiewicz
Department of Vehicles and Fundamentals of Machine Design, Faculty of Mechanical Engineering, Lodz University of Technology, 90-537 Lodz, Poland
Appl. Sci. 2022, 12(6), 3124; https://doi.org/10.3390/app12063124
Submission received: 28 January 2022 / Revised: 3 March 2022 / Accepted: 15 March 2022 / Published: 18 March 2022
(This article belongs to the Special Issue Advances in Plastic Deformation Analysis and Process Design)

Abstract

:
This paper describes a novel solution to increase plastic strain in the gauge region of a cruciform sample during a forming limit test. A nitriding procedure was used to increase the strength of the arms of the specimen and at the same time enabled higher plastic deformation in the centre of the sample. DC 5 steel sheets were cut in bone-shape samples and subjected to the nitriding procedure. Uniaxial tensile tests were done to obtain the properties of both the raw and thermo-chemically treated material. Two shapes of the gauge region, partially protected against diffusion of nitrogen, were modelled with the use of Abaqus software and a numerical analysis of biaxial tensile tests were conducted. Based on the obtained numerical analysis results DC 5 steel cruciform samples were nitrided while keeping the same gauge region geometries and subsequently subjected to a biaxial tensile test. The obtained results prove the positive influence of the nitriding procedure on increasing the strength of the cruciform sample arms and at the same time the plastic strain in the centre of the sample. The test bench analysis showed almost six times higher plastic deformation, as compared to the raw specimen, however special attention should be paid to the nitriding process parameters and the shape of the protected gauge region.

1. Introduction

Currently, the static tensile test is the primary method for determining the properties of materials. Many years of research has led to the standardization of this method (ISO 6892-1). However, in the case of sheet material properties it does not provide sufficient results for the analysis of the biaxial stress state, which is the most common stress state for elements that are produced by the process of stamping. This is not only due to the fact that sheet metal parts have different properties depending on the sheet rolling direction, but it appears that the formability of the sheet depends on the strain path which they are subjected to.
Products of the sheet metal forming process can be found in many branches of the industry. Parts manufacturing by extrusion is one of the cheapest methods for mass production. In order to reduce the costs of production manufacturers aim to reach the limit of material durability. Expensive test rigs have been replaced by cheaper numerical simulations, however, the optimization of the element design and the process of its forming, using numerical simulation, requires knowledge of the material behavior when subjected to a specific load.
There are a few tests to determine the Forming Limit Curve (FLC) of a material. The two most popular methods use a piston to deform the sample in a direction perpendicular to its plane [1,2]. In Nakazima’s method, the deformation takes the shape of a spherical dome due to the curvature of the piston. The solution proposed by Marciniak-Kuczynski [3] preserves the flatness of the sample in the measuring area. The main disadvantages of these methods are the multitude of sample shapes to be tested and friction between the piston and the sample, which influences the results and makes the numerical simulations more complicated due to the strong nonlinearity of the analysis.
A new idea of introducing plane stress state to the material was proposed by Deng [4]. His solution was based on a cruciform specimen, stretched by its arms in two perpendicular directions (Figure 1).
However, it turned out that the proposed cruciform specimen subjected to biaxial stretching was not suitable for a material formability test, since the achievable plastic strains in the gauge area reached only a single percent and were far from the necking and fracture strains. Hannon and Tiernan [5] stated, that there was no standard sample geometry specified for biaxial stretching of the sheet, and its shape is currently the subject of research [6,7,8,9,10,11].
Although, research in this area has been conducted for many years, it was only recently (2014) when Kuwabara designed a sample shape which was adopted as a standard for carrying out biaxial tensile tests in accordance with the ISO16842 standard [12]. Unfortunately, in this version it is still not possible to study the full characteristics including plastic deformation to failure, commonly known as the Forming Limit Diagram (FLD), as the achieved plastic deformations are too low [13]. Therefore, researchers all over the world are carrying out experiments on the new cross shaped samples trying to achieve the highest and most uniform values of deformation in the centre of the sample, while eliminating the phenomenon of stress concentration in the remaining parts and preventing damage in the region of the arms [14]. The main approaches in the literature include:
  • Applying rounds or undercuts in the middle of the sample (Figure 2a,b) [15];
  • Use of different types of cuts and slits in the arms (Figure 2c) [16];
  • Reduction of the thickness of the central part (Figure 2d) [17]; and
  • Strengthening the sample arms by their plastic processing (Figure 2e) [18].
The idea of this work was to increase the strength of the sample arms, which normally are the weakest part of the specimen. Recent achievements in the field of mechanical and materials engineering have developed various types of protective layers and coatings aimed at improving the surface properties of materials, including hardness, wear and corrosion resistance.
Recently an interesting solution was proposed by Hou et al. [19]. The authors used a normalised cruciform sample with arms that were subjected to a laser hardening process. It was able to reach up to 11% in plastic strain equivalents with no need for thinning the gauge section. Such good results have prompted consideration of a variety of material treatment processes that can influence mechanical characteristics that may obtain similar or better results.
Selvabharathi and Muralikannan [20] in their study described the influence of a plasma-ion nitriding process on tensile strength of shot-peened 2205-duplex stainless steel. The nitriding process was conducted at 480 °C for 9 h. The nitrided samples were subjected to a uniaxial tensile test which showed increased tensile strength of the samples by more than 25%.
Lesage et al. [21] also studied the influence of the nitriding process on material plasticity, with special emphasis on hydrogen contamination. The results showed that nitrided API X65 steel had mechanical resistance about twice as high as received steel. However the authors observed an increased brittleness to the material and much lower plastic deformation before fracture.
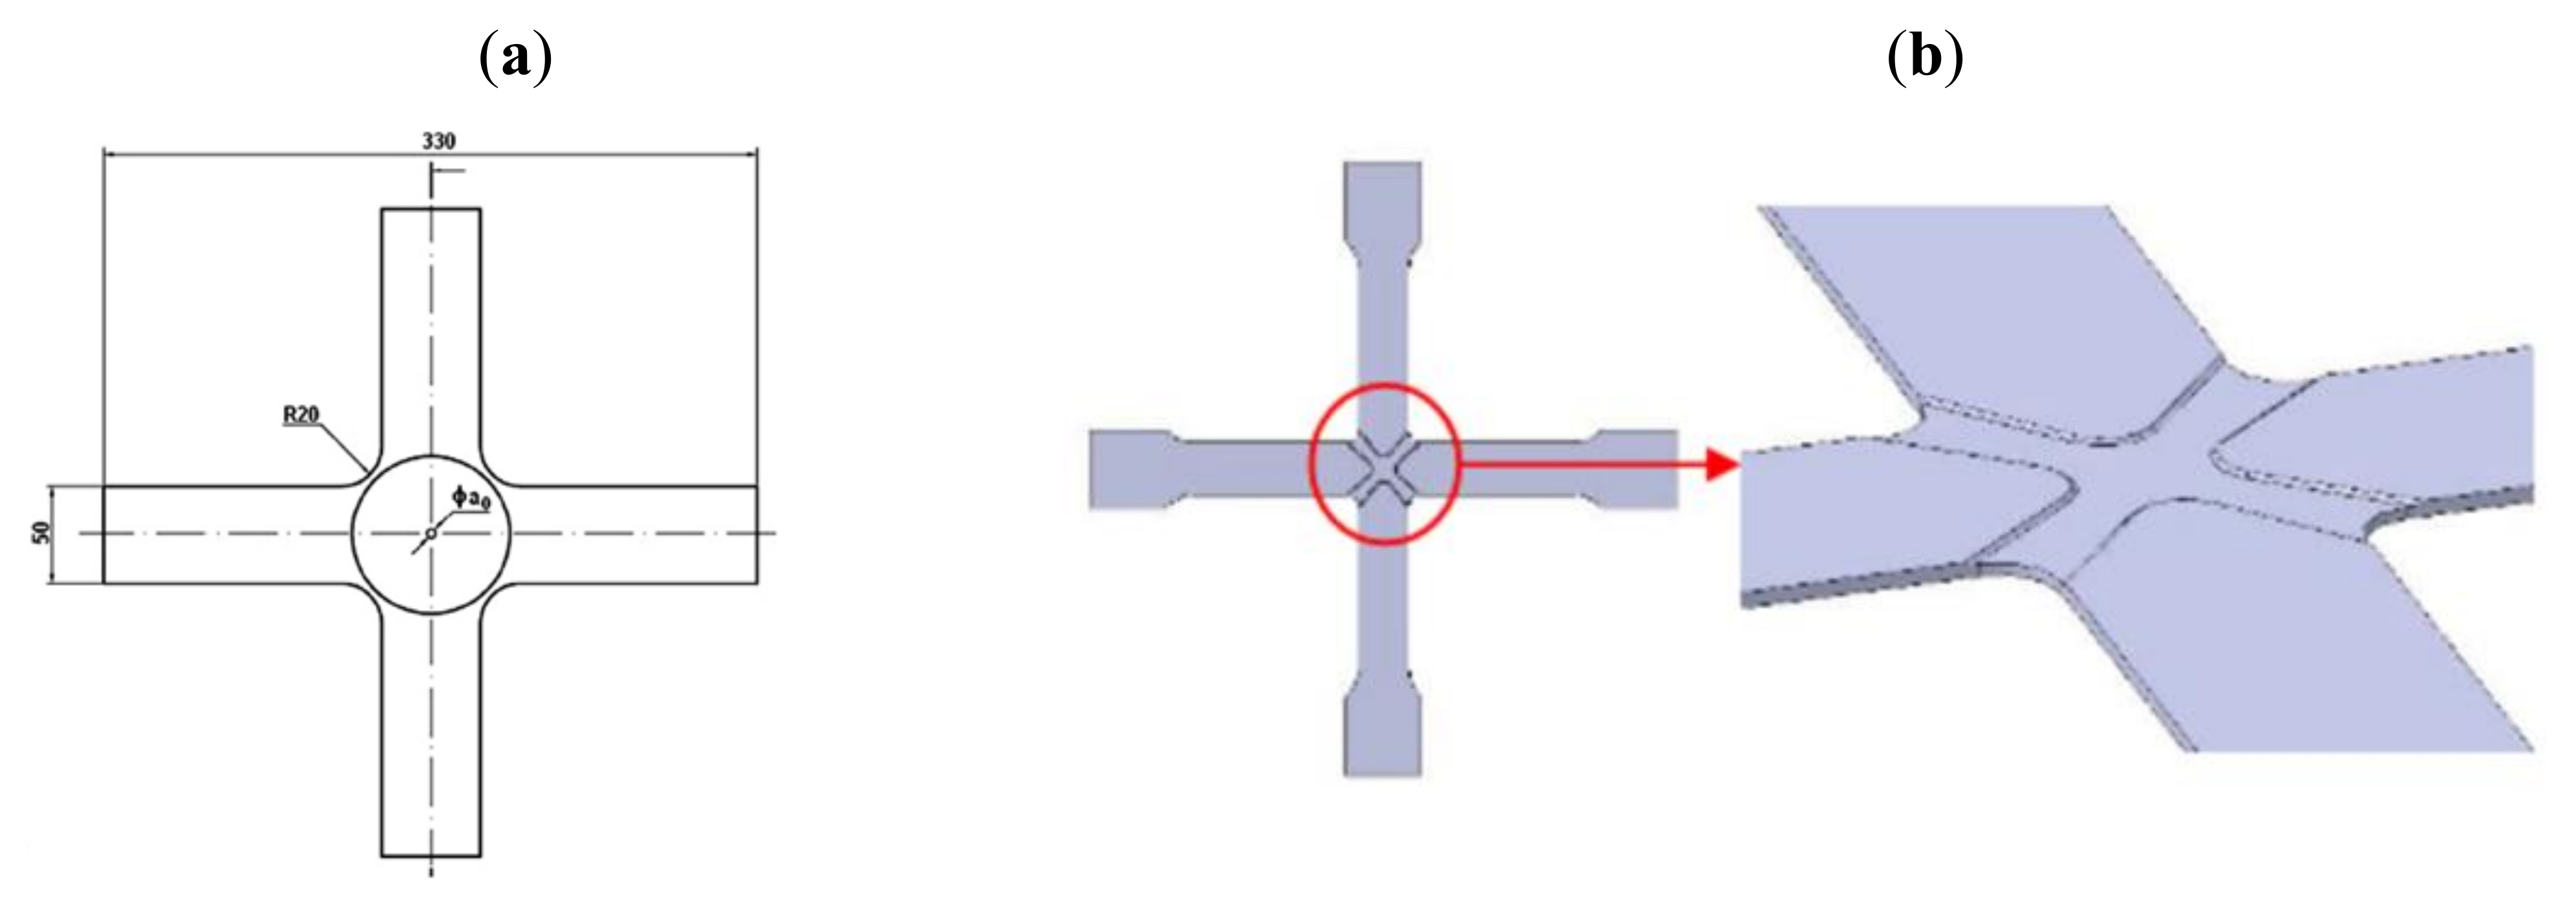
The positive influence of plasma-ion nitriding processes on the achieved mechanical properties of materials encouraged the author to implement a local thermo-chemical treatment of cruciform samples (sample arms) to obtain high plastic deformation in the central part of the specimen. In this work the results of the optimization of the shape of the locally nitrided area of the sample, in terms of achieving high plastic deformation in the gauge region, are presented. The analysis included numerical modelling and verification tests. Two different nitrided sample areas were investigated. The first one was based on the work of Rozumek et al. [17], with a reduced section of the central part of the specimen; and the second one was based on the work of Karadogan and Tamer [8], who designed a sample without slits on the arms and the thickness of the gauge region was reduced by milling, however here, since the arms of the sample were to be hardened by the nitriding procedure, changing the gauge region thickness was ignored.

2. Materials and Methods

In this case study, 0.5 mm thick DC-5 low carbon steel sheets were used to conduct the research. The general mechanical properties of this material are common, with a Young’s modulus of 210 GPa and a Poisson’s ratio of 0.3. Dog-bone shaped specimens were subjected to the nitriding procedure in an atmosphere of dissociated ammonia at a temperature of 520 °C and duration of 180 min. The plastic behaviour of the material was specified based on the engineering stress–strain curve obtained from a uniaxial tensile test. The microstructure of the samples before and after nitriding were analyzed using light microscopy.

2.1. Cruciform Sample

The cruciform specimen shape used in the tests is presented in Figure 3. The samples were cut using waterjet.
The non-treated area of the samples was designed based on the work of Rozumek et al. [17] and Karadogan and Tamer [8], and is presented in Figure 4, however, as stated earlier, instead of weakening its gauge region by milling, it was assumed that the material of the arms would be reinforced by the nitriding process.
The final shapes of the non-treated areas of the samples are presented in the Figure 5a,b.
Sheet metal samples were cut into cruciform geometry using a waterjet. Samples were subjected to the nitriding procedure under the same process conditions (520 °C, 180 min) as the dog-bone shaped specimens used for the tensile tests described above. In order to protect the measuring area against nitriding the surface was covered with diffusion blocking paste, on both sides. Figure 6a,b presents the final shapes of the samples that were nitrided: the area of the specimen that was nitrided is marked with the red colour, whereas the blue colour represents the raw material.

2.2. Simulation

The shapes of the cruciform samples developed and described above were modeled in the Abaqus software (V2016 R9). The material data was introduced to the software on the basis of previously conducted uniaxial tensile tests results, of both the raw material and the one after the nitriding process. The modeled samples were divided into areas to which material properties were assigned (nitrided or non-treated, respectively). The 8-node linear brick C3D8R element was chosen for the calculations. Additionally, a sample of the same shape but without thermo-chemical treatment was added for comparison (denoted as Specimen_0). The mesh control was set up to a hexahedron shape with a sweep technique and medial axis algorithm (Figure 7).
Equal stretching speed (1 mm/s) of the sample arms in two mutually perpendicular directions (biaxial tensile test) was assumed as the boundary condition. The samples were stretched until the displacement of each grip reached 10 mm. At each step of the calculation the evolution of Von Misses stress was analyzed. When the stress in the sample arms reached the UTS (ultimate tensile strength) the simulation was stopped and the plastic strain in the gauge region was taken as the maximum. For Specimen_1 it was a frame frozen for 7.5mm of grip displacement and for Sample_0 and Sample_2 the final frame was frozen for 9.5 mm.

2.3. Experiment

The biaxial tensile tests of the cruciform samples were conducted using the test bench presented in Figure 8a. The equipment of the test bench allows loading samples in two perpendicular stretching directions. The displacement of the grips is realized by four independent hydraulic actuators controlled by the CPU.
The executive system consists of four flow adjustable valves (Figure 8b), controlled by PWM electrovalves (Figure 8c), enabling control of the oil flow. This allows adjustment of each actuator separately. The system makes it possible to determine the linear speed of the grips independent of the necessary force. The tests were done with the speed set to 1 mm/s for each arm. In order to determine the plastic deformation of the sample, a grid made by a photolithographic method was applied on the gauge region. A more detailed description of the process has been reported elsewhere [14]. Before and after the test pictures were taken with a camera standing on a tripod over the specimen. Based on the pictures the number of pixels were calculated between the 10 grids (“L” on Figure 9). The size of the grid was 2 mm × 2 mm (Figure 8), which corresponded to 120 × 120 pixels. The strains were calculated by dividing the number of pixels from the picture at the end of the test by the number of pixels from the picture at the beginning of the test (10 × 120 = 1200 pixels).
The position of the measurement points was determined with an accuracy of ±1 pixel.

3. Results and Discussion

The results of the uniaxial tensile tests of the bone-shaped samples before and after the nitriding procedure are presented in Figure 10. It can be seen that the yield point of the material after the nitriding process is higher than the UTS of the raw material. Therefore, this solution produced a method of increasing material yield stresses through its plastic deformation described in the author’s earlier work [14,18].
The true stress–strain data until the UTS point was calculated based on the following equations:
  • True stress
    σ T = σ 1 + ε
  • True strain
    ε T = ln 1 + ε
    where σ is engineering stress [MPa], ε is engineering strain. The results for both types of samples, used in the FEM analysis, are presented in Figure 11. The UTS increases from 340 MPa to 432 MPa in the true stress–strain curve.
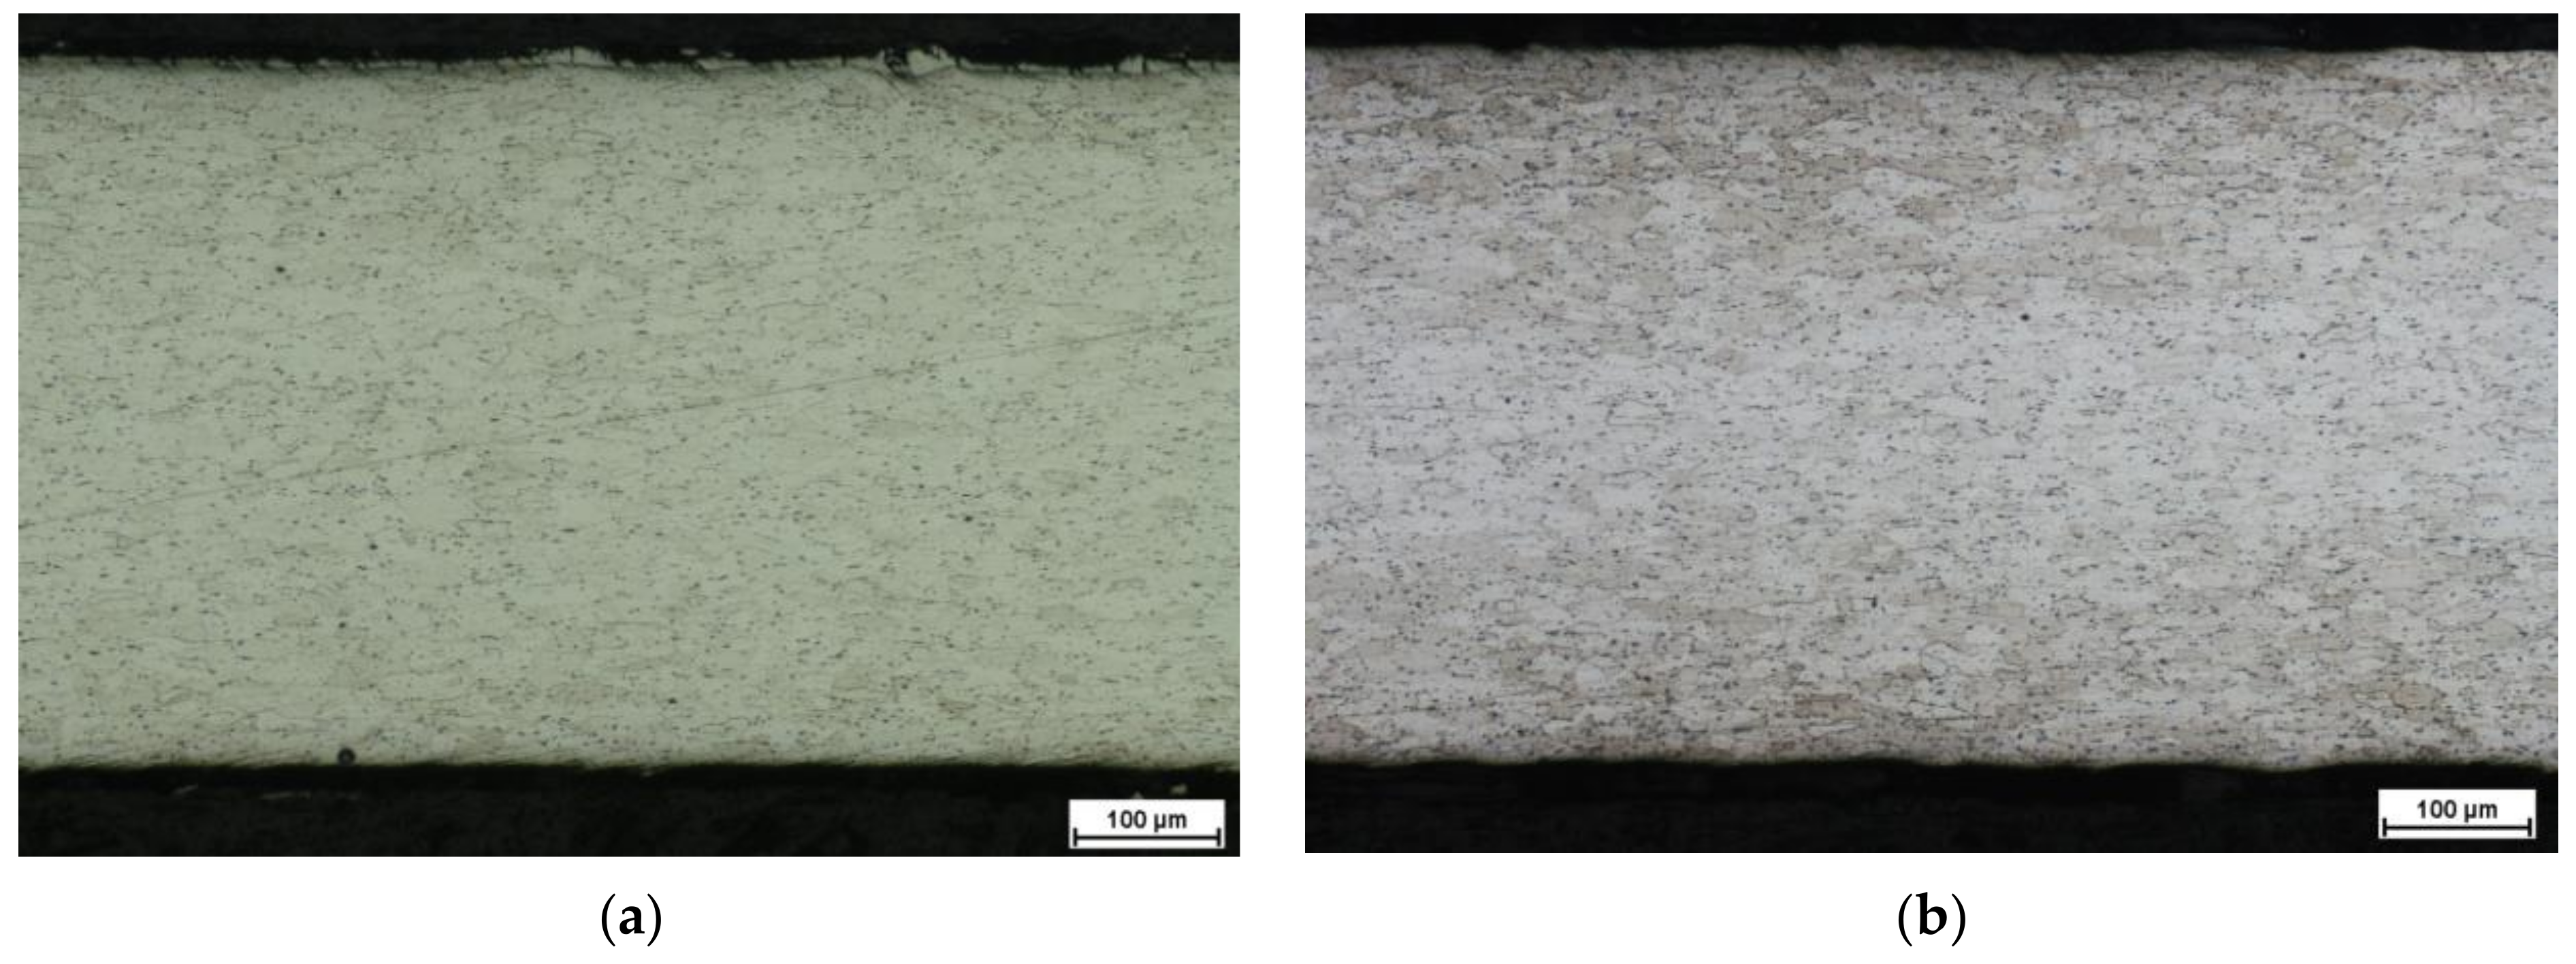
The comparison of the microstructure of the modified samples is presented in Figure 12. The DC-5 steel has a ferritic microstructure with visible texture related to the rolling technology. After the nitriding process a diffusion zone with an addition of nitride precipitates and a solid solution of nitrogen is visible on both sides of the sample. The thickness of the diffusion zone on each side of the sample reaches ca. 200 µm and a noticeable strip of the unmodified core material in the middle of the cross section can be distinguished.
The results of the simulation for Sample_0 (raw material) are presented in Figure 13. The stress concentration is localized in the arms and the stress level in the center of the sample barely reaches the yield point. Similar strain was generated in both perpendicular directions, which proves that the model has been properly prepared (Figure 14).
The analyzed area of the sample underwent plastic deformation only in the final stage of the biaxial stretching process and the registered strain level is very low (Figure 15).
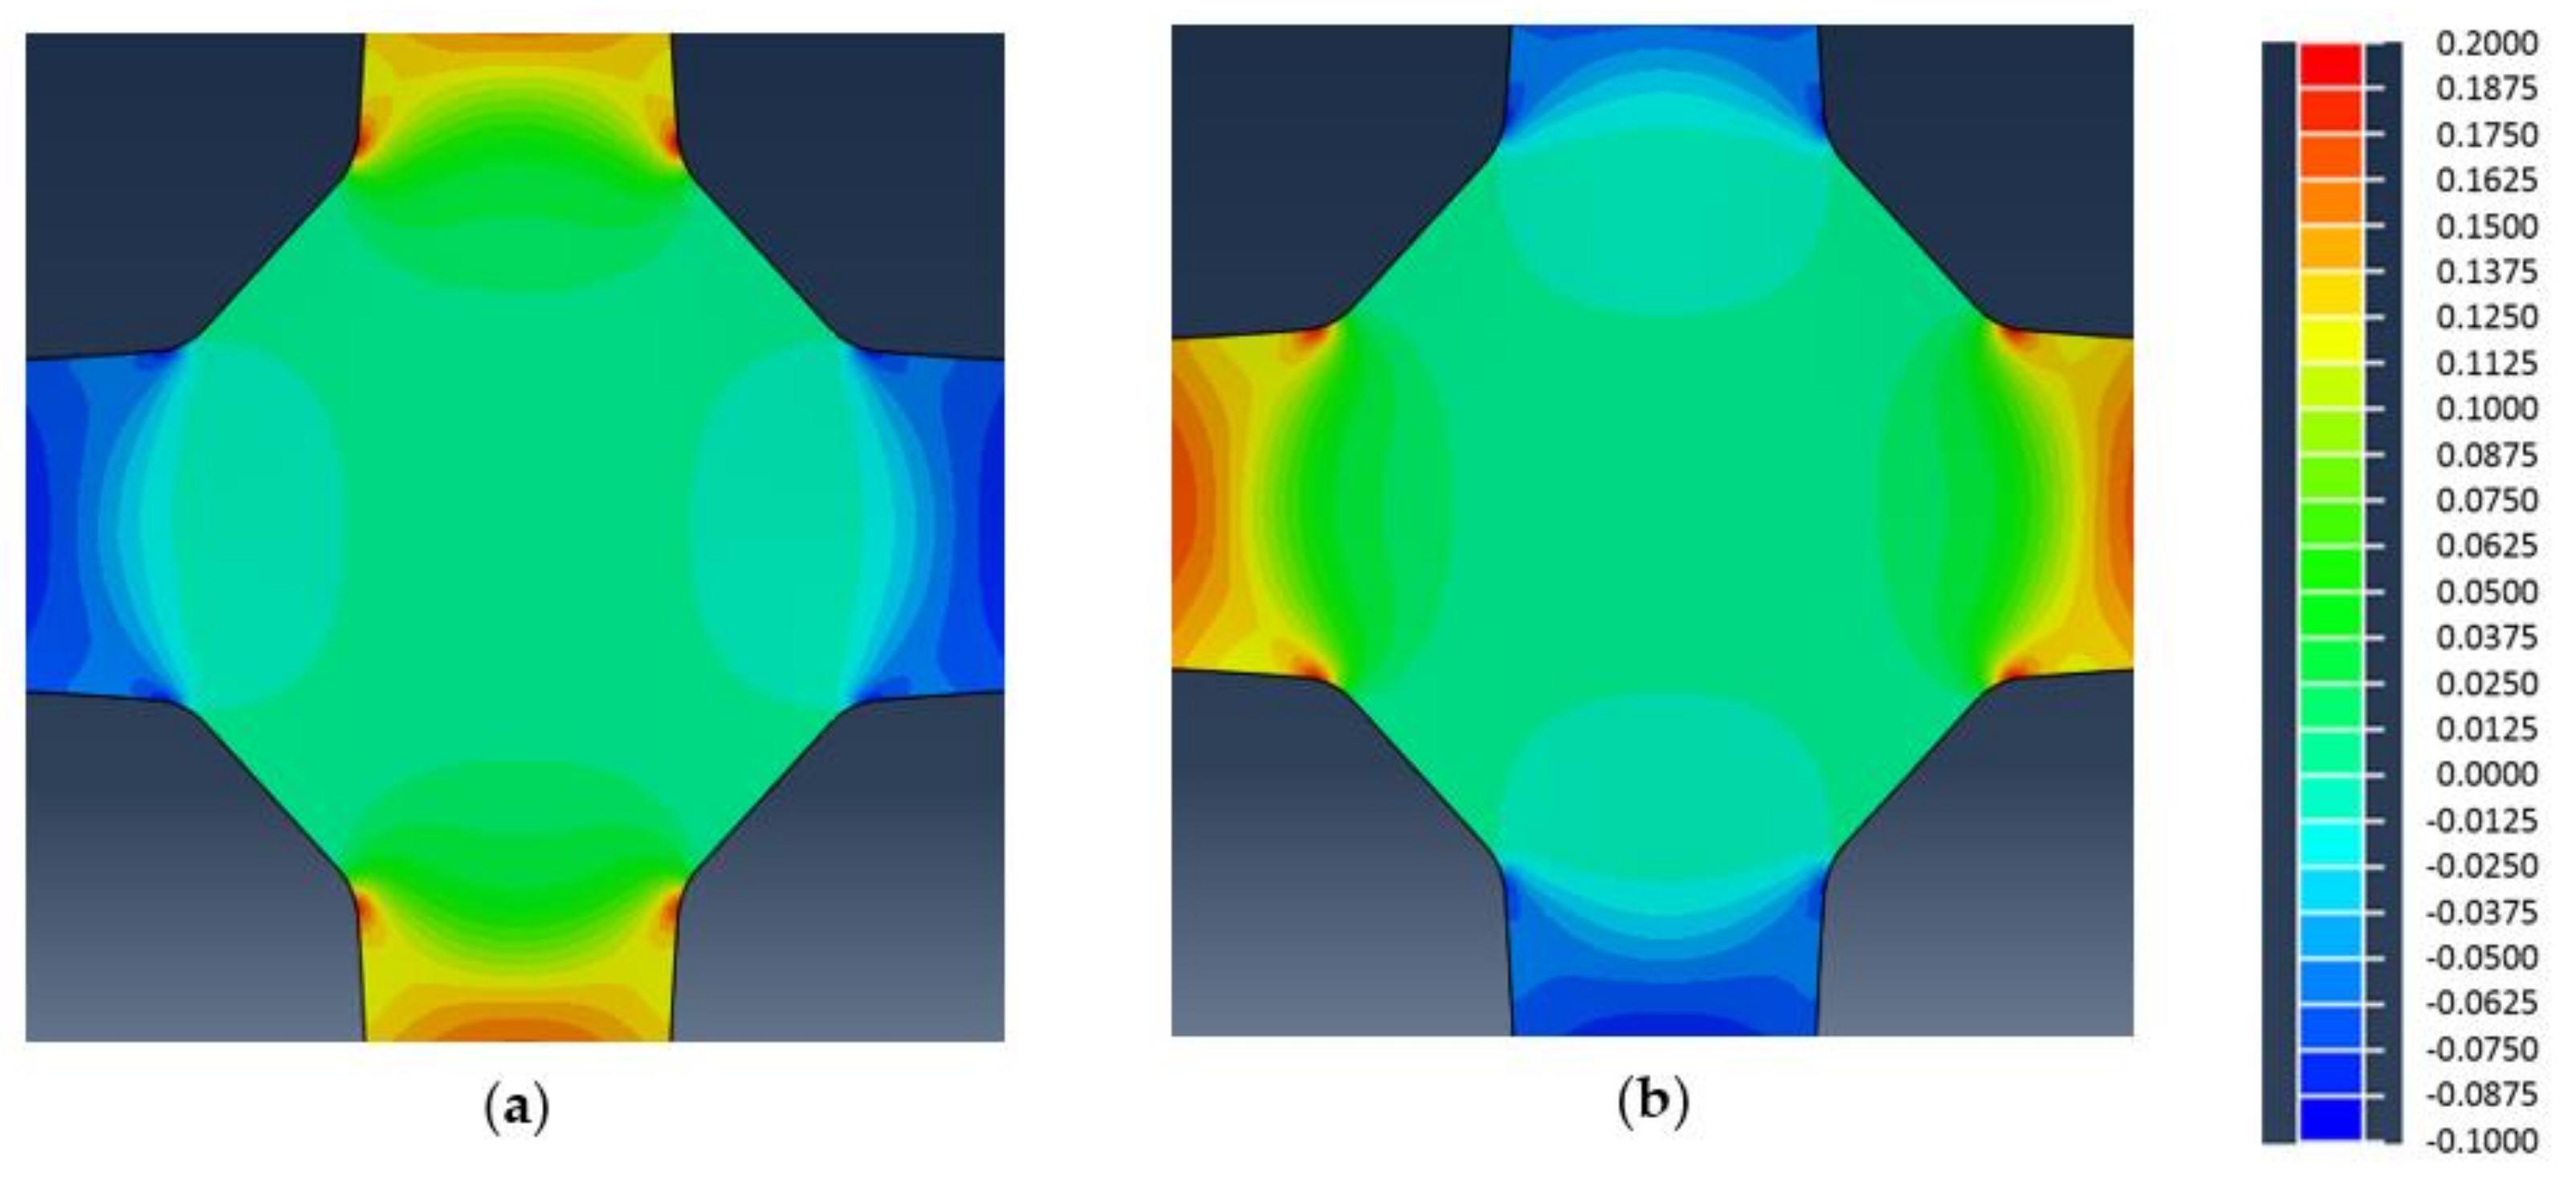
The results for Specimen_1 and Specimen_2 are presented in Figure 16. It can be noticed that in both cases the same values of strain were obtained in both perpendicular directions. This proves that in the measurement area (the middle part of the sample) the strain state is equi-biaxial, as expected. The achieved stresses in the center of the sample are higher for Specimen_2 compared to Specimen_1, and amount to 450 MPa and 280 MPa, respectively. This is due to the fact that the nitrided area in the case of Specimen_1 surrounds the gauge region like a loop and transfers the load between the arms without allowing the raw material to deform inside. An opposite situation is visible in the case of Specimen_2. The raw material in the gauge region is directly exposed to the load transferred through the arm, which results in a much higher level of stress and deformation as well.
The evolution of ε11 and ε22 strains versus time (central point of the gauge region), taken from the simulation, are given in Figure 17. The plastic strain obtained in the case of Specimen_1 exceeded 1%. The shape of the non-nitrided area in Specimen_2 causes the stress to be transferred to the centre of the sample and the plastic strains obtained in the gauge region increase almost linearly with the grip displacement. Finally the maximum plastic strain reached a value almost five times higher (5.8%) compared to Sample_1.
Both models were subsequently validated by means of the biaxial tensile test. Samples of the same geometry, subjected to the nitriding procedure, were tested under biaxial stretching conditions. Figure 18 shows the cruciform samples, with distinguishable areas protected against nitriding, after the biaxial tensile test. It can be noticed that the weakest parts of both samples were still their arms which started necking with progressing stress and strain (Figure 18a), or finally fractured (Figure 18b). In the case of the latter the fracture occurred along the Lüders–Hartmann lines, characteristic of low carbon steels experiencing tensile stress [22]. The results of the strain calculation based on the photo material are presented in Table 1.
The results of the experiment demonstrated that the plastic strain in the gauge region increased 6 and 24 times, for Specimen_1 and Specimen_2, respectively, compared to the sample without thermo-chemical treatment.
The first comparison of the obtained results concerned the stress concentration areas, where the sample started necking and finally fractured (Figure 19a,b). In the case of the sample in which the non-nitrided gauge area had the shape of a circle (Specimen_1), the stress concentration observed in the simulation tests was exactly in the place where the real sample started necking, namely, on the length of one of the arms, which was expected (marked with the arrows in Figure 19a). In the second case where the non-nitrided measurement area had the shape of a cross (Specimen_2), the highest stress concentration was also visible on the length of the arm, however the sample broke at the transition from the central part to the arm.
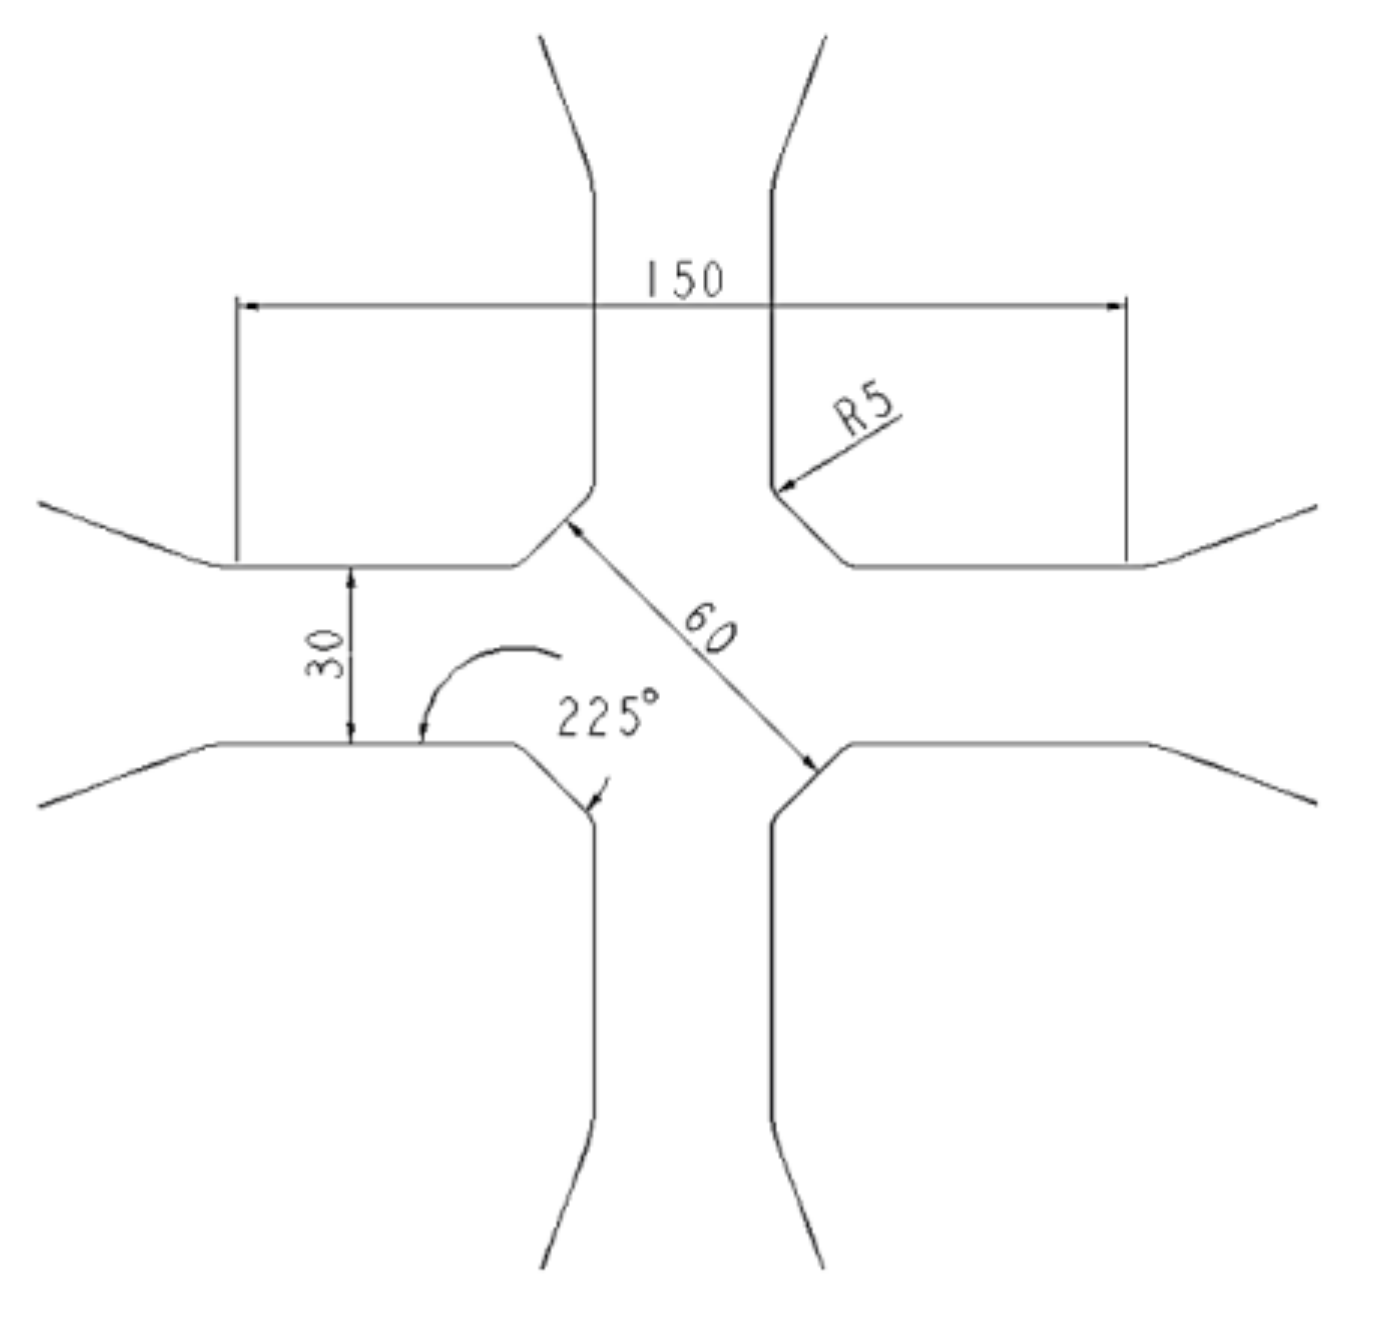
The FEM simulation results for Specimen_2 show a noticeable stress concentration gradient at the interface of the two different material areas, directly on the edge at the rounding point. It can be assumed that the fracture was initiated directly at this point and propagated further along the Lüders–Hartmann lines. This probable place of crack initiation was considered at the stage of sample selection and optimization, however, the stress concentration gradient did not appear to be a probable cause of specimen fracture. Moreover, the rounding radius on the edge, where the additional stress accumulation may be expected (see Figure 3), was also optimized. On the other hand, in the inset of Figure 19b, barely visible signs of necking of the upper arm can be distinguished. It is also possible that the fracture was initiated on the left side in the place of necking and propagated through the central part of the sample. Unfortunately, the cracking process was sudden since the nitriding procedure usually contributes to increased brittleness of the material, which makes it difficult to determine the actual cause and direction of the cracking process. Nevertheless, the comparison of stress concentration between the numerical analysis and test bench results shows good agreement and proves the positive influence of the local nitriding process on increasing the strain in the central part of the cruciform sample.
The final comparison between the results obtained from the simulation and experiment in terms of achievable strain in the gauge region is presented in Figure 20. In the case of Specimen_1 the results of the simulation and the test bench analysis show good agreement, however in this configuration the local thermo-chemical treatment did not bring a noticeable improvement. An opposite situation is demonstrated in Specimen_2, here the achieved strain in the central part of the sample was noticeably higher, however, the difference between the simulation and experimental results was approximately 30%.
The difference between the results is due to the simplification of the model of the material after the nitriding procedure. As commonly known, the thermo-chemical treatment technologies are based on diffusion and the properties of the obtained coatings have a gradient character resulting from the variable concentration of the diffusing component on the cross-section of the layer [21,23]. In the prepared model, the mechanical properties of the material before and after the nitriding process were defined based on the static tensile test. As shown in Figure 12, the thickness of the nitrided layer was approximately 200 µm and the mechanical properties change over this distance on both sides of the sample. Moreover, the protection against diffusion of nitrogen does not guarantee a straight interface between non-nitrided and nitrided parts of the sample. Both aspects might influence the results and in future tests should be analyzed in depth. Finally, as the presented results indicate, the local nitriding procedure positively influences the achievable plastic strain in the gauge region of a cruciform sample in a biaxial tensile test. Undoubtedly, the nitriding process is a good solution for improving the strength of the arms of cruciform samples made of other materials, particularly those containing elements prone to formation of nitrides.

4. Conclusions

This paper investigates numerically and experimentally the effects of nitriding of cruciform sample arms on the achieved plastic deformation in the gauge region. Based on the experiment and FE models the following conclusions can be drawn:
  • Nitriding processes have been successfully applied to increase the mechanical properties of the DC5 steel sheet. The yield point of the material after the nitriding process is higher than the UTS of the raw material. However, the material after nitriding becomes more brittle and reaches 20% of strain versus 40% under a uniaxial tensile test;
  • The results of the experiment confirm the results obtained from the simulation, which proves that the FE model was properly defined;
  • The use of the nitriding process in the area of the arms of the cruciform sample made it possible to obtain almost a 24-times increase in plastic strains in its central part.

Funding

This research received no external funding.

Institutional Review Board Statement

Not applicable.

Informed Consent Statement

Not applicable.

Data Availability Statement

Not applicable.

Acknowledgments

The author wishes to thank Damian Batory (Lodz University of Technology) for inspiration and general support. The author would also like to acknowledge the support of Radomir Atraszkiewicz, for conducting the nitriding processes, Sebastian Lipa, Jacek Leyko and Janusz Ormezowski, who made the biaxial tensile tests possible.

Conflicts of Interest

The author declare no conflict of interest.

References

  1. Nakazima, K.; Kikuma, T.; Hasuka, K. Study on the formability of steel sheets. Yawata Technol. Rep. 1968, 264, 8517–8530. [Google Scholar]
  2. Hsu, E.; Carsley, J.E.; Verma, R. Development of Forming Limit Diagrams of Aluminum and Magnesium Sheet Alloys at Elevated Temperatures. J. Mater. Eng. Perform. 2008, 17, 288–296. [Google Scholar] [CrossRef]
  3. Marciniak, Z.; Kuczyński, K. Limit strains in the processes of stretch-forming sheet metal. Int. J. Mech. Sci. 1967, 9, 609–612. [Google Scholar] [CrossRef]
  4. Deng, N.; Kuwabara, T.; Korkolis, Y.P. Cruciform Specimen Design and Verification for Constitutive Identification of Anisotropic Sheets. Exp. Mech. 2015, 55, 1005–1022. [Google Scholar] [CrossRef]
  5. Hannon, A.; Tiernan, P. A review of planar biaxial tensile test systems for sheet metal. J. Mater. Process. Technol. 2008, 198, 1–13. [Google Scholar] [CrossRef]
  6. Yu, Y.; Wan, M.; Wu, X.D.; Zhou, X.B. Design of cruciform biaxial tensile specimen for limit strain analysis by FEM. J. Mater. Process. Technol. 2002, 123, 67–70. [Google Scholar] [CrossRef]
  7. Boehler, J.P.; Demmerle, S.; Koss, S. A new direct biaxial testing machine for anisotropic materials. Exp. Mech. 1994, 34, 1–9. [Google Scholar] [CrossRef]
  8. Karadogan, C.; Tamer, E.M. A novel and simple cruciform specimen without slits on legs yet higher plastic strains in gauge. Procedia Eng. 2017, 207, 1922–1927. [Google Scholar] [CrossRef]
  9. Smits, D.; Van Hemelrijck, T.P.; Philippidis, A. Cardon. Design of cruciform specimen for biaxial testing of fibre reinforced composite laminates. Compos. Sci. Technol. 2006, 66, 964–975. [Google Scholar] [CrossRef]
  10. Demmerle, S.; Boehler, J. Optimal design of biaxial tensile cruciform specimens. J. Mech. Phys. Solids 1993, 41, 143–181. [Google Scholar] [CrossRef]
  11. Ohtake, Y.; Rokugawa, S.; Masumoto, I.H. Geometry Determination of Cruciform-Type Specimen and Biaxial Tensile Test of C/C Composites. Key Eng. Mater. 1999, 164–165, 151–154. [Google Scholar] [CrossRef]
  12. ISO 16842:2014; Metallic Materials—Sheet and Strip—Biaxial Tensile Testing Method Using a Cruciform Test Piece. ISO: Geneva, Switzerland, 2014.
  13. Nasdala, L.; Husni, A.H. Determination of Yield Surfaces in Accordance with ISO 16842 Using an Optimized Cruciform Test Specimen. Exp. Mech. 2020, 60, 815–832. [Google Scholar] [CrossRef]
  14. Mitukiewicz, G.; Głogowski, M.; Stelmach, J.; Leyko, J.; Dimitrova, Z.; Batory, D. Strengthening of cruciform sample arms for large strains during biaxial stretching. Mater. Today Commun. 2019, 21, 100692. [Google Scholar] [CrossRef]
  15. Muller, W.; Pohland, K. New experiments for determining yield loci of sheet metal. J. Mater. Process. Technol. 1996, 60, 643–648. [Google Scholar] [CrossRef]
  16. Makinde, A.; Thibodeau, L.; Neale, K.W. Development of a apparatus for biaxial testing for cruciform specimens. Exp. Mech. 1992, 32, 138–144. [Google Scholar] [CrossRef]
  17. Rozumek, D.; Lachowicz, C.T.; Macha, E. Analytical and numerical evaluation of stress intensity factor along crack paths in the cruciform specimens under out-of-phase cyclic loading. Eng. Fract. Mech. 2010, 77, 1808–1821. [Google Scholar] [CrossRef]
  18. Mitukiewicz, G.; Głogowski, M. Cruciform specimen to obtain higher plastic deformation in a gauge region. J. Mater. Process. Technol. 2016, 227, 11–15. [Google Scholar] [CrossRef]
  19. Hou, Y.; Min, J.; Guo, N.; Lin, J.; Carsley, J.E.; Stoughton, T.B.; Traphöner, H.; Clausmeyer, T.; Tekkaya, A.E. Investigation of evolving yield surfaces of dual-phase steels. J. Mater. Process. Technol. 2021, 287, 116314. [Google Scholar] [CrossRef]
  20. Selvabharathi, R.; Muralikannan, R. Influence of shot peening and plasma ion nitriding on tensile strength of 2205 duplex stainless steel using A-PAW. Mater. Sci. Eng. A 2018, 709, 232–240. [Google Scholar] [CrossRef]
  21. Lesage, J.; Chicot, D.; Bartier, O.; Zampronio, M.A.; de Miranda, P.E.V. Influence of hydrogen contamination on the tensile behavior of a plasma ion nitrided steel. Mater. Sci. Eng. A 2000, 282, 203–212. [Google Scholar] [CrossRef]
  22. Hutanu, R.; Clapham, L.; Rogge, R.B. Intergranular strain and texture in steel Luders bands. Acta Mater. 2005, 53, 3517–3524. [Google Scholar] [CrossRef]
  23. Batory, D.; Szymanski, W.; Panjan, M.; Zabeida, O.; Klemberg-Sapieha, J.E. Plasma nitriding of Ti6A14V alloy for improved water erosion resistance. Wear 2017, 374, 120–127. [Google Scholar] [CrossRef]
Figure 1. Schematic description of theoretical loading of a cruciform sample subjected to biaxial stretching.
Applsci 12 03124 g001
Figure 2. Different solutions for sample shape modification for higher plastic strain in the gauge region: (ac) cut type, (d) reduced section type, (e) with hardened area.
Applsci 12 03124 g002
Figure 3. Cruciform sample geometry used for the simulation and experiment (mm).
Applsci 12 03124 g003
Figure 4. Samples from the literature that were the basis for the specimen geometry: (a) with a circular milling area, (b) with a cruciform milling area.
Applsci 12 03124 g004
Figure 5. Two geometries of the non-treated gauge area: (a) Specimen_1, (b) Specimen_2.
Applsci 12 03124 g005
Figure 6. Drawings of the cruciform samples used for the local nitriding process (red: nitrided area, blue: non-treated area): (a) Specimen_1, (b) Specimen_2.
Applsci 12 03124 g006
Figure 7. View of the samples after the meshing procedure: (a) Specimen_0, (b) Specimen_1, (c) Specimen_2.
Applsci 12 03124 g007
Figure 8. Test bench for biaxial tensile tests: (a) Biaxial tensile test machine, (b) four flow adjustable valves, (c) PWM electro-valves.
Applsci 12 03124 g008
Figure 9. Characteristic dimension “L” for strain calculation in the gauge region of the cruciform sample.
Applsci 12 03124 g009
Figure 10. Results of the uniaxial tensile tests of raw and nitrided steel specimens.
Applsci 12 03124 g010
Figure 11. Material characteristics used for FEM modelling.
Applsci 12 03124 g011
Figure 12. Images of the microstructure of the tested material: (a) raw material, (b) after nitriding.
Applsci 12 03124 g012
Figure 13. Von Misses stress distribution for Specimen_0.
Applsci 12 03124 g013
Figure 14. In-plane strain for Specimen_0: (a) ee11—strain component, (b) ee22—stress component.
Applsci 12 03124 g014
Figure 15. The evolution of the plastic strain components for Specimen_0 versus grip displacement at the central point of the samples: e11 – dashed line, e22 – solid line.
Applsci 12 03124 g015
Figure 16. In-plane stress and strain components for Specimen_1 and Specimen_2 when the stress in the arms reached UTS.
Applsci 12 03124 g016
Figure 17. The evolution of plastic strain components (e11 and e22) for Specimen_1 and Specimen_2 versus grip displacement in the centre of the sample.
Applsci 12 03124 g017
Figure 18. Pictures of samples after the biaxial tensile tests: (a) Specimen_1, (b) Specimen_2.
Applsci 12 03124 g018
Figure 19. Rough comparison of the simulation and experimental results: (a) Specimen_1, (b) Specimen_2.
Applsci 12 03124 g019
Figure 20. Comparison of the final strains reached in the simulation and experiment for Specimen_1 and Specimen_2.
Applsci 12 03124 g020
Table 1. Results from the experiment.
Specimen_0Specimen_1Specimen_2
Number of pixels counted on the reference section before the test120012001200
Number of pixels counted on the reference section after the test120212121248
Strain0.17%1.00%4.00%
Publisher’s Note: MDPI stays neutral with regard to jurisdictional claims in published maps and institutional affiliations.

