Article

Generative Adversarial CT Volume Extrapolation for Robust Small-to-Large Field of View Registration

by
Andrei Puiu
1,2,*,
Sureerat Reaungamornrat
3,
Thomas Pheiffer
3,
Lucian Mihai Itu
1,2,
Constantin Suciu
1,2,
Florin Cristian Ghesu
3 and
Tommaso Mansi
3
1
Advanta, Siemens SRL, 500097 Brasov, Romania
2
Department of Automation and Information Technology, Transilvania University of Brasov, 500174 Brasov, Romania
3
Siemens Healthineers, Digital Technology and Innovation, Princeton, NJ 08540, USA
*
Author to whom correspondence should be addressed.
Appl. Sci. 2022, 12(6), 2944; https://doi.org/10.3390/app12062944
Submission received: 10 January 2022 / Revised: 28 February 2022 / Accepted: 10 March 2022 / Published: 14 March 2022
(This article belongs to the Special Issue Deep Neural Networks in Medical Imaging)

Abstract

:
Intraoperative Computer Tomographs (iCT) provide near real time visualizations which can be registered with high-quality preoperative images to improve the confidence of surgical instrument navigation. However, intraoperative images have a small field of view making the registration process error prone due to the reduced amount of mutual information. We herein propose a method to extrapolate thin acquisitions as a prior step to registration, to increase the field of view of the intraoperative images, and hence also the robustness of the guiding system. The method is based on a deep neural network which is trained adversarially using self-supervision to extrapolate slices from the existing ones. Median landmark detection errors are reduced by approximately 40%, yielding a better initial alignment. Furthermore, the intensity-based registration is improved; the surface distance errors are reduced by an order of magnitude, from 5.66 mm to 0.57 mm (p-value = 4.18 × 10 6 ). The proposed extrapolation method increases the registration robustness, which plays a key role in guiding the surgical intervention confidently.

1. Introduction

Over the past years, the use of medical imaging in computer aided interventions has become more and more popular, supporting clinicians in their workflow and thus reducing the procedural associated risks [1].
This paper is focused on increasing the trustworthiness of liver needle therapies such as Radiofrequency Ablation (RFA) or biopsy, where real time imaging plays a main role in guiding the intervention confidently. Although it is well known that there is a trade-off between radiation dose, acquisition time and image quality, during such surgical interventions all procedures must be carried out as quickly and accurately as possible. A possible solution to this problem is to intraoperatively acquire thin images-that provide low—resolution visualizations of a small liver region—and register them with complete high resolution preoperative images [2].
Registration is a technique used to align two images with respect to the patient’s internal structures. Formally, having a reference and a template image R , T : d , registration objective is to find a transformation φ : d such that R T φ [3]. Therefore, registration techniques are employed to retrieve high resolution preoperative information such as lesion location and appearance and aggregate it with the thin intraoperative images revealing the real-time needle localization, thus increasing navigation confidence. Based on the operands, there are multiple types of registration including slice-to-volume, projection-to-volume, volume-to-volume, etc. [4]. Herein we focus on the latter, aiming to boost the performance of two Computer Tomograph (CT) volumes rigid registration. Two volumes can be registered using a feature-based approach, an intensity-based approach or a combination of the two techniques. In feature-based registration, a set of corresponding features (e.g., landmarks, center of mass, etc.) are used to compute the transformation φ to register a volume (called the moving or template volume, T) to the space of the other volume (fixed or reference volume, R) [5]. The intensity-based approach can be formulated as an optimization problem, seeking the best set of parameters for the transformation φ to minimize a predefined distance measure: a r g m i n φ [ D ( R , T φ ) ] [3,6]. However, this approach is not robust due to the potential presence of local minimums caused by image artifacts and sub-optimal distance metrics. Combinations of the two approaches might be used to improve registration accuracy and robustness (e.g., using intensity-based registration as a refinement step for the feature-based registration).
To the best of our knowledge, registration of thin images has been overlooked so far. Since all the registration techniques are highly dependent on the amount of mutual information (common data presented by both images from different perspectives), analysis of thin images is very challenging due to their reduced field of view (FOV). However, during surgeries low-resolution thin CT slabs are acquired to mitigate the patient’s exposure risk. In this context, despite performing an initial alignment based on center of mass or geometric center, intensity-based registration is prone to failure given to the distinct fields of view of the operands. To reliably retrieve the corresponding high resolution preoperative data, a feature-based approach must be considered. However landmark detection algorithms might also be affected by the thin volume quality thus yielding a poor registration performance.
We therefore propose a method to extrapolate thin CT slabs, generating additional slices from the few existing ones, hence providing enhanced context information required by registration algorithms to work robustly.
Artificial intelligence in medical applications has received significant attention from the scientific community over the past few years. Due to their potential to model complex problems based on large datasets of examples, deep learning algorithms are nowadays employed for solving a wide variety of tasks such as regression, classification, segmentation and image generation [7,8]. Generative adversarial networks (GANs) [9] are a state of the art method for solving tasks such as synthetic image generation [10,11,12], segmentation [13], super-resolution [14], denoising [15,16], style-transfer [17,18] and inpainting [19,20].
Image interpolation, also known as image completion or inpainting [21], aims at filling missing regions within an image with coherent and realistic content based on the surrounding information. Thus, in image interpolation, the field of view is well defined. In contrast, image extrapolation [22,23,24] is a more challenging task since the field of view has to be extended by hallucinating coherent and realistic content outside the boundaries of the existing information.
In this paper, we introduce an extrapolation methodology based on a generator network which increases the field of view of thin intraoperative CT volumes, and improves the accuracy and robustness of a subsequent registration process. To prove the efficiency of the proposed method we focus on the liver area and assume that a thin acquisition would have a thickness of approximately 5 cm. However, this can be easily adjusted for other thicknesses or use-cases.
The paper is organized as follows: Section 2 provides an overview of the proposed methods, including details regarding data, network architecture, optimization and quantification strategies. Section 3 presents the results from a task oriented perspective. Strengths and limitations of this study are discussed in Section 4, including the next steps towards the adoption of our method in real world applications and Section 5 presents some overall conclusions.

2. Materials and Methods
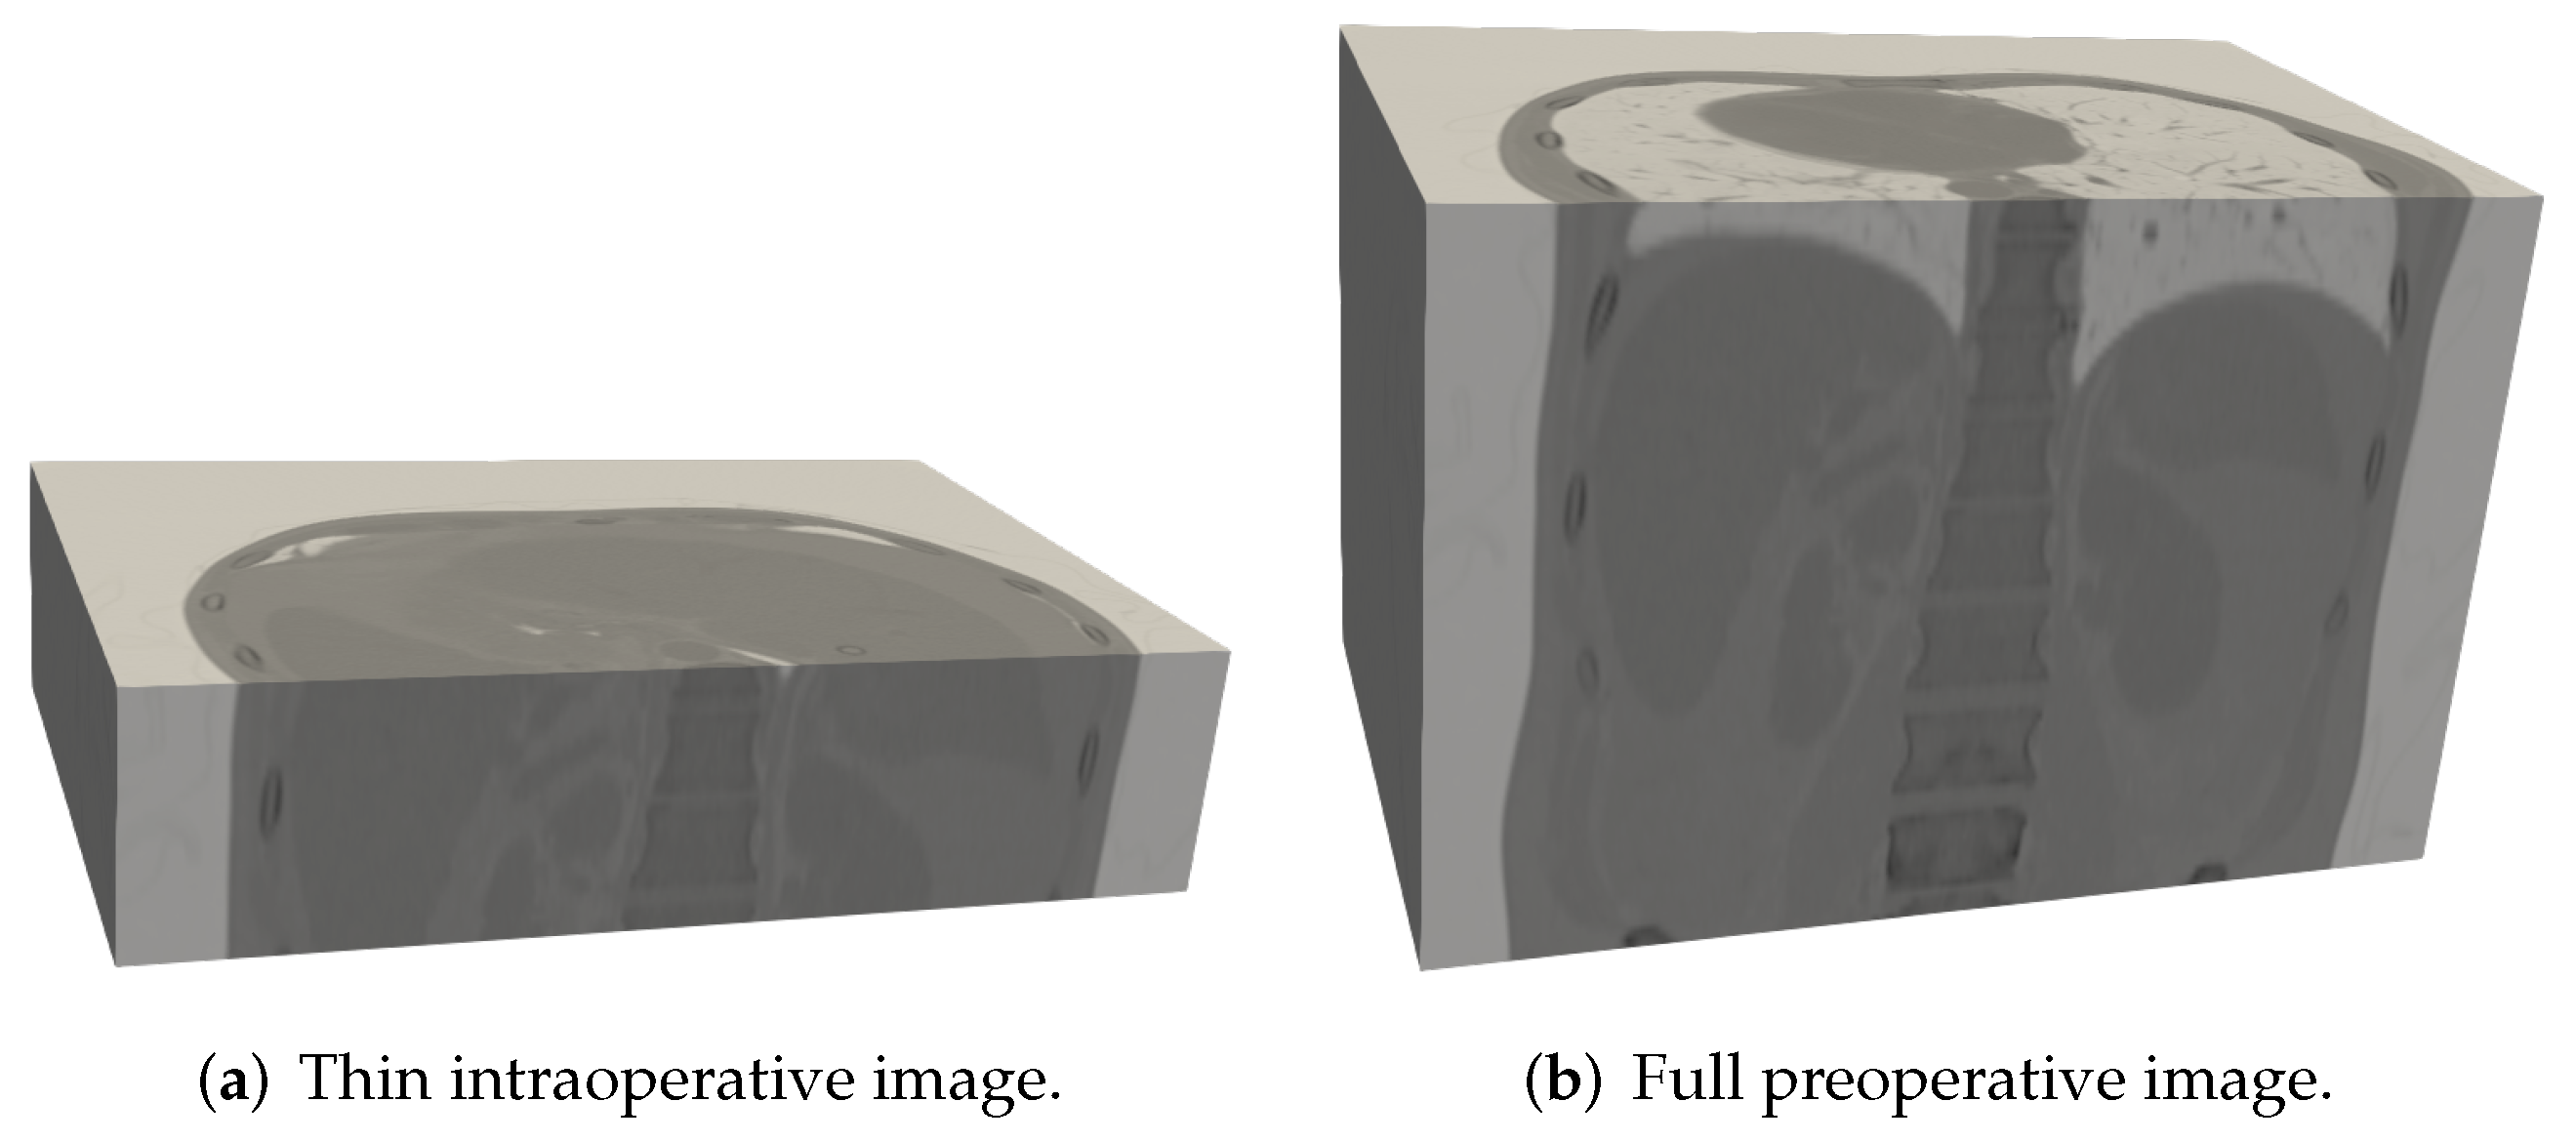
In this section we introduce a self-supervised approach for extrapolating axial slices, thus enhancing the context information required by the registration algorithms to obtain a good alignment. Due to the lack of real intraoperative data, we synthesize thin images by extracting approximately 5 cm thick sub-regions (see Section 2.1) from full CT field of views (Figure 1a).
As depicted in Figure 2, given a CT volume f : R d R we first use an uniform distribution to build a binary mask m : R d { 0 , 1 } to randomly remove 75% of the information through a voxel-wise multiplication, thus yielding an image g : R d R . We further refer to this image as the grid image, which is defining the extrapolation extent. Next, we simulate a thin acquisition t : R d R by extracting a region of interest (ROI) out of the grid image and then employ a deep neural network to restore the missing information, thus extrapolating the thin slab across z direction.

2.1. Dataset

The dataset consisted of 1400 high resolution CT images, each of which provided a complete visualization of the liver. Furthermore, from each of these images we only considered an ROI determined by the liver bounding box with respect to the z axis (further, we refer to this as the full image). To generalize the model, we stochastically set the thickness of the full image to the height of the liver bounding box, adding ±25 mm in each direction. All these images have a constant resolution of 512 × 512 in the x-y plane, with a voxel spacing of 0.8 mm, while the mean resolution for the z-axis is of 179.2 voxels (ranging from 24 to 796, with a mean voxel spacing of 1.49 mm). All the images were resampled to a spacing of [3,3,1.5] mm. Further, to create an isotropic grid of size 128 × 128 × 128 voxels, either padding or cropping was performed. To avoid numerical instability and arithmetic overflow when computing the variance, we normalized our data using the Welford’s online algorithm [25].
The data were employed to develop a self-supervised learning framework, automatically creating input-output pairs from the ground-truth images: at training time, a quarter of the full volume FOV was randomly extracted simulating an intraoperative volume of varying thickness, as depicted in Figure 3. Further, a deep neural network was employed when reconstructing the original volume, thus extrapolating the thin slab across the z-axis.
We randomly split the data into a training set representing 80% of the data and a testing set representing the remaining 20% of the data. Additionally, we used 100 CT pairs for quantifying the registration performance.

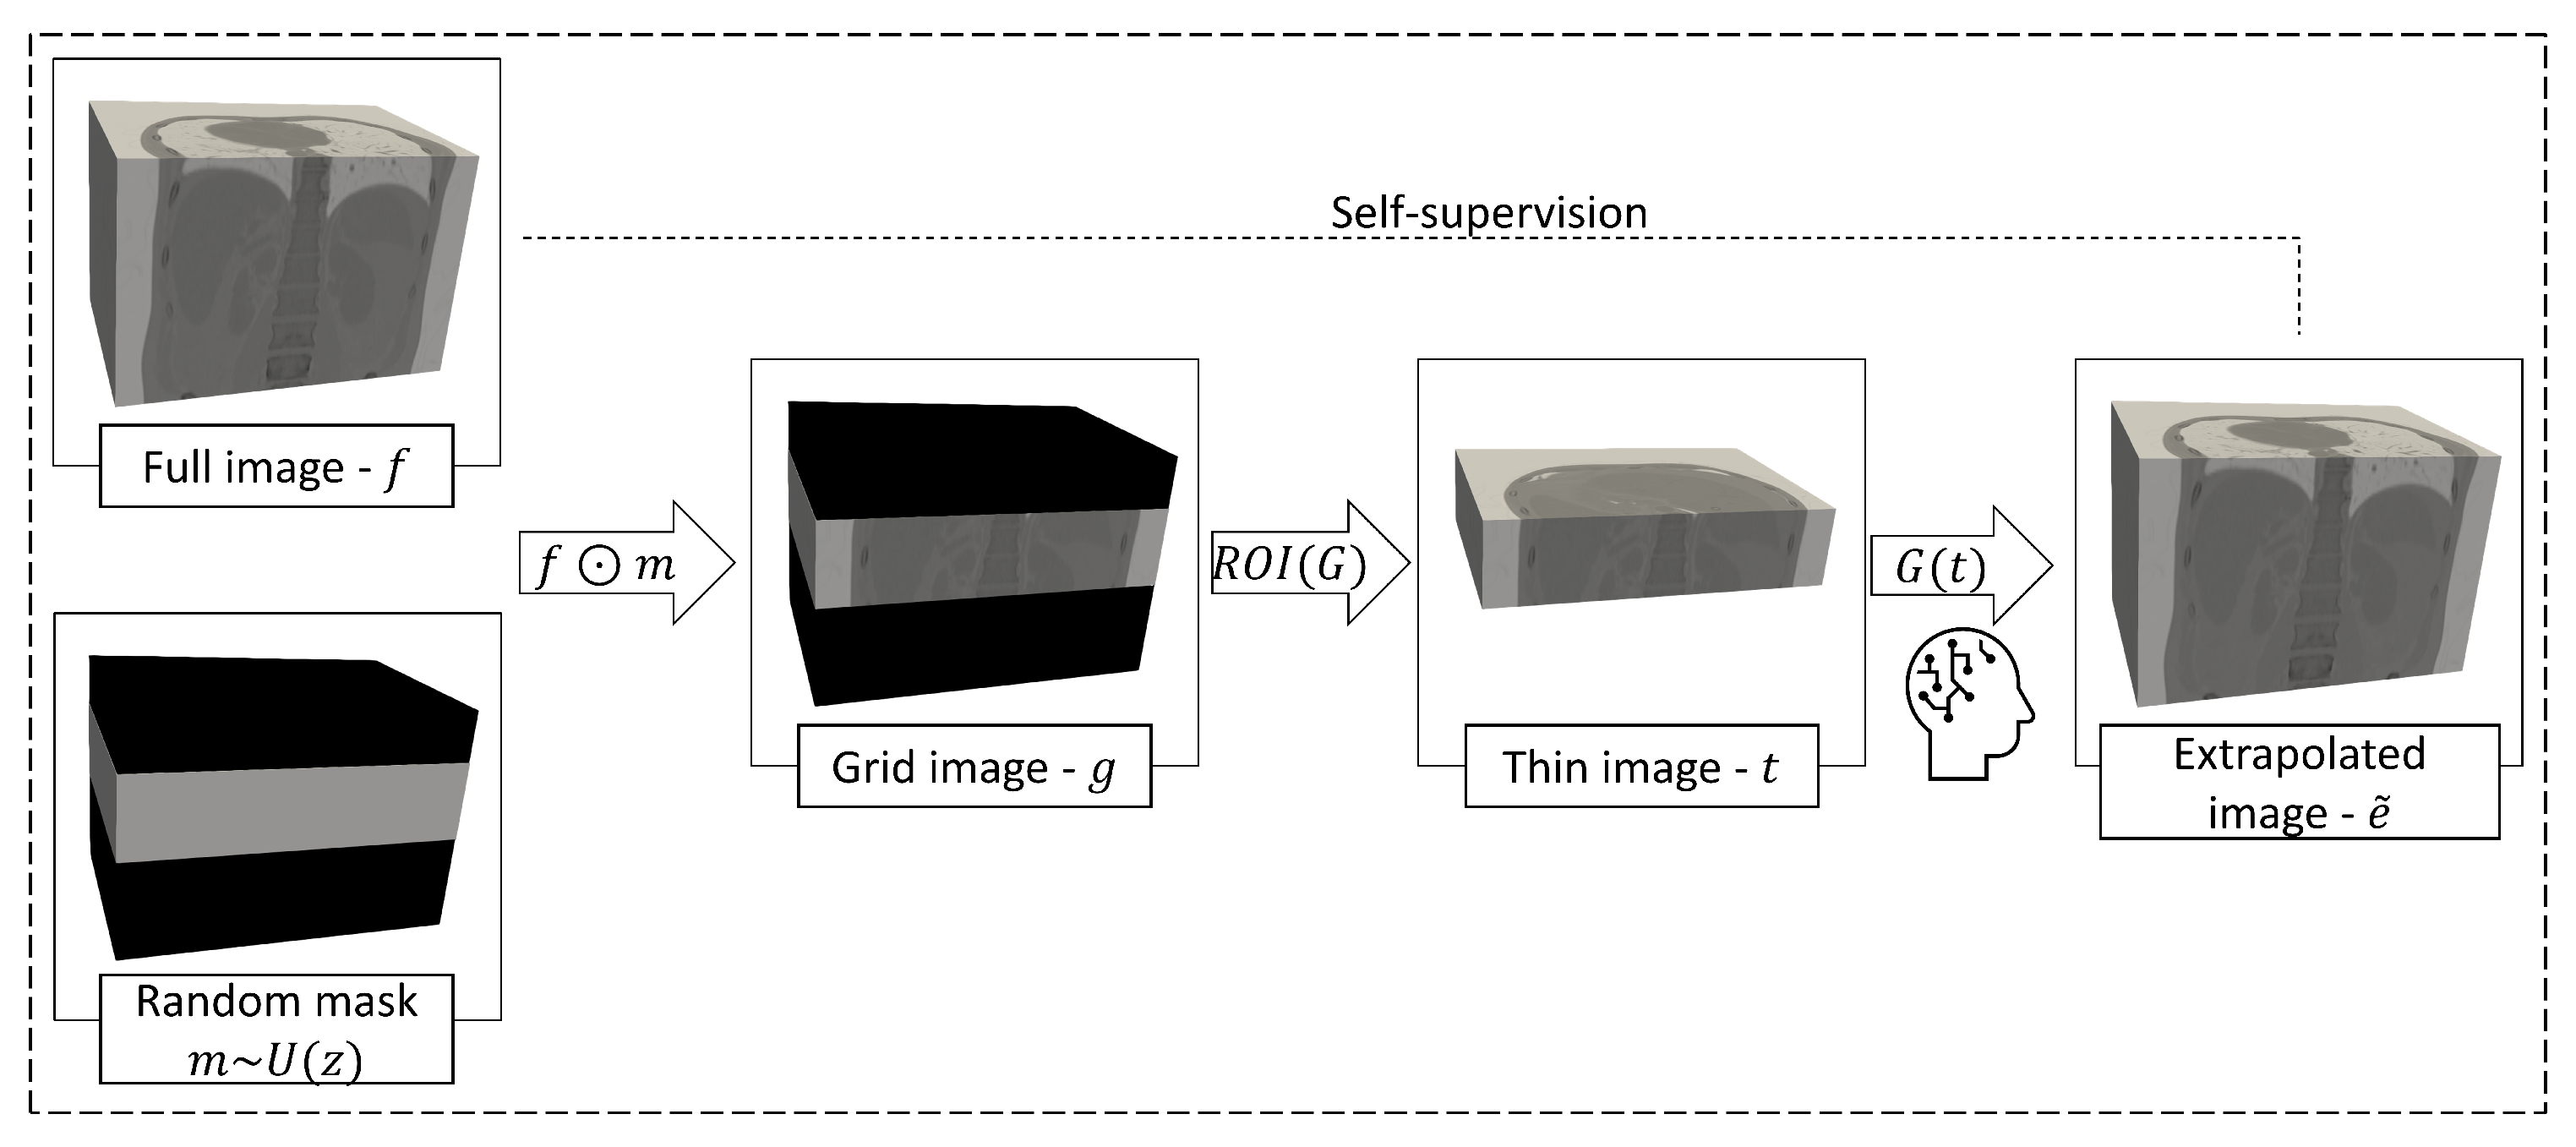
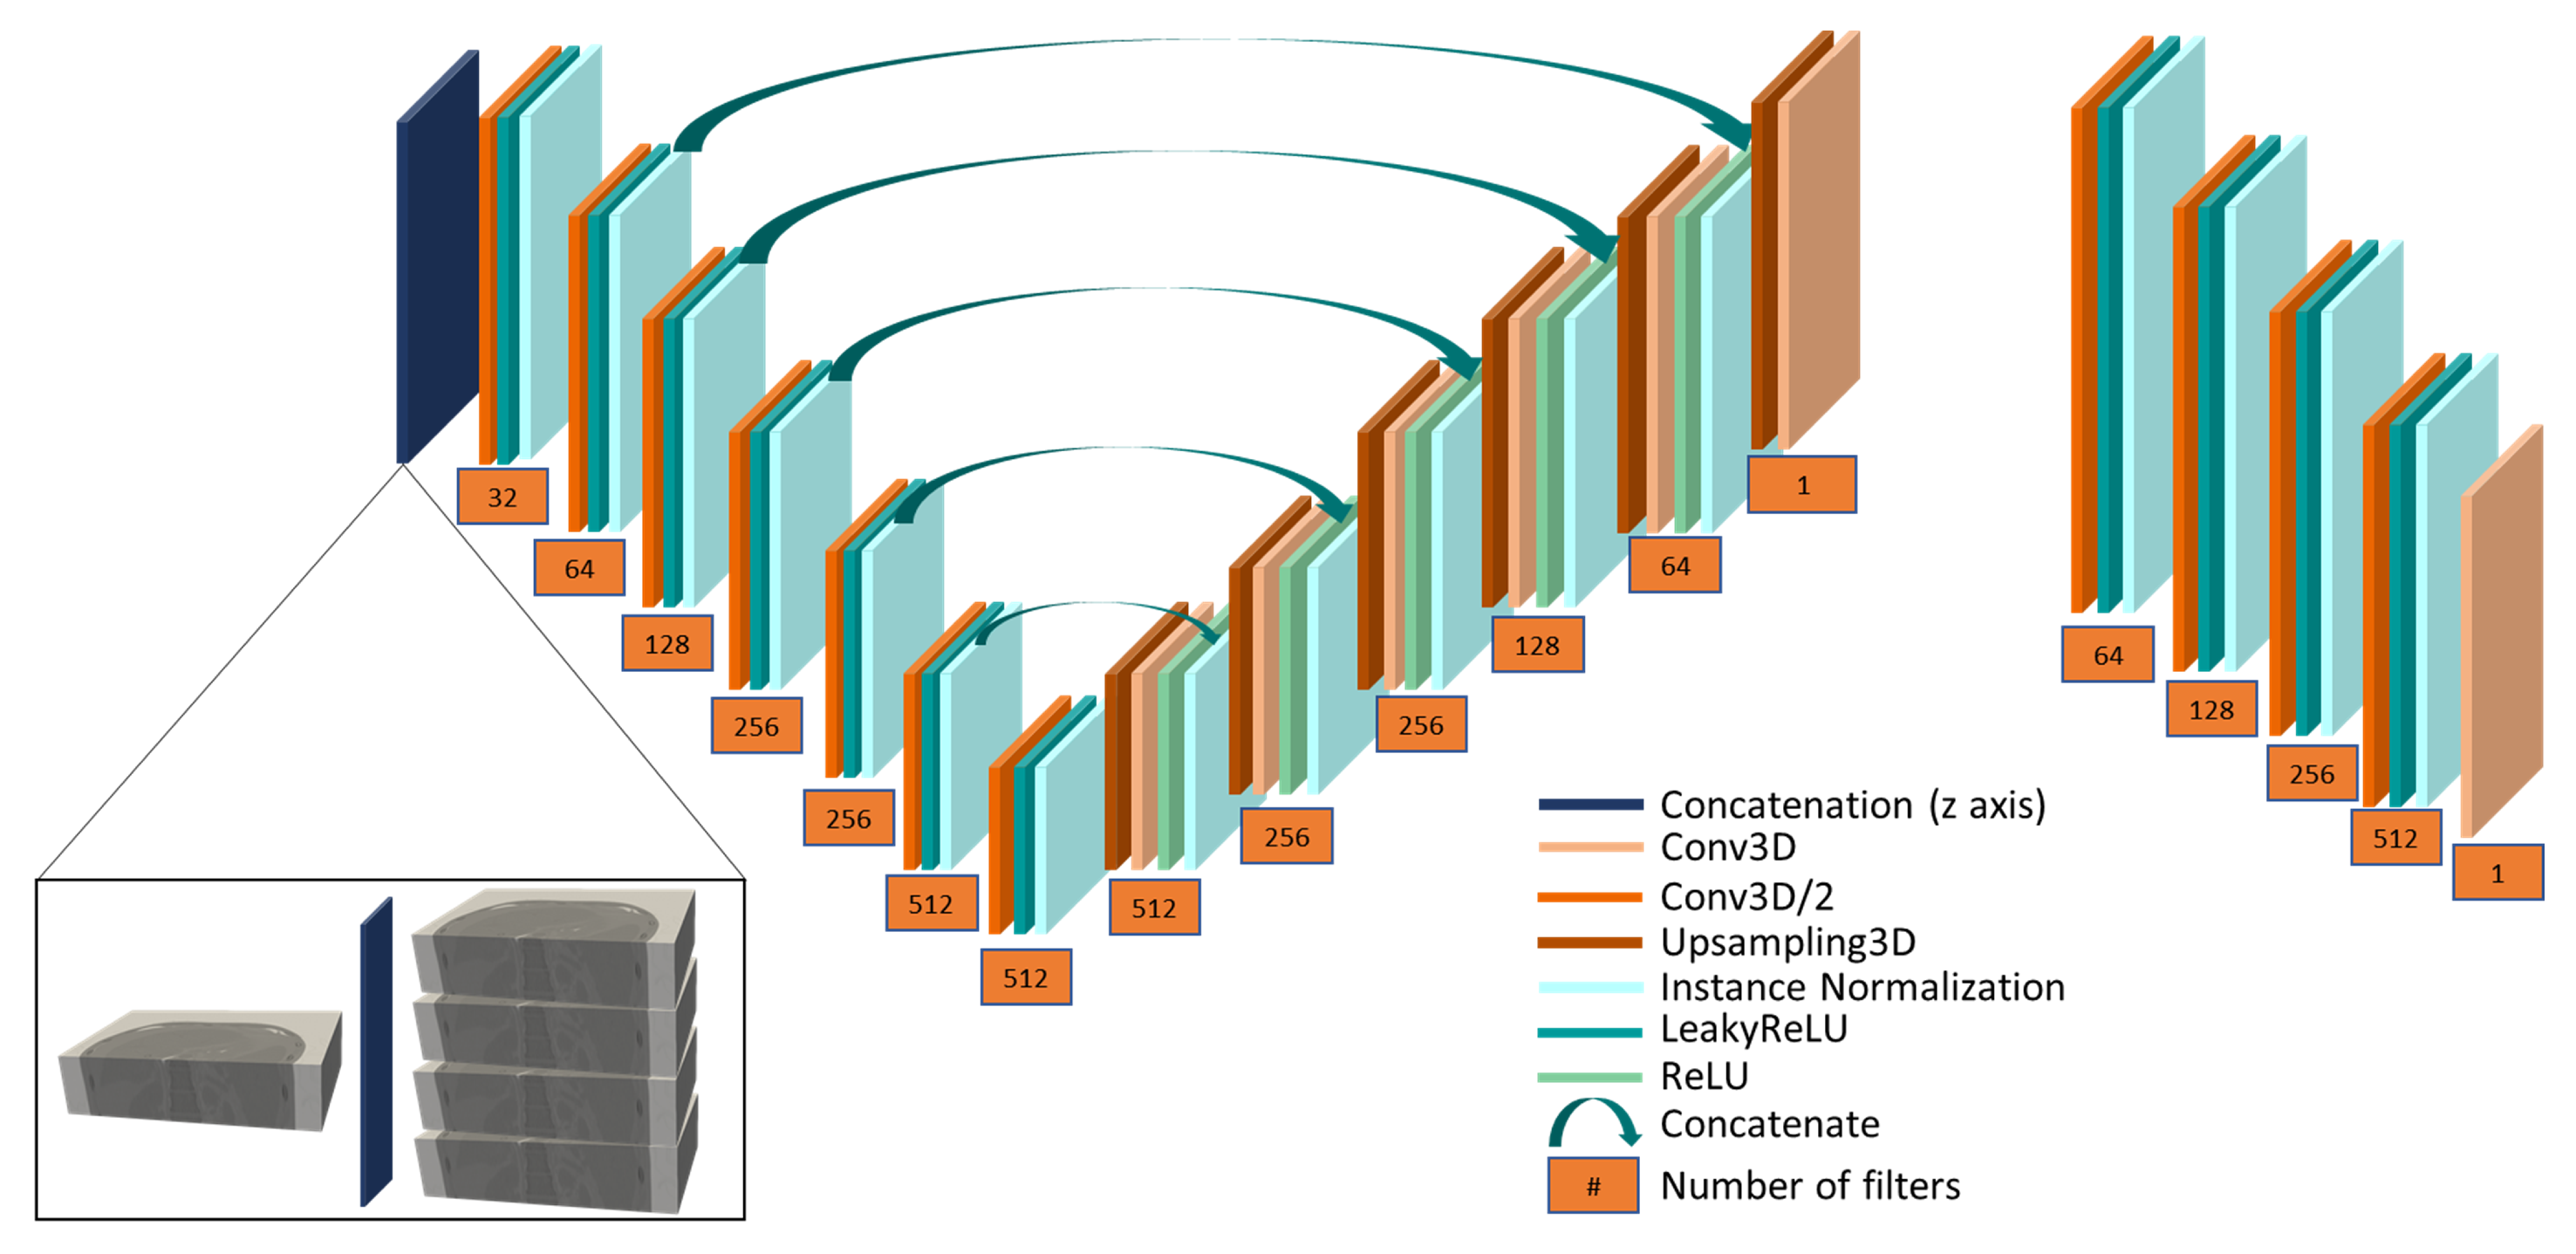
2.2. Proposed Method

We trained our extrapolation network (also referred to as generator) within an adversarial framework, optimizing it to “fool” another neural network (called critic or discriminator) regarding the authenticity of generated samples.
As depicted in Figure 4 the generator network first performed a repetition of the thin slab across the z-axis, increasing the thickness of the input with a factor of four, thus defining the target FOV of the extrapolated image. This repetition adapts the encoder’s feature maps to the decoder’s dimensions such that we can take advantage of the long term skip connections propagating the information through the network. Moreover, this strategy is beneficial in terms of expanding the receptive field of view at the bottleneck, thus using the limited amount of real information efficiently.
The rest of the generator is a variation of U-net, where each block consists of a sequence of convolution, activation function and instance normalization layers [26]. In the encoder part, downsampling was performed using 2-strided convolutions, until a receptive field of view of 255 × 255 × 255 voxels was obtained at the bottleneck. Nonlinearities are provided by LeakyReLU activations, while the decoder employs ReLUs. Upsampling was performed through interpolation layers followed by 1-strided convolutions.
We used similar blocks as in the generator to create a patch-discriminator [27] conditioned on the grid image (Figure 2g), which, besides the image to be discriminated, was provided as an input. This image helped the critic to penalize the generator in regards to finding the right extrapolation extent. Instead of outputting a single value, the critic outputs a 8 × 8 × 8 feature-map on which each element discriminates 31 × 31 × 31 voxels patches in the input.

2.2.1. Optimization Strategy

We trained the critic to distinguish between fake ( e ˜ ) and real samples (f), thus maximizing the Wasserstein distance between the real ( P r ) and fake ( P g ) data distribution [28]:
L c r i t i c = E e ˜ P g [ D ( e ˜ , g ) ] E f P r [ D ( f , g ) ] + λ E e ^ P e ^ [ ( | | e ^ ( D ( e ^ , g ) ) | | 2 1 ) 2 ]
Equation (1) displays the objective function used to train the critic, where the third term is a gradient penalty term used to improve the training stability [29].
Secondly, we trained the generator to produce images which are indistinguishable from the real ones, thus minimizing L c r i t i c by optimizing:
L a d v = E e ˜ P g [ D ( e ˜ , g ) ]
To further stimulate the generation of image details and consistent internal structures, in addition to the adversarial component, we also used a feature loss [30] penalty. This component aims at minimizing the L 1 distance between features F extracted from real and fake samples, respectively. The feature maps are provided by the third convolution layer of a 3D network trained in brain tumor segmentation [31].
L f e a t = E e ˜ , f [ | | F ( e ˜ ) F ( f ) | | 1 ]
As depicted in Figure 5, the grid information (volume g) was only used at training time by the critic to constrain the generator to find the right position of the thin slab within the target field of view.
The objective of the generator represents a weighted combination of the two terms of Equations (2) and (3). The weights have been empirically chosen such that the components take values in the same range: λ a d v = 1 and λ f e a t = 1 , which has been shown to lead to a better performance of the model. When using a larger weight for the supervision signal, as suggested in [27], the adversarial loss became unstable in the early stages of the training, hindering an improvement of the generated images over time.
L g e n = λ a d v L a d v + λ f e a t L f e a t
Since the cost function used to train GANs stems from another neural network trained jointly, the loss alone can be misleading when trying to identify the best performing model. Therefore, for the current experiment, model selection was performed through a visual inspection of the samples produced by the generator over time.

2.2.2. Image Metadata Retrieval

Since our convolutional neural network (CNN) generator operates on voxel intensity information only, we needed to perform an extra-step to retrieve the metadata of the extrapolated images.
Intuitively, the extrapolated image will have the same spacing and orientation as the thin one. However, the origin and dimension of the image changes due to the addition of synthetic information. Determining the grid dimension of the expanded volume is straight forward since we always quadruple the input field of view on the z-axis:
( d e ˜ x , d e ˜ y , d e ˜ z ) = ( d t x , d t y , d t z × 4 )
To compute the origin of the extrapolated volume, we first needed to determine thin slab’s location within the extrapolation grid. In the current work, we addressed this issue in the post-processing phase, performing an extra-registration step to determine the extent of extrapolation as further described:
We overlapped the thin slab (sliding it across z direction) at each possible location of the extrapolated volume, calculating the voxel-wise mean squared error (Figure 6 d 1 . . k ). Next, we determined the extent extrapolation by picking the index which minimized this penalty.
Further, the origin of the extrapolated image was calculated using the following expression:
( o e ˜ x , o e ˜ y , o e ˜ z ) = ( o t x , o t y , o t z a r g m i n i = 1 . . k ( d i ) × s t z )
where s t z is the spacing of thin volume across z direction.
In our tests, this simple registration step was always accurate because the extrapolation network only had to copy the thin slab’s intensities into the output volume without modifying them at all, hence generating relatively few errors.

2.3. Performance Quantification

One of the major challenges in image generation tasks is the lack of a goal standard method to quantify the performance of the generative models. Hence, we herein propose a goal oriented quantification method consisting in two tests: landmark detection [32,33] and registration errors [34].
As we want to perform a feature-based registration of two volumes based on a set of corresponding landmarks, we must encourage accurate detection on the synthetic images. Hence, we first evaluate our extrapolation models based on the euclidean distance between the manual annotations and the landmarks detected on the thin, extrapolated and ground-truth volumes, respectively.
For the registration test, the 100 additional CT pairs mentioned in Section 2.1 were used as follows: we randomly extracted thin slabs from the fixed images and then employed our models for extrapolation. Further, we compared the performance between the registration of ground-truth fixed and full moving images, thin-fixed and full moving images and extrapolated-fixed and full-moving images. We used two metrics for this evaluation: surface distance and DICE, both computed on the liver masks, obtained by using the same segmentation model employed for data preprocessing.

3. Results

Table 1 displays the structural similarity index (SSIM) and the peak signal to noise ratio (PSNR) metrics for the train and test set, respectively. No significant differences were observed between the performance of the two sets, indicating the good generalization power of the generator.

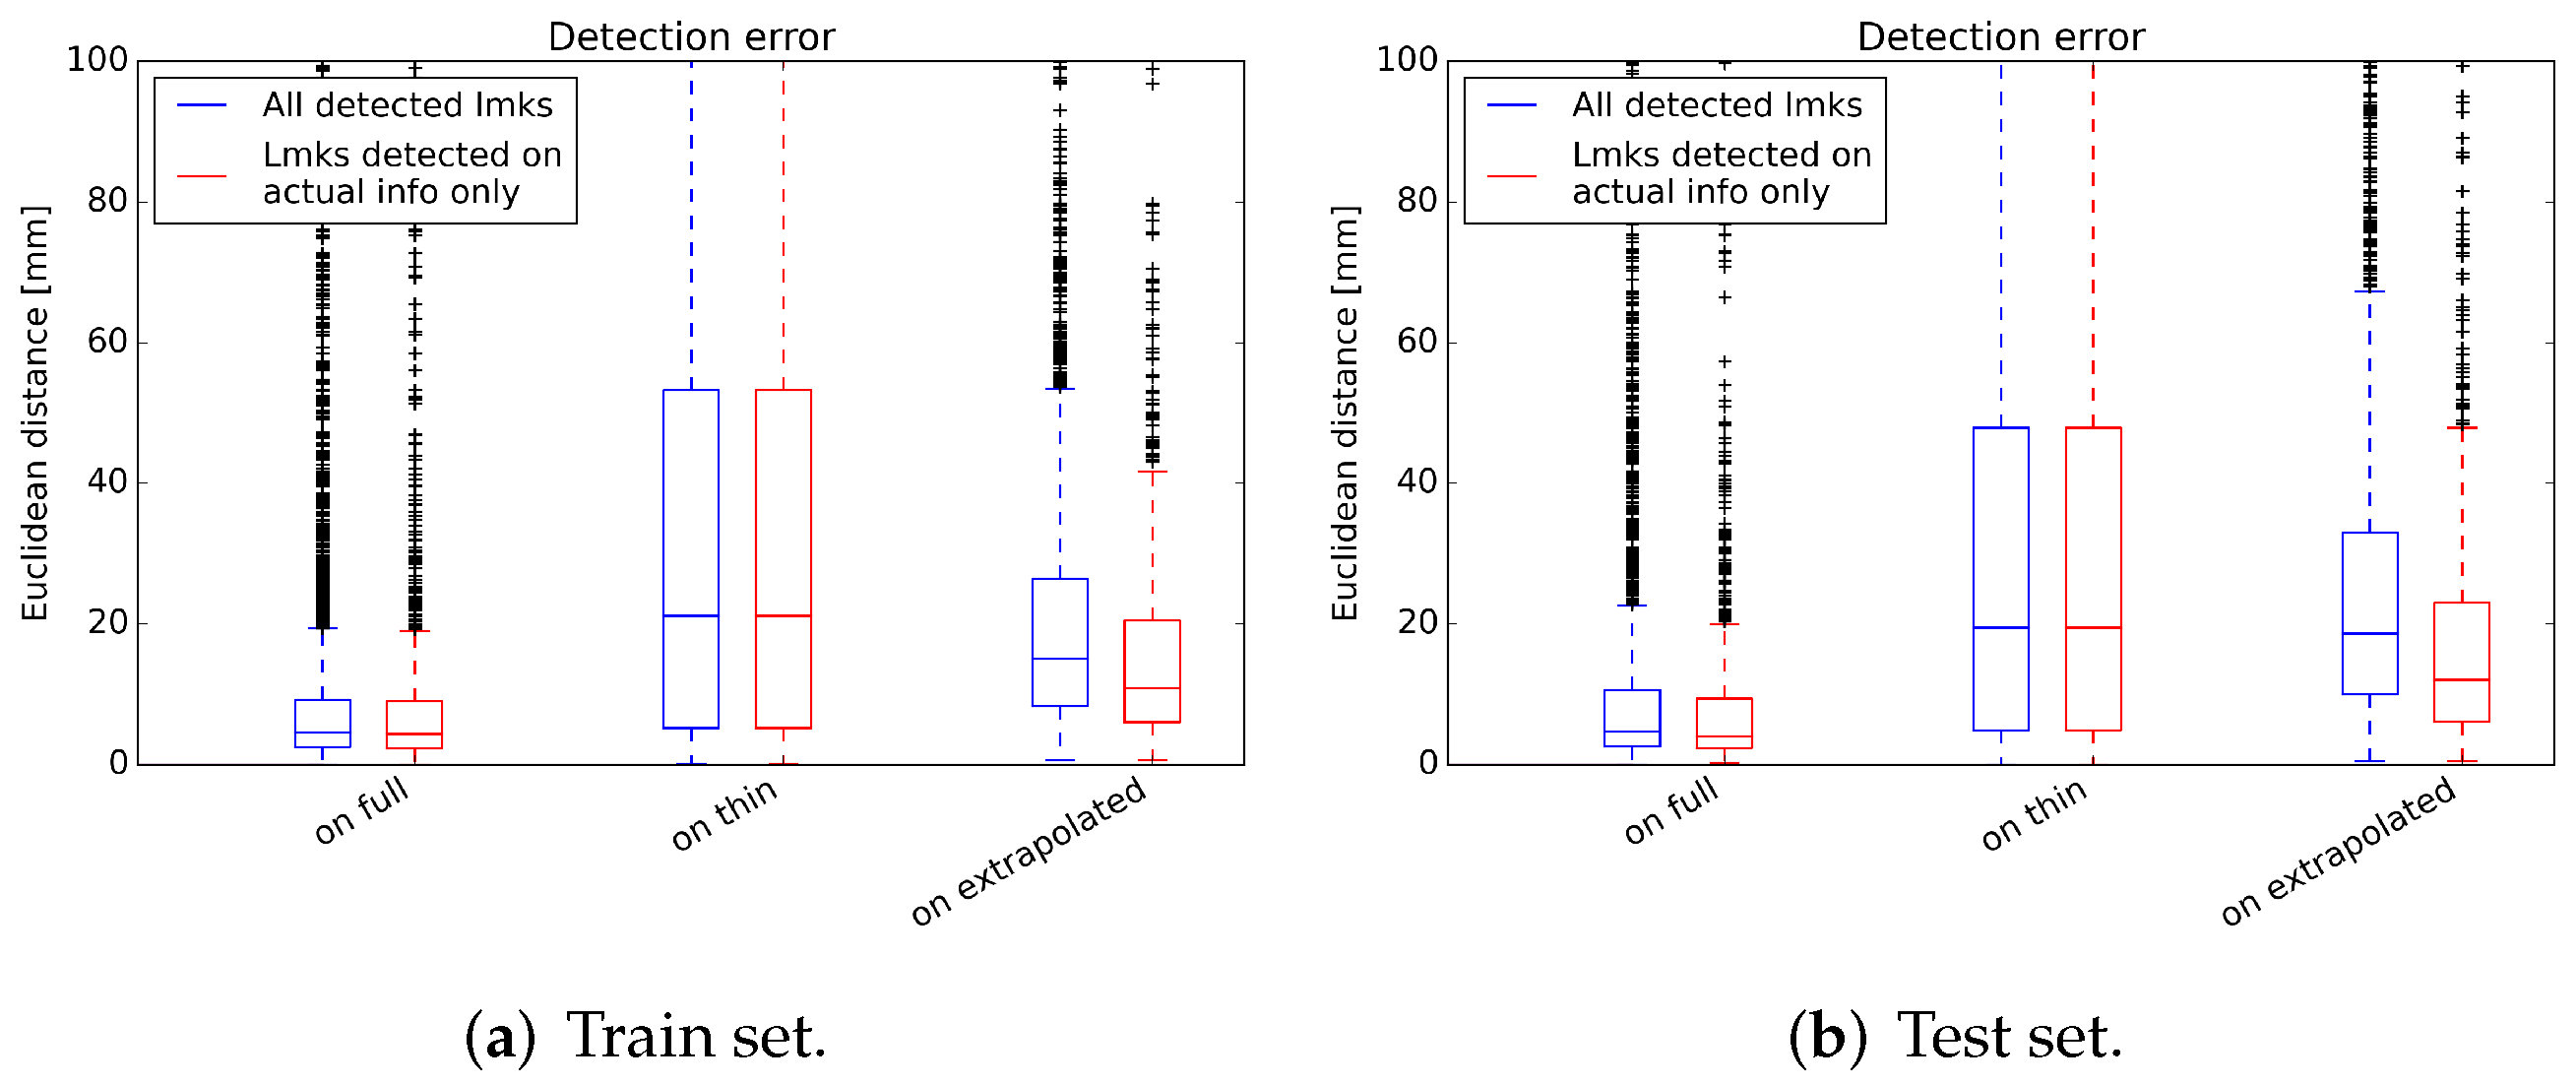
3.1. Landmark Detection Test

We ran a pretrained landmark detection model [33] on three variants of each test image: full, thin and extrapolated. Next, we calculated the Euclidean distance between each detected landmark and the corresponding manual annotation. The results are depicted in Figure 7: the proposed method reduces the median detection error by approximately 40% (from 19.51 mm to 12.08 mm, p-value = 7.38 × 10 37 ) while the interquartile range (IQR) is reduced by more than a half, which means that our method increases landmark detection robustness significantly (Table 2).
Since a quarter of the full volume thickness is always used as an input, each extrapolated image should contain (1) that quarter of the FOV (we will refer to it as actual information region) and (2) three quarters of extrapolated (hallucinated) information. All detected landmarks were considered for the blue boxplots, including the ones detected in the extrapolated region. On the other hand, the red boxplots display the detection error on the actual information only, which is more relevant, since we only employed extrapolation to provide more context for detection algorithms, rather than generating synthetic points to be used for registration.

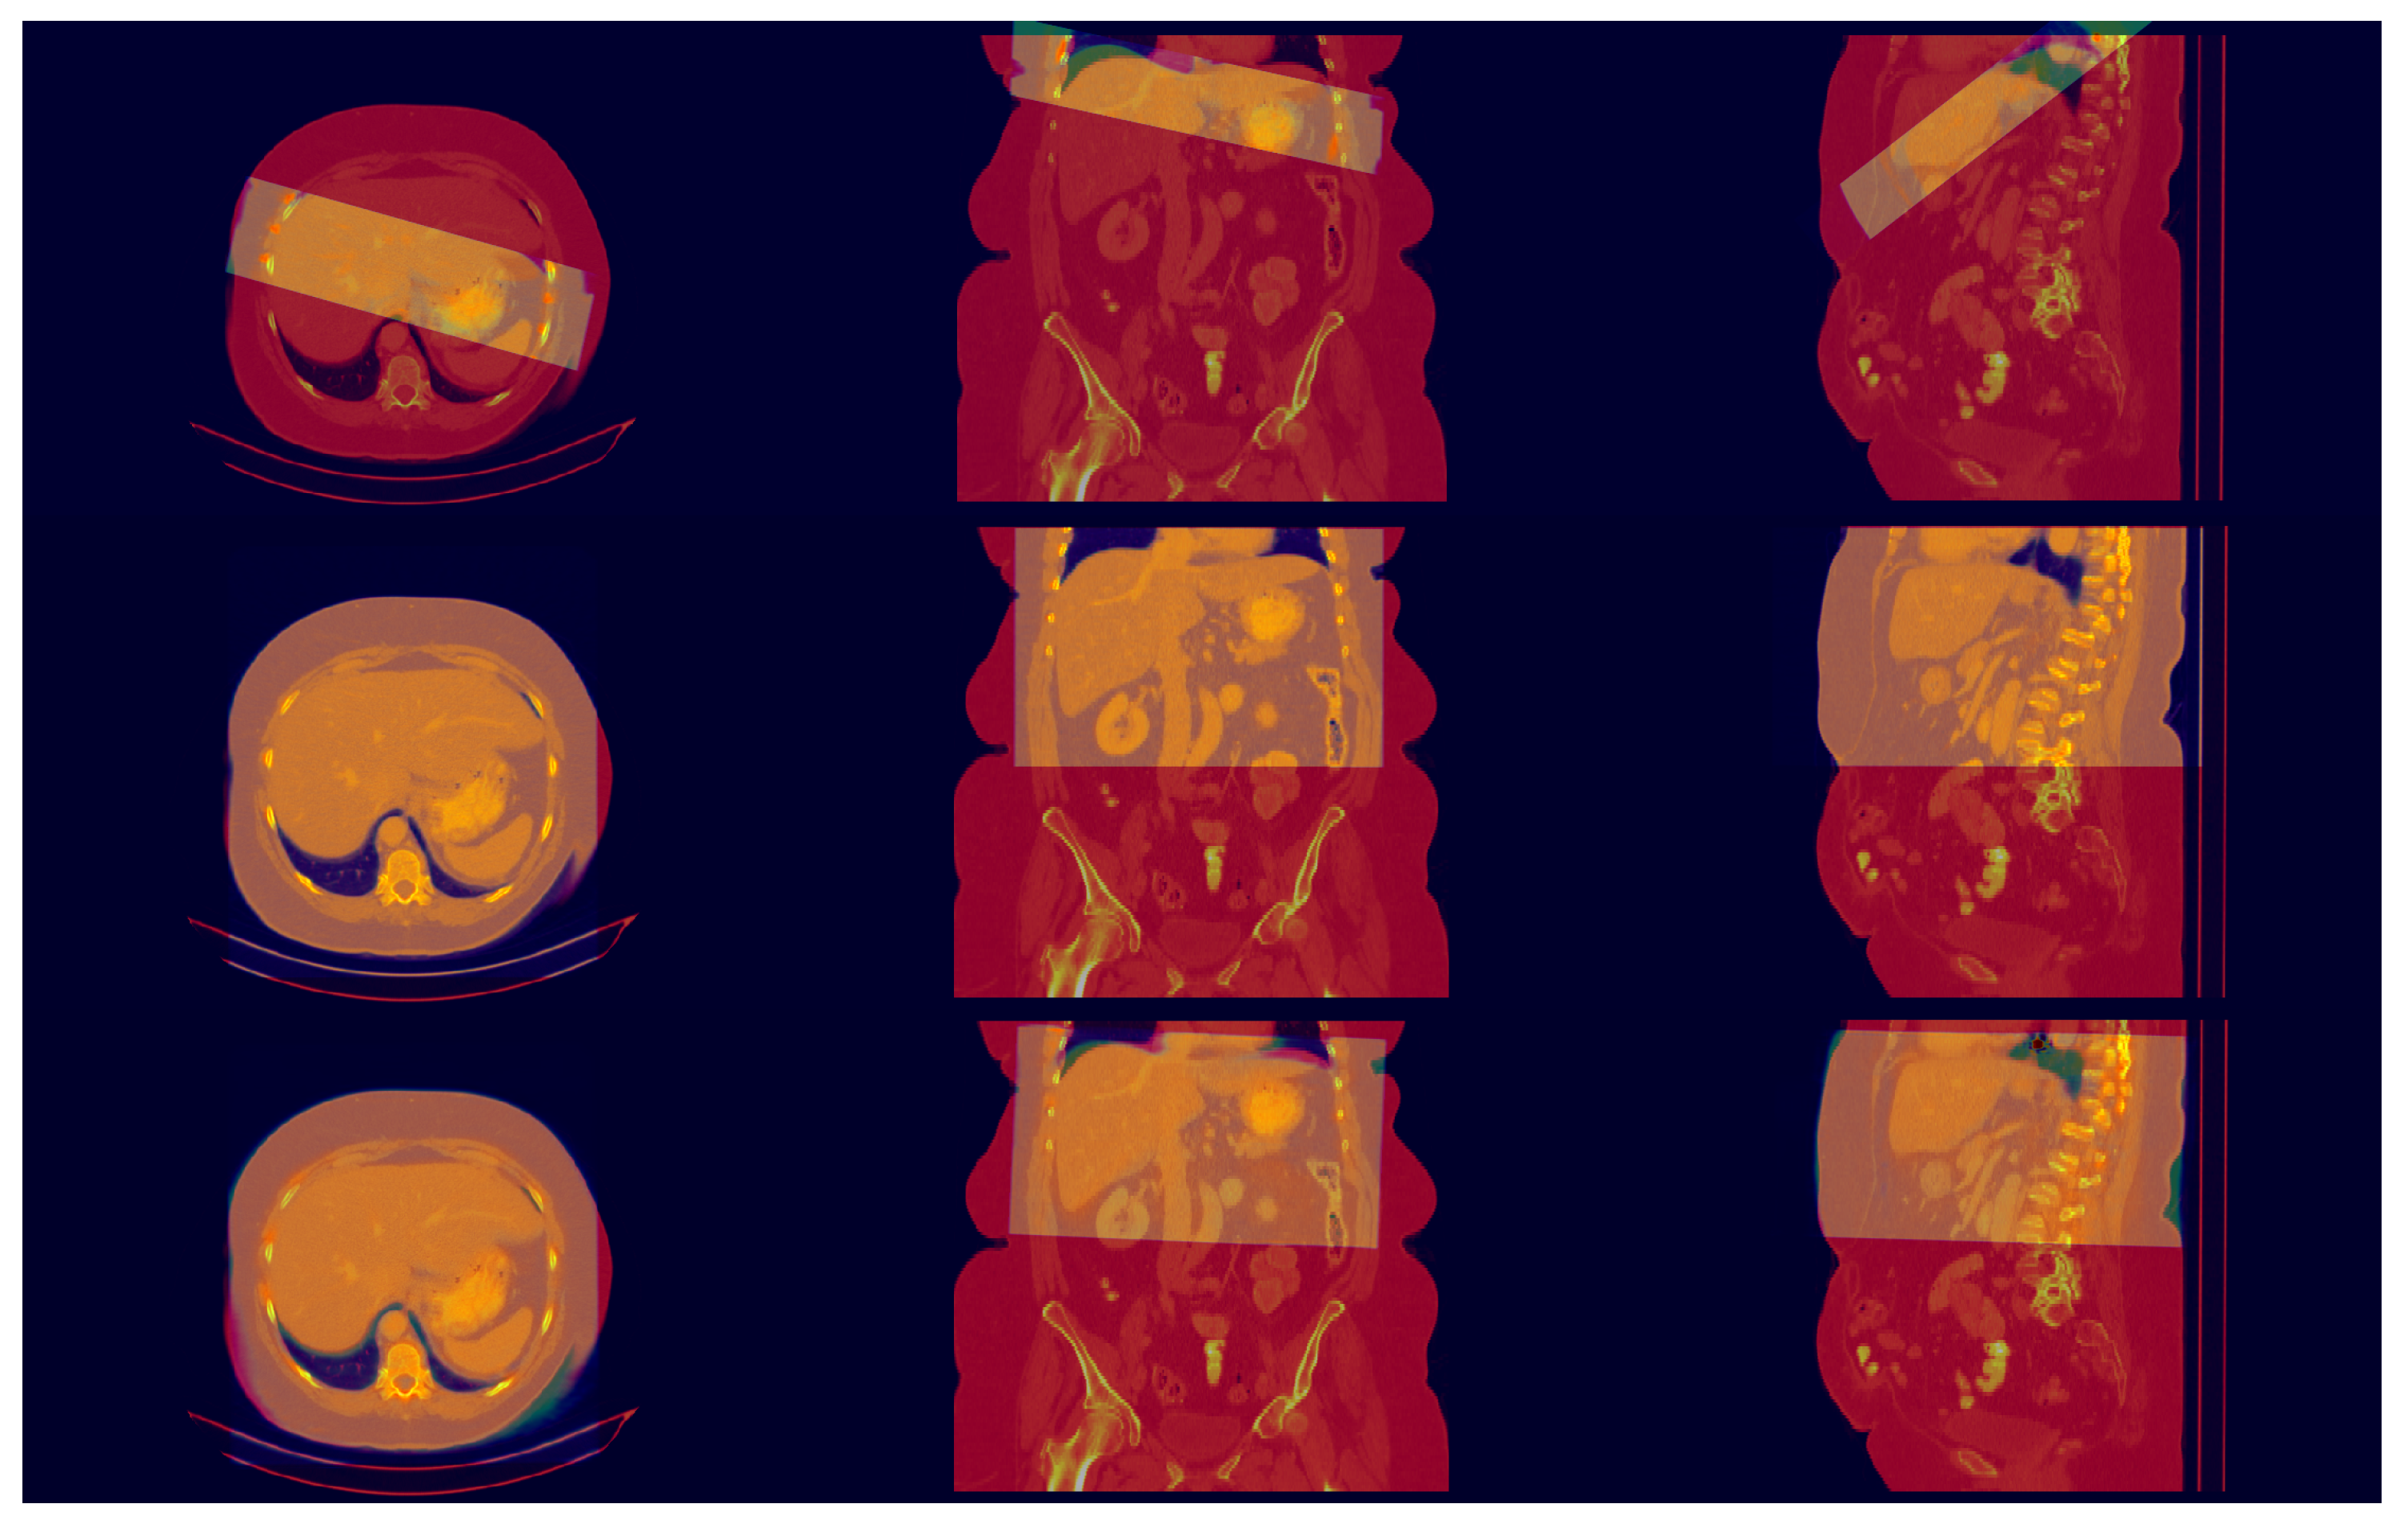
3.2. Registration Test

Figure 8 displays the registration results of the full moving images with all three variants of the fixed images-full, thin and extrapolated. The blue boxplots display the results of landmark-based registration which is then used as an initialization for the intensity-based registration, depicted in red.
As expected, the best performance was obtained when the full-moving images are registered with full-fixed images (having a median SD of 0.20 (±0.08) mm after intensity-based registration), and the worst results were obtained when the full-moving images were registered with thin-fixed images (5.66 (±20.56) mm). However, we obtained a registration performance comparable to the one corresponding to full-fixed images (0.57 (±2.05) mm) by using the proposed extrapolation method as a prior step, thus reducing the thin slab registration error with a factor of 10 (p-value = 4.18 × 10 6 ). The same holds true when considering the DICE score (Figure 8b), which increased due to the extrapolation from 0.67 to 0.88 (median).
Figure 9 displays a comparison between the registration of thin, full and extrapolated images. While the first row presents a poor registration of the thin image, the third row demonstrates the benefits of our approach, showing a much better overlap between the extrapolated-fixed and full-moving images. However, the best performance was obtained when aligning the full-fixed with the full-moving images (second row).

4. Discussion

4.1. Algorithm Selection

Before defining the method described in this paper, a number of experiments were performed. At first, a 2D Wasserstein GAN with gradient penalty was employed in extrapolating individual coronal slices, which were stacked together afterwards to create a 3D volume. Although the generated 2D samples looked relatively realistic per se (see Figure A1), the resulting 3D volumes had a significant inconsistency across the y direction, leading to a poor detection and registration performance. We have tried to mitigate this inconsistency by using a sequence of five consecutive frames as input to predict the middle one, and by adding to the cost function of total variation loss across the y direction. No substantial improvement was observed.
On 3D data we trained various settings of Least Squared GANs (LSGAN) [35] with no success. The discriminator learned to distinguish fake samples within a few iterations, providing very strong gradients, hence placing the generator into a mode collapse. To mitigate this behavior we tried different strategies such as decreasing the size of the network, Dropout regularization, Gaussian noise addition to layers and/or labels, occasionally flipping the targets, addition of voxel-wise supervision loss component for training the generator, etc. The 3D Wasserstein GAN with gradient penalty demonstrated more stable behavior during the training, when used in conjunction with an extra-supervision loss, such as voxel-wise mean squared error or a feature loss (Equation (3)). Although the perceptual quality of the generated samples is much lower when compared to the 2D counterpart (see Figure A2), the goal oriented metrics (landmark detection error and registration performance) demonstrated a substantial improvement.

4.2. Overall Discussion

We found that our method reduced the median landmark detection error by a very large margin, thus leading to a superior feature-based registration. A better detection yields a better initialization for the intensity-based registration, rendering the alignment of extrapolated images comparable to the alignment of ground-truth images. Due to the enhanced context available in synthetic images, the overlapping error denoted by the median surface distance improved from 5.66 mm to 0.57 mm (p-value = 4.18 × 10 6 ).
We note that the paper represents only a proof of concept that recent advances in generative networks can improve the robustness of computer aided interventions significantly using augmented data.
The major challenge of image out-painting remains the determination of the expansion size and direction. To expand the field of view of an image, Ref. [23] propose an extra input for the network, which is a vector representing the padding to be applied in each direction (top, left, bottom and right), hence defining an extrapolation grid. In [22], a binary mask is used to remove 32 pixels from each side of an image, thus solving a symmetrical extrapolation problem. However, our self-supervised learning approach does not require such prior information since it wouldn’t be available in real world applications, but it is limited to always quadrupling the thickness of the input. Therefore, to address other use-cases, where the thickness of the intraoperative images is out of distribution with respect to the training data (see Figure 3), the model must be retrained accordingly.
Another important aspect of our proposed method is the need for an extra-registration step to determine the origin of extrapolated volumes. We are aware of the existence of other (maybe more elegant) approaches, but we have chosen this simple strategy to preserve the non-rigid properties offered by the fully convolutional networks, as well as to maintain that the entire workflow is self explainable.

5. Conclusions

We proposed a method for improving the performance of intraoperative image registration by expanding the field of view of thin slabs, thus enhancing the context information required for the matching process. We showed that our approach increased the detection performance by a large margin. Therefore, the feature-based registration provided a much better initialization for the intensity-based refinement step, which produced results comparable to the ones obtained after aligning two high-resolution images having the same field of view.

Author Contributions

Conceptualization, T.M. and S.R.; methodology, A.P., S.R. and T.P.; software, A.P.; validation, A.P., S.R. and T.P.; formal analysis, A.P.; investigation, A.P.; resources, S.R. and F.C.G.; data curation, A.P.; writing—original draft preparation, A.P.; writing—review and editing, S.R., L.M.I., C.S., F.C.G. and T.M.; supervision, L.M.I., C.S. and T.M. All authors have read and agreed to the published version of the manuscript.

Funding

This work was partially supported by a grant of the Romanian Ministry of Education and Research, CNCS—UEFISCDI, project number PN-III-P1-1.1-TE-2019-1804, within PNCDI III.

Institutional Review Board Statement

Not applicable.

Informed Consent Statement

Not applicable.

Data Availability Statement

Due to the nature of this research, participants of this study did not agree for their data to be shared publicly, so supporting data is not available.

Acknowledgments

The concepts and information presented in this paper are based on research results that are not commercially available. Future commercial availability cannot be guaranteed.

Conflicts of Interest

Andrei Puiu, Lucian Mihai Itu and Constantin Suciu are employees of Siemens SRL, Advanta, Brasov, Romania. Sureerat Reaungamornrat and Florin Cristian Ghesu are employees of Siemens Healthineers, Digital Technology and Innovation, Princeton, NJ, USA.

Abbreviations

The following abbreviations are used in this manuscript:
RFARadiofrequency ablation
CTComputer Tomograph
FOVField of view
GANGenerative adversarial network
ROIRegion of interest
CNNConvolutional neural network
IQRInterquartile range
SSIMStructural similarity index
PSNRPeak signal to noise ratio

Appendix A

Figure A1 displays some examples of extrapolated volumes using a 2D neural network, trained to extrapolate individual coronal frames. Although the network produces relatively plausible images across the extrapolation axis (middle), the resulting 3D volume displays a significant inconsistency across the y direction, which can be seen in the axial (left) and sagittal (right) views.
Figure A2 displays two examples of 3D extrapolation with the proposed approach, where the thin input image is overlayed on the coronal and sagittal views. Extrapolated volumes tend to be blurry and affected by noise, but in terms of structural consistency they are superior to the ones generated with the 2D neural network.
Figure A1. 2D extrapolation examples. Left—axial view; Middle—coronal frame (extrapolation axis); Right—sagittal frame.
Applsci 12 02944 g0a1
Figure A2. 3D extrapolation examples. Each example provides a comparison of the extrapolated image (left) with the ground truth image (right). Top—axial view; Middle—coronal frame (extrapolation axis); Bottom—sagittal frame.
Applsci 12 02944 g0a2

References

  1. Mauro, M.; Murphy, K.; Thomson, K.; Venbrux, A.; Morgan, R. Image-Guided Interventions, 3rd ed.; Elsevier, Inc.: Philadelphia, PA, USA, 2020. [Google Scholar]
  2. Cleary, K.; Peters, T.M. Image-Guided Interventions: Technology Review and Clinical Applications. Annu. Rev. Biomed. Eng. 2010, 12, 119–142. [Google Scholar] [CrossRef] [PubMed]
  3. Modersitzki, J. Numerical Methods for Image Registration; Oxford University Press Inc.: New York, NY, USA, 2004; pp. 27–44. [Google Scholar]
  4. Liao, R.; Zhang, L.; Sun, Y.; Miao, S.; Chefd’Hotel, C. A Review of Recent Advances in Registration Techniques Applied to Minimally Invasive Therapy. IEEE Trans. Multimed. 2013, 15, 983–1000. [Google Scholar] [CrossRef]
  5. Zitová, B.; Flusser, J. Image Registration Methods: A Survey. Image Vis. Comput. 2003, 21, 977–1000. [Google Scholar] [CrossRef] [Green Version]
  6. Pluim, J.P.W.; Maintz, J.B.A.; Viergever, M.A. Mutual-information-based registration of medical images: A survey. IEEE Trans. Med. Imaging 2003, 22, 986–1004. [Google Scholar] [CrossRef] [PubMed]
  7. Mansi, T.; Passerini, T.; Comaniciu, D. (Eds.) Artificial Intelligence for Computational Modeling of the Heart, 1st ed.; Academic Press in an Imprint of Elsevier: San Diego, CA, USA, 2019. [Google Scholar]
  8. Fischer, A.; Klein, P.; Radulescu, P.; Gulsun, M.; Mohamed Ali, A.; Schoebinger, M.; Sahbaee, P.; Sharma, P.; Schoepf, U. Deep Learning Based Automated Coronary Labeling for Structured Reporting of Coronary CT Angiography in Accordance with SCCT Guidelines. J. Cardiovasc. Comput. Tomogr. 2020, 14, S21–S22. [Google Scholar] [CrossRef]
  9. Goodfellow, I.J.; Pouget-Abadie, J.; Mirza, M.; Xu, B.; Warde-Farley, D.; Ozair, S.; Courville, A.; Bengio, Y. Generative Adversarial Networks. arXiv 2014, arXiv:1406.2661. [Google Scholar] [CrossRef]
  10. Karras, T.; Aila, T.; Laine, S.; Lehtinen, J. Progressive Growing of GANs for Improved Quality, Stability, and Variation. International Conference on Learning Representations. 2018. Available online: https://openreview.net/forum?id=Hk99zCeAb (accessed on 9 March 2022).
  11. Karras, T.; Laine, S.; Aila, T. A Style-Based Generator Architecture for Generative Adversarial Networks. IEEE Trans. Pattern Anal. Mach. Intell. 2021, 43, 4217–4228. [Google Scholar] [CrossRef] [PubMed] [Green Version]
  12. Park, T.; Liu, M.Y.; Wang, T.C.; Zhu, J.Y. Semantic Image Synthesis with Spatially-Adaptive Normalization. In Proceedings of the 2019 IEEE/CVF Conference on Computer Vision and Pattern Recognition (CVPR), Long Beach, CA, USA, 16–20 June 2019; pp. 2332–2341. [Google Scholar] [CrossRef] [Green Version]
  13. Zhang, Y.; Miao, S.; Mansi, T.; Liao, R. Task Driven Generative Modeling for Unsupervised Domain Adaptation: Application to X-ray Image Segmentation. arXiv 2018, arXiv:1806.07201. [Google Scholar]
  14. You, C.; Li, G.; Zhang, Y.; Zhang, X.; Shan, H.; Li, M.; Ju, S.; Zhao, Z.; Zhang, Z.; Cong, W.; et al. CT Super-resolution GAN Constrained by the Identical, Residual, and Cycle Learning Ensemble (GAN-CIRCLE). IEEE Trans. Med. Imaging 2019, 39, 188–203. [Google Scholar] [CrossRef] [PubMed] [Green Version]
  15. Yang, Q.; Yan, P.; Zhang, Y.; Yu, H.; Shi, Y.; Mou, X.; Kalra, M.K.; Zhang, Y.; Sun, L.; Wang, G. Low-Dose CT Image Denoising Using a Generative Adversarial Network with Wasserstein Distance and Perceptual Loss. IEEE Trans. Med. Imaging 2018, 37, 1348–1357. [Google Scholar] [CrossRef] [PubMed]
  16. Vizitiu, A.; Puiu, A.; Reaungamornrat, S.; Itu, L.M. Data-Driven Adversarial Learning for Sinogram-Based Iterative Low-Dose CT Image Reconstruction. In Proceedings of the 2019 23rd International Conference on System Theory, Control and Computing (ICSTCC), Sinaia, Romania, 9–11 October 2019; pp. 668–674. [Google Scholar] [CrossRef]
  17. Zhu, J.-Y.; Park, T.; Isola, P.; Efros, A.A. Unpaired Image-to-Image Translation using Cycle-Consistent Adversarial Networks. In Proceedings of the 2017 IEEE International Conference on Computer Vision (ICCV), Venice, Italy, 22–29 October 2017; pp. 2242–2251. [CrossRef] [Green Version]
  18. Karim, A.; Chenming, J.; Marc, F.; Thomas, K.; Tobias, H.; Konstantin, N.; Sergios, G.; Bin, Y. MedGAN: Medical Image Translation using GANs. Comput. Med. Imaging Graph. 2019, 79, 101684. [Google Scholar] [CrossRef]
  19. Iizuka, S.; Simo-Serra, E.; Ishikawa, H. Globally and Locally Consistent Image Completion. ACM Trans. Graph. 2017, 36, 107. [Google Scholar] [CrossRef]
  20. Liu, P.; Qi, X.; He, P.; Li, Y.; Lyu, M.R.; King, I. Semantically Consistent Image Completion with Fine-grained Details. arXiv 2017, arXiv:1711.09345. [Google Scholar]
  21. Yang, C.; Lu, X.; Lin, Z.; Shechtman, E.; Wang, O.; Li, H. High-Resolution Image Inpainting using Multi-Scale Neural Patch Synthesis. In Proceedings of the 2017 IEEE Conference on Computer Vision and Pattern Recognition (CVPR), Honolulu, HI, USA, 21–26 July 2017; pp. 4076–4084. [Google Scholar] [CrossRef] [Green Version]
  22. Sabini, M.; Rusak, G. Painting Outside the Box: Image Outpainting with GANs. arXiv 2018, arXiv:1808.08483. [Google Scholar]
  23. Wang, Y.; Tao, X.; Shen, X.; Jia, J. Wide-Context Semantic Image Extrapolation. In Proceedings of the 2019 IEEE/CVF Conference on Computer Vision and Pattern Recognition (CVPR), Long Beach, CA, USA, 15–20 June 2019; pp. 1399–1408. [Google Scholar] [CrossRef]
  24. Sumantri, J.S.; Park, I.K. 360 Panorama Synthesis from a Sparse Set of Images with Unknown Field of View. arXiv 2019, arXiv:1904.03326. [Google Scholar]
  25. Knuth, D.E. The Art of Computer Programming, 3rd ed.; Addison-Wesley: Reading, MA, USA, 1997; p. 232. [Google Scholar]
  26. Ulyanov, D.; Vedaldi, A.; Lempitsky, V. Instance Normalization: The Missing Ingredient for Fast Stylization. arXiv 2016, arXiv:1607.08022. [Google Scholar]
  27. Isola, P.; Zhu, J.Y.; Zhou, T.; Efros, A.A. Image-to-Image Translation with Conditional Adversarial Networks. In Proceedings of the 2017 IEEE Conference on Computer Vision and Pattern Recognition (CVPR), Honolulu, HI, USA, 21–26 July 2017; pp. 5967–5976. [Google Scholar] [CrossRef] [Green Version]
  28. Arjovsky, M.; Chintala, S.; Bottou, L. Wasserstein GAN. arXiv 2017, arXiv:1701.07875. [Google Scholar]
  29. Gulrajani, I.; Ahmed, F.; Arjovsky, M.; Dumoulin, V.; Courville, A.C. Improved Training of Wasserstein GANs. arXiv 2017, arXiv:1704.00028. [Google Scholar]
  30. Johnson, J.; Alahi, A.; Fei-Fei, L. Perceptual Losses for Real-Time Style Transfer and Super-Resolution. In European Conference on Computer Vision; ECCV 2016: Computer Vision—ECCV 2016, Lecture Notes in Computer Science; Leibe, B., Matas, J., Sebe, N., Welling, M., Eds.; Springer: Cham, Switzerland, 2016; Volume 9906. [Google Scholar] [CrossRef] [Green Version]
  31. Isensee, F.; Kickingereder, P.; Wick, W.; Bendszus, M.; Maier-Hein, K. Brain Tumor Segmentation and Radiomics Survival Prediction: Contribution to the BRATS 2017 Challenge. arXiv 2017, arXiv:1802.10508. [Google Scholar]
  32. Ghesu, F.C.; Georgescu, B.; Mansi, T.; Neumann, D.; Hornegger, J.; Comaniciu, D. An Artificial Agent for Anatomical Landmark Detection in Medical Images. In Medical Image Computing and Computer-Assisted Intervention—MICCAI 2016; Ourselin, S., Joskowicz, L., Sabuncu, M.R., Unal, G., Wells, W., Eds.; Springer International Publishing: Cham, Switzerland, 2016; pp. 229–237. [Google Scholar]
  33. Ghesu, F.C.; Georgescu, B.; Zheng, Y.; Grbic, S.; Maier, A.; Hornegger, J.; Comaniciu, D. Multi-Scale Deep Reinforcement Learning for Real-Time 3D-Landmark Detection in CT Scans. IEEE Trans. Pattern Anal. Mach. Intell. 2019, 41, 176–189. [Google Scholar] [CrossRef] [PubMed]
  34. Chenoune, Y.; Constantinides, C.; Berbari, R.; Roullot, E.; Frouin, F.; Herment, A.; Mousseaux, E. Rigid registration of Delayed-Enhancement and Cine Cardiac MR images using 3D Normalized Mutual Information. In Proceedings of the 2010 Computing in Cardiology, Belfast, UK, 26–29 September 2010; Volume 37, pp. 161–164. [Google Scholar]
  35. Mao, X.; Li, Q.; Xie, H.; Lau, R.Y.K.; Wang, Z.; Smolley, S.P. Least Squares Generative Adversarial Networks. In Proceedings of the 2017 IEEE International Conference on Computer Vision (ICCV), Venice, Italy, 22–29 October 2017; pp. 2813–2821. [Google Scholar] [CrossRef] [Green Version]
Figure 1. Examples of CT images: The thin image (a) displays a reduced field of view (thickness) with respect to the z axis, as compared to the full preoperative image (b).
Applsci 12 02944 g001
Figure 2. Schematic overview of the workflow. The data are stochastically processed at training time to create a self-supervised learning framework.
Applsci 12 02944 g002
Figure 3. Thickness distribution of the training input data.
Applsci 12 02944 g003
Figure 4. Network architectures; left—U-net like generator; right—patch discriminator. The first layer of the generator performs a 4× repetition of the thin input to define the extrapolation extent.
Applsci 12 02944 g004
Figure 5. Generator optimization workflow. A conditional GAN was employed in extrapolating thin input volumes, expanding their FOV with a factor of 4.
Applsci 12 02944 g005
Figure 6. Position regression; left—thin slab t; right—extrapolated volume e ˜ .
Applsci 12 02944 g006
Figure 7. Detection errors. For the blue boxplots all detected landmarks were considered, while the red boxplots only take into account landmarks detected on the region containing the actual information.
Applsci 12 02944 g007
Figure 8. Registration results: landmark-based registration in blue, intensity-based registration in red. Each figure has three groups: left—registration of full-fixed with full-moving images; middle—registration of thin-fixed with full-moving images; right—registration of extrapolated-fixed with full-moving images.
Applsci 12 02944 g008
Figure 9. Registration example. The first row displays a poor alignment of the thin image, while the third row displays an improved registration determined by the extrapolation. The middle row presents a very accurate registration of the ground truth full image for comparison.
Applsci 12 02944 g009
Table 1. Image similarity results.
Mean (±std) [mm]
MetricTrain SetTest Set
SSIM 0.726   ( ± 0.04 ) 0.719   ( ± 0.05 )
PSNR 24.13   ( ± 2.19 ) 23.76   ( ± 2.26 )
Table 2. Landmark detection results on the test set.
Mean (±std) [mm]
ImageAll Detected LandmarksLandmarks Detected on Actual Info
Full volume 4.64   ( ± 8.02 ) 4.04   ( ± 7.05 )
Thin volume 19.51   ( ± 43.0 ) 19.51   ( ± 43.0 )
Extrapolated volume 18.62   ( ± 22.96 ) 12.08   ( ± 16.86 )
Publisher’s Note: MDPI stays neutral with regard to jurisdictional claims in published maps and institutional affiliations.

