1. Introduction
According to the World Health Organisation, ischaemic heart disease and stroke are nowadays leading causes of death globally [
1]. Cardiovascular disease (CVD) progression is dramatically increasing every year and thus many efforts to improve risk predictors are needed. The assessment of cardiovascular risk can be done from a wide variety of information and parameters derived from patients’ history such as individual age, gender, smoking status, blood pressure, body mass index (BMI), or metabolic parameters (i.e., glucose and cholesterol levels) [
2]. However, this information is not always updated, centralized or available.
Coronary artery calcium (CAC) is a clinically validated strong marker of a CVD [
3]. CAC scoring has proved to be a consistent and reproducible method of assessing risk for major cardiovascular outcomes, especially useful in asymptomatic people for planning primary prevention [
4]. Nevertheless, CAC score obtention needs the use of CT scans, which are expensive and involve radiation risks.
Retinal Fundus Imaging (RFI) provides relevant information about the vascular system of the eye. There is previous evidence that RFI can be a predictor of CVD [
5,
6,
7,
8,
9], kidney chronic disease [
10] or dementia [
11]. Preceding research have shown that capillary vascular and foveal area are the most prevalent regions in predicting the CAC scoring from RFI [
12]. In addition, RFI is usually acquired on a regular basis from patients that suffer type 2 diabetes, being CVD one of the most common morbidity [
13].
Deep Learning (DL) algorithms have obtained significant improvements in almost all the applications of computer vision [
14,
15], including medical imaging applications. Particularly, automated retina image classification outperformed human accuracy in diabetic retinopathy diagnosis [
16]. This paper proposes to apply DL, more concretely a convolutional neural network (CNN), to the prediction of CAC score from RFI. Using data gathered in a previous project [
13] we conjecture that a CNN can predict whether a patient may be diagnosed with a CAC score greater than 400, i.e., the threshold defined by cardiologists to indicate a very high risk of CVD disease. In addition, we explore the use of two clinical variables, age and presence of diabetic retinopathy, which previous studies suggest that are highly correlated with CAC > 400 [
13]. The experiments show that both informational cues are complementary, and when properly combined, they can significantly increase the precision or recall of the prediction. We validate the proposal in two different applications, clinical diagnosis and large-scale retrieval. The results show that RFI can be used for CVD risk prediction with low-cost image acquisition, which may have a significant impact in the strategies for selecting those patients in whom the screening of CVD should be prioritized.
2. Materials and Methods
We used two state-of-the art CNN architectures, VGG [
17] (16 and 19 layers deep versions) and ResNet [
18] to learn a model of the retina images from patients with CAC > 400 and CAC < 400. We consider it as a binary (two class) classification problem. We used a 5-fold crossvalidation approach to validate the neural networks, and we picked the best performing one for the rest of the experiments in the paper. We split retina images into left and right eye data sets, and tested them independently.
Table 1 summarizes the results. VGG16 mean accuracies outperform in both cases ResNet, although differences are not statistically significant. Given their equivalence, we used VGG16 as the image classifier for the rest of the paper.
Table 2 described the main components of the VGG16 architecture, which is composed of 13 convolutional and 3 fully-connected layers.
2.1. Transfer Learning
The amount of labelled data is scarce, which poses significant difficulties in training a large neural network (130 M parameters). One of the most common approaches to cope with small sample size problems is the use of transfer learning [
19]. The CNN is first trained on a large data set of images (ImageNet [
14] in our particular study), and then the model parameters are fine-tuned according to the retina image training set. We removed the last fully-connected layer from VGG16 (FC-1000, adjusted to the ImageNet dataset), adding a two neuron layer (FC-2) to distinguish only two classes: patients labelled CAC > 400 and CAC < 400. These layer parameters where randomly initialized and fined tuned inside the learning process. The model was trained for 60 epochs, batch size of 8, using learning rate
and weight decay
. Cross-entropy loss and stochastic gradient descent were used for loss function and optimizer respectively. The use of pretrained filters significantly improves the accuracies, being the first CNN layers local filters for detecting specific image compounds, and the top (classification layers) of the network high level representations of the decision boundary. All the experiments were performed using PyTorch [
20] Python library.
2.2. Clinical Data Classification
We trained classical machine learning classifiers on the clinical data available, to analyse their prediction capabilities and their complementarity with image based classification. We used the out-of-the-box implementation from Python scikit-learn package of the classifiers: Logistic Regression, K Nearest Neighbours [
21], Support Vector Machines [
22], Gaussian Process, Decision Tree [
23], Random Forest [
24], Ada Boost [
25], Quadratic Classifier and Naive Bayes.
2.3. RFI Dataset Description
We used a RFI dataset from
patients, i.e., 152 retinal images (left/right eye), 66 of them labelled as CAC > 400 (positive samples) and 86 labelled as CAC
(negative samples). These images were selected from the PRECISED study (ClinicalTrial. gov NCT02248311). In this study, age between 46 to 76 years was an inclusion criteria. It should be noted that the incidence of cardiovascular events before 45 years is very low and, therefore, a screening strategy at younger ages are not cost-effective. Images have 3 channels (RGB). Image dimensions vary from
,
to
(width, height and color channels).
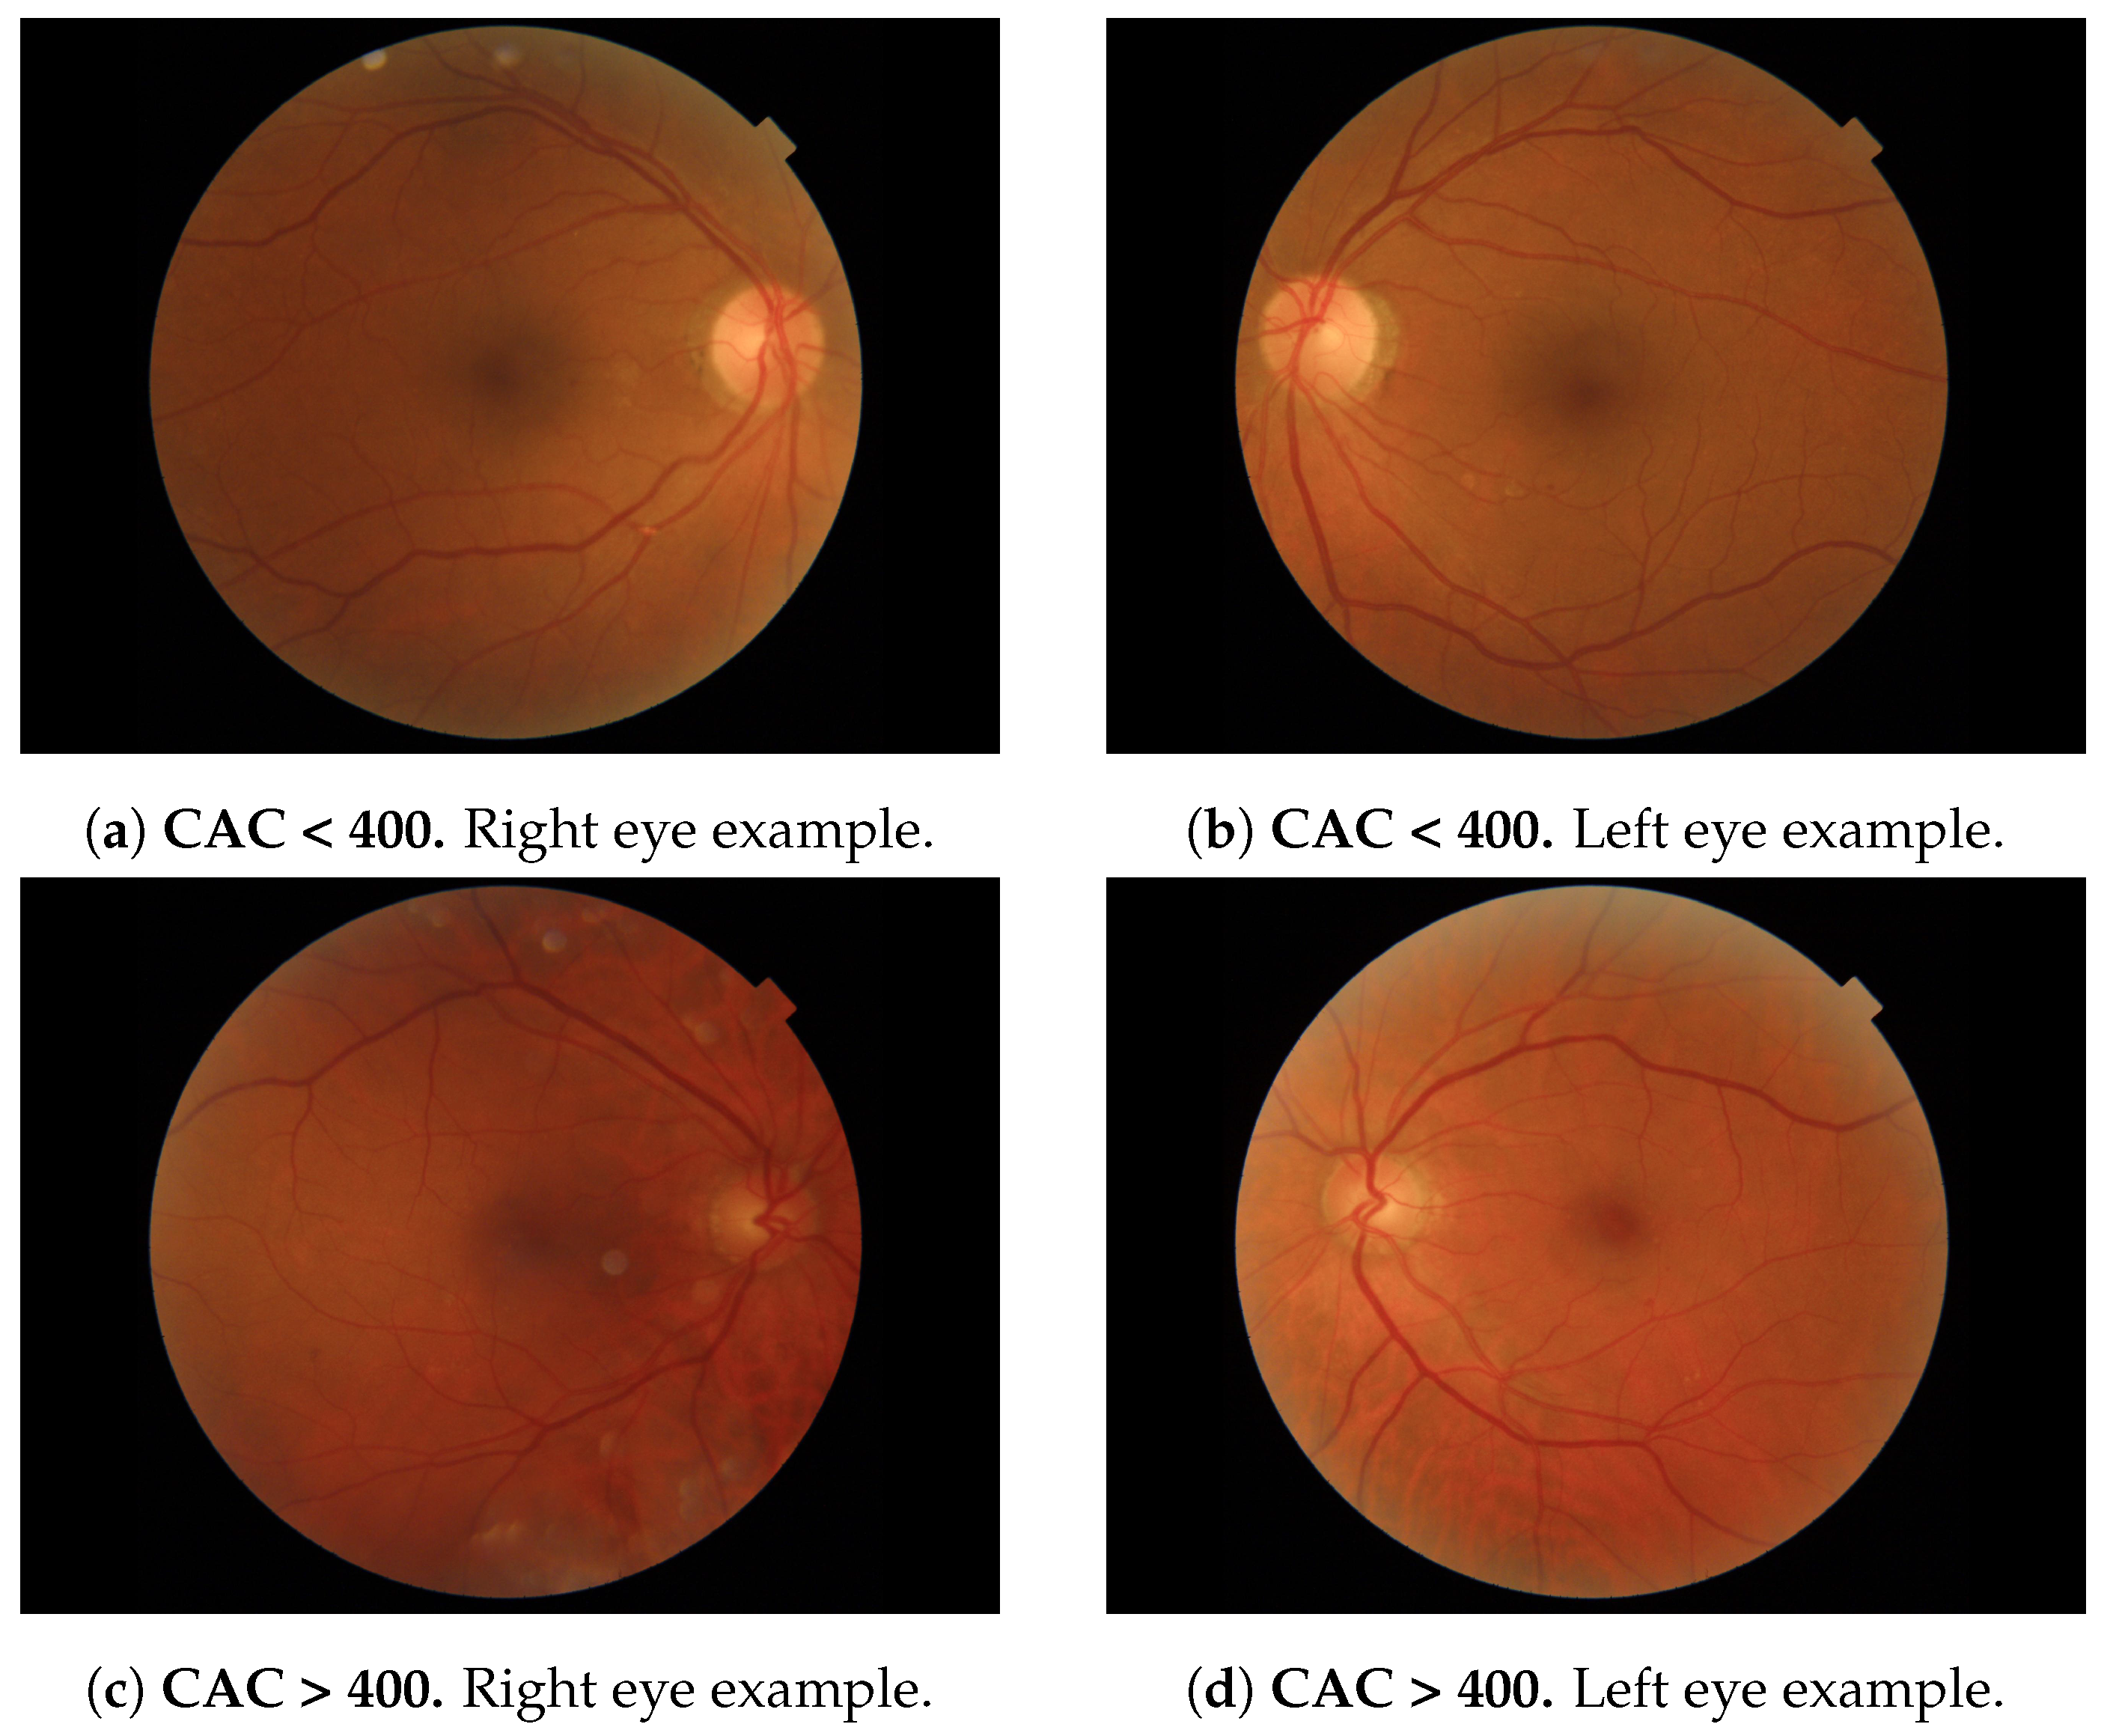
Figure 1 depicts 2 examples of each eye (one with CAC
and one with CAC > 400) extracted from the database.
Prior to the training and inference, we perform the following preprocessing procedure: first, images are color-normalized following the guidelines of the PyTorch library for transfer learning of ImageNet-based learned models. We substract the precomputed
and divide each pixel by the standard deviation
used on the ImageNet pretraining (See for more details:
https://pytorch.org/vision/stable/models.html, accessed on 18 January 2022) Therefore, RFI images are loaded to a range of [0, 1] and normalized in that way. Second, all images are rescaled to a
standardized size to fit in the CNN input model. We do not apply postprocessing step to the CNN output, and we just select as the most suitable class the one that has maximum output on the last fully connected layer.
2.4. Metrics
To quantify the model performance, we report the following statistical measures of the model predictions:
Accuracy: The global percentage of correct predictions.
Precision: The average of the retrieved items that were relevant, defined as . TP stands for true positives, and FP stands for false positives.
Recall: The number of relevant items retrieved , where FN stands for false negatives.
F1-measure: The harmonic mean of the precision and recall, defined as .
Confusion Matrix: Illustrates the distribution performance ordered as:
3. Results
3.1. Automated Positive CAC Score Prediction Using DL
In this section, we report the results of applying the DL model over fundus images to automatically predict patients presenting a CAC score > 400 and thus a potential cardiovascular risk. The included subjects were enrolled in the PRECISED study (ClinicalTrial. gov NCT02248311). The study was conducted according to the declaration of Helsinki and was approved by the local ethics committee. All subjects provided written informed consent before study entry.
We performed a 5-Fold stratified Cross Validation, where the image set is split in 5 folds, being 4 folds used for training and 1 for testing. The process is repeated 5 times until each sample has appeared in test once. We report the mean accuracy along the 5 trials and the
confidence intervals. We used VGG16 as the DL architecture (see
Section 2). Training time was 141 s using NVidia GPU 12 Gb 2080Ti 12 Gb and inference time
s on the same hardware.
Results suggest that even with a small sample size effect, the VGG16 can model better than change both classes (see
Table 3). Notice that the model does not perform equally using images from each eye. Although differences are not statistically significant, the retinas differ from the left to the right eye.
3.2. Classification Complementarity: Combination of Clinical and RFI Data
We evaluated the use of clinical data using the classifiers defined in
Section 2.2 on the same patients dataset, and following a 5-Fold Cross Validation approach.
Table 4 depicts the results for the variables age (ranging from 45 to 76 years old, mean = 65.75) and previous diagnosis of diabetic retinopathy. We also used the combination (concatenation) of both. Results show significantly better than chance accuracies in predicting the CAC > 400 label, especially when the combination of variables is used.
We further explored the predicted labels for both the image and the clinical data classifiers, and we found that individual predictions differ considerably between modalities. This suggest that an ensemble of both informational cues could take benefit from the complementarity in the predictions. Particularly, we propose two settings that target two specific applications:
Clinical Diagnosis: we follow a conservative prediction protocol that combines both modalities to reduce the False Negative ratio, i.e., the likelihood of having positive patients diagnosed as negative. This application is conceived for healthcare systems where resources availability is not constrained. After analyzing the retinography, this procedure may suggest further clinical tests (heart scan) for uncertain CAC positive predictions even though the patient probability of having is still considerable.
Large Scale Retrieval: where we give priority to improve the precision of the ensemble. The goal in this case is to build and application that may search in large databases, and may send to screen the patients with CAC > 400. As the resources are limited, only the patients with high certainty of having CAC > 400 should be further screened. Contrary to the first application, it is designed for efficient resource management and prioritize patients that urgently need further clinical screening.
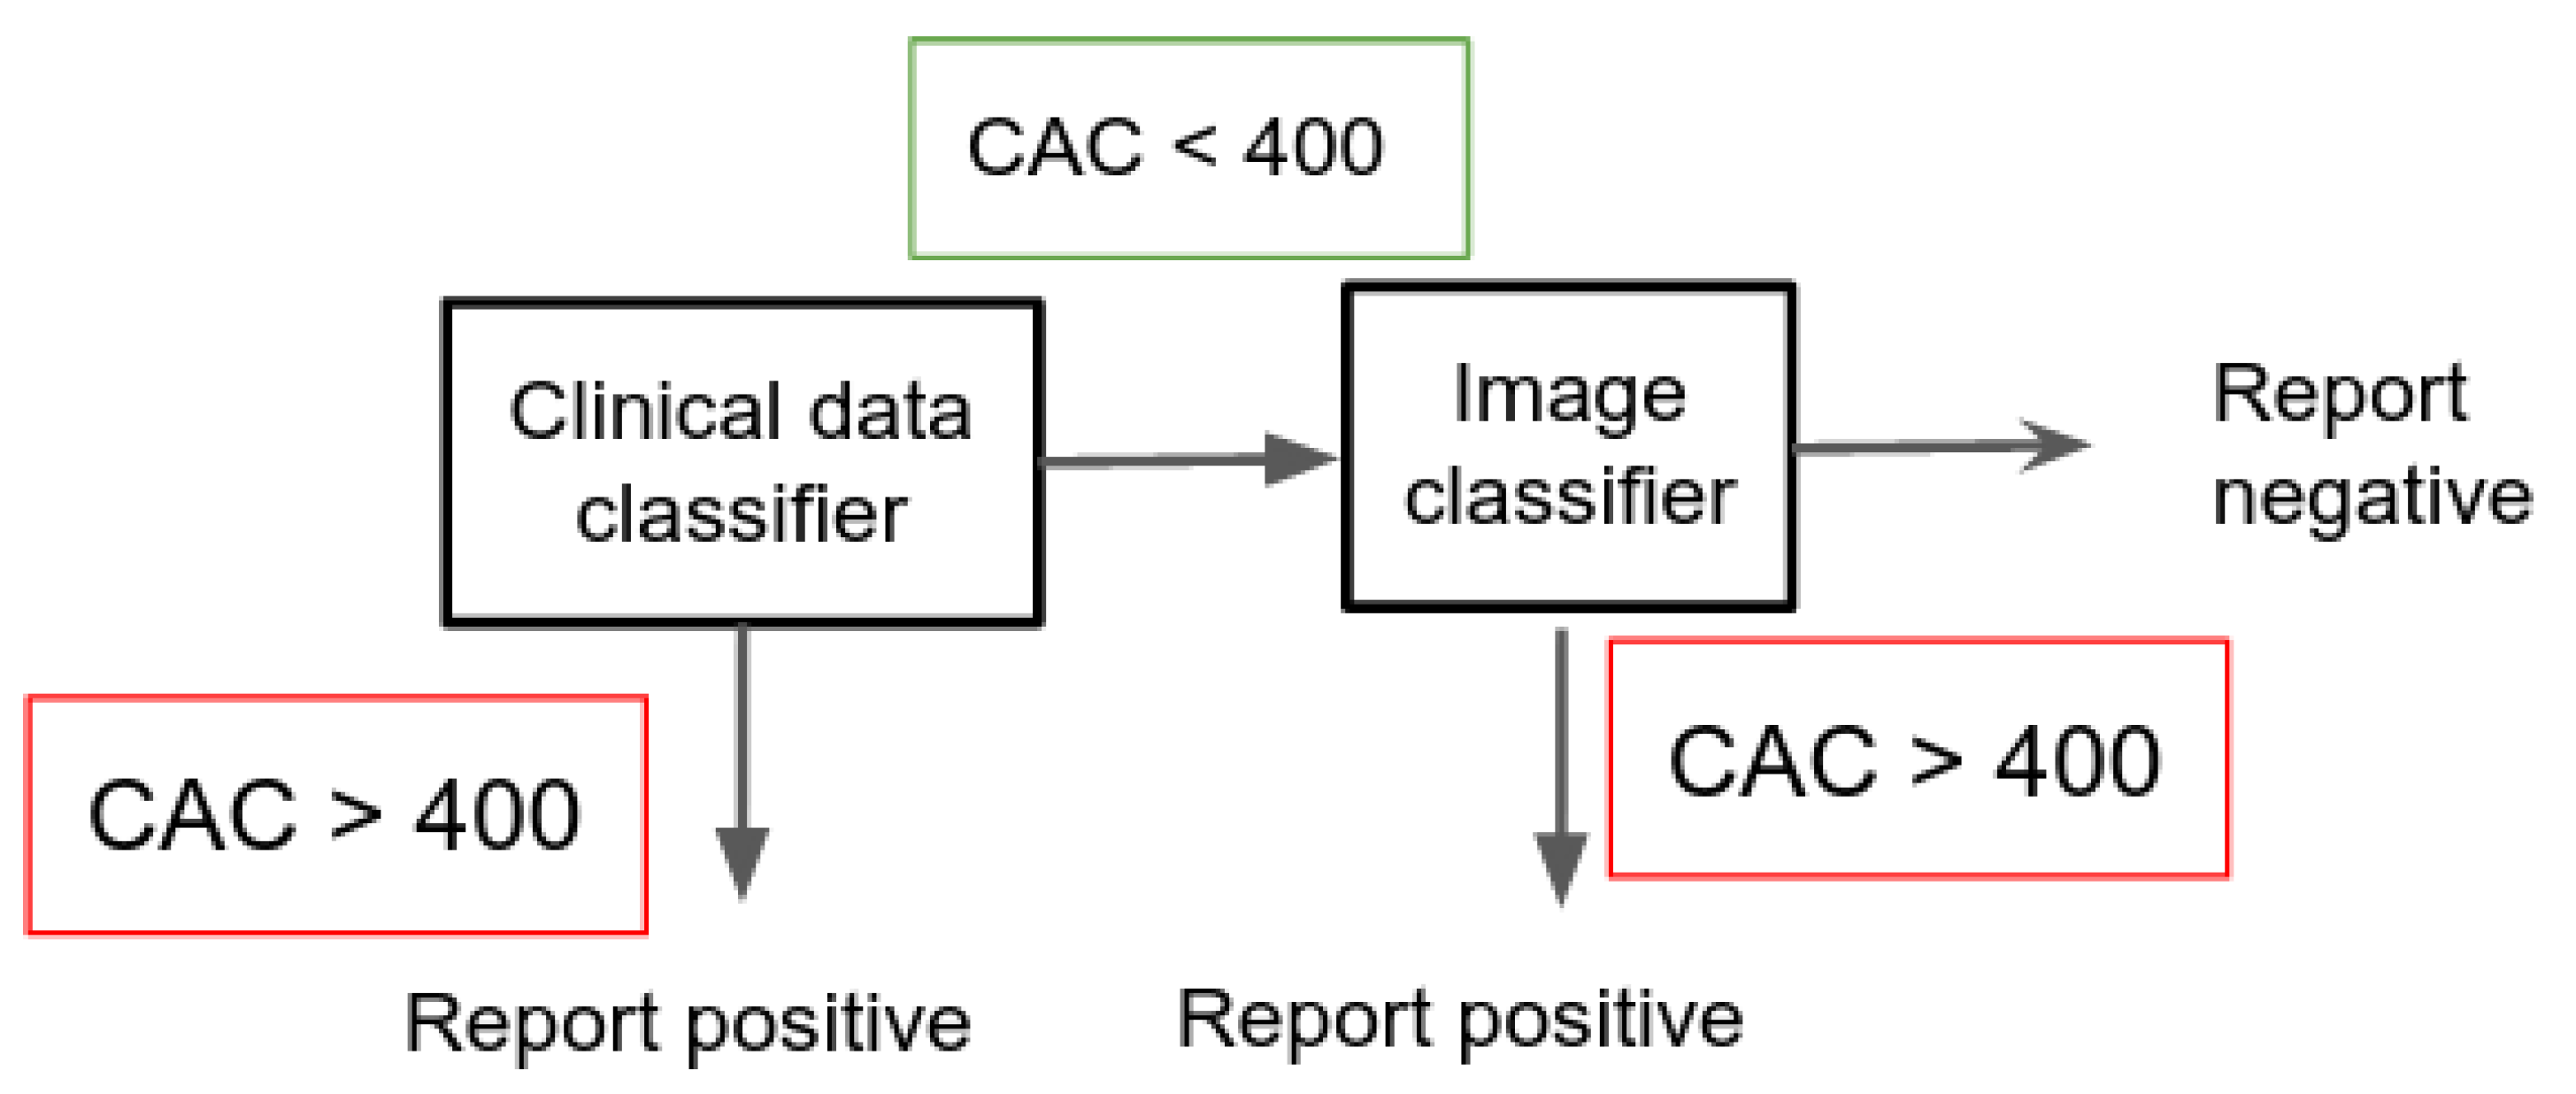
3.2.1. Application: Clinical Diagnosis
In this application, the ensemble is constructed by first running the model on the clinical data, and then for all the samples that resulted in a CAC classification run the image DL model. We only report CAC if in both cases the result was negative.
This setting, shown in
Figure 2, allows the health system to minimize the number of False Negatives (people that urgently needs a treatment but would not be spotted just using one of the methods).
Table 5 shows the results. The first row shows the accuracy, recall, precision, F1 measure and confusion matrix for the VGG16 based image prediction (CNN). For each classifier tested on clinical data, we provide its results, and the results using the combination of both the image and clinical classifiers.
There is a consistent trend in the results that show significant improvements in the F1-measure, in all cases. The number of false negatives is reduced about 50%, being the most critical case to be addressed with this setting (patients with CAC > 400 predicted as negative). Besides, we also have increased considerably the true positives (and consequently the recall) by using the image prediction, detecting more patients with CAC > 400. This improvement comes at the cost of increasing the number of false positives (FP). This scenario is less problematic (in terms of health prediction system) since FP are patients diagnosed positive that in fact are CAC < 400, thus not being in danger.
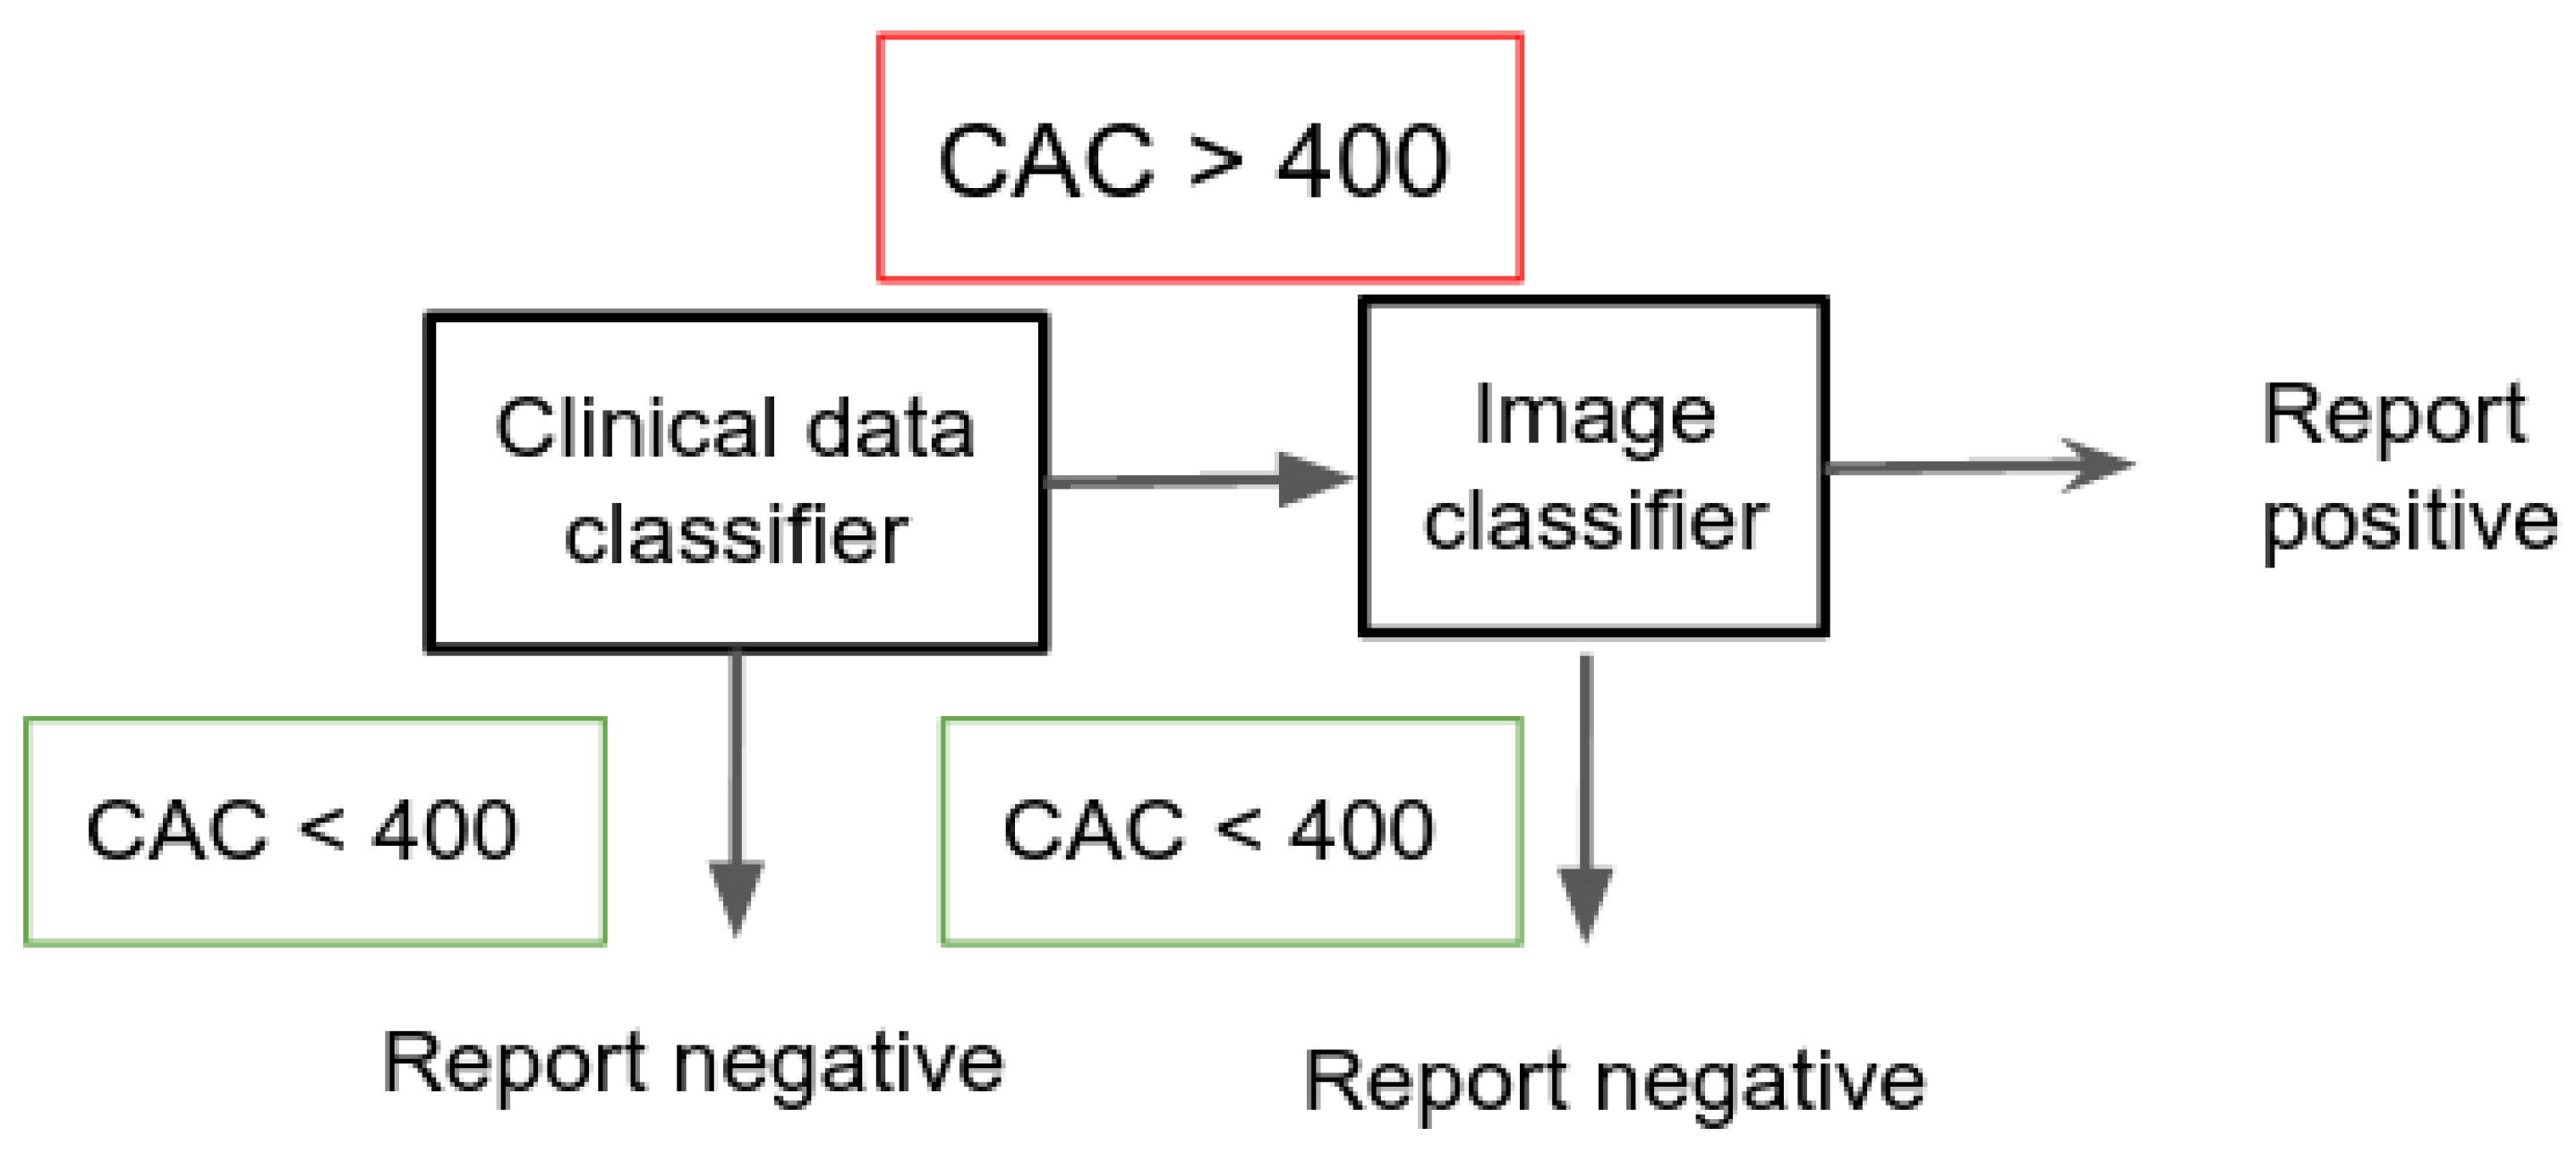
3.2.2. Application: Large Scale Retrieval
In this case, for all the positive samples resulting on the clinical model, we run the VGG16 classifier approach to double check if it is CAC > 400. The ensemble only reports a positive case if in both models the samples result in a positive detection. The model minimizes the number of false positives (saving resources by avoiding the screening of patients that could be diagnosed CAC > 400). This protocol is depicted in
Figure 3.
This protocol may find utility in large scale database retrieval, typically hundreds of thousands of patients. In this cases it will not be possible to test with CT scan all the positive patients, and the priority should be to devote the resources to the most certain ones. As can be seen in
Table 6, the experiments show a consistent reduction on the FP ratio (up to 90%), and a large improvement of the precision (91%), which shows that when the ensemble predicts a patient with CAC > 400, there is a
of chance of being correct. Notice that, globally, this restrictive setting underperforms the individual classifiers, as there is a significant increase in the false negative ratio (positive patients that where discarded).
4. Discussion
Recent research [
8] suggests that a Deep CNN (EfficientNet) provides promising accuracies when applied to RFI in predicting CV risk. The study was performed on a large scale cohort of Asian patients, mostly non-diabetic, obtaining scant correlation (0.47) between the RetiCAC CNN score and the CAC assessed by CT scan. In the present pilot study we have focused on type 2 diabetic population, thus using a more homogeneous dataset for making the training. For this reason and due to the use of VGG and ResNet DL architectures the accuracy has been significantly improved.
Results using methods over both clinical and image data show acceptable accuracies in the assessment of a high CAC score. Yet, the two established protocols showed complementary capacities in comparison to independently use both modalities. Experimental studies suggest that it is possible to tailor a specific ensemble to the particular needs of the application, improving either the precision or the recall, although there is a trade off between both performance indicators.
The protocol shows that an application defined specifically for clinical diagnosis, guarantees missing only few patients with CAC , reducing considerably the false negatives and maximizing the recall ( aprox.). However, this procedure has a significant number of false positives which will impact on resource costs but not in individual diagnosis capabilities.
A second application is conceived for image retrieval of large databases where resources for further cardiological testing are scarce. The ensemble may maximize the precision by reducing the number of false positives, but the application clearly worsens predictions at individual level. Nevertheless, it may find utility when prioritization is urgently needed, as is the case of low income countries.
5. Conclusions
This study provides significant evidences that deep learning methods could be used for evaluating cardiovascular risk by using CAC as unique biomarker. Preliminary results show promising accuracies on a small sample sized database by using classical DL architectures. On the other hand, our findings show that there are clinical variables which also correlate positively with CAC . A very simple preliminary study shows above chance accuracies, and more important, complementarity with the results obtained by image analysis. Based on that, we build two applications that optimize a precision or a recall criteria for a specific application.
This is a preliminary work that proves that there exists discriminative information in the retinal images. Further research challenges are: data acquisition and model improvements. Results can be significantly improved gathering more clinical data (increasing the number of relevant variables) or the number of images (more patients). In addition, more efforts can be put in the specialization of the DL architecture, taking advantage of higher detailed information in the retinal images (thickness, dimension, tortuosity of the vessels, etc.) or increasing the model capacity with current developments in self-supervision (to mitigate the small sample size problem) and curriculum learning (training the machine learning models in a meaningful order [
26]).
Author Contributions
Conceptualization, R.G.B., C.H., R.S. and D.M.; methodology, R.G.B., C.H., R.S. and D.M.; software, R.G.B.; validation, R.G.B. and D.M.; formal analysis, R.G.B., C.H., R.S. and D.M.; investigation, R.G.B., O.S.-S., A.P., C.H., R.S. and D.M.; resources, O.S.-S., A.P., C.H., R.S. and D.M.; data curation, O.S.-S., A.P., C.H. and R.S.; writing—original draft preparation, R.G.B. and D.M.; writing—review and editing, R.G.B., R.S., C.H. and D.M.; funding acquisition, R.S., C.H. and D.M. All authors have read and agreed to the published version of the manuscript.
Funding
This research was funded by “RTI2018-095232-B-C22” grant from the Spanish Ministry of Science, Innovation and Universities (FEDER funds).
Institutional Review Board Statement
The study was conducted according to the guidelines of the Declaration of Helsinki, and was approved by the local ethics committee (Ethical Committee for Clinical Research of the Vall d’Hebron University Hospital), with a reference number PR(AG)127/2014.
Informed Consent Statement
Informed consent was obtained from all subjects involved.
Acknowledgments
Authors acknowledge the support from the NVIDIA Hardware grant program.
Conflicts of Interest
The authors declare no conflict of interest.The funders had no role in the design of the study; in the collection, analyses, or interpretation of data; in the writing of the manuscript, or in the decision to publish the results.
Abbreviations
The following abbreviations are used in this manuscript:
| BMI | Body Mass Index |
| CAC | Coronary Artery Calcium |
| CNN | Convolutional Neural Network |
| CT | Computed Tomography |
| CVD | Cardiovascular Diseases |
| DL | Deep Learning |
| DR | Diabetic Retinopathy |
| FN | False Negative |
| FP | False Positive |
| TN | True Negative |
| TP | True Positive |
| RFI | Retinal Fundus Imaging |
References
- WHO. The Top 10 Causes of Death; WHO: Geneva, Switzerland, 2019. [Google Scholar]
- Goff, D.C., Jr.; Lloyd-Jones, D.M.; Bennett, G.; Coady, S.; D’Agostino, R.B.; Gibbons, R.; Greenland, P.; Lackland, D.T.; Levy, D.; O’Donnell, C.J.; et al. 2013 ACC/AHA guideline on the assessment of cardiovascular risk: A report of the American College of Cardiology/American Heart Association Task Force on Practice Guidelines. Circulation 2013, 129, S49–S73. [Google Scholar] [CrossRef] [PubMed] [Green Version]
- Yeboah, J.; McClelland, R.L.; Polonsky, T.S.; Burke, G.L.; Sibley, C.T.; O’Leary, D.; Carr, J.J.; Goff, D.C.; Greenland, P.; Herrington, D.M. Comparison of novel risk markers for improvement in cardiovascular risk assessment in intermediate-risk individuals. JAMA 2012, 308, 788–795. [Google Scholar] [CrossRef] [PubMed] [Green Version]
- Greenland, P.; Blaha, M.J.; Budoff, M.J.; Erbel, R.; Watson, K.E. Coronary Calcium Score and Cardiovascular Risk. J. Am. Coll. Cardiol. 2018, 72, 434–447. [Google Scholar] [CrossRef] [PubMed]
- Cheung, C.Y.L.; Ikram, M.K.; Chen, C.; Wong, T.Y. Imaging retina to study dementia and stroke. Prog. Retin. Eye Res. 2017, 57, 89–107. [Google Scholar] [CrossRef]
- Poplin, R.; Varadarajan, A.V.; Blumer, K.; Liu, Y.; McConnell, M.V.; Corrado, G.S.; Peng, L.; Webster, D.R. Prediction of cardiovascular risk factors from retinal fundus photographs via deep learning. Nat. Biomed. Eng. 2018, 2, 158–164. [Google Scholar] [CrossRef]
- Cheung, C.Y.l.; Zheng, Y.; Hsu, W.; Lee, M.L.; Lau, Q.P.; Mitchell, P.; Wang, J.J.; Klein, R.; Wong, T.Y. Retinal vascular tortuosity, blood pressure, and cardiovascular risk factors. Ophthalmology 2011, 118, 812–818. [Google Scholar] [CrossRef]
- Rim, T.H.; Lee, C.J.; Tham, Y.C.; Cheung, N.; Yu, M.; Lee, G.; Kim, Y.; Ting, D.S.; Chong, C.C.Y.; Choi, Y.S.; et al. Deep-learning-based cardiovascular risk stratification using coronary artery calcium scores predicted from retinal photographs. Lancet Digit. Health 2021, 3, e306–e316. [Google Scholar] [CrossRef]
- Cheung, C.Y.; Xu, D.; Cheng, C.Y.; Sabanayagam, C.; Tham, Y.C.; Yu, M.; Rim, T.H.; Chai, C.Y.; Gopinath, B.; Mitchell, P.; et al. A deep-learning system for the assessment of cardiovascular disease risk via the measurement of retinal-vessel calibre. Nat. Biomed. Eng. 2021, 5, 498–508. [Google Scholar] [CrossRef]
- Sabanayagam, C.; Xu, D.; Ting, D.S.W.; Nusinovici, S.; Banu, R.; Hamzah, H.; Lim, C.; Tham, Y.C.; Cheung, C.Y.; Tai, E.S.; et al. A deep learning algorithm to detect chronic kidney disease from retinal photographs in community-based populations. Lancet Digit. Health 2020, 2, e295–e302. [Google Scholar] [CrossRef]
- McGrory, S.; Cameron, J.R.; Pellegrini, E.; Warren, C.; Doubal, F.N.; Deary, I.J.; Dhillon, B.; Wardlaw, J.M.; Trucco, E.; MacGillivray, T.J. The application of retinal fundus camera imaging in dementia: A systematic review. Alzheimers Dement 2016, 6, 91–107. [Google Scholar] [CrossRef] [Green Version]
- Son, J.; Shin, J.Y.; Chun, E.J.; Jung, K.H.; Park, K.H.; Park, S.J. Predicting high coronary artery calcium score from retinal fundus images with deep learning algorithms. Transl. Vis. Sci. Technol. 2020, 9, 28. [Google Scholar] [CrossRef] [PubMed]
- Simó, R.; Bañeras, J.; Hernández, C.; Rodríguez-Palomares, J.; Valente, F.; Gutiérrez, L.; Alujas, T.G.; Ferreira, I.; Aguade-Bruix, S.; Montaner, J.; et al. Diabetic retinopathy as an independent predictor of subclinical cardiovascular disease: Baseline results of the PRECISED study. BMJ Open Diabetes Res. Care 2019, 7, e000845. [Google Scholar] [CrossRef] [PubMed] [Green Version]
- Deng, J.; Dong, W.; Socher, R.; Li, L.J.; Li, K.; Fei-Fei, L. ImageNet: A large-scale hierarchical image database. In Proceedings of the 2009 IEEE Conference on Computer Vision and Pattern Recognition, Miami, FL, USA, 20–25 June 2009; pp. 248–255. [Google Scholar] [CrossRef] [Green Version]
- Mnih, V.; Kavukcuoglu, K.; Silver, D.; Rusu, A.A.; Veness, J.; Bellemare, M.G.; Graves, A.; Riedmiller, M.; Fidjeland, A.K.; Ostrovski, G.; et al. Human-level control through deep reinforcement learning. Nature 2015, 518, 529–533. [Google Scholar] [CrossRef] [PubMed]
- Ting, D.S.W.; Cheung, C.Y.L.; Lim, G.; Tan, G.S.W.; Quang, N.D.; Gan, A.; Hamzah, H.; Garcia-Franco, R.; San Yeo, I.Y.; Lee, S.Y.; et al. Development and validation of a deep learning system for diabetic retinopathy and related eye diseases using retinal images from multiethnic populations with diabetes. JAMA 2017, 318, 2211–2223. [Google Scholar] [CrossRef]
- Simonyan, K.; Zisserman, A. Very deep convolutional networks for large-scale image recognition. arXiv 2014, arXiv:1409.1556. [Google Scholar]
- He, K.; Zhang, X.; Ren, S.; Sun, J. Deep residual learning for image recognition. arXiv 2015, arXiv:1512.03385. [Google Scholar]
- Ho, N.; Kim, Y.C. Evaluation of transfer learning in deep convolutional neural network models for cardiac short axis slice classification. Sci. Rep. 2021, 11, 1839. [Google Scholar] [CrossRef]
- Paszke, A.; Gross, S.; Massa, F.; Lerer, A.; Bradbury, J.; Chanan, G.; Killeen, T.; Lin, Z.; Gimelshein, N.; Antiga, L.; et al. Pytorch: An imperative style, high-performance deep learning library. Adv. Neural Inf. Process. Syst. 2019, 32, 8026–8037. [Google Scholar]
- Cunningham, P.; Delany, S. k-Nearest neighbour classifiers. ACM Comput. Surv. 2007, 54, 1–25. [Google Scholar] [CrossRef]
- Cortes, C.; Vapnik, V. Support-vector networks. Mach. Learn. 1995, 20, 273–297. [Google Scholar] [CrossRef]
- Praagman, J. Classification and Regression Trees; Breiman, L., Friedman, J.H., Olshen, R.A., Stone, C.J., Eds.; The Wadsworth Statistics/Probability Series; Belmont: Wadsworth, OH, USA, 1985; 358p. [Google Scholar]
- Breiman, L. Random forests. Mach. Learn. 2001, 45, 5–32. [Google Scholar] [CrossRef] [Green Version]
- Freund, Y.; Schapire, R.; Abe, N. A short introduction to boosting. J. Jpn. Soc. Artif. Intell. 1999, 14, 1612. [Google Scholar]
- Kim, M.; Yun, J.; Cho, Y.; Shin, K.; Jang, R.; Bae, H.j.; Kim, N. Deep learning in medical imaging. Neurospine 2019, 16, 657. [Google Scholar] [CrossRef] [PubMed]
| Publisher’s Note: MDPI stays neutral with regard to jurisdictional claims in published maps and institutional affiliations. |
© 2022 by the authors. Licensee MDPI, Basel, Switzerland. This article is an open access article distributed under the terms and conditions of the Creative Commons Attribution (CC BY) license (https://creativecommons.org/licenses/by/4.0/).


 ,
, 


