Article

The Improvement of Reserve Polysaccharide Glycogen Level and Other Quality Parameters of S. cerevisiae Brewing Dry Yeasts by Their Rehydration in Water, Treated with Low-Temperature, Low-Pressure Glow Plasma (LPGP)

1
Department of Fermentation Technology and Microbiology, Faculty of Food Technology, University of Agriculture, Balicka Street 122, 30-149 Kraków, Poland
2
Department of Chemistry, Faculty of Food Technology, University of Agriculture, Balicka Street 122, 30-149 Kraków, Poland
*
Authors to whom correspondence should be addressed.
Appl. Sci. 2022, 12(6), 2909; https://doi.org/10.3390/app12062909
Submission received: 7 February 2022 / Revised: 2 March 2022 / Accepted: 9 March 2022 / Published: 11 March 2022
(This article belongs to the Special Issue Polysaccharides: From Extraction to Applications)

Abstract

:
The increasing popularity of active dry yeast arises from its properties, such as ease of storage, and simplicity of preparation and dosing. Herein, we elaborate on the effect of plasma-treated water (PTW) under air atmosphere (PTWAir) and nitrogen (PTWN) on the improvement of the reserve polysaccharide glycogen level and other quality parameters of S. cerevisiae brewing dry yeast in comparison with the non plasma-treated water (CW). For this purpose, strains of top-fermenting (S. cerevisiae T58 (poor quality), S33 (poor quality)) and bottom-fermenting (S. pastorianus W30/70 (poor quality)) yeast stored one year after opening and S. cerevisiae US-05 (fresh strain) were selected to examine the influence of PTWs toward the quality parameters of yeast biomass after the rehydration and fermentation process. The obtained results showed that in the case of poor quality yeast strains, PTWAir increased glycogen content after the rehydration and fermentation process, which was a favorable trend. A similar increase was observed for the trehalose content. Results showed that PTWN significantly reduced the number of yeast cells in ale strains and the viability of all analyzed samples. The lowest viability was observed in Sc S33 strain for PTWAir (41.99%), PTWN (18.6%) and CW (22.86%). PTWAir did not contribute to reducing the analyzed parameter; in particular, the results of Sc T58 yeast strain’s viability are shown: PTWAir (58.83%), PTWN (32.28%) and CW (43.56%). The obtained results suggest that rehydration by PTWN of dry yeast with a weakened condition is not recommended for both qualitative and cost-related reasons, while PTWAir significantly contributed to the improvement of some yeast parameters after rehydration and fermentation (higher glycogen and trehalose content).

1. Introduction

In the brewing industry, the most frequently used species of yeast are Saccharomyces cerevisiae and S. pastorianus [1]. In industrial breweries, it is possible to ensure the appropriate quality of yeast biomass thanks to the laboratory facilities. In the case of smaller breweries, the number of propagation stations is constantly growing. After propagation, brewer’s yeast can be used for subsequent fermentation cycles [2]. Craft breweries that do not have propagation stations use dried yeast. Dried yeast has similar characteristics to fresh yeast in terms of aroma compound formation, fermentation rate and attenuation [3]. Yeast can be dried in several ways, including spray drying or drying with the use of a fluidized bed. However, this drying process is very stressful for the cells and many changes can take place as a result of this operation. These changes contribute to a reduction in the activity of microorganisms [4,5]. Therefore, in order to obtain yeast with high activity and viability, it is often necessary to use substances that protect these microorganisms. These substances can be divided into two groups: stabilizing agents (trehalose, mannitol and xylose) and substances reducing water activity (glycerin, maltitol and xylitol) [6]. Spray drying, on the other hand, requires a large amount of energy of at least 2500 Jg−1 for water evaporation to occur [7,8]. During drying, water is quickly drained through the cell membrane, causing the cytoskeleton to collapse. This condition can adversely affect the physiology of yeast cells by altering the structure and function of the vacuoles, and the integrity and functionality of the membranes of nuclei and cells [9]. Spray drying is advantageous in producing a free flowing material with a controlled particle size range at a rapid drying rate [10]. It has been shown that the rehydration process applied to dried yeast has a significant impact on the viability of yeast cells, which, in turn, has a direct impact on the quality of the final fermentation [8].
The entire process is aimed at restoring the properties of dry yeast comparable to that before treatment via contact with water. Previous reports have examined the influence of water quality on rehydration. Poirier et al. [11] studied the effect of rehydration kinetics and temperature on yeast cell viability. Studies have shown that water activity in the range of 0.117–0.455 should be slowly exceeded during rehydration to maintain cell viability [11]. Jenkins et al. [8] monitored the effect of rehydration medium temperature on the physicochemical parameters of lager yeast. Laroche and Gervais [12] demonstrated that yeast cell survival during rehydration depends, among other things, on the rehydration medium. However, the subject of using plasma-treated water (PTW) for rehydration has not yet been described in the literature.
The presented work is an ongoing continuation of research on the possibility of using PTW in the brewing industry [13]. The study employed a device built in 2009 to produce PTW under air atmosphere and nitrogen (N2). The device is based on the production of low-temperature, low-pressure glow plasma (LPGP) [14], which is used for the first time for water treatment. The application of LPGP to produce PTW is a promising method that requires further development. The technology is mainly supported by data obtained in plant breeding, animal husbandry, cosmetology, medicine and food technology. Białopiotrowicz et al. [15] treated water with LPGP in the presence of air (PTWAir), proving that the structure of the obtained water depends on the time of exposure (5, 15, 30, 45, 60 and 90 min) to plasma that changes nonlinearly. Other studies have described that PTWAir (plasma treated water under air atmosphere) stimulates various microorganisms [16], and promotes plant growth [17] and the healthy breeding of selected animals [18,19,20]. However, LPGP-treated water causes a more abundant reproduction of fungi and nematodes used as entomopathogenic pesticides compared to control samples (water without plasma treatment) [21]. When plasma is exposed to water, active forms of oxygen (ROS) or nitrogen (RNS) are formed depending on the gas that is present in the environment. These active and reactive components are believed to have antimicrobial activity. The amount of ROS and RNS species formed depends on the duration of the plasma operation [22]. Their small amount may affect cells by activating the mechanisms of oxidative stress in them. Oxidative stress is a measure of the resistance of cells to various stress factors, including osmotic stress, ethanol, temperature and others. Exposing cells to this type of action can stimulate their growth and significantly improve their functioning in an environment where stress factors are present. During the production of beer, these are mainly the sugar content, the increasing concentration of ethyl alcohol, the presence of carbon dioxide, high pressure and the depleting amount of nutrients [23]. Brewer’s yeast should be more resistant to stress factors because, unlike other fermentation processes, they are used in several subsequent fermentation cycles. The presented results of research on the use of PTW to improve the quality of yeast are little known so far, but the available information allows for the advancement of new research theses and forms the basis for further work in this field. There are studies carried out related to the treatment of damaged cells of Saccharomyces cerevisiae yeast with plasma. Two methods of treating damaged cells were compared: direct, in which cells were exposed to plasma discharge, and indirect, i.e., treatment of cells incubated in a liquid medium that was subjected to plasma-treated water (PTW) [24].
Herein, we examine the suitability of PTWAir and PTWN for the rehydration of top-fermentation yeast (Saccharomyces cerevisiae SafBrew T58, US-05, S33) and bottom-fermentation yeast (Saccharomyces pastorianus SafLager W30/70). Yeast under different conditions (fresh and poor quality) were examined to determine how PTWs can influence their physicochemical properties compared to the control sample (water without plasma treatment—CW). Preliminary studies have shown the greatest effect of rehydration in the presence of PTWAir and PTWN on the quality of dried yeast with weakened viability; therefore, this type of biological material was used in the presented research.

2. Materials and Methods

2.1. Materials

The biological materials for the analysis were strains described in Table 1.
For plasma treatment under air or nitrogen atmosphere, commercially available Żywiec Zdrój spring water was used (Mg2+—5.37 mg/L, Ca2+—36.39 mg/L, Na+—8.29 mg/L). Water was used for analyses immediately after plasma treatment.

2.2. Methods

The device presented and described in the previous scientific article [13] was used for the production of plasma-treated water in the research.

2.2.1. Plasma-Treated Water under Air Atmosphere (PTWAir)

A total of 1500 mL of spring water (Żywiec Zdrój, Danone, Cięcina, Poland) in 2000 mL open Pyrex glass bottles was placed in a reactor chamber close to a lamp generating plasma for 30 min. The lamp generated plasma at 38 °C under 5 × 10⁻³ mbar, 600 V, 50 mA and 10 kHz frequency. The chamber with the water sample remained at normal pressure. The water produced was stored at ambient temperature in 2000 mL closed Teflon containers [13].

2.2.2. Plasma-Treated Water under Nitrogen (PTWN)

A total of 1500 mL of spring water (Żywiec Zdrój, Danone, Cięcina, Poland) was placed in 2000 mL open Pyrex glass bottles and N2 was bubbled through the water for 15 min. N2 was deoxygenated by passing it through an absorber filled with alkaline solution of resorcinol. After placing the bottles in the reactor, its chamber and free space over the liquid were additionally filled with deoxygenated N2. Treatment conditions with LPGP and storage of the product are described in plasma-treated water under air atmosphere [13].

2.2.3. Rehydration of Dry Yeast

Brewing yeast (1 g) was suspended in 10 mL of water (PTWAir, PTWN, or CW) at 25 °C. The yeast was left to rest for 15 min, and after this time, gently stirred for 30 min as recommended by the manufacturer.

2.2.4. Determination of Yeast Cell Count Using Thoma Chamber

Rehydrated yeast suspension was diluted 1:100 with distilled water. The prepared yeast suspension was vortexed for 15 s and quickly pipetted into the Thoma chamber. The average number of cells in 40 small squares (approx. 700 cells) were counted and their number in 1 mL of the examined suspension was determined according to the formula
N = aśr × r × 4 × 10⁶
aśr—the average number of cells in one small square,
r—dilution of the test sample
4 × 10⁶—the conversion factor of the volume of a small square to 1 mL.

2.2.5. Determination of Yeast Viability

The viability of yeast was determined according to the EBC method [3.2.1.1]. Yeast suspension after rehydration with PTWAir, PTWN and CW was applied to the microscope slide, and a drop of methylene blue solution was added. Subsequently, the sample was placed under a coverslip and observed under the microscope in several fields of view. Dead cells (stained blue) and the number of total cells were counted. The number of dead cells was given as a percentage (%).

2.2.6. Determination of Yeast Acidity

pH of the obtained yeast suspensions after rehydration with PTWAir, PTWN and CW was measured using a pH meter (Mettler Toledo FiveGO F2). After pH measurement, yeast acidity was determined by potentiometric titration using 0.1 M NaOH solution. The results were given in cm3 per 100 g of yeast.

2.2.7. Determination of Maltolytic and Saccharolytic Activity (Indirect Method)

Yeast suspension after rehydration with PTWAir, PTWN and CW was placed into 100 mL conical flasks (5 mL). The resulting suspension was mixed with 10% maltose or saccharose solution (10 mL) preheated to 35 °C. The flask was closed using a CO2 evacuation tube and weighed using an analytical balance (RADWAG AS 110.R2). All samples were placed in incubator (35 °C) for 12 h; after this time the samples were weighed, and then the release time of 10 mL of CO2 was measured.
The measure of maltolytic/saccharolytic activity is the amount of mL of CO2 released during fermentation of 10% maltose/saccharose solution by 0.1 g dry mass of yeast over 12 h.

2.2.8. Determination of Yeast Flocculation

Each sample of rehydrated yeast (10 mL) was placed into two 15 mL centrifuge test tubes. One was designated as test tube A and the other as B. Test tube A was centrifuged at 4000 rpm for 5 min. Subsequently, the supernatant was poured off and discarded. The pellet was suspended in water (9.9 mL) and 0.1 mL of 0.5 M EDTA (ethylenediaminetetraacetic acid). This solution was vortexed for 15 s until the suspension became homogeneous. One mL of solution was dissolved in water (9 mL) and the absorbance was measured in the spectrophotometer (Beckman DU-650, East Lyme, CT, USA) at 600 nm wavelength using water as a blank solution.
Test tube B was centrifuged at 4000 rpm for 5 min. Subsequently, the supernatant was poured off and discarded. The pellet was suspended in 10 mL of washing solution (0.51 g calcium sulfate (CaSO4) dissolved in 1 L of distilled water) and vortexed for 15 s, then centrifuged at 4000 rpm for 5 min. The supernatant was decanted and the pellet was dissolved in 10 mL of a buffered solution (0.51 g calcium sulfate (CaSO4), 6.9 g sodium acetate (CH3COONa) and 4.05 g acetic acid (CH3COOH) dissolved in 1 L of distilled water). The pH of the solution was adjusted to 4.5. Then, the mixture was vortexed for a further 15 s until suspension became homogeneous. The suspension was slowly flipped five times for 15 s and allowed to stand upright for exactly 6 min. While keeping the sediment intact, 1 mL of the top layer was pipetted off into another test tube containing water (9 mL). The solution was vortexed and the absorbance recorded at 600 nm wavelength [25].

2.2.9. Determination of Trehalose Content

A suspension of rehydrated yeast biomass was prepared using the appropriate waters: PTWAir, PTWN and CW (1 g yeast in 80 mL water); 2 mL of the prepared solutions were taken and washed twice in 3 mL of ice water, and then centrifuged (3000 rpm, 10 min, 20 °C). The washed biomass was extracted by magnetic stirring with 4 mL of 0.5 M trichloroacetic acid solution 3 times for 20 min. Washed samples were centrifuged, extracted and the separated supernatant (approx. 12 mL in total) was refilled up to 50 mL with distilled water. From the above solution, 2 mL was taken and anthrone reagent (4 mL) was added. Obtained solution was stirred vigorously and heated at 90 °C for 14 min, and then cooled. The absorbance was measured at 620 nm wavelength. Trehalose content was extrapolated from the calibration curve of glucose solutions at fixed percentage concentration: 0.001%, 0.002%, 0.003%, 0.004% and 0.005%. The results were converted into trehalose content in 100 g dry mase of yeast.

2.3. Determination of Glycogen Content

The method for determining glycogen content with modifications [26] was used. The yeast sample (2 mL) was washed 3 times with distilled water (3 mL). Subsequently, the yeast suspension was centrifuged at 4000 rpm for 5 min. The samples of yeast were suspended in 1 mL of 0.25 M Na2CO3 and incubated for 20 min at 95 °C. After this time, the samples were cooled and centrifuged (4000 rpm for 5 min). Samples were suspended in 1 mL of 0.25 M Na2CO3 and incubated for 40 min at 95 °C. After cooling to 20 °C, 30 μL of the suspension was mixed with 15 μL of 1 N acetic acid and used for the assay. Glycogen was broken down with alpha-amyloglucosidase solution (75 μL), containing alpha-amyloglucosidase (1.2 mg) in 100 mL buffer (80 mM sodium acetate, pH 4.7). All working samples and standard samples (0.001%, 0.002%, 0.003%, 0.004% and 0.005% glucose solutions) were incubated at 37 °C for 2 h. After centrifugation, the supernatant (30 μL) was placed in a test tube and anthrone reagent (600 μL) was added, the solutions were stirred vigorously and heated at 90 °C for 14 min, then cooled to 20 °C. Absorbance was recorded at 505 nm wavelength. The glucose standards with a fixed percentage concentration of 0.001%, 0.002%, 0.003%, 0.004% and 0.005%, were measured in the same way as working samples and were used for preparation of calibration curve.

2.3.1. Preparation of Samples for Observation with Scanning Electron Microscopy

Yeast suspensions after rehydration with PTWAir, PTWN and CW were conducted in Eppendorf tubes (capacity of 1.5 mL), pre-washed with 0.1 M phosphate buffer and allowed to stand with 3% glutaraldehyde for 24 h at room temperature. Then, the sediments were again washed with 0.1 M phosphate buffer and allowed to stand with 2% OsO4 for 4 h, washed with 0.1 M phosphate buffer, and dehydrated in an aqueous-alcoholic series (50%, 60%, 70%, 80%, 90%, 96%, and 100% for 10 min treatment and centrifugation, 2075× g, 3 min) and acetone (15 min). The dried specimens were applied to a graphite sticker, placed on an aluminum table, sputtered with gold (65 s) and observed using a scanning electron microscope (Hitachi VP-SEM S-3400N, Tokyo, Japan, accelerating voltage 25 kV, SE detector).

2.3.2. Determination of Calcium, Magnesium and Zinc Ions by Atomic Absorption Spectrometry (AAS)

Before metal ion analysis, yeast suspensions after rehydration with PTWAir, PTWN and CW were mineralized to completely break down the organic matter present. The mineralization vessels were filled with 1 mL of sample and 3 mL of concentrated nitric acid. The prepared samples were wet-mineralized in a Mars Xpress microwave oven (max. temp. 170 °C, 40 min). Then, the contents of the mineralization vessels were transferred quantitatively into test tubes and refilled with deionized water up to 14 mL.
Magnesium, calcium and zinc ions were analyzed with VARIAN 20FS spectrometer based on atomic absorption spectrometry with flame atomization (air/acetylene). The instrument used an SPIS-20 automatic sample proportioning system. The absorbance of Mg2+ was determined at 202.6 nm, Ca2+ at 422.7 nm and Zn2+ at 213.9 nm.

2.3.3. Fermentation Trials

Prepared hopped wort (original gravity 11.9°P, 26 IBU) were inoculated with yeast Sc (US-05, T58, S33) yeast cell suspensions to obtain 1 × 10⁶ cells/mL and Sp W30/70 2 × 10⁶ cells/mL. The number of cells in 1 mL of suspension was evaluated using the Thoma chamber (in triplicate). All samples (300 mL) were fermented in rubber-stoppered Erlenmeyer flasks with fermentation tubes at 20 °C for 7 days in the case of ale yeast, and 10 °C for 14 days in the case of lager yeast (Q-CELL 240 thermostatic chamber, Wilkowice, Poland).
After fermentation, yeast suspension was separated from the beer by centrifugation (centrifuge MPW-365, Wilkowice, Poland), and viability, content of trehalose and glycogen were analyzed.

2.4. Statistical Analyses

The results are presented as the mean of three or four independent replicate experiments. The data were analyzed using a one-way analysis of variance (ANOVA). The significance in the difference for each parameter was analyzed separately using Tukey’s post hoc test, principal component analysis PCA test (Statistica v.10, StatSoft Inc., Krakow, Poland) and heat map test (MS Excel)

3. Results and Discussion

Table 2 and Table 3 show the quality parameters of brewing yeast (Saccharomyces cerevisiae (Sc) and Saccharomyces pastorianus (Sp)) rehydrated with different waters (PTWAir, PTWN, CW).

3.1. Number of Yeast

Analysis of the yeast cell count is extremely important as it allows planning of the process of fermentation for individual strains of brewing yeast. The number of cells suspended in the wort during both primary and secondary fermentation is a key factor influencing the rate of fermentation, beer flavor, maturation and filtration [3]. The research shows that the obtained results for the number of yeast cells differ between analyzed samples. The effect of water applied for rehydration depended on the type of strain used in rehydration. In the case of rehydrated samples in the presence of PTWN, a significantly lower number was observed in the yeast strain Sc T58 (poor quality) compared to CW. In lager yeast Sp W30/70 (poor quality), rehydration with PTWAir led to a significant reduction in yeast cell counts compared to other experimental variants. This may indicate that lager yeast is less resistant to the drying process, and after rehydration it does not have similar parameters to ale yeast. Plasma treatment water in this case, did not improve this parameter either.

3.2. Viability

Laroche and Gervais [12] reported that the survival of yeast during rehydration depends on osmotic pressure, yeast cell temperature and rehydration medium. In the presented studies, the analyzed yeast strains differed significantly in the viability of yeast cells after rehydration. Studies by other scientists have shown that yeast cell viability after rehydration can range from 60–85% [27]. The control sample of the fresh strain of Sc US-05 rehydrated with CW showed the highest viability (76.6%). In the case of fresh culture, no significant differences were observed in the improvement of viability after using PTW for rehydration. This proves that fresh yeast does not require the use of factors improving its quality. In the case of rehydration in the presence of PTWN, a significant reduction in viability was observed in this strain. The lowest viability for yeast samples rehydrated with CW was observed for Sc S33 strain (22.8%). The yeast viability after rehydration in the presence of PTWN differed significantly from control samples (CW); after 45 min of rehydration in PTWN medium, a significant decrease in viability was observed. Sc S33 strain was characterized by the lowest viability (18.6%), which, according to the literature, was not enough for efficient fermentation [28]. Notably, Sc T58 and S33 yeast strains rehydrated with PTWAir were characterized by improved viability in comparison to control samples. The results showed that ale yeast strains (T58, US-05) after rehydration in PTWs were similar to the results obtained by Jenkins et al. [8]. Somani et al. [26] obtained a 98% viability result for the lager strain Sp W30/70, which was much higher than those results obtained in our studies due to the used dry lager yeast being kept refrigerated for a longer time, and even the application of PTWs did not improve this parameter. In this case, both rehydration in the presence of PTWAir and PTWN contributed to a significant reduction in the viability of lager yeast compared to the control sample. We also checked the viability of the analyzed rehydrated cultures after the fermentation process (Table 3). The viability of the yeast biomass after the end of fermentation depended on the used yeast strain and used rehydration medium; however, the same trends were found as those observed for the rehydrated yeast. Between individual control samples (CW), the fresh quality yeast strain of Sc US-05 (84.5%) had the highest viability, and the poor quality yeast strains of Sc T58 (70.1%) and Sc S33 (68.8%) had the lowest viability. In the case of PTWAir samples, the Sc US-05 strain had the highest viability after fermentation, and the Sc S33 strain the lowest. In each yeast strain, PTWN significantly contributed to the reduction in viability compared to the control samples (CW). The obtained results may be caused by active forms of nitrogen that were created during the plasma-treated water process [22], which negatively influenced the ability of cells to reproduce during the entire fermentation process. On the other hand, PTWAir did not change the viability of cells in the given strains as compared to the control samples (CW). In the research conducted by Smart and Whisker [29], the viability of yeast ale after the fermentation process was completed was higher than 90%; similar results for lager yeast were obtained by Nagodawithana and Streinkraus [30]. For the results presented in the article, the most similar result was obtained for the fresh quality yeast strain of Sc US-05 for the samples after rehydration in the presence of PTWAir (83.3%) and CW (84.5%).

3.3. Floccualtion

Flocculation is a very important ability of brewer’s yeast [31], which can be defined as asexual cell aggregation that is reversible and calcium-dependent. The process creates flocs that contain a large number of cells that quickly settle to the bottom of the liquid growth medium [32]. The brewing industry often uses beer yeast flocculation as a simple and cost-effective way to separate yeast cells from fermentation products [33]. The results of the flocculation of the four strains of brewing yeast are presented in Table 2. Flocculation of less than 20% indicates non-flocculating yeast. Flocculation above 85% indicates very flocculent yeast, with values from 20 to 80% being moderately flocculent strains [25]. Among the analyzed yeast, the lager yeast strain Sp W30/70 (poor quality) showed the highest flocculation (70.2%). Which is in line with the data presented in the literature that lager yeast is characterized by a greater flocculation capacity compared to the ale yeast strains [34]. A significantly lower value was observed for S. cerevisiae strains. From the obtained results it can be concluded that the strains Sp W30/70, Sc US-05 and Sc T58 are moderately flocculent strains and the Sc S33 is a non-flocculating strain. When analyzing the effect of different rehydration medium (PTWAir, PTWN, CW) on the quality parameters of yeast, significant changes were noticed in all of the described strains. In the case of the lager strain Sp W30/70, rehydration in the presence of PTWAir and PTWN significantly contributed to the reduction in flocculation of the analyzed yeasts (60.2% and 46.1%, respectively) compared to the control sample (CW). In the case of ale yeast, PTWs contributed to the change in the flocculation capacity of yeast to a different extent. For Sc S33 and Sc T58 yeast strains (poor quality) the PTWN significantly increased the yeast flocculation capacity compared to the control samples (CW) but not enough to consider this strain as very flocculent. Yeast strain Sc US-05 (fresh strain), after rehydration in the presence of PTWN, was characterized by reduced flocculation capacity. PTWAir for all of the Sc yeast strains significantly contributed to the increase in this parameter.

3.4. Acidity

The acidity of brewing yeast after rehydration in all analyzed samples ranged from 3.26 to 6.23 mL of 1M NaOH per 100 g of dry yeast mass (Table 2). Intracellular yeast acidity is an important parameter responsible for the maintenance of cellular balance and membrane transport systems [35]. This parameter can affect the efficiency of the fermentation process [36]. Yeast cells subjected to strong stress factors, such as high ethanol concentration, may be characterized by significantly higher acidity [37]. The yeast acidity depended on the analyzed strain. The lager strain Sp W30/70 among the control samples (CW) was characterized by the lowest acidity (3.52). The acidity for Sc S33, Sc US-05 and Sc T58 strains was, respectively, 4.46, 5.06 and 5.76. In this case, rehydration with different mediums significantly changed the acidity only in the case of the Sc US-05 strain. Rehydration of Sc US-05 strain in the presence of PTWN significantly increased acidity (5.06 for control sample) to 6.23, while PTWAir decreased the acidity value to 4.76.

3.5. Maltolytic and Saccharolytic Activity

For industrial yeast cultures, two parameters are important: viability and vitality. Viable cultures with low vitality will be characterized by a slow fermentation process, and may also have a respiratory defect and produce undesirable metabolites. The method of vitality determining is based on the assessment of maltolytic and saccharolytic activity, i.e., the ability to use both sugars anaerobically by fermentation. The available literature provides relatively little data regarding the influence of drying and rehydration on maltolytic and saccharolytic activities. The analysis of dry yeast activity enables evaluation of the quality of the yeast after the drying process. Maltose is the main sugar fermented by yeast in the wort, which is why maltolytic activity is very important for brewer yeast [38]. Differences in maltolytic and saccharolytic activity between the analyzed strains were found. The lager yeast strain Sp W30/70 was characterized by the highest maltolytic activity; the highest saccharolytic activity was observed for the ale Sc T58 yeast strain. Rehydration with PTWAir did not influence the maltolytic activity of yeast, while PTWN decreased this parameter. The lowest value was observed for the ale strains Sc T58 and S33. This may be due to the fact that the plasma-treated water under nitrogen (PTWN) decreased the yeast viability and, as a result, contributed to a lower consumption of sugars by the analyzed yeast strains.

3.6. Trehalose and Glycogen Concentration

Literature data show that trehalose is one of the main reserve carbohydrates in S. cerevisiae yeast cells and can constitute up to 23% or more of cell dry matter depending on growth conditions and life cycle stage [39]. Magalhães et al. [40] demonstrated that trehalose exhibits one more significant activity for yeast, is a protective agent, stabilizes proteins and cell membranes and protects against various stress conditions such as heat shock, dehydration and oxidative and ethanol stresses. Work on cell protection and improved viability by trehalose led to the use of dried yeast in brewing [41]. In the presented study, the trehalose content depended on the strain of brewing yeast and rehydration medium. Yeast strains Sc T58, Sc US-05 and Sp W30/70 were characterized by a similar level of trehalose, while a significantly higher content of trehalose was observed in the case of Sc S33 strain. As previously described, this culture had the lowest cell viability. Therefore, it can be assumed that it was influenced by the most severe stress factors. This is confirmed by the amount of trehalose accumulated, which is a measure of environmental stress factors. Significant differences were also observed depending on the water used for rehydration. For all analyzed ale strains, rehydration with plasma-treated waters (PTWs) caused a decrease in trehalose content, which may also prove that PTWs are not a stress factor for yeast cells. These results confirm that the trehalose content in yeast depends not only on yeast strain, but also on the storage conditions and rehydration medium. The trehalose content increases in yeast cells under stress conditions. Saccharomyces pastorianus yeast is more sensitive than Saccharomyces cerevisiae yeast, which is why it can react to a stress factor of lower intensity [23].
After completion of the fermentation process, the highest content of trehalose was observed for the poor quality yeast strain of Sc T58 (11.4%), and the lowest for the fresh yeast strain of Sc US-05 (4.17%). This may indicate that the fresh yeast was more resistant to stress and did not accumulate more trehalose in cells. There is ample evidence to suggest that increased stress tolerance is associated with the accumulation of trehalose. Furthermore, dried yeast also has an increased content of trehalose due to the stress during the drying process. In the case of samples fermented with yeast after rehydration, in the presence of PTWAir, the highest content of trehalose was obtained for the poor quality strain of Sp W30/70, and the lowest for the fresh strain of Sc US-05 and poor quality yeast strain of Sc S33 (Table 3). Due to rehydration in the presence of PTWN, the highest content of trehalose was observed in the fermented samples of poor quality yeast strains of Sc T58 and Sp W30/70. The fresh yeast strain of Sc US-05 had the highest content of trehalose in the samples using PTWN (8.32%), compared to the control sample (4.17%). Significant differences were observed depending on the water used for rehydration. For all analyzed ale strains, rehydration with plasma-treated waters (PTWs) caused a decrease in trehalose content, which may also prove that PTWs are not a stress factor for yeast cells.
Glycogen is the main polysaccharide stored in brewing yeast, accounting for up to 40% (w/w) of dry cell matter. The amount of glycogen depends on the yeast strain and many variables related to yeast storage and other factors [42]. The importance of glycogen reserves for survival during prolonged nutrient deficiency has been clearly demonstrated in yeast [43]. Furthermore, yeast cells that can accumulate more glycogen reserves have a growth advantage over other cells in the environment, which suggests that glycogen can contribute to overall fermentation efficiency [44]. Table 2 shows the glycogen content for all analyzed yeast strains. Statistically significant differences in the level of glycogen between the analyzed strains were found ranging from 7.37% to 18.9%. The highest level of glycogen was observed in the fresh strain Sc US-05. Low quality yeast most likely consumed some glycogen during storage, which could be due to partial rehydration. In the case of poor quality yeast strains, PTWAir increased the glycogen content, which was a favorable trend, whereas for the fresh yeast strain no effect of PTWAir on glycogen level was observed. The obtained results are most likely due to the increase in the amount of dissolved oxygen in the plasma-treated water under air atmosphere. Oxygen is essential for yeast’s aerobic metabolism, during which they accumulate, among other things, glycogen. Therefore, these results were within the range of glycogen content for Saccharomyces cerevisiae yeast [44]. In a study conducted by Bolat et al. [6], the glycogen content of dry lager yeast was 19.2%. The lager analyzed yeast strain W30/70 had lower glycogen content than those presented by Bolat et al. [6] and featured statistical differences depending on the medium. In the case of rehydration in PTWN, as in the case of other parameters, a reduction in the amount of glycogen was found, regardless of the strain and its quality.
The glycogen content in yeast cells also depends on the fermentation process [45]. Sall et al. [46], in their studies, obtained the glycogen content after fermentation at the level of 20–30%. During the fermentation process, various stress conditions (alcohol, temperature, osmotic pressure) may contribute to the increase or decrease in the glycogen content [47]. In our research after the fermentation process, the glycogen content decreased in all poor quality yeast strains (Table 3). A slight difference was observed in the fresh yeast strain. The lowest glycogen content was observed in the case of the poor quality yeast strain of Sc S33 (10.3%). This strain was characterized by the poorest quality parameters. The type of used rehydration medium contributed to obtaining different glycogen contents for individual yeast strains. In the case of the poor quality yeast strains, the samples after rehydration in the presence of PTWAir (Sc T58 and Sc S33) had a higher glycogen content than the other variants. On the other hand, the fresh strain of Sc US-05 had the highest glycogen content in the rehydrated samples in the presence of PTWN.

3.7. Cation Content in Yeast Biomass

Although literature data show that Mg2+ and Ca2+ play an important role in the biotechnological physiological properties of yeast cells [48], there is no information regarding the effect of these metal ions on the immunity of yeast to dehydration and subsequent rehydration. Therefore, we investigated whether rehydration with different rehydration media (PTWAir, PTWN, CW) could affect the quantity of selected ions in the obtained yeast biomass. Among the many cations present in yeast, magnesium, calcium and zinc are involved in the regulation of cell structure and metabolic activity during growth and fermentation [49]. The highest levels of these ions were found in fresh culture. The water used for rehydration had no effect on the amount of cations in the cells. Control samples (CW) of yeast strains Sc T58 and Sc US-05 with Ca2+ content 0.3 mg/g of dry mass and 0.35 mg/g of dry mass, respectively, were statistically different from Sc S33 and Sp W30/70 strains with Ca2+ content 0.15 mg/g of dry mass and 0.11 mg/g of dry mass, respectively. Ca2+ has been considered as an important factor affecting flocculation, during which they accumulate in yeast cells [50]. Recent brewing publications show an inverse correlation between Mg2+ and Ca2+. The capacity to dominate one of the two metals is largely dependent on their concentration levels. A high Mg–Ca ratio has the best effect on yeast physiology as well as on the fermentation processes [51]. Magnesium exerts a protective effect on the dehydration of stationary cells in the growth phase by acting as a charge stabilizer of the cell membranes. Deterioration in magnesium bioavailability may lead to unfavorable changes in the physiology of yeast cells; in particular, their ability to withstand the dehydration–rehydration process [52]. Yeast cells were characterized by relatively high concentrations of Mg2+, compared to the amounts of other divalent ions, i.e., Ca2+ and Zn2+ (Table 2). This dependence has been confirmed by numerous literature reports [49,53]. In the water used in this research (Żywiec Zdrój), the magnesium content was 5.37 mg/L (a concentration much higher than that recorded in cells), which means that the yeast absorbed only a small part of this element from the rehydration medium. Zn2+ in yeast biomass must be present for cell multiplication and an efficient fermentation process [54]. It can be concluded that the water used to rehydrate the analyzed strains did not contribute to the increase in the content of individual elements in the yeast biomass.
Table 2. Qualitative characteristics of the Saccharomyces cerevisiae (Safbrew T58, US-05, S33) and Saccharomyces pastorianus (SafLager W30/70) yeast strain after rehydration with plasma-treated water (PTWAir, PTWN) and control water (CW).
ParametersNumber of Yeast (log CFU/mL)Viability (%)Flocculation (%)Acidity (mL of 1 M NaOH per 100 g of Dry Yeast Mass)Maltolytic Activity (mL of CO2 per 0.1 g of Dry Yeast mass for 12 h)Saccharolytic Activity (mL of CO2 per 0.1 g of Dry Yeast Mass for 12 h)Trehalose (% ww)Glycogen (% ww)Mg (mg/g of Dry Yeast Mass)Zn (mg/g of Dry Yeast Mass)Ca (mg/g of Dry Yeast Mass)
Saccharomyces cerevisiae Safbrew US-05 (fresh strain)PTWAir8.16 ± 1.2572.3 ± 4.74 a32.3 ± 2.06 a4.76 ± 0.06 a24.7 ± 1.05 a37.8 ± 1.4 a2.07 ± 0.01 a18.2 ± 0.661.15 ± 0.040.55 ± 0.020.32 ± 0.03
PTWN8.05 ± 0.7349.3 ± 5.63 b20.6 ± 1.25 b6.23 ± 0.06 b20.8 ± 1.36 b30.4 ± 0.77 b4.03 ± 0.02 b18.9 ± 0.561.00 ± 0.10.40 ± 0.40.29 ± 0.05
CW8.15 ± 0.9476.6 ± 4.19 aA24.5 ± 2.00 cA5.06 ± 0.15 aA27.6 ± 1.65 aA37.2 ± 1.3 aA4.16 ± 0.01 cA18.4 ± 0.38 A1.07 ± 0.04 A0.53 ± 0.04 A0.35 ± 0.04A
Sig.Water 2ns************nsnsnsns
Saccharomyces cerevisiae Safbrew T58 (poor quality)PTWAir8.55 ± 0.89 a58.8 ± 8.02 a29.9 ± 1.74 a5.96 ± 0.1523.2 ± 1.1 a51.0 ± 1.24 a4.14 ± 0.02 a15.6 ± 0.14 a0.64 ± 0.030.07 ± 0.0060.25 ± 0.04
PTWN7.66 ± 0.29 b32.3 ± 5.6 b45.6 ± 3.79 b5.63 ± 0.2516.8 ± 0.86 b46.9 ± 1.75 b4.42 ± 0.02 b16.7 ± 0.35 b0.73 ± 0.020.05 ± 0.060.38 ± 0.05
CW8.51 ± 0.9 a43.8 ± 2.41 cB20.9 ± 7.5 Aa5.76 ± 0.25 B21.9 ± 1.78 aB53.5 ± 1.04 aB4.71 ± 0.01 cA11.4 ± 0.17 cB0.67 ± 0.03 A0.08 ± 0.003 B0.30 ± 0.03A
Sig.Water 2*******ns********nsnsns
Saccharomyces cerevisiae Safbrew S33 (poor quality)PTWAir8.00 ± 0.47 a41.9 ± 5.12 a2.73 ± 0.1 a4.83 ± 0.0624.4 ± 1.1 a28.3 ± 0.95 a6.25 ± 0.05 a12.2 ± 0.33 a0.88 ± 0.020.24 ± 0.010.17 ± 0.04
PTWN7.41 ± 0.34 b18.6 ± 3.72 b11.6 ± 0.79 b5.06 ± 0.0618.5 ± 0.86 b23.2 ± 0.96 b6.93 ± 1.18 a10.7 ± 0.59 b1.09 ± 0.080.28 ± 0.030.17 ± 0.02
CW8.39 ± 0.58 c22.8 ± 3.2 Cb1.26 ± 0.02 cB4.46 ± 0.21 C24.3 ± 1.78 aA28.3 ± 1.17 Ca8.33 ± 0.03 bB10.3 ± 0.22 bB0.97 ± 0.05 B0.24 ± 0.01 C0.15 ± 0.04 B
Sig.Water2********ns*****nsnsns
Saccharomyces pastorianus Saflager W30/70 (poor quality)PTWAir7.12 ± 0.39 a55.6 ± 8.01 a60.2 ± 0.19 a3.26 ± 0.4431.5 ± 2.85 a34.9 ± 2.23 a10.2 ± 0.05 a15.3 ± 0.03 a0.69 ± 0.030.20 ± 0.010.14 ± 0.01
PTWN8.81 ± 0.58 b46.7 ± 4.49 a46.1 ± 0.73 b3.69 ± 0.1625.5 ± 0.56 b29.0 ± 0.95 b8.23 ± 0.03 b7.37 ± 0.1 b0.68 ± 0.30.12 ± 0.090.12 ± 0.005
CW8.19 ± 0.49 b61.8 ± 3.36Db70.2 ± 0.06 cC3.52 ± 0.27D31.9 ± 1.66 cB34.7 ± 0.75 aA4.12 ± 0.02 cA14.3 ± 0.05 cC0.62 ± 0.02 A0.22 ± 0.03 C0.11 ± 0.02 B
Sig.Water 2*****ns*********nsnsns
Strain 1ns************************
−1−0.500.51
Sig.—Significance; *, ** and *** display the significance at 5%, 1% and 0.5% by least significant difference; ns: not significant. 1 Different capital letters in superscripts (A–D) in the same column were used to mark the mean values between which statistically significant differences were found depending on the yeast strain used for rehydration (CW) according to the Tukey’s range test (p < 0.05). 2 Different lowercase letters in superscripts (a–c) in the same column were used to mark the mean values on which the type of water (PTWAir, PTWN, CW) used for rehydration had a statistically significant influence according to the Tukey’s range test (p < 0.05). Color determination from lowest (0%) to highest (100%) concentration of parameters. The lowest concentration of a specific parameter in a row is in the darkest red and the highest content is in the darkest green.
Table 3. Quality parameters of yeast biomass Saccharomyces cerevisiae (T58, US-05, S33) and Saccharomyces pastorianus (W30/70) after fermentation.
ParametersViability of Biomass (%)Trehalose (% ww)Glycogen (% ww)
Saccharomyces cerevisiae Safbrew US-05 (fresh strain)PTWAir83.3 ± 1.91 a6.76 ± 1.02 a17.1 ± 0.3 a
PTWN69.7 ± 1.43 b8.32 ± 0.00 b18.7 ± 0.43 b
CW84.5 ± 3.48 aA4.17 ± 0.00 cA17.2 ± 0.15 aA
Sig.Water 2******
Saccharomyces cerevisiae Safbrew T58 (poor quality)PTWAir71.3 ± 1.24 a15.1 ± 1.00 a14.2 ± 0.05 a
PTWN50.2 ±1.78 b16.1 ± 1.01 a9.8 ± 0.24 b
CW70.1 ± 1.52 aB11.4 ± 0.65 bB11.6 ± 0.35 cB
Sig.Water 2******
Saccharomyces cerevisiae Safbrew S33 (poor quality)PTWAir65.6 ± 2.87 a6.76 ± 1.02 a13.2 ± 0.1 a
PTWN54.5 ± 6.61 b9.35 ± 1.21 b11.6 ± 0.02 b
CW68.8 ± 1.57 aB6.25 ± 0.00 aC10.3 ± 0.32 cC
Sig.Water 2****
Saccharomyces pastorianus Saflager W30/70 (poor quality)PTWAir74.3 ± 2.58 a15.6 ± 1.21 a13.4 ± 0.15 a
PTWN61.1 ± 2.18 b17.5 ± 0.59 b9.2 ± 0.01 b
CW77.5 ± 2.09 aC10.4 ± 0.00 cD15.2 ± 0.05 cD
Sig.Water 2********
Strain 1*********
−1−0.500.51
Sig.—Significance; *, ** and *** display the significance at 5%, 1% and 0.5% by least significant difference; ns: not significant. 1 Different capital letters in superscripts (A–D) in the same column were used to mark the mean values between which statistically significant differences were found depending on the yeast strain used for rehydration (CW) according to the Tukey’s range test (p < 0.05). 2 Different lowercase letters in superscripts (a–c) in the same column were used to mark the mean values on which the type of water (PTWAir, PTWN, CW) used for rehydration had a statistically significant influence according to the Tukey’s range test (p < 0.05). Color determination from lowest (0%) to highest (100%) concentration of parameters. The lowest concentration of a specific parameter in a row is in the darkest red and the highest content is in the darkest green.

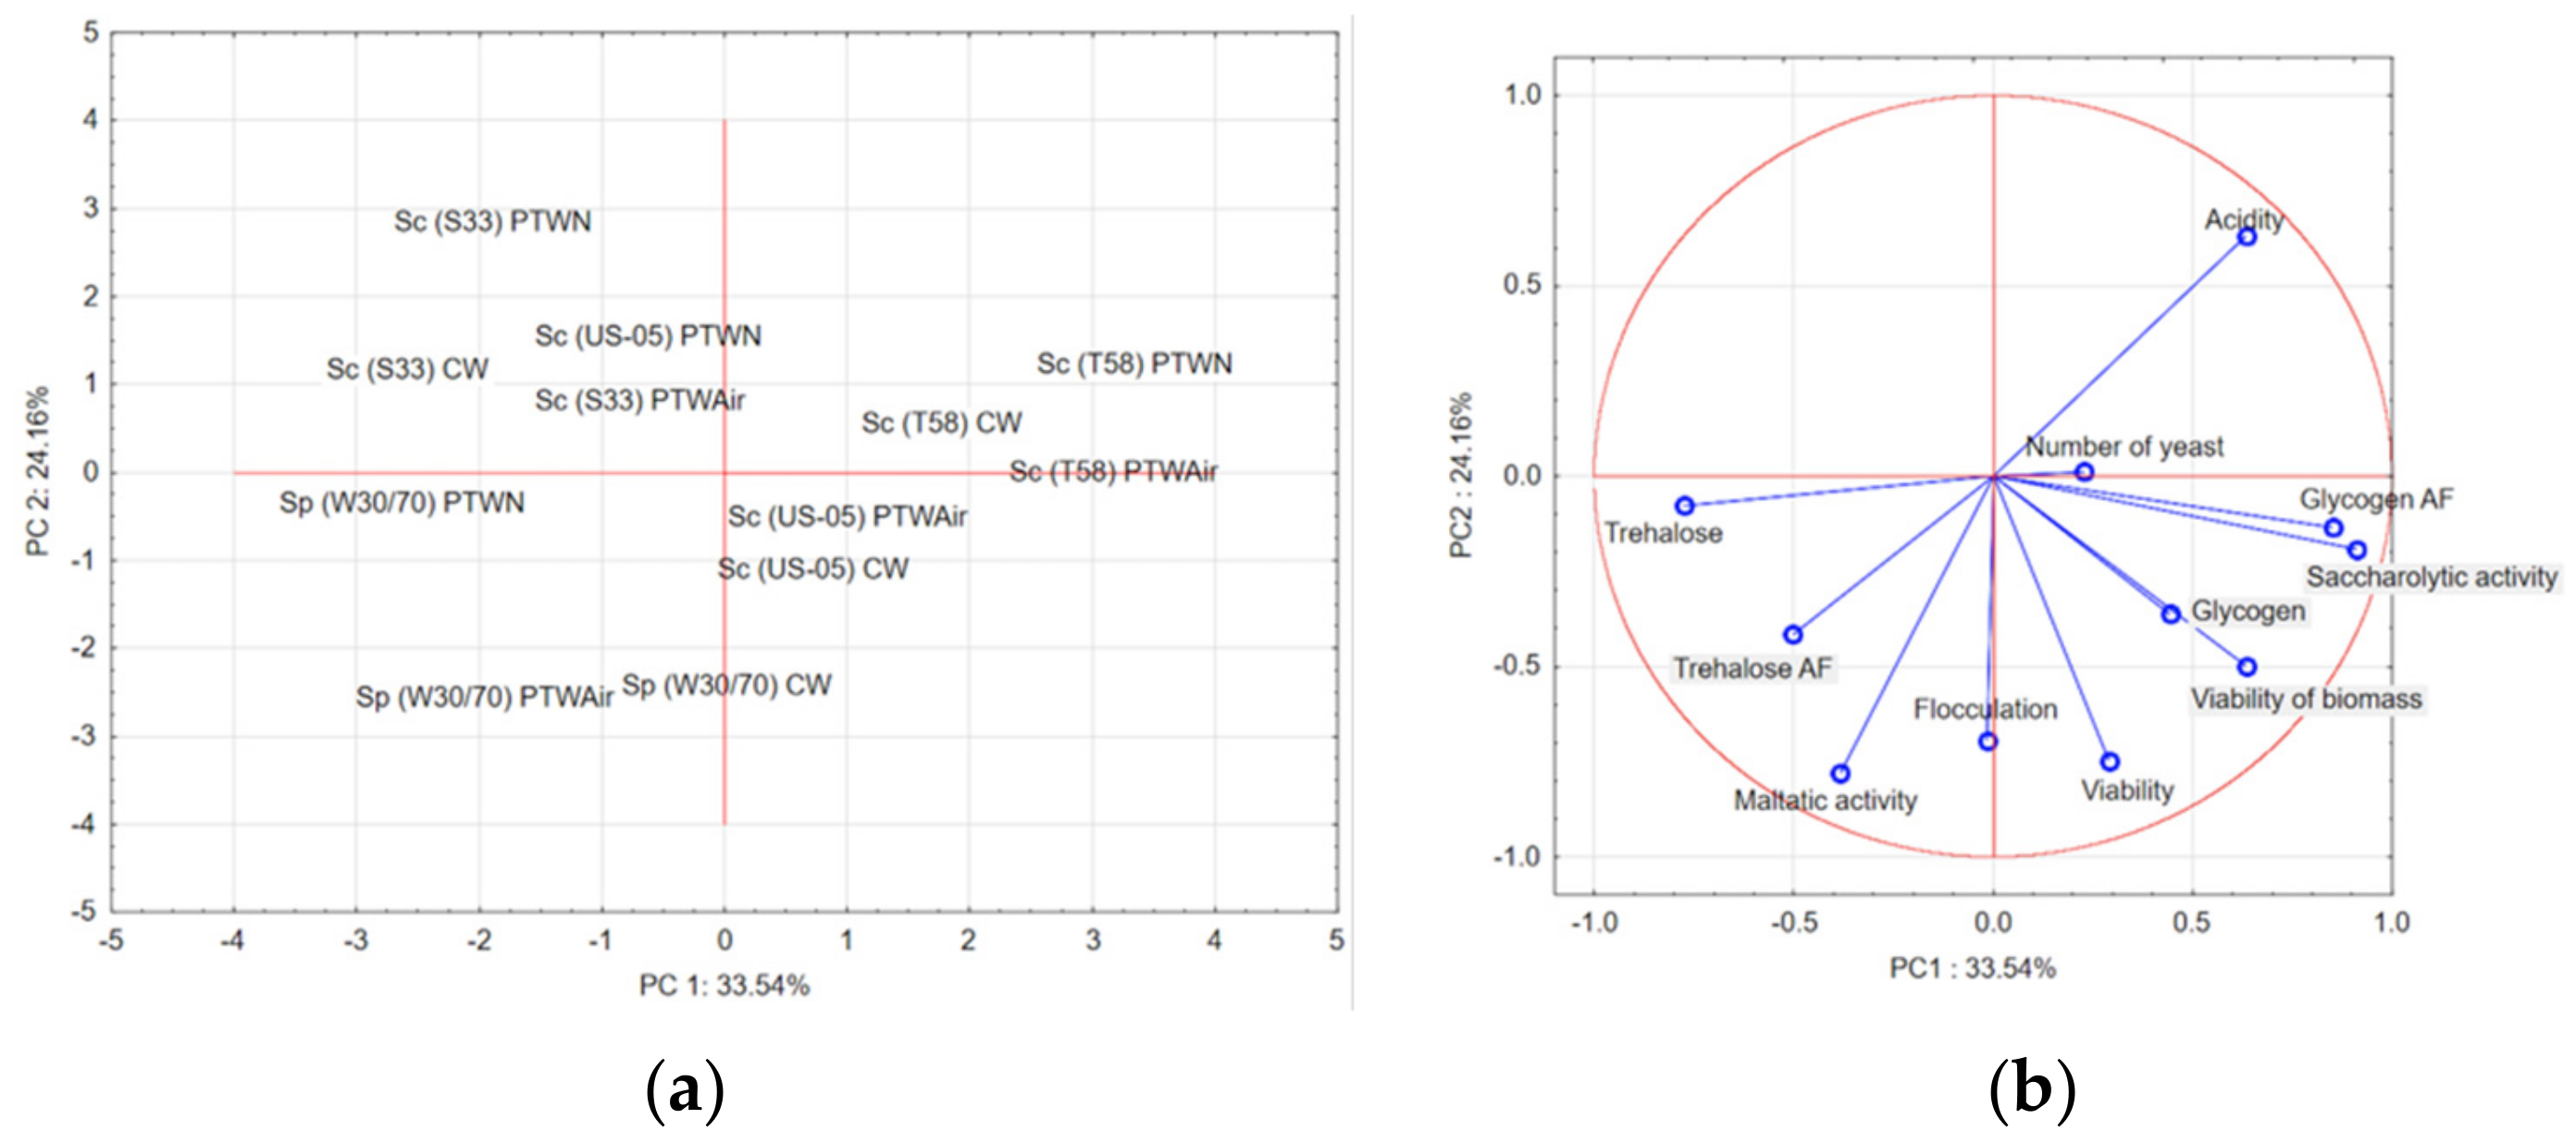
3.8. Principal Component Analyses (PCA)

Figure 1 shows the results of principal component analyses (PCA) for the quality parameters of yeast strains after rehydration in the presence of individual waters (PTWAir, PTWN, CW). The first principal component PC1 described 33.54% of the total variance, while the second (PC2) described 24.16%. Positive PC1 loads were related to glycogen and glycogen after fermentation; negative loads were related to trehalose and trehalose content after fermentation. For PC2, positive loads were for acidity and the number of yeasts, while the other parameters had negative values. In the presented studies, the statistically significant results depend mainly on different used yeast cultures; however, they could also depend on the time of storage of individual yeast strains. The rehydration medium only slightly contributed to the presented results. Significant differences were noticed in the case of the PTWN medium, which also depended on the yeast strain. Sc US-05 strain was characterized by a relatively high glycogen content compared to the other samples. Sp W30/70 strain had high trehalose content and flocculation ability. In contrast, Sc T58 strain had significantly higher saccharolytic activity, as well as glycogen after fermentation.

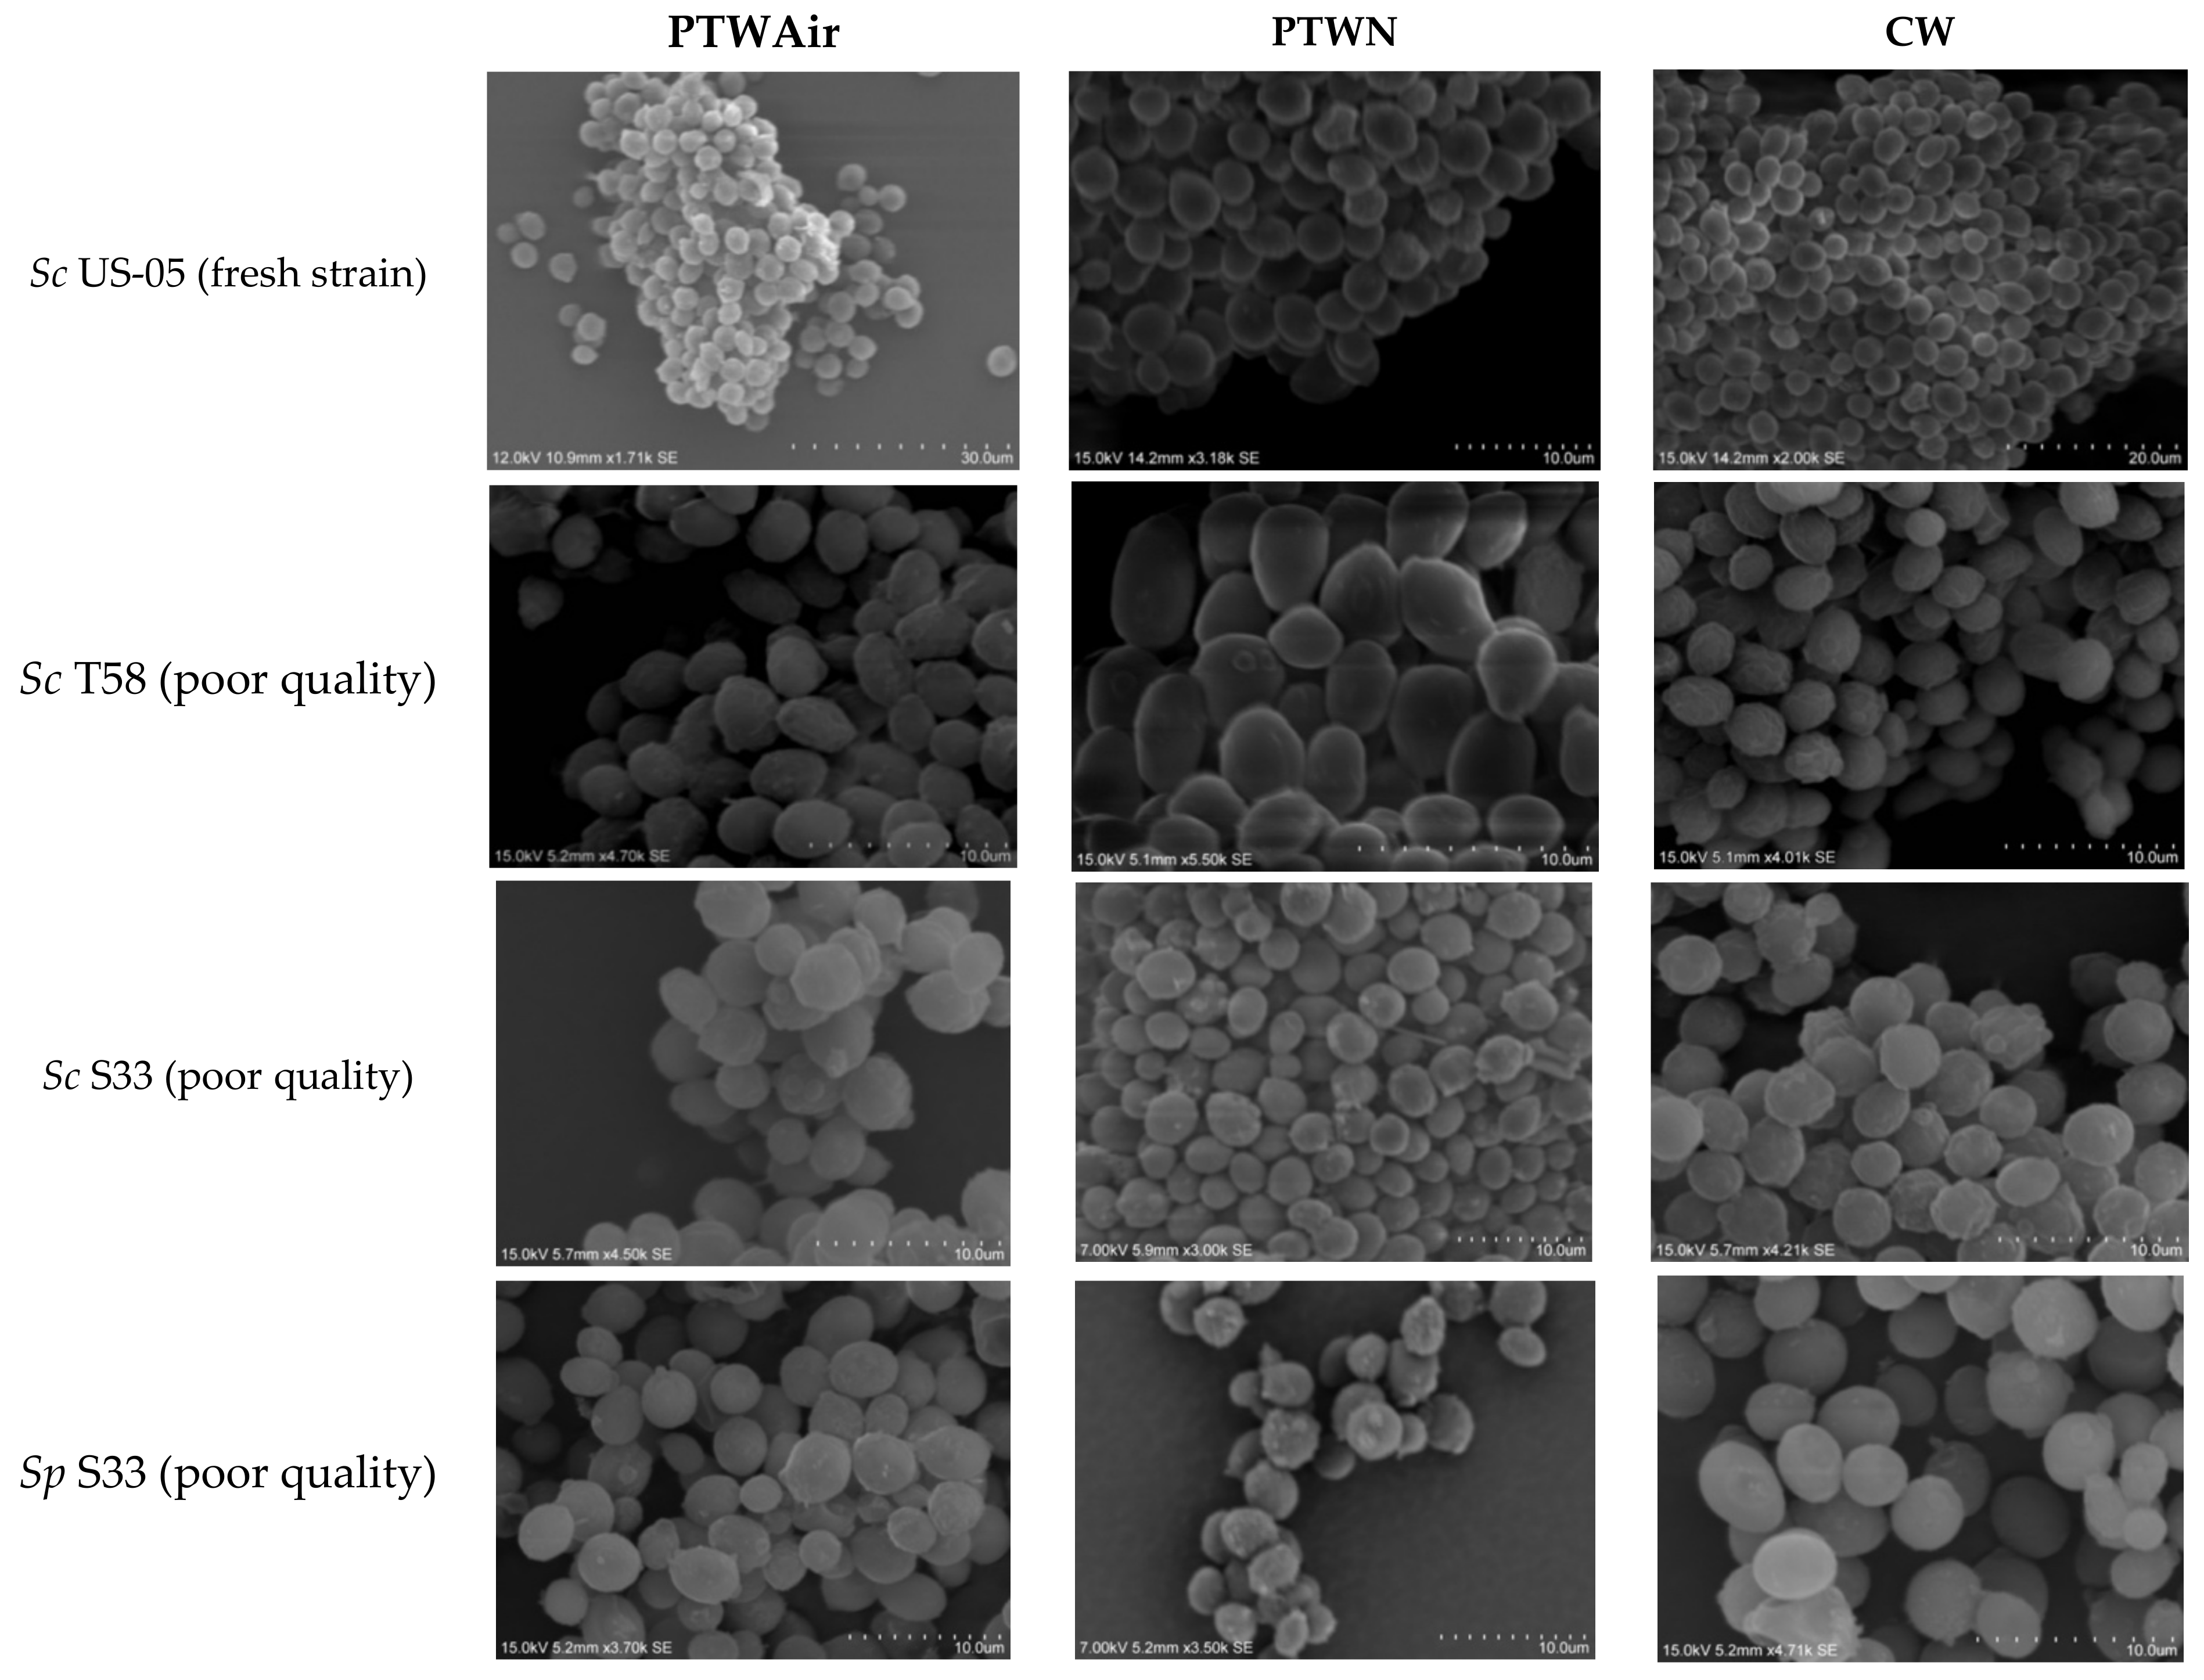
3.9. Scanning Electron Microscopy (SEM) Analysis

Using SEM, yeast cells’ rehydration process with different media (PTWAir, PTWN, CW) were observed. Figure 2 show a cluster of cells of the yeast strains used for rehydration. According to the literature, visualization of treated cells by scanning electron microscopy (SEM) should reveal changes in cell morphology and in the cell wall. Numerous changes were also observed when the yeast was treated in suspension. Under these conditions, some of the treated cells took on a shrunken and crumbled appearance, and the severity and frequency of changes depend on the surrounding environment [55,56]. Taking into account the scientific reports, we took SEM pictures to check whether the produced plasma-treated water would contribute to significant changes in the cell structure during rehydration. In the microscopic image, we looked for significant changes in the structure of the membrane and the cell wall, which may be noticeable in the form of breaks in the structure or shrinkage of cells. This observation showed no differences between the analyzed samples. During yeast rehydration at excessively high temperatures, cells may be damaged, causing membrane leakage and the loss of internal dissolved substances. During oxidation, the formation of free radicals may occur that could result in damage to proteins, lipids and nucleic acids, damage to the mitochondria and leakage of the membrane [57]. Hence, the rehydration medium used did not change the cell structure of the yeast strains analyzed.

4. Conclusions

The current research reports the influence of plasma-treated water obtained in different atmospheres (air, nitrogen) on the rehydration and technological parameters of brewing yeast—top- (S. cerevisiae) and bottom-fermenting (S. pastorianus). Plasma-treated water (PTW) slightly modified the parameters of the fresh yeast; however, the changes observed in the poorer quality yeast cells were statistically significant. We proved that plasma-treated water under air atmosphere (PTWAir) significantly improves the technological features of the dried brewer’s yeast such as their viability, flocculation, glycogen and trehalose content. These parameters are very important for brewer’s yeast, which is used many times in subsequent fermentation cycles. Between successive cycles, the conditions and the medium used to store the yeast slurry are extremely important for its vitality and viability. Some brewers also use cell washing before the next inoculation, and the use of PTWAir at this stage may help to improve the characteristics of reused cells. A more beneficial effect of PTWAir was found for S. cerevisiae than for S. pastorianus yeast strains. This relationship can be used in other branches of the fermentation industry, for example, in winemaking, where dried S. cerevisiae yeast is used. It should be noted, however, that the effectiveness of PTWAir may depend on the yeast strain it acts on, as well as resistance to various stress factors, which among representatives of the genus Saccharomyces is very different. In the case of plasma-treated water under nitrogen (PTWN), almost all yeast characteristics deteriorated. Further research should be carried out in this regard as new antimicrobial agents that could be used in food and leave no residues in them are still being searched for.

Author Contributions

Conceptualization, A.P., P.S. and M.Z. methodology, A.P., P.S. and K.K.; software, A.P.; validation, A.P., P.S. and M.Z.; formal analysis, A.P., M.M. and K.K.; investigation, A.P. and M.M.; resources, A.P.; data curation, A.P.; writing—original draft preparation, A.P.; writing—review and editing, P.S. and M.Z.; visualization, A.P.; supervision, P.S.; project administration, P.S. and M.Z.; funding acquisition, P.S. and M.Z. All authors have read and agreed to the published version of the manuscript.

Funding

The research was funded in part by the Ministry of Science and Higher Education of Poland as scientific project 070013-D020.

Institutional Review Board Statement

Not applicable.

Informed Consent Statement

Not applicable.

Data Availability Statement

Data on the compounds are available from the authors.

Conflicts of Interest

There is no conflict of interest for the authors to declare.

References

  1. Canonico, L.; Galli, E.; Ciani, E.; Comitini, F.; Ciani, M. Exploitation of three non-conventional yeast species in the brewing process. Microorganisms 2019, 7, 11. [Google Scholar] [CrossRef] [PubMed] [Green Version]
  2. Kerby, C.; Vriesekoop, F. An Overview of the Utilisation of Brewery By-Products as Generated by British Craft Breweries. Beverages 2017, 3, 24. [Google Scholar] [CrossRef] [Green Version]
  3. Finn, D.A.; Stewart, G.G. Fermentation characteristics of dried brewers yeast: Effect of drying on flocculation and fermentation. J. Am. Soc. Brew. Chem. 2002, 60, 135–139. [Google Scholar] [CrossRef]
  4. Cioch-Skoneczny, M.; Satora, P. Rehydratacja drożdży piwowarskich®. Technol. Prog. Food Processing 2018, 2, 79–84. [Google Scholar]
  5. Diniz-Mendes, L.; Bernardes, E.; De Araujo, P.S.; Panek, A.D.; Paschoalin, V.M.F. Preservation of frozen yeast cells by trehalose. Biotechnol. Bioeng. 1999, 65, 572–578. [Google Scholar] [CrossRef]
  6. Bolat, I.; Turtoi, M.; Walsh, M. Influence of yeast drying process on different lager brewing strains viability. J. Agroaliment. Process. Technol. 2009, 15, 370–377. [Google Scholar]
  7. Luna-Solano, G.; Salgado-Cervantes, M.A.; Rodríguez-Jimenes, G.C.; García-Alvarado, M.A. Optimization of brewer’s yeast spray drying process. J. Food Eng. 2005, 68, 9–18. [Google Scholar] [CrossRef]
  8. Jenkins, D.M.; Powell, C.D.; Fischborn, T.; Smart, K.A. Rehydration of active dry brewing yeast and its effect on cell viability. J. Inst. Brew. 2011, 117, 377–382. [Google Scholar] [CrossRef]
  9. Walker, G.M.; Van Dijck, P. Physiological and Molecular Responses of Yeasts to the Environment. In Yeasts in Food and Beverages; Springer: Berlin/Heidelberg, Germany, 2006; pp. 111–152. [Google Scholar] [CrossRef]
  10. Fang, Z.; Bhandari, B. Comparing the efficiency of protein and maltodextrin on spray drying of bayberry juice. Food Res. Int. 2012, 48, 478–483. [Google Scholar] [CrossRef]
  11. Poirier, I.; Maréchal, P.A.; Richard, S.; Gervais, P. Saccharomyces cerevisiae viability is strongly dependant on rehydration kinetics and the temperature of dried cells. J. Appl. Microbiol. 1999, 86, 87–92. [Google Scholar] [CrossRef]
  12. Laroche, C.; Gervais, P. Achievement of rapid osmotic dehydration at specific temperatures could maintain high Saccharomyces cerevisiae viability. Appl. Microbiol. Biotechnol. 2003, 60, 743–747. [Google Scholar] [CrossRef] [PubMed]
  13. Pater, A.; Zdaniewicz, M.; Satora, P.; Khachatryan, G.; Oszczęda, Z. Application of water treated with low-temperature low-pressure glow plasma for quality improvement of barley and malt. Biomolecules 2020, 10, 267. [Google Scholar] [CrossRef] [PubMed] [Green Version]
  14. Elkin, I. Pl 216025 B1. 2009. Available online: https://ewyszukiwarka.pue.uprp.gov.pl/search/pwp-details/P.389626 (accessed on 10 January 2022).
  15. Białopiotrowciz, T.; Ciesielski, W.; Domanski, J.; Doskocz, M.; Khachatryan, K.; Fiedorowicz, M.; Graz, K.; Kołoczek, H.; Kozak, A.; Oszczeda, Z. Structure and Physicochemical Properties of Water Treated with Low-Temperature Low-Frequency Glow Plasma. Curr. Phys. Chem. 2016, 6, 312–320. [Google Scholar] [CrossRef]
  16. Shaw, P.; Kumar, N.; Kwak, H.S.; Park, J.H.; Uhm, H.S.; Bogaerts, A.; Choi, E.H.; Attri, P. Bacterial inactivation by plasma treated water enhanced by reactive nitrogen species. Sci. Rep. 2018, 8, 11268. [Google Scholar] [CrossRef] [Green Version]
  17. Ciesielski, W.; Gąstoł, M.; Kulawik, D.; Oszczęda, Z.; Pisulewska, E.; Tomasik, P. Specific controlling essential oil composition of basil (Ocimum basilicum l.) involving low-temperature, low-pressure glow plasma of low frequency. Water 2020, 12, 3332. [Google Scholar] [CrossRef]
  18. Murawski, M.; Schwarz, T.; Grygier, J.; Patkowski, K.; Oszczęda, Z.; Jelkin, I.; Kosiek, A.; Gruszecki, T.M.; Szymanowska, A.; Skrzypek, T.; et al. The utility of nanowater for ram semen cryopreservation. Exp. Biol. Med. 2015, 240, 611–617. [Google Scholar] [CrossRef] [Green Version]
  19. Yang, Z.; Liu, X.; Szymanowicz, J.; Fryc, K.; Schwarz, T.; Murawski, M.; Bartlewski, P.M. Bovine in vitro embryo production using media prepared with Milli-Q® Water or nanowater. Reprod. Biol. 2020, 20, 580–583. [Google Scholar] [CrossRef]
  20. Szymanowicz, J.; Schwarz, T.; Murawski, M.; Małopolska, M.; Oszczeda, Z.; Tuz, R.; Nowicki, J.; Bartlewski, P.M. Storage of boar semen at 16–18 °C in the long-term commercial extender prepared with deionized water or nanowater. Anim. Reprod. 2019, 16, 864–870. [Google Scholar] [CrossRef]
  21. Jaworska, M.; Oszczȩda, Z.; Tomasik, P. Stimulation of pathogenicity of entomopathogenic fungi with water treated with low-temperature, low-pressure glow plasma of low frequency. Polish J. Nat. Sci. 2018, 33, 561–568. [Google Scholar]
  22. Uchida, G.; Takenaka, K.; Takeda, K.; Ishikawa, K.; Hori, M.; Setsuhara, Y. Selective production of reactive oxygen and nitrogen species in the plasma-treated water by using a nonthermal high-frequency plasma jet. Jpn. J. Appl. Phys. 2018, 57. [Google Scholar] [CrossRef] [Green Version]
  23. Boulton, C. Fermentation Systems; BSL: Oxford, UK, 2007; ISBN 063-2054-751. [Google Scholar]
  24. Polčic, P.; Machala, Z. Effects of non-thermal plasma on yeast saccharomyces cerevisiae. Int. J. Mol. Sci. 2021, 22, 2247. [Google Scholar] [CrossRef]
  25. ASBC Technical Committe. Yeast–11 Flocculation. ASBC Methods Anal. 2011, 5, 11–12. [Google Scholar] [CrossRef]
  26. Somani, A.; Bealin-Kelly, F.; Axcell, B.; Smart, K.A. Impact of storage temperature on lager brewing yeast viability, glycogen, trehalose, and fatty acid content. J. Am. Soc. Brew. Chem. 2012, 70, 123–130. [Google Scholar] [CrossRef]
  27. Attfield, P.V.; Kletsas, S.; Veal, D.A.; Van Rooijen, R.; Bell, P.J.L. Use of flow cytometry to monitor cell damage and predict fermentation activity of dried yeasts. J. Appl. Microbiol. 2000, 89, 207–214. [Google Scholar] [CrossRef] [Green Version]
  28. Kobayashi, M.; Shimizu, H.; Shioya, S. Physiological analysis of yeast cells by flow cytometry during serial-repitching of low-malt beer fermentation. J. Biosci. Bioeng. 2007, 103, 451–456. [Google Scholar] [CrossRef] [PubMed]
  29. Smart, K.A.; Whisker, S. Effect of serial repitching on the fermentation properties and condition of brewing yeast. J. Am. Soc. Brew. Chem. 1996, 54, 41–44. [Google Scholar] [CrossRef]
  30. Nagodawithana, T.W.; Steinkraus, K.H. Influence of the rate of ethanol production and accumulation on the viability of Saccharomyces cerevisiae in “rapid fermentation”. Appl. Environ. Microbiol. 1976, 31, 158–162. [Google Scholar] [CrossRef] [Green Version]
  31. Stewart, G.G. Yeast flocculation—sedimentation and flotation. Fermentation 2018, 4, 28. [Google Scholar] [CrossRef] [Green Version]
  32. Bony, M.; Thines-Sempoux, D.; Barre, P.; Blondin, B. Localization and cell surface anchoring of the Saccharomyces cerevisiae flocculation protein Flo1p. J. Bacteriol. 1997, 179, 4929–4936. [Google Scholar] [CrossRef] [Green Version]
  33. Verstrepen, K.J.; Derdelinckx, G.; Verachtert, H.; Delvaux, F.R. Yeast flocculation: What brewers should know. Appl. Microbiol. Biotechnol. 2003, 61, 197–205. [Google Scholar] [CrossRef] [PubMed]
  34. Stewart, G.G.; Russell, I.; Garrison, I.F. Some Considerations of the Flocculation Characteristics of Ale and Lager Yeast Strains. J. Inst. Brew. 1975, 81, 248–257. [Google Scholar] [CrossRef]
  35. Crabtree, B. The Vital Force: A Study of Bioenergetics. Biochem. Soc. Trans. 1987, 15, 183. [Google Scholar] [CrossRef]
  36. Rowe, S.M.; Simpson, W.J.; Hammond, J.R.M. Intracellular pH of yeast during brewery fermentation. Lett. Appl. Microbiol. 1994, 18, 135–137. [Google Scholar] [CrossRef]
  37. Gibson, B.R.; Lawrence, S.J.; Leclaire, J.P.R.; Powell, C.D.; Smart, K.A. Yeast responses to stresses associated with industrial brewery handling. FEMS Microbiol. Rev. 2007, 31, 535–569. [Google Scholar] [CrossRef] [PubMed] [Green Version]
  38. Lei, H.; Xu, H.; Feng, L.; Yu, Z.; Zhao, H.; Zhao, M. Fermentation performance of lager yeast in high gravity beer fermentations with different sugar supplementations. J. Biosci. Bioeng. 2016, 122, 583–588. [Google Scholar] [CrossRef] [PubMed]
  39. Kim, J.; Alizadeh, P.; Harding, T.; Hefner-Gravink, A.; Klionsky, D.J. Disruption of the yeast ATH1 gene confers better survival after dehydration, freezing, and ethanol shock: Potential commercial applications. Appl. Environ. Microbiol. 1996, 62, 1563–1569. [Google Scholar] [CrossRef] [Green Version]
  40. Magalhães, R.S.S.; Popova, B.; Braus, G.H.; Outeiro, T.F.; Eleutherio, E.C.A. The trehalose protective mechanism during thermal stress in Saccharomyces cerevisiae: The roles of Ath1 and Agt1. FEMS Yeast Res. 2018, 18, foy066. [Google Scholar] [CrossRef] [PubMed] [Green Version]
  41. Aranda, J.S.; Salgado, E.; Taillandier, P. Trehalose accumulation in Saccharomyces cerevisiae cells: Experimental data and structured modeling. Biochem. Eng. J. 2004, 17, 129–140. [Google Scholar] [CrossRef] [Green Version]
  42. Bolat, I. The importance of trehalose in brewing yeast survival. Innov. Rom. Food Biotechnol. 2008, 2, 1–10. [Google Scholar]
  43. Silljé, H.H.W.; Paalman, J.W.G.; Ter Schure, E.G.; Olsthoorn, S.Q.B.; Verkleij, A.J.; Boonstra, J.; Verrips, C.T. Function of trehalose and glycogen in cell cycle progression and cell viability in Saccharomyces cerevisiae. J. Bacteriol. 1999, 181, 396–400. [Google Scholar] [CrossRef] [Green Version]
  44. Anderson, C.; Tatchell, K. Hyperactive glycogen synthase mutants of Saccharomyces cerevisiae suppress the glc7-1 protein phosphatase mutant. J. Bacteriol. 2001, 183, 821–829. [Google Scholar] [CrossRef] [Green Version]
  45. Deshpande, P.S.; Sankh, S.N.; Arvindekar, A.U. Study of two pools of glycogen in saccharomyces cerevisiae and their role in fermentation performance. J. Inst. Brew. 2011, 117, 113–119. [Google Scholar] [CrossRef]
  46. Sall, C.J.; Seipp, J.F.; Pringle, A.T. Changes in Brewer’s Yeast during Storage and the Effect of These Changes on Subsequent Fermentation Performance. J. Am. Soc. Brew. Chem. 1988, 46, 23–25. [Google Scholar] [CrossRef] [Green Version]
  47. Brosnan, M.P.; Donnelly, D.; James, T.C.; Bond, U. The stress response is repressed during fermentation in brewery strains of yeast. J. Appl. Microbiol. 2000, 88, 746–755. [Google Scholar] [CrossRef] [Green Version]
  48. Walker, M.D. The influence of metal ions on concentrations of flavour-active sulphur compounds measured in beer using dynamic headspace sampling. J. Sci. Food Agric. 1995, 67, 25–28. [Google Scholar] [CrossRef]
  49. Walker, G.M.; Maynard, A.I. Magnesium-limited growth of Saccharomyces cerevisiae. Enzyme Microb. Technol. 1996, 18, 455–459. [Google Scholar] [CrossRef]
  50. Miki, B.L.A.; Poon, N.H.; James, A.P.; Seligy, V.L. Possible mechanism for flocculation interactions governed by gene FLO1 in Saccharomyces cerevisiae. J. Bacteriol. 1982, 150, 878–889. [Google Scholar] [CrossRef] [PubMed] [Green Version]
  51. Rees, E.M.R.; Stewart, G.G. Effects of magnesium, calcium and wort oxygenation on the fermentative performance of ale and lager strains fermenting normal and high gravity worts. J. Inst. Brew. 1999, 105, 211–218. [Google Scholar] [CrossRef]
  52. Trofimova, Y.; Walker, G.; Rapoport, A. Anhydrobiosis in yeast: Influence of calcium and magnesium ions on yeast resistance to dehydration-rehydration. FEMS Microbiol. Lett. 2010, 308, 55–61. [Google Scholar] [CrossRef] [PubMed] [Green Version]
  53. Mochaba, F.; O’Connor-Cox, E.S.C.; Axcell, B.C. Metal ion concentration and release by a brewing yeast: Characterization and implications. J. Am. Soc. Brew. Chem. 1996, 54, 155–163. [Google Scholar] [CrossRef]
  54. Bromberg, S.K.; Bower, P.A.; Duncombe, G.R.; Fehring, J.; Gerber, L.A.; Lau, V.K.; Tata, M. Requirements for zinc, manganese, calcium, and magnesium in wort. J. Am. Soc. Brew. Chem. 1997, 55, 123–128. [Google Scholar] [CrossRef]
  55. Bergmans, L.; Moisiadis, P.; Van Meerbeek, B.; Quirynen, M.; Lambrechts, P. Microscopic observation of bacteria: Review highlighting the use of environmental SEM. Int. Endod. J. 2005, 38, 775–788. [Google Scholar] [CrossRef] [PubMed] [Green Version]
  56. Lee, J.H.; Choi, E.H.; Kim, K.M.; Kim, K.N. Effect of non-thermal air atmospheric pressure plasma jet treatment on gingival wound healing. J. Phys. D. Appl. Phys. 2016, 49, 75402. [Google Scholar] [CrossRef]
  57. Attfield, P.V. Stress tolerance: The key to effective strains of industrial baker’s yeast. Nat. Biotechnol. 1997, 15, 1351–1357. [Google Scholar] [CrossRef] [PubMed]
Figure 1. (a) Principal component analysis—plot of component weights. (b) Principal component analysis showing the qualitative characteristics of the Saccharomyces cerevisiae (SafBrew T58, US-05, S33) and Saccharomyces pastorianus (SafLager W30/70) yeast strain after rehydration with plasma-treated water.
Applsci 12 02909 g001
Figure 2. SEM analysis of the Saccharomyces cerevisiae (Sc) and Saccharomyces pastorianus (Sp) yeast strain after rehydration with plasma-treated water.
Applsci 12 02909 g002
Table 1. Yeast strain used in research.
StrainSourceManufacturer’s RecommendationsStorage Method
Saccharomyces cerevisiae SafAle T58Lesaffre FermentisAfter opening, the packaging should be resealed and stored in a dry room at 4 °C for a period not longer than 7 daysAfter opening, the yeast was resealed and stored at 4 °C for one year
Saccharomyces cerevisiae SafAle US-05Lesaffre FermentisFresh yeast
Saccharomyces cerevisiae SafAle S33Lesaffre FermentisAfter opening, the yeast was resealed and stored at 4 °C for one year
Saccharomyces pastorianus SafLager W30/70Lesaffre Fermentis
Publisher’s Note: MDPI stays neutral with regard to jurisdictional claims in published maps and institutional affiliations.

