
The 27 September 2021 Earthquake in Central Crete (Greece)—Detailed Analysis of the Earthquake Sequence and Indications for Contemporary Arc-Parallel Extension to the Hellenic Arc

 ,
,  ,
,  , ,
, ,  , , ,
, , ,
Abstract
:Featured Application
Abstract
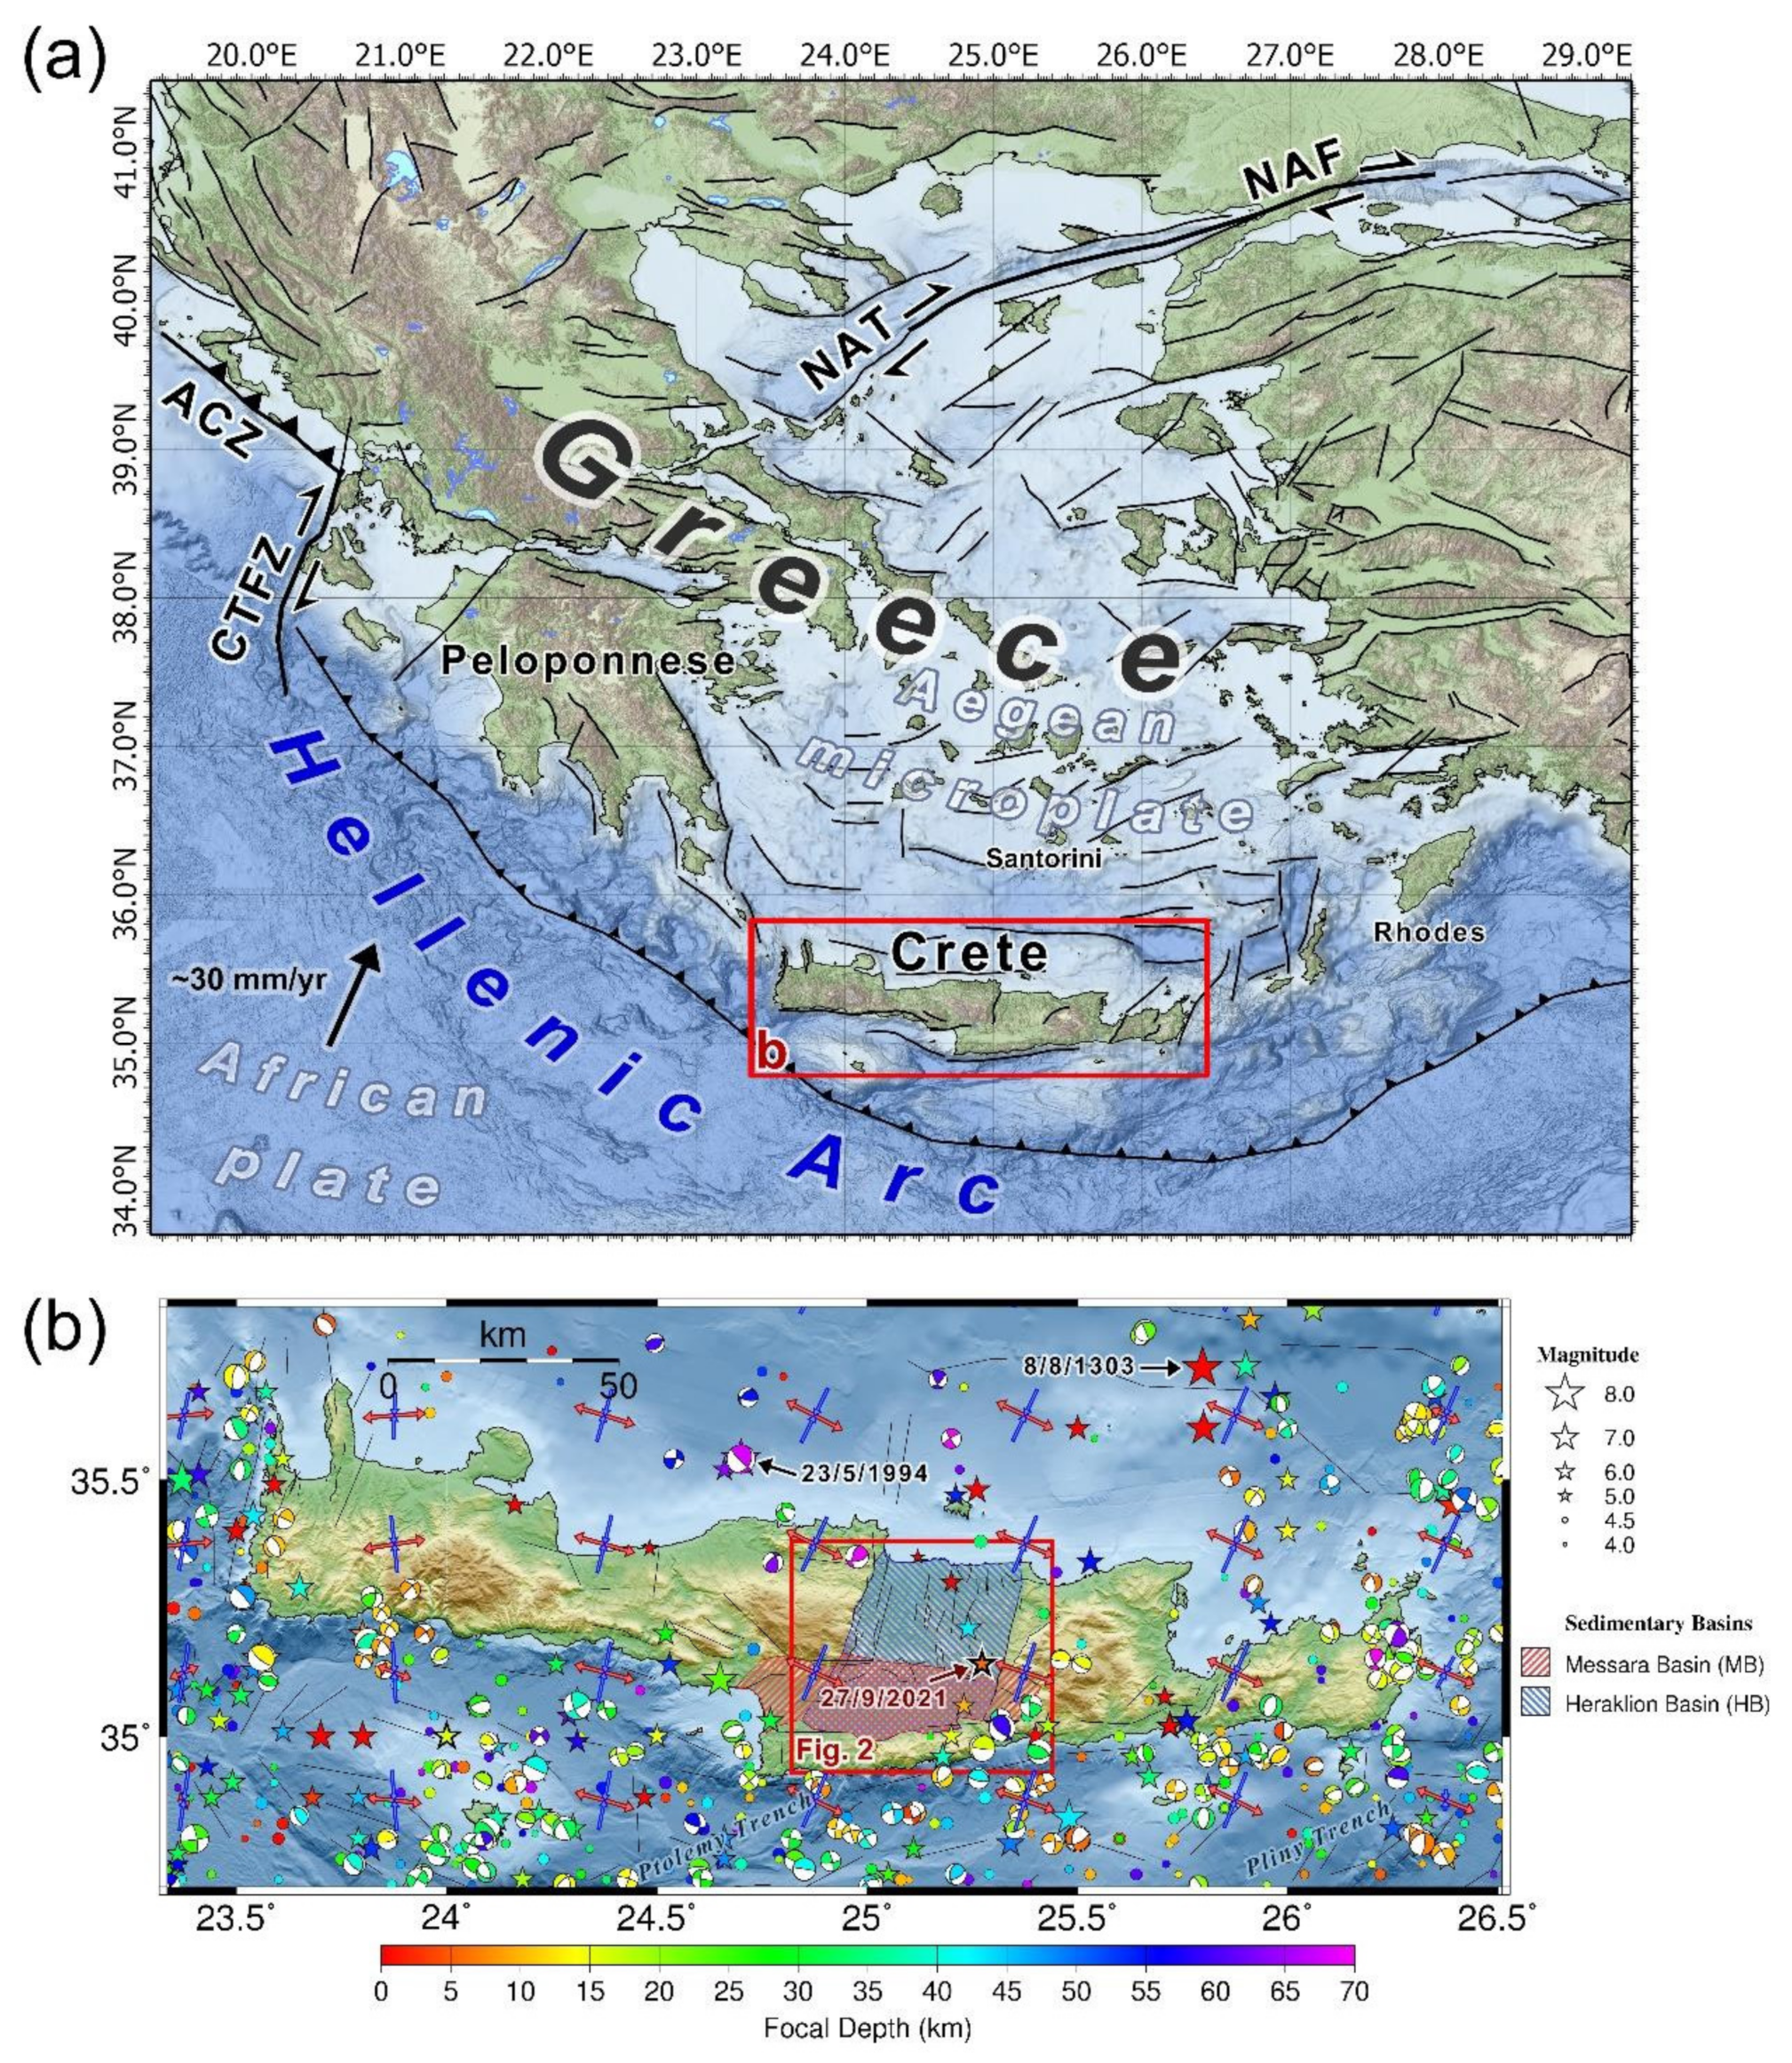
1. Introduction

2. Geological Setting
2.1. Geomorphology
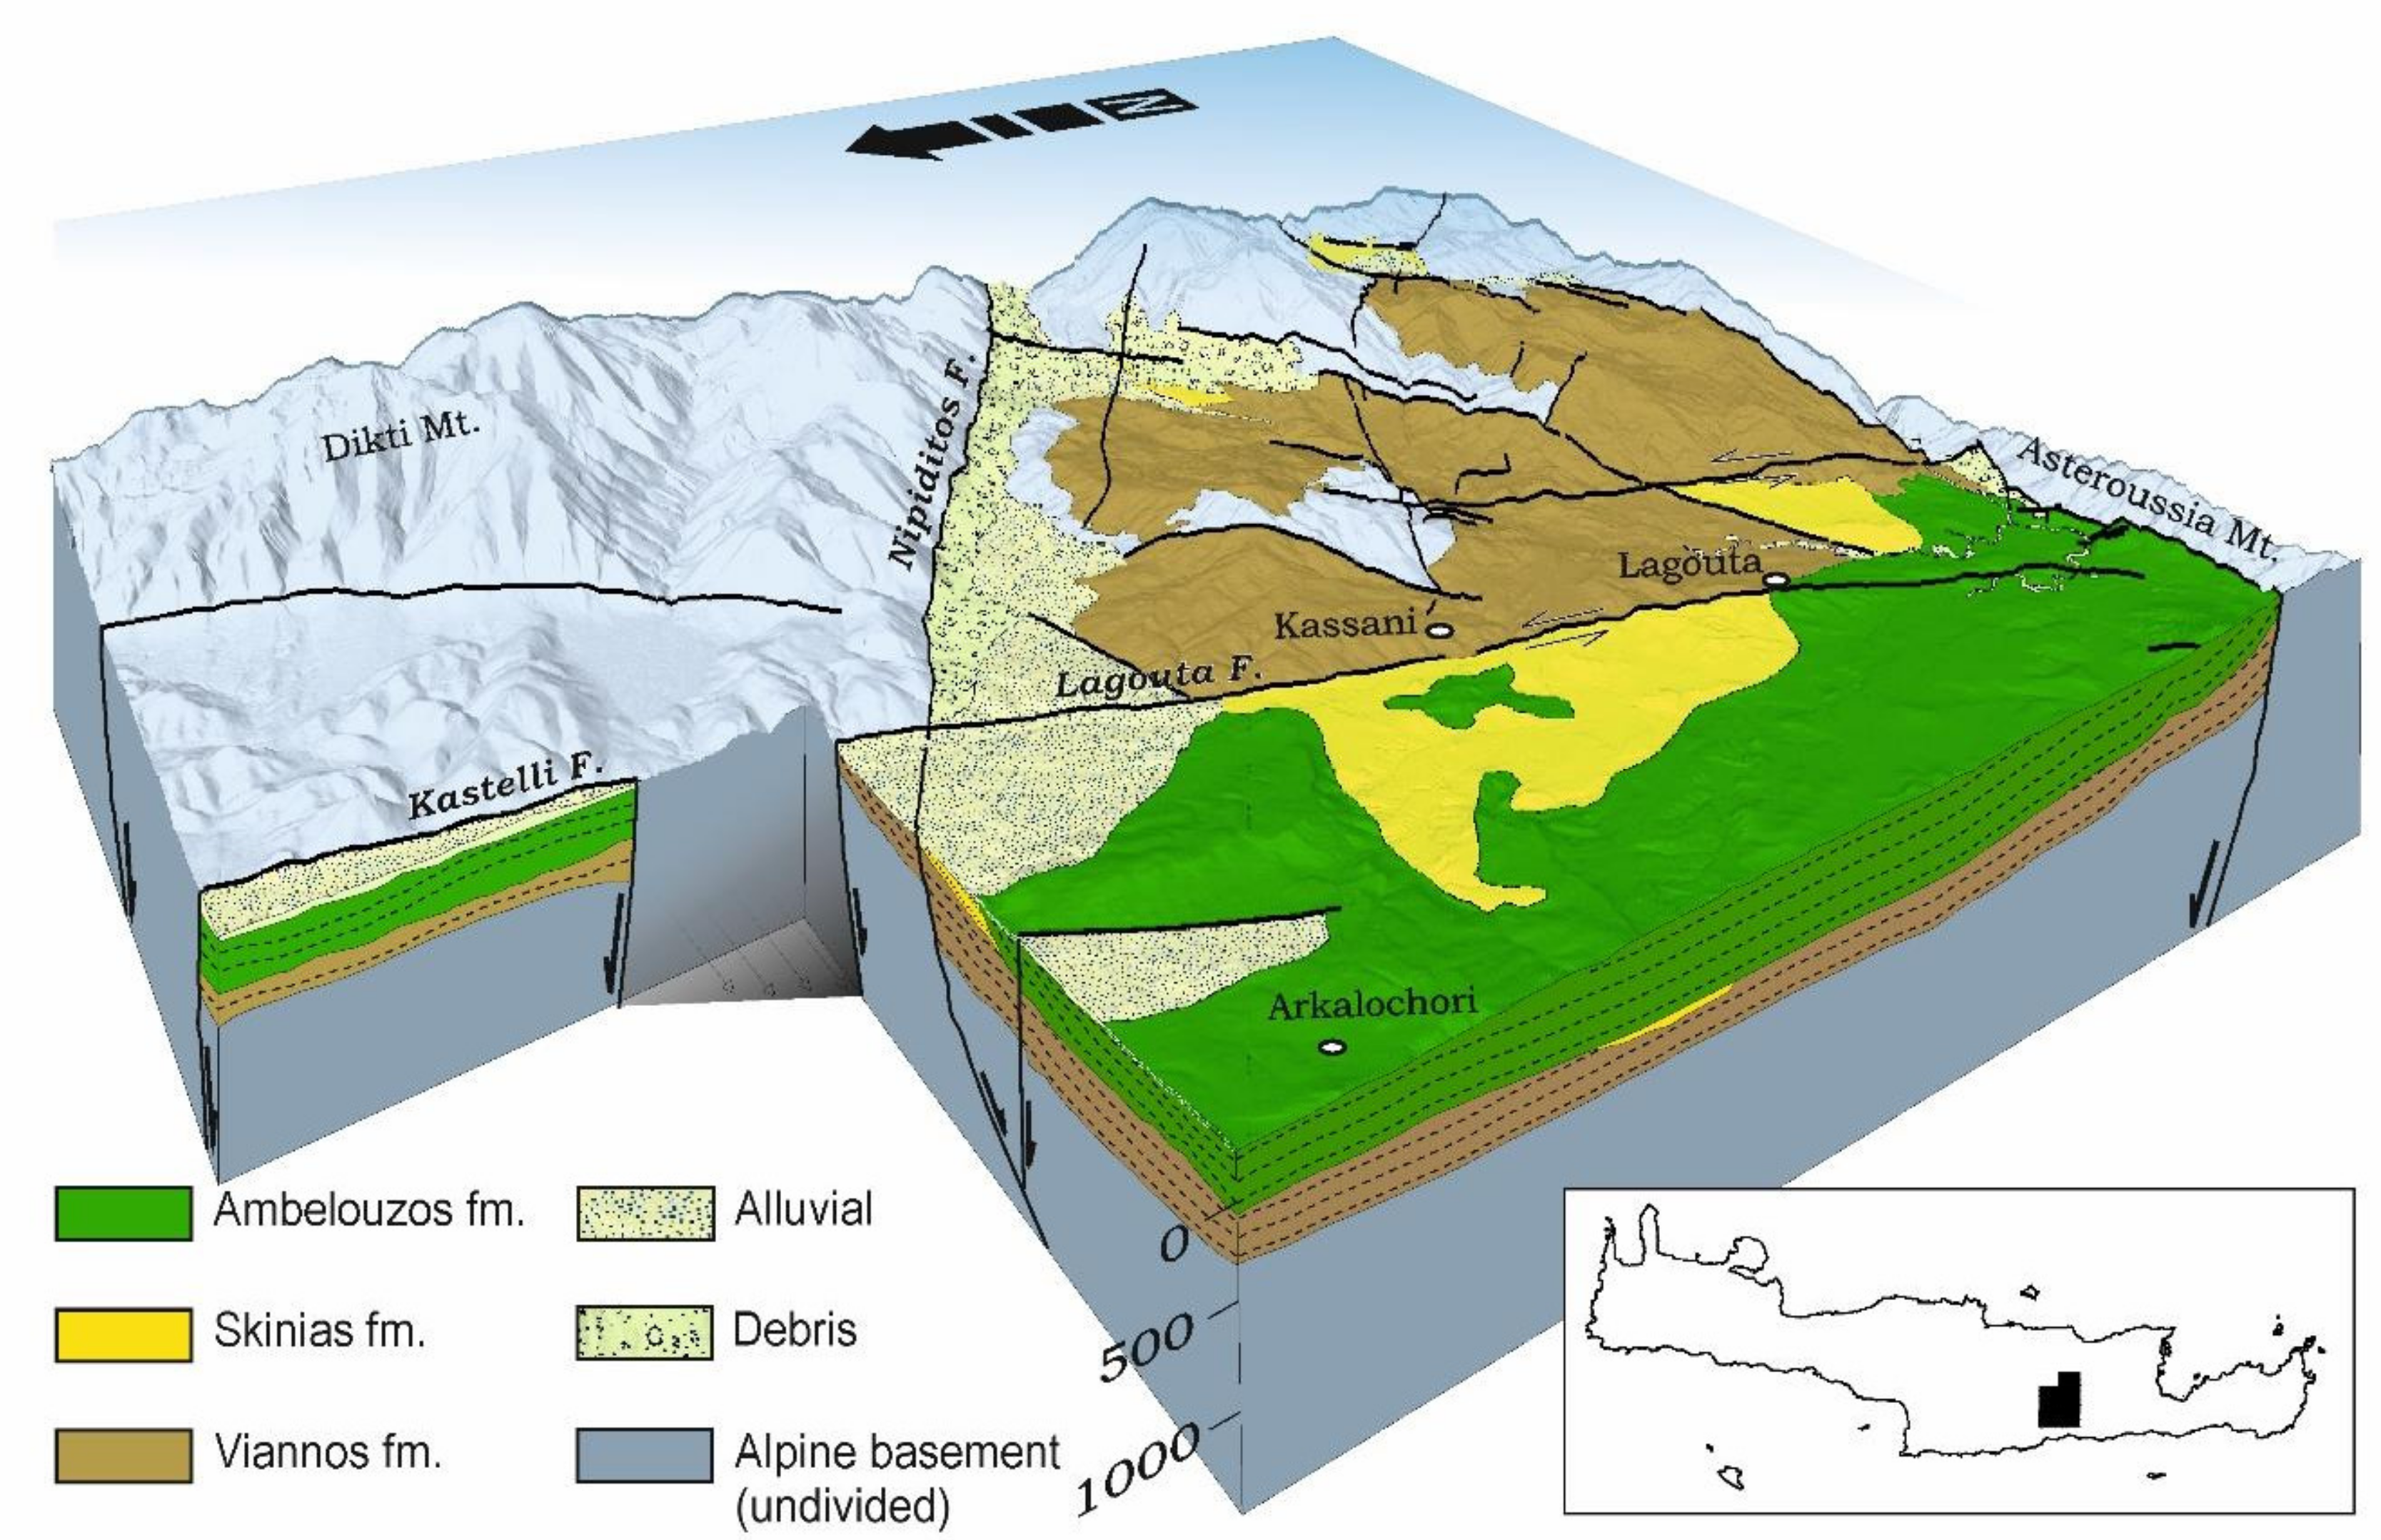
2.2. Lithology
- The Alpine basement formations can be distinguished into two major groups, regarding their tectonic emplacement on the Cretan nappe pile [1]. They are members of the tectono-stratigraphic succession which builds the island of Crete as a stacked pile of 10 geotectonic units with a total thickness of about 10–12 km [33]. The upper part of the pile consists of five units (Pindos, Arvi, Miamou, Vatos, and Asteroussia) which are tectonically emplaced beneath the ophiolites, that is the uppermost nappe, whilst the lower four units (Mani, W. Crete, Arna, and Tripolis) comprise the basement of Crete [1,33]. At the study area of easternmost MB, the Alpine basement outcrops are limited to the following rocks:
- ⚬
- Limestones and Dolomites (Mani Unit). Carbonate rocks consisting of thin-bedded crystalline marbles with layers of siltstones (L. Jurassic—L. Eocene). They appear heavily folded with isoclinal asymmetric folds.
- ⚬
- Limestones and Dolomites (Tripolis Unit). Intercalations of unbedded to thick-bedded neritic dark-colored and partially bituminous Limestones and Dolomites, with sparse appearances of evaporites.
- ⚬
- Flysch (Pindos Unit). It consists of heavily folded layers of Sandstones, Schists, and Conglomerates, with the characteristic appearance of large carbonate olistoliths that originated from inner units.
- ⚬
- Ophiolitic nappe. Limited appearance at the top of E. Asteroussia Mt, emplaced between the Flysch and the Viannos formation sediments as its basement rock.
The entire nappe pile behaves homogenously till after the Middle Miocene, when the compressional, almost N-S-trending, orogenic stress field is converted into an extensional one due to the African plate slab roll-back [9,34,35,36], which happened at the edge of the Aegean microplate [37]. Within this context, Crete is a large part of the Mid-Miocene Southern Aegean core complex exhumation that took place between 24 and 15 Ma [9] which hosts several supra-detachment depositional areas [3,4], with MB being one of them. - The Cretan nappe pile is segmented by many faults and covered by sedimentary formations representing different paleo-environments, as follows (from deeper to shallower):
- ⚬
- Viannos Formation (Mid. Miocene). Sandy/silty deposits of lacustrine origin, coexisting with alluvial conglomerates. The average thickness of the formation is about 400 m. Its outcrops may be found at most of the eastern MB margin, either covering unconformably the basement rocks or in tectonic contact with them through ruptured fault zones.
- ◦
- Skinias Formation. It is a transitional succession consisting of Middle Miocene silts, with a thickness of ~200 m, yielding the sea intrusion within the MB area. At the area between Skinias and Martha villages, the Skinias silts were deposited in a deep (over 200 m) marine environment. The base of the deposits consists of Pelites, whereas layers of conglomerates and sand have been observed in the area close to Martha village.
- ⚬
- Ampelouzos Formation. It is deposited unconformably above both aforementioned formations. The lower part of the formation includes a variety of sedimentary, well-layered deposits, transitioning gradually from shallow to deeper (fan conglomerates to homogenous continental shelf sandstones). According to fossils found in the continental and shallow-marine deposits, the formation is dated as Middle to Upper Miocene [38].
- ⚬
- Alluvial deposits. Unconsolidated sands and conglomerates with pebbles originated from all the above formations, mainly along riverbeds.
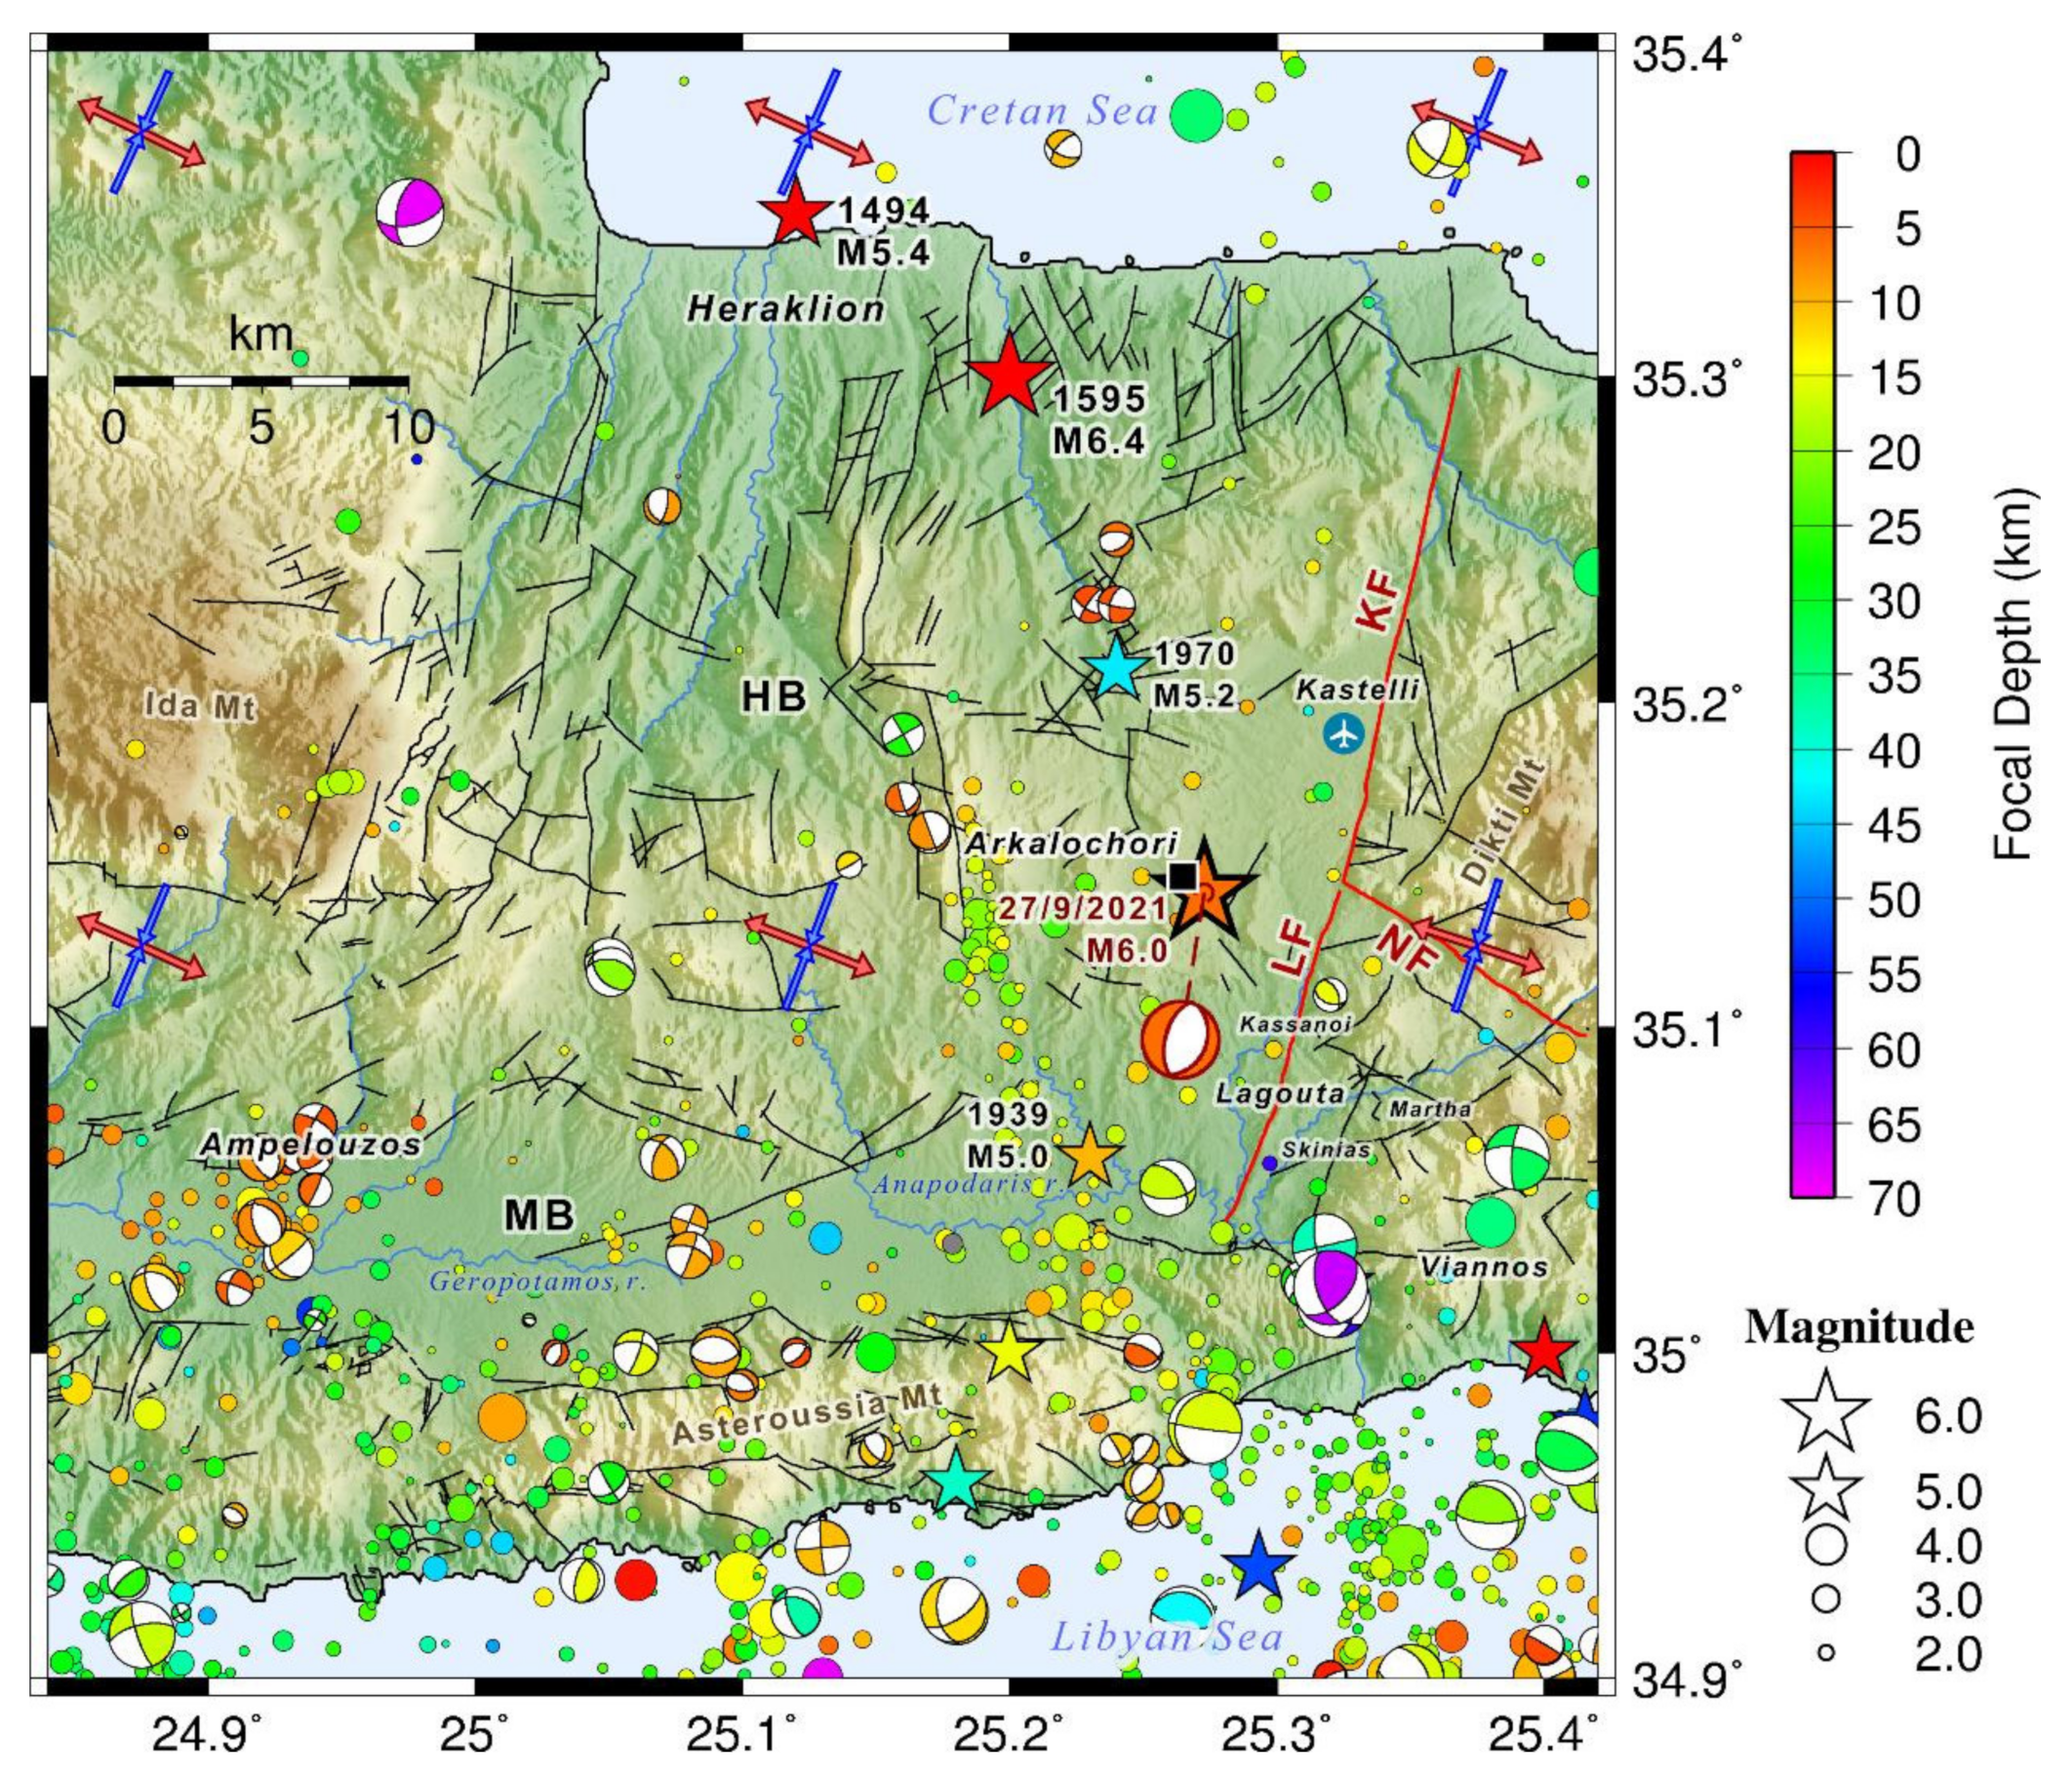
2.3. Seismotectonic Setting
3. Materials and Methods
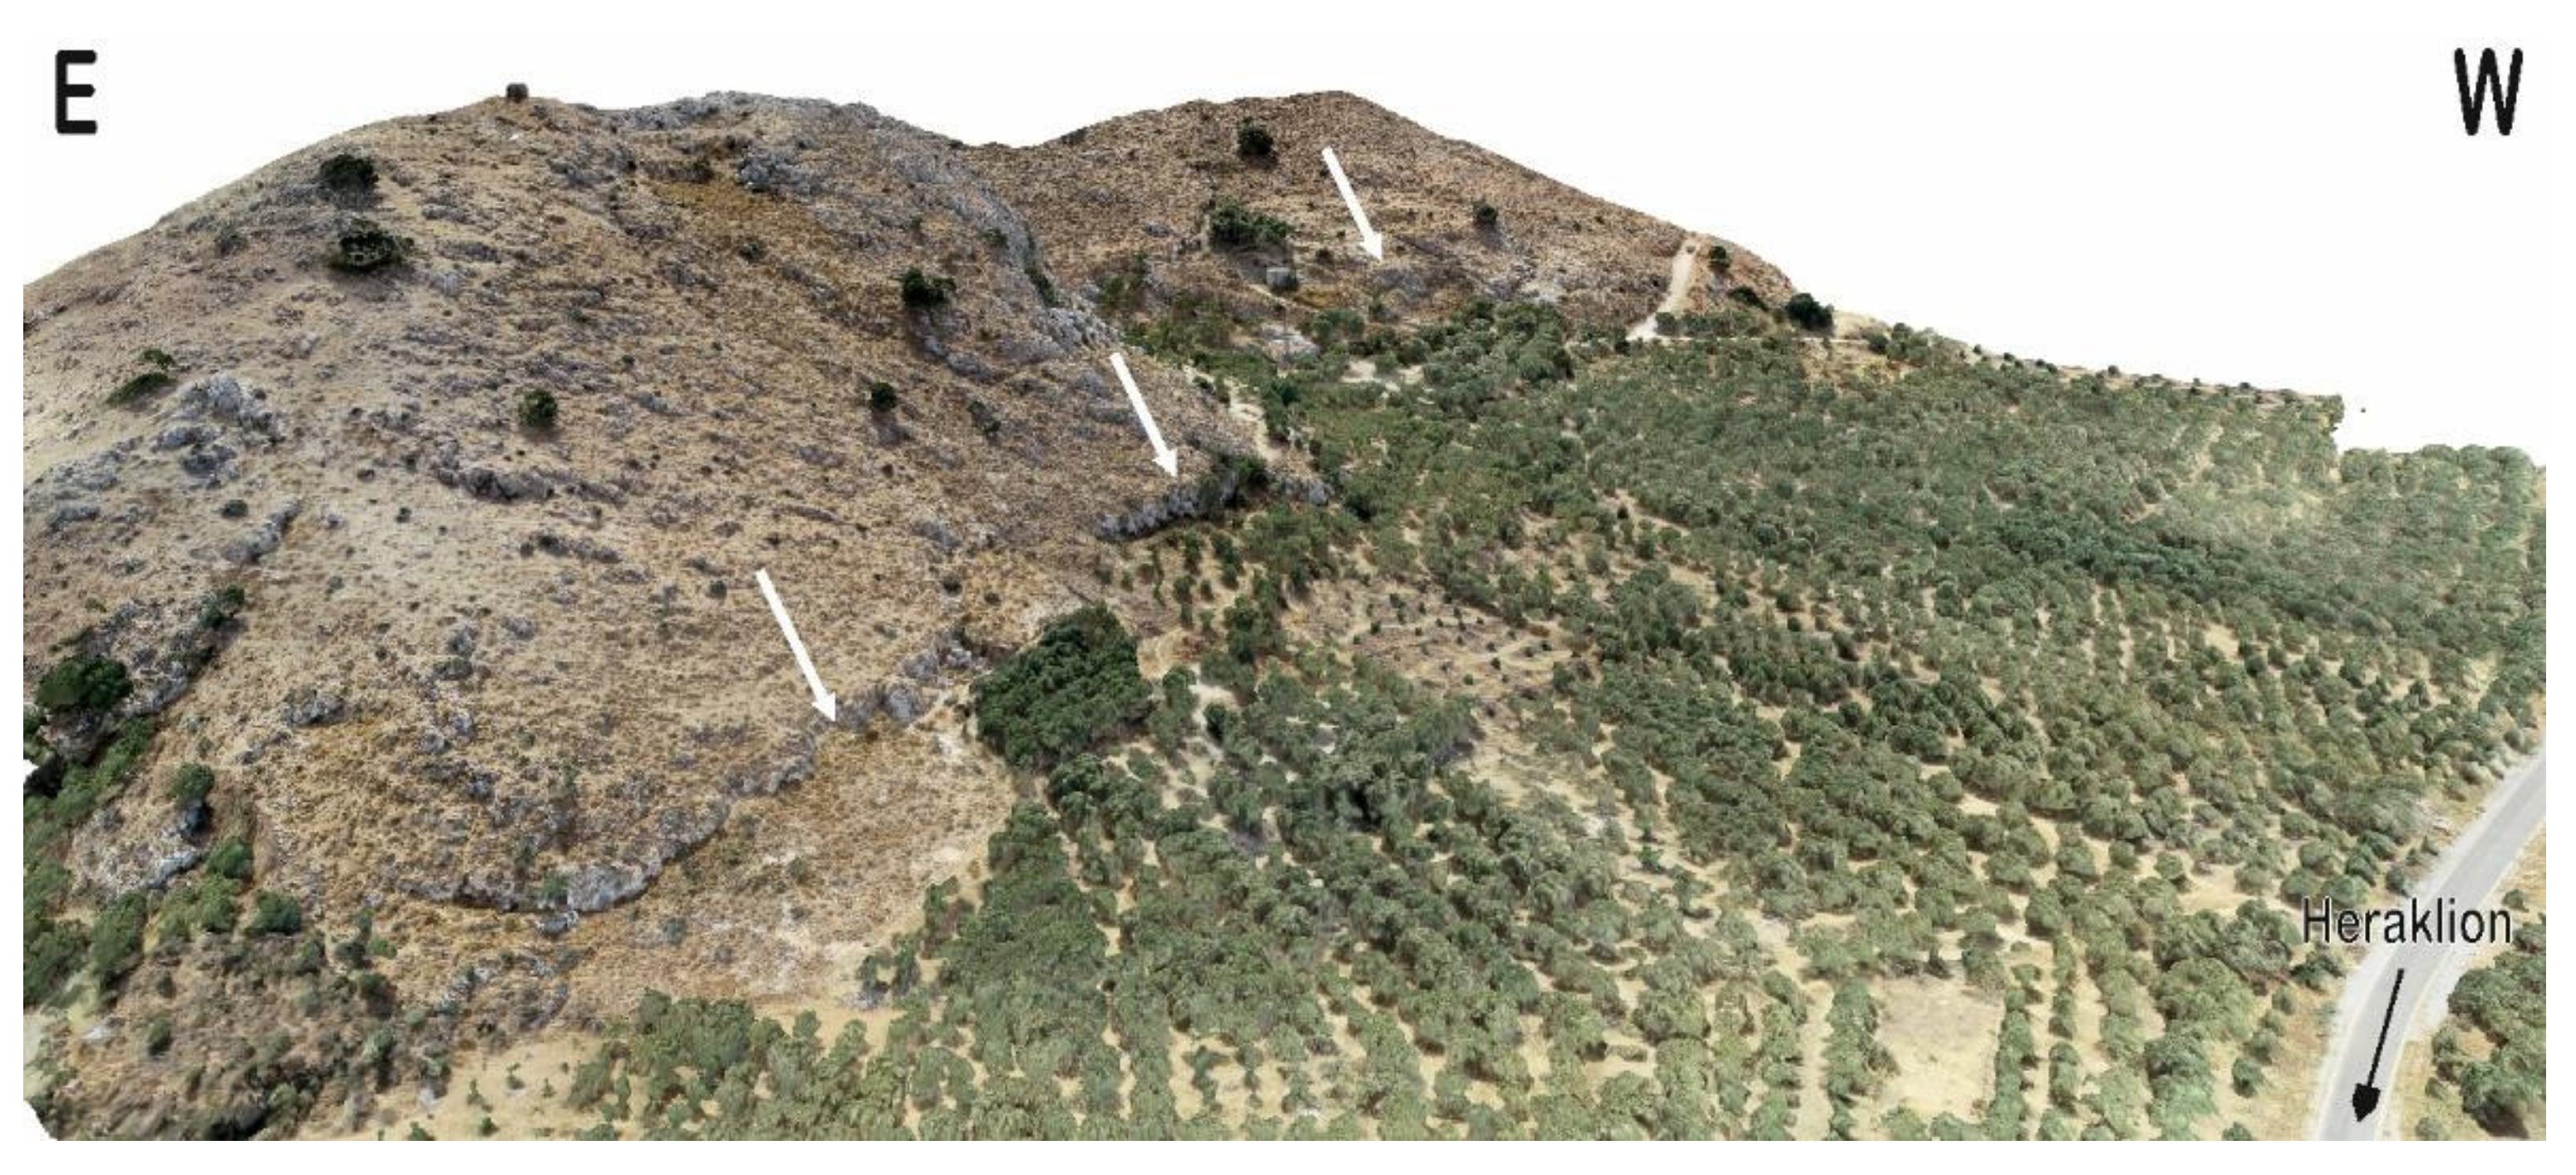
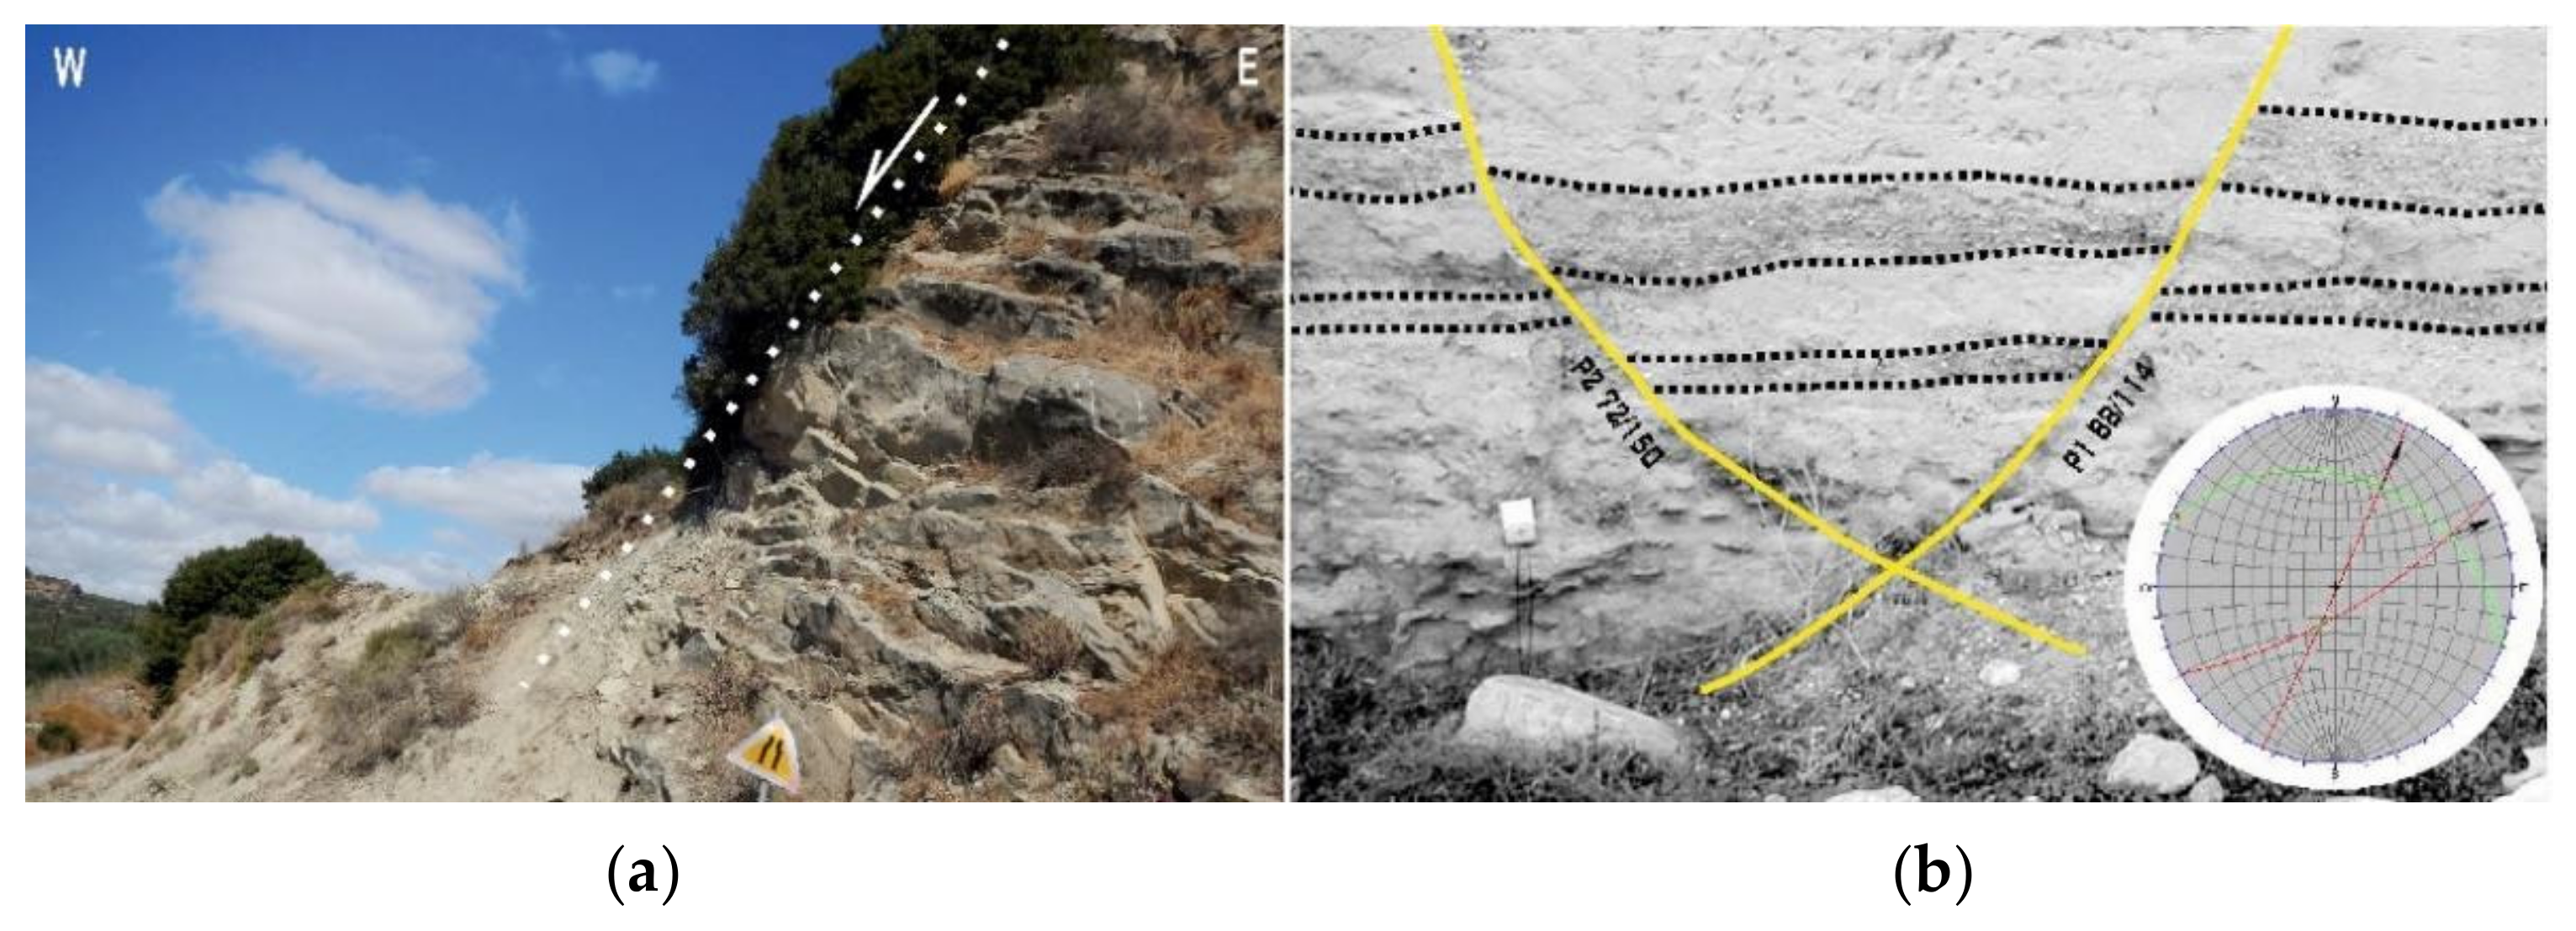
3.1. Field Mapping
3.2. Seismological Data and Methods
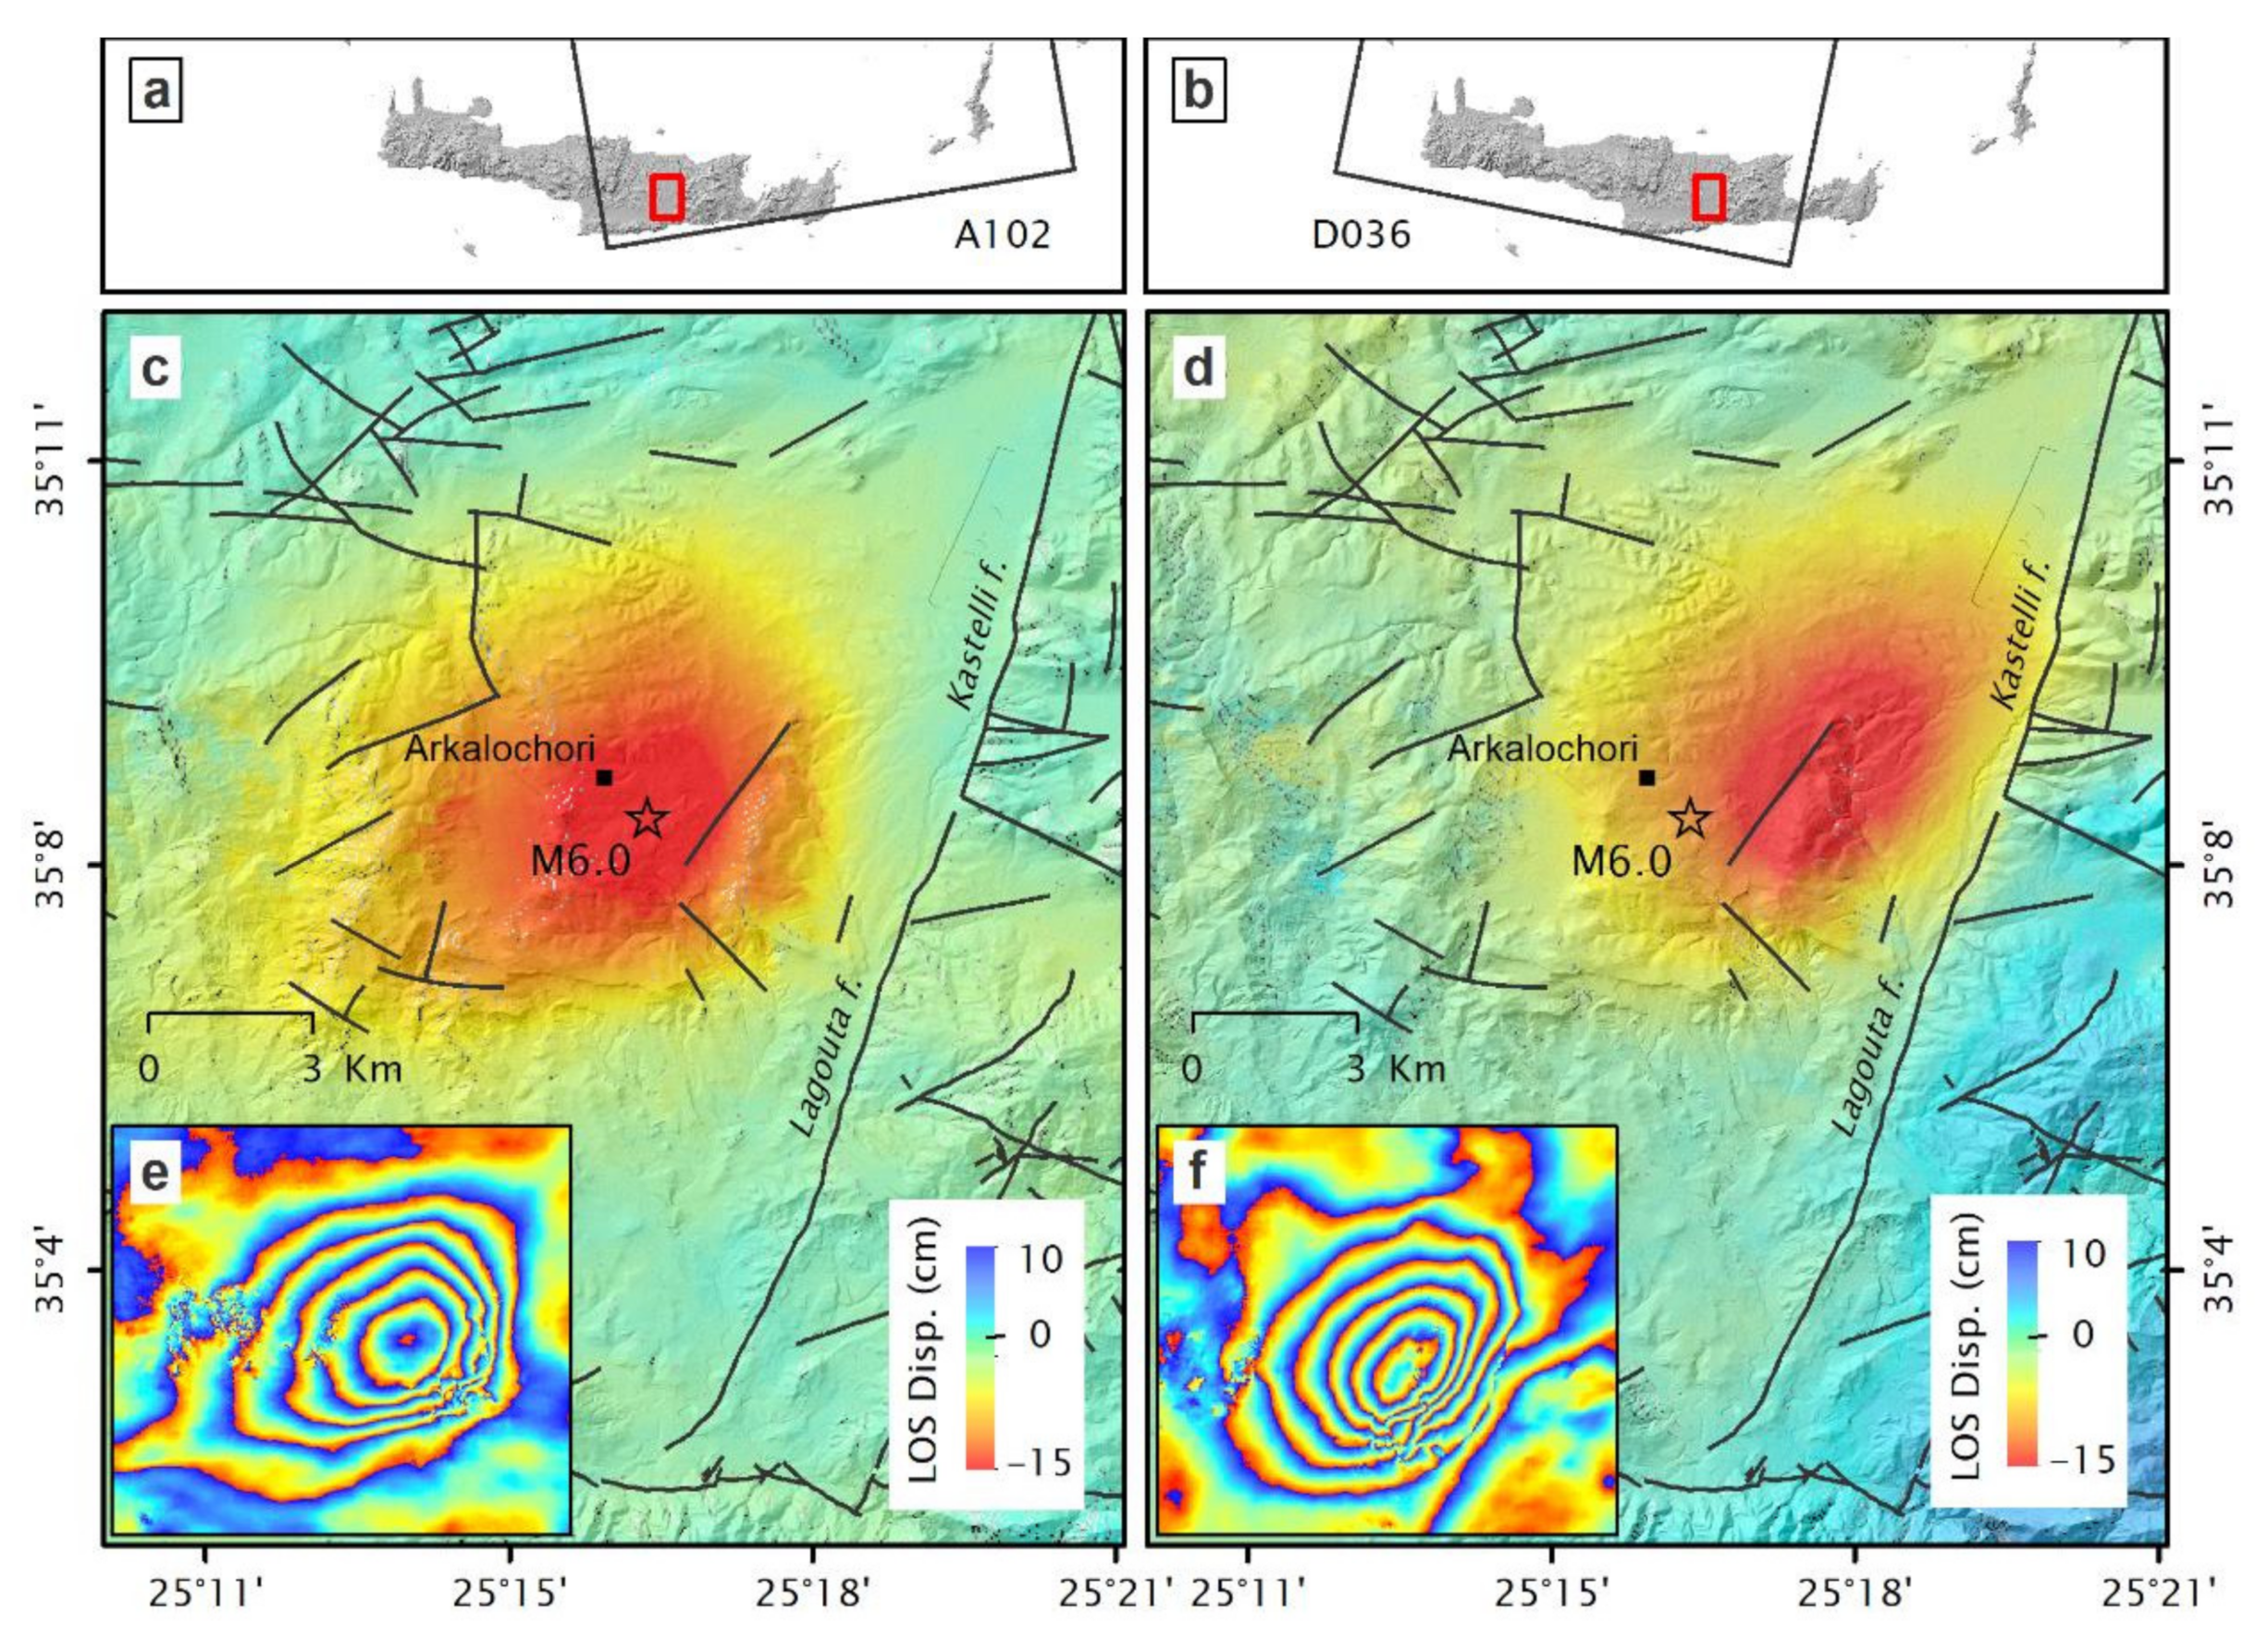
3.3. SAR Data and Interferometric Processing
4. Data Analysis and Results
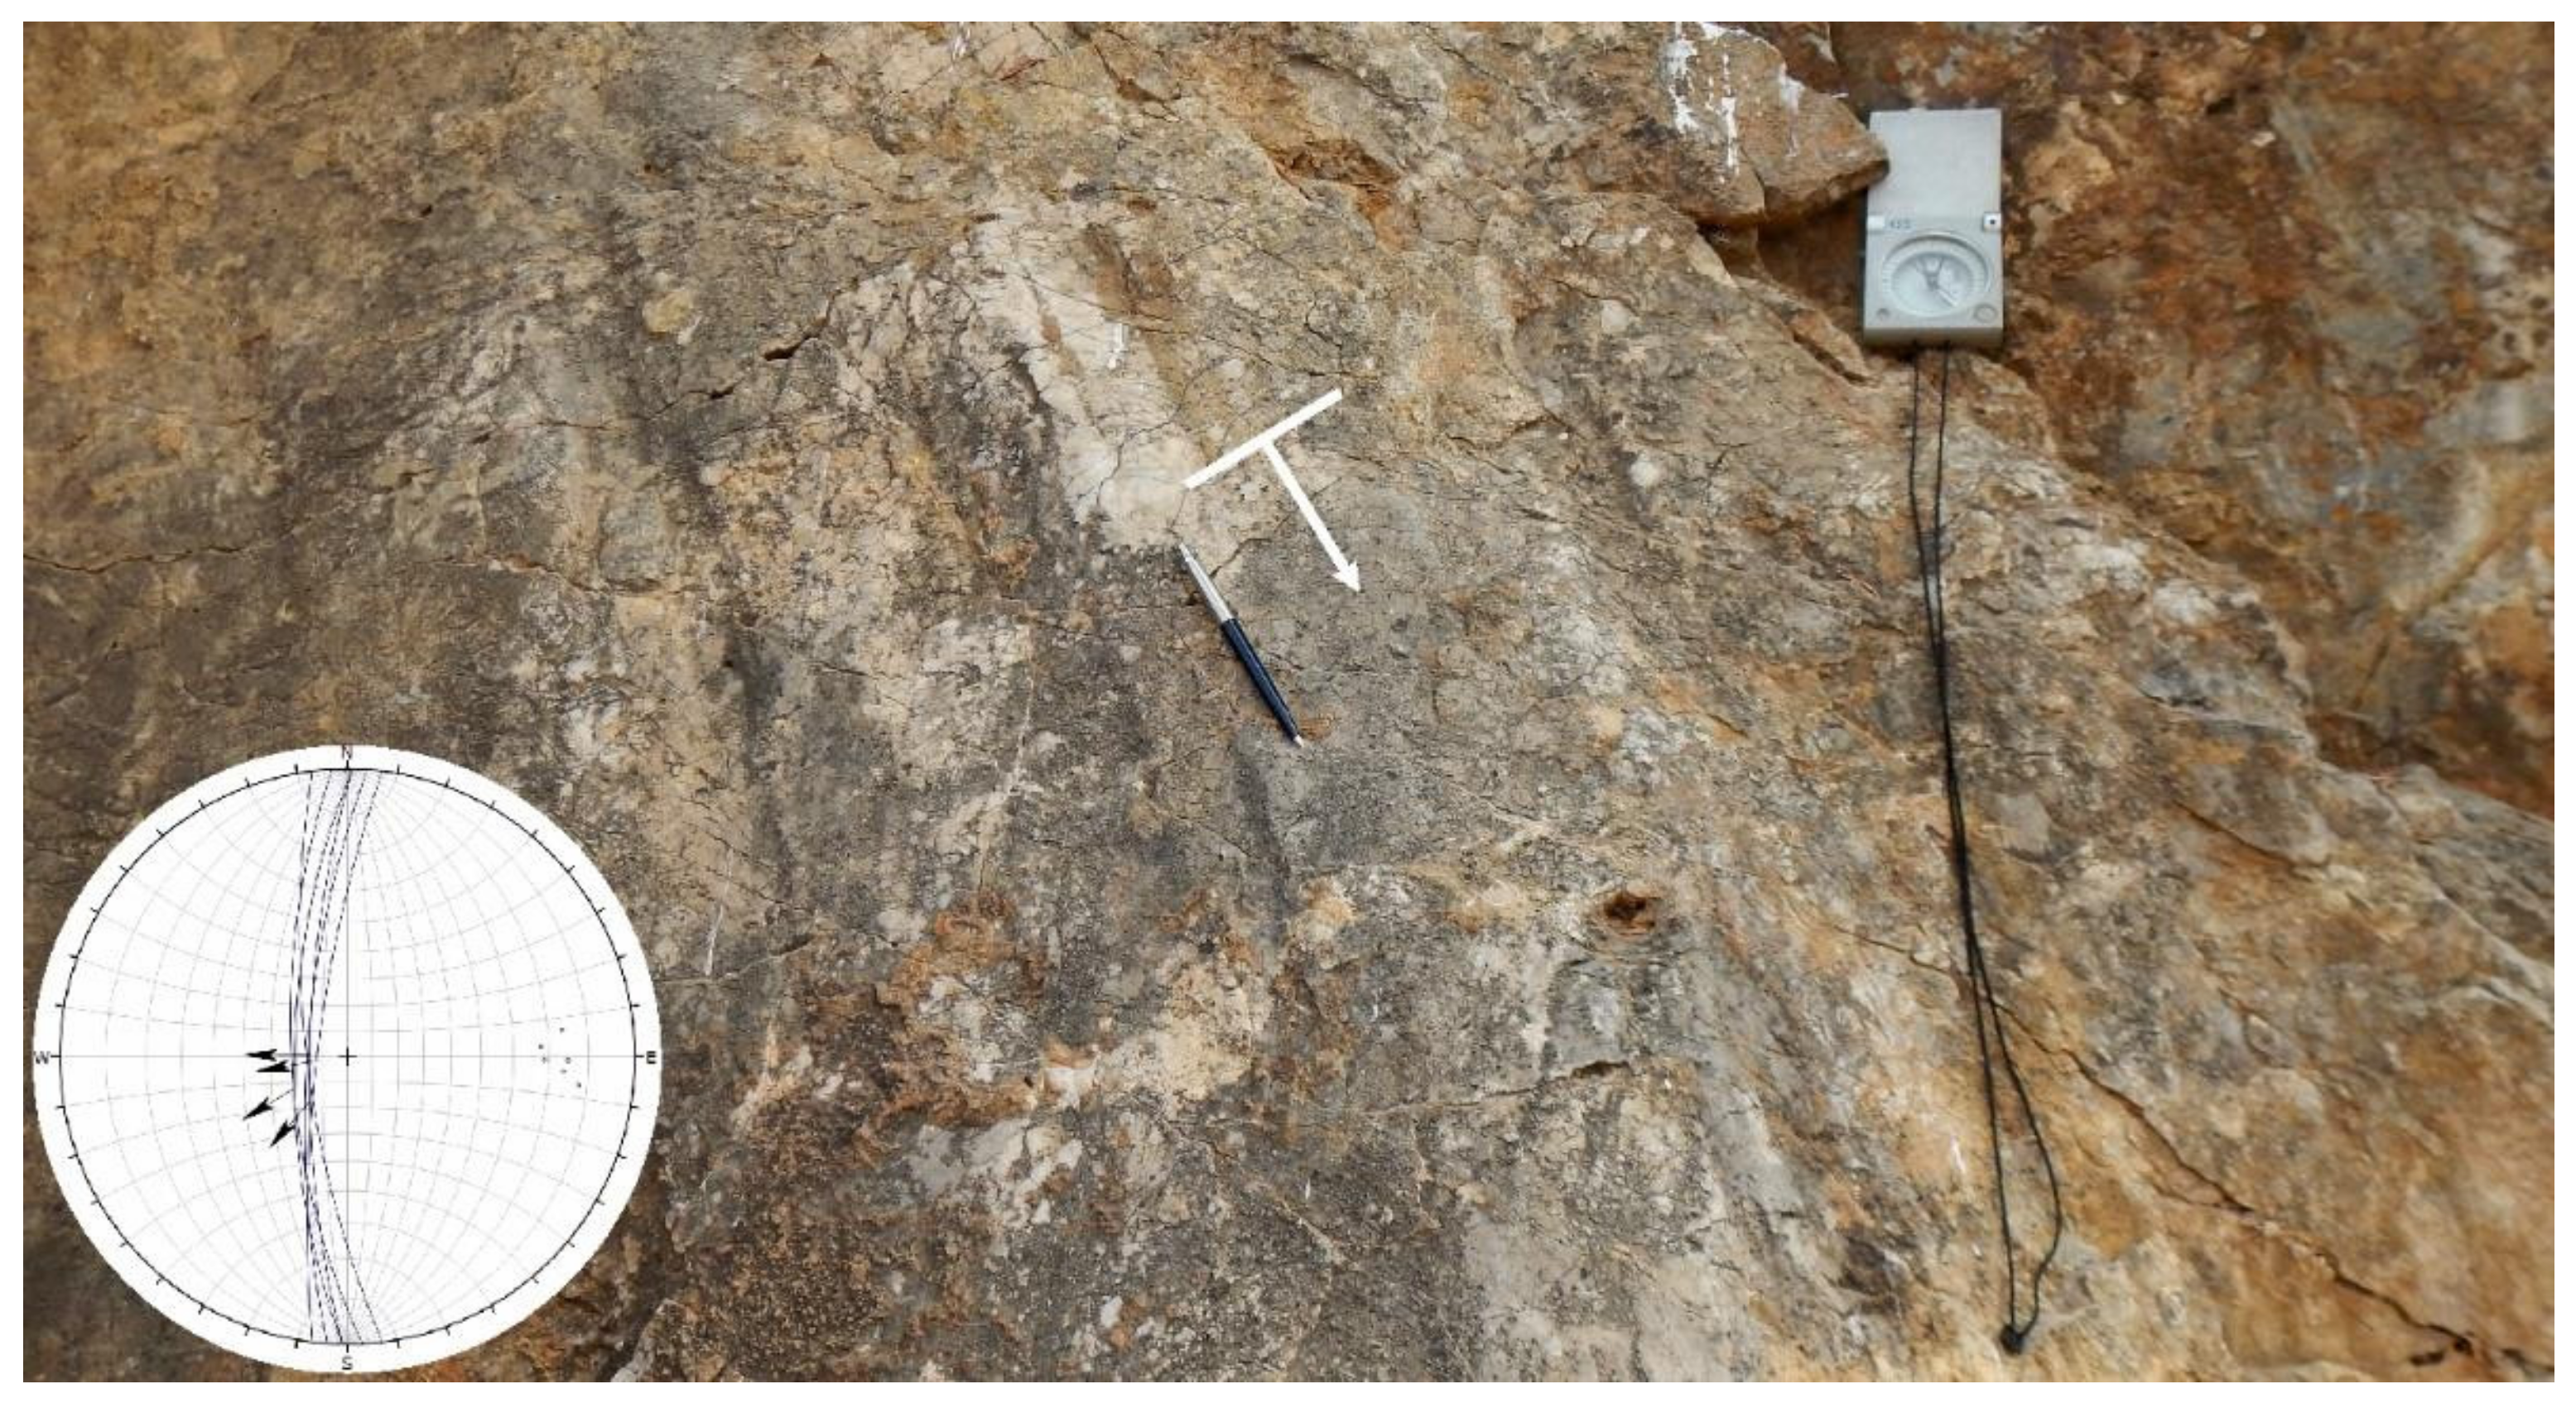
4.1. Field Data Analysis
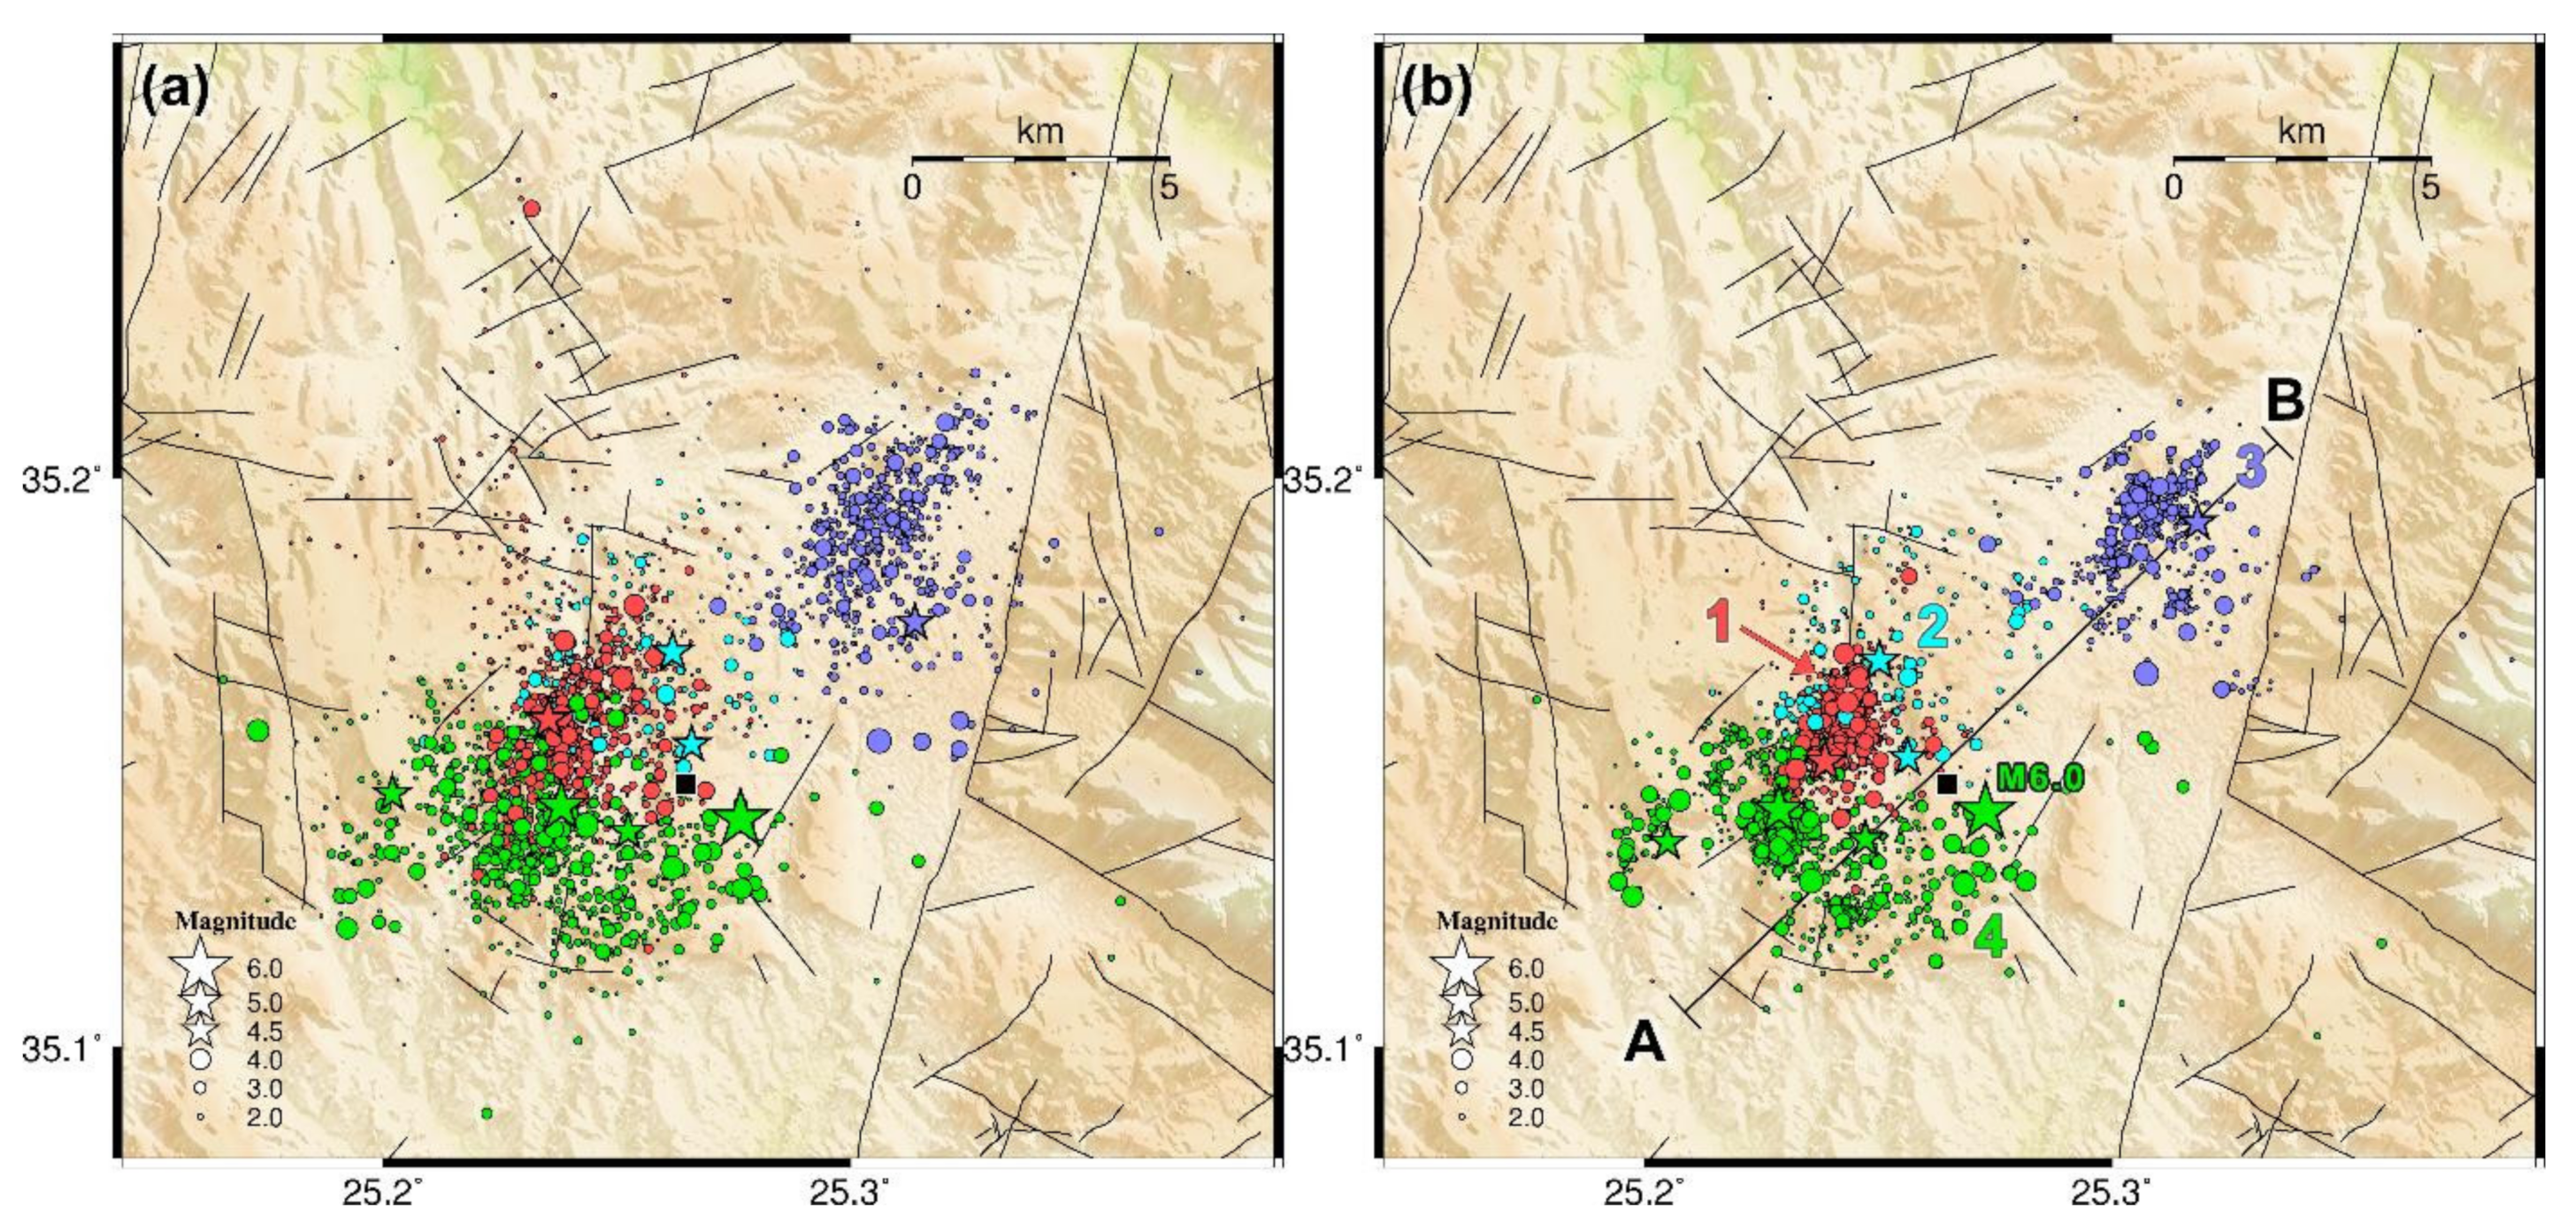
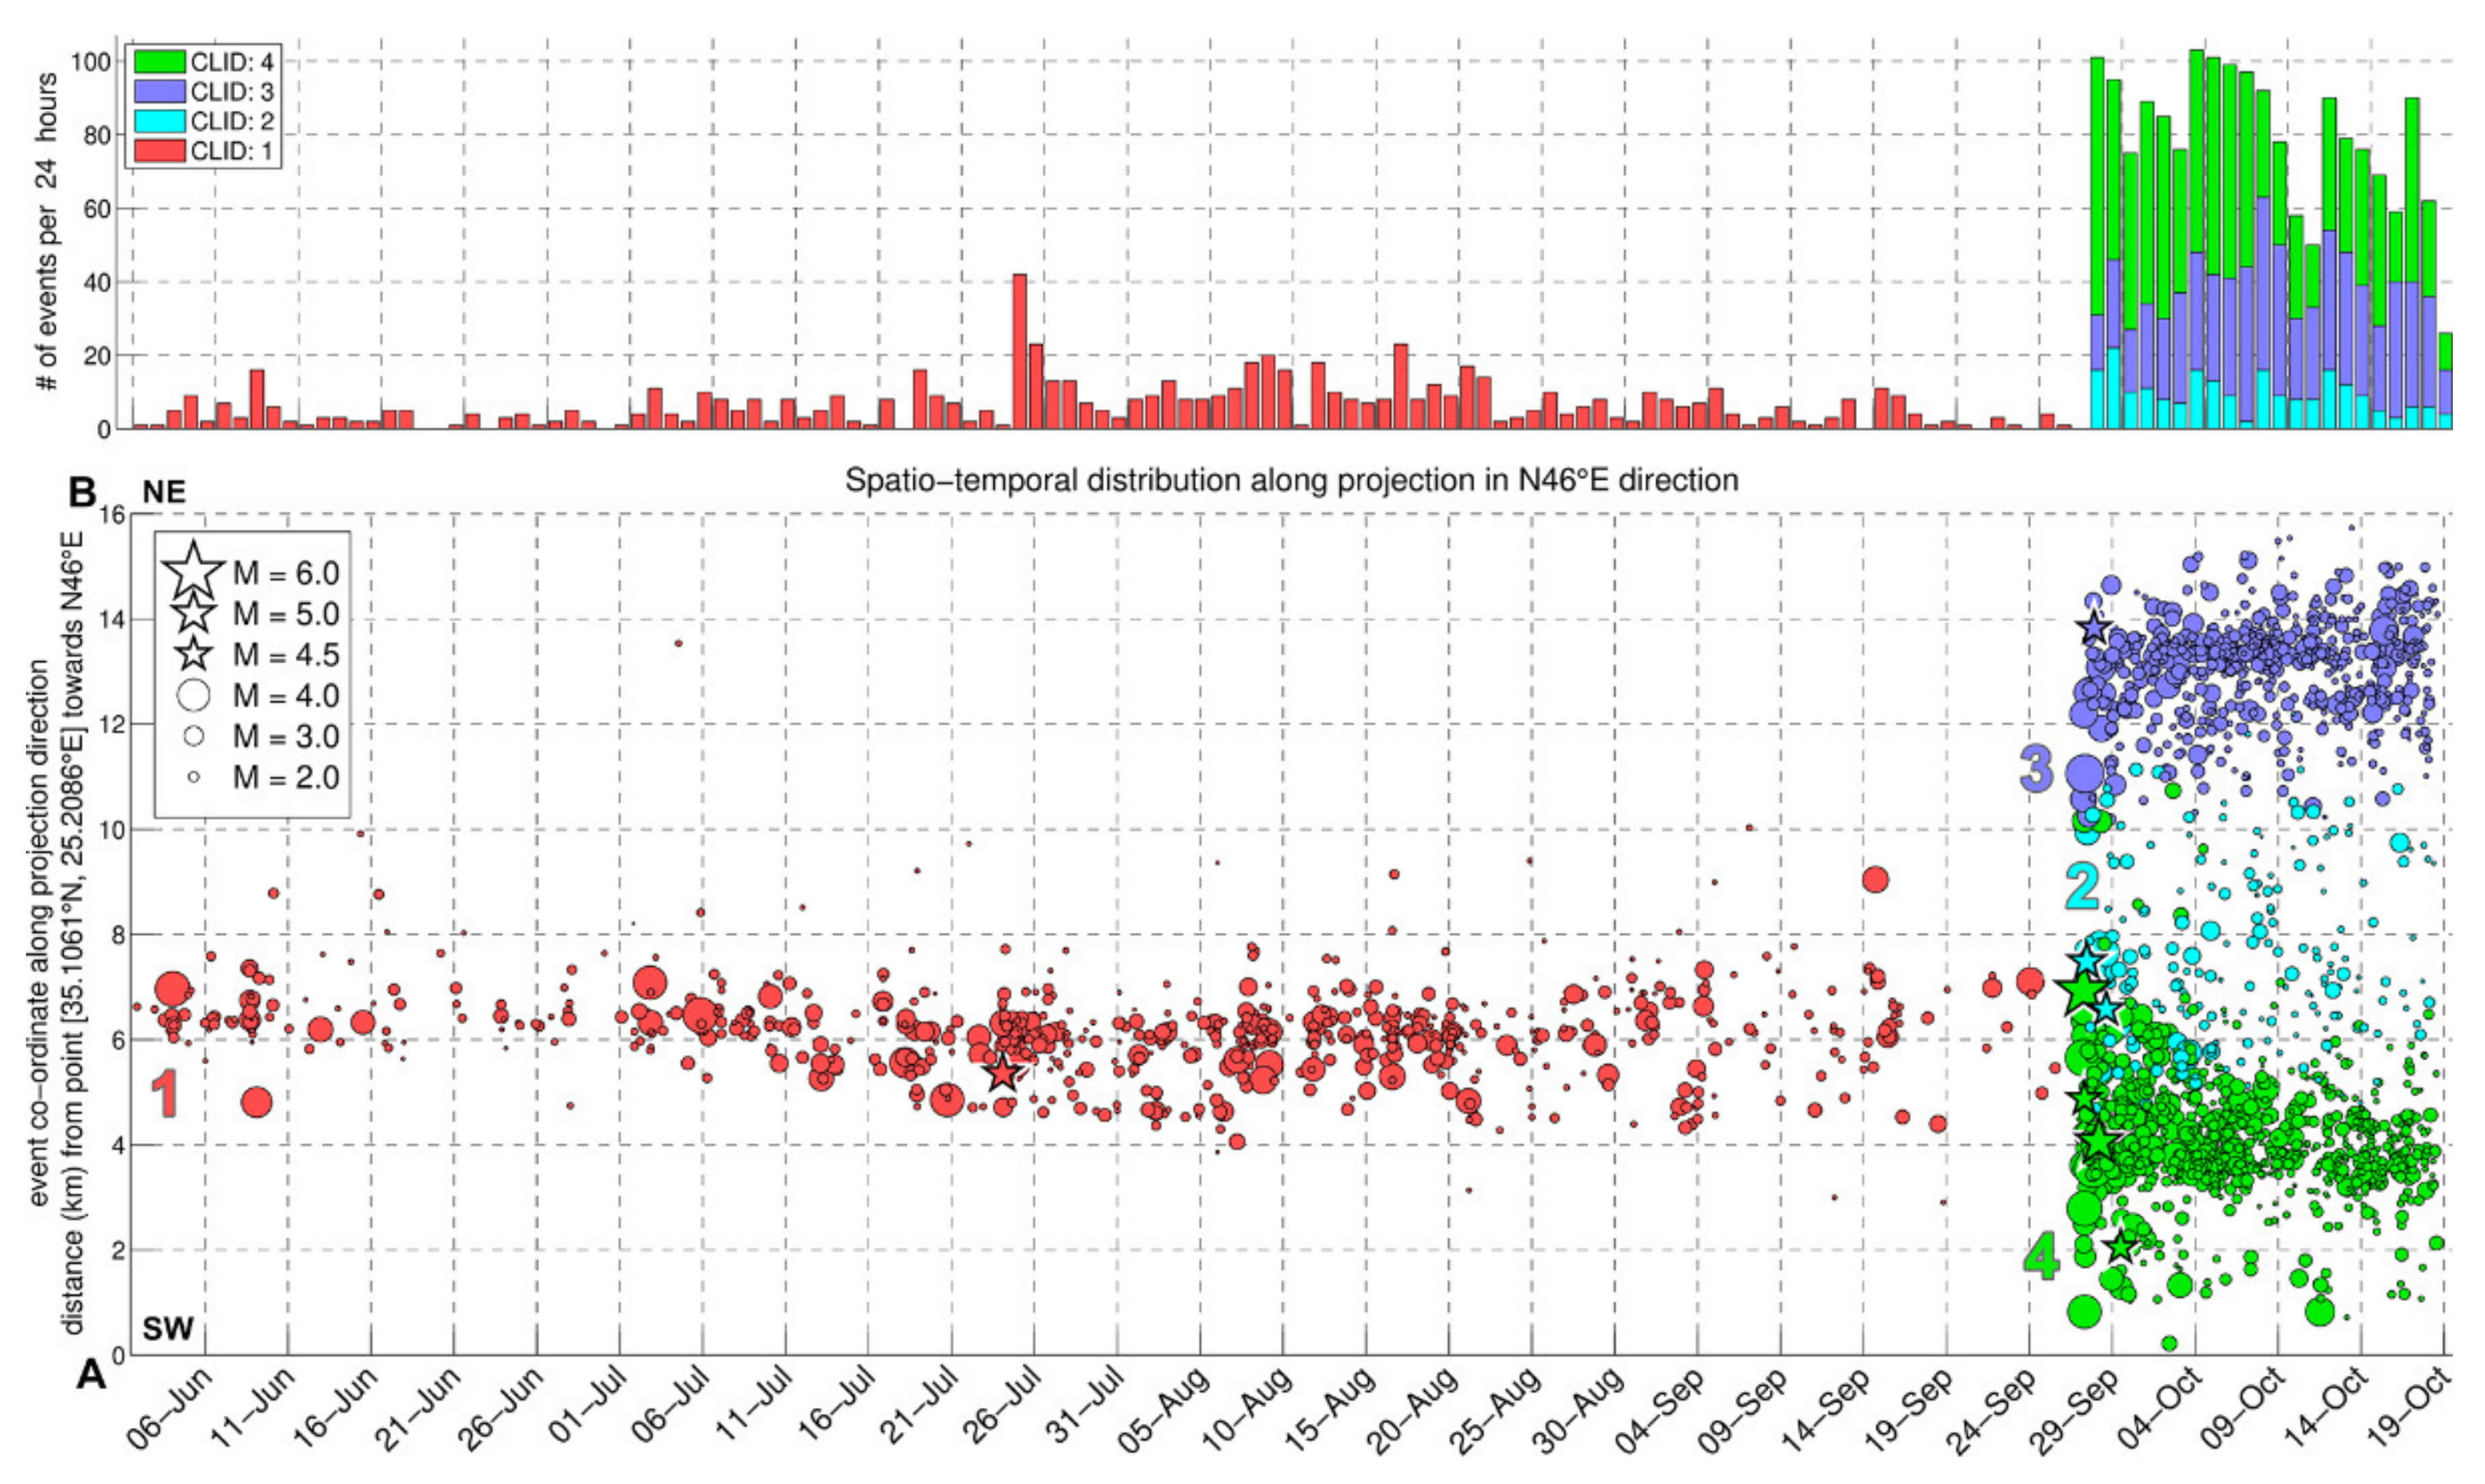
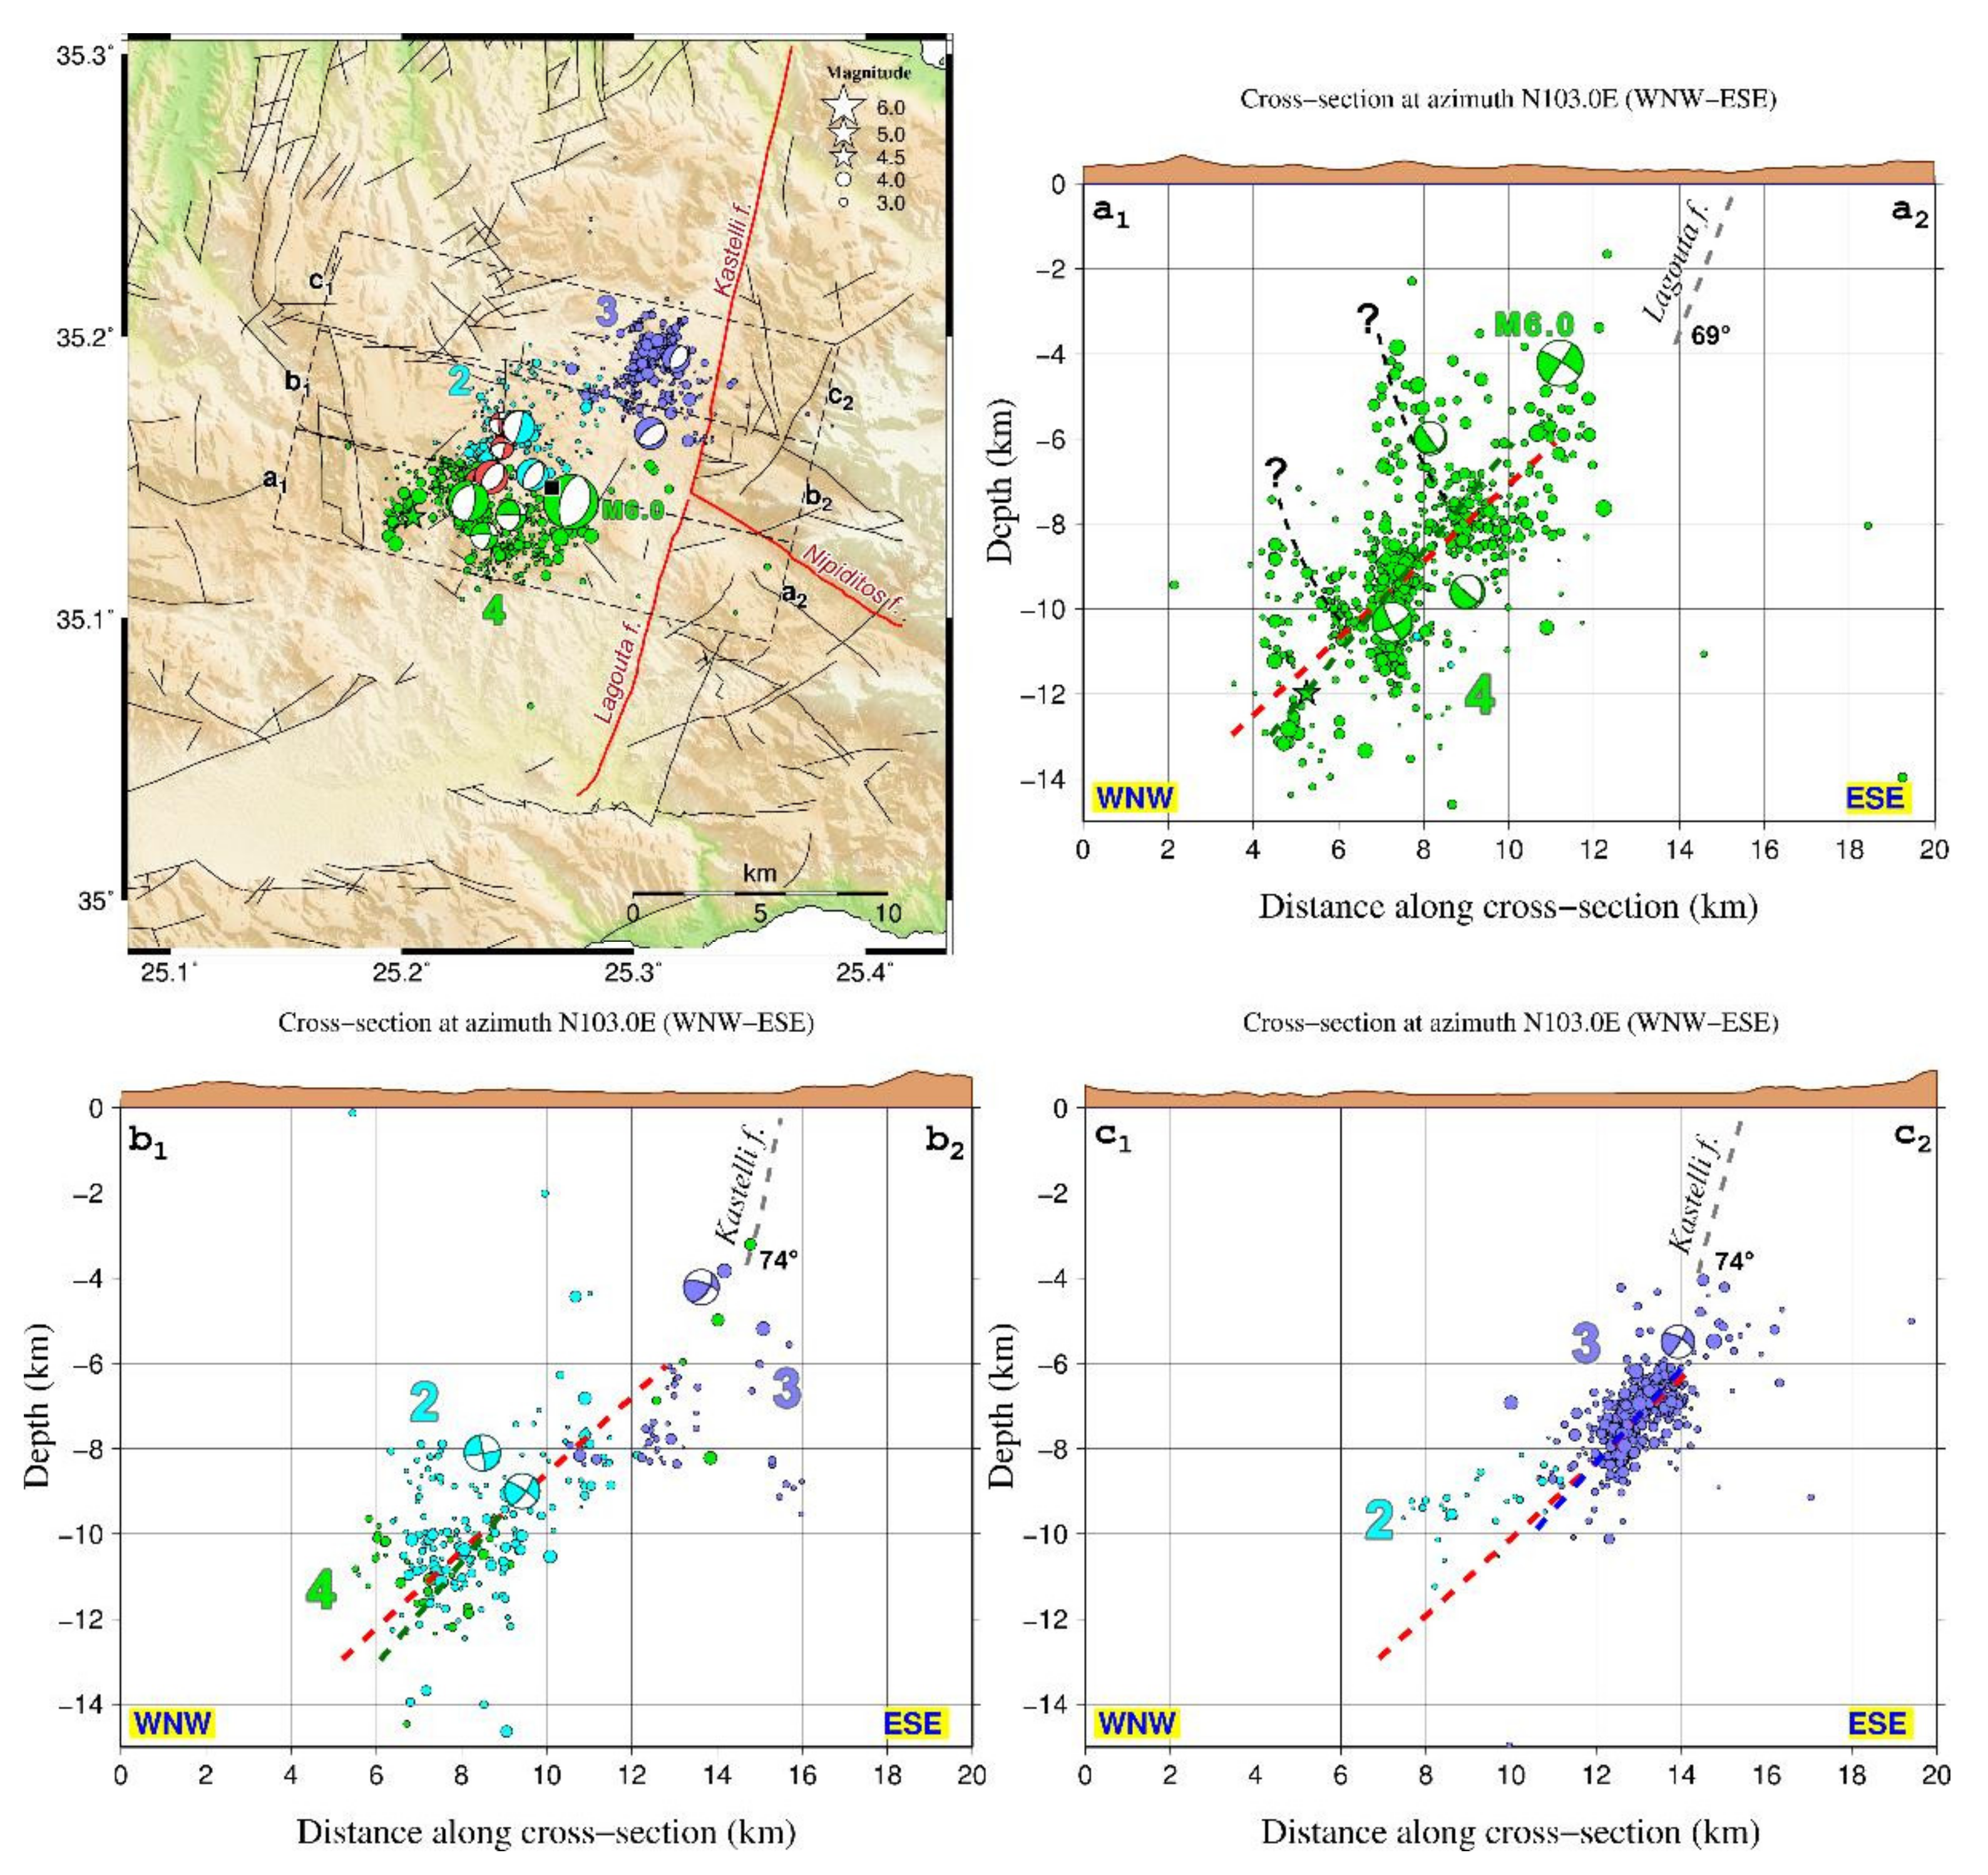
4.2. Seismological Results
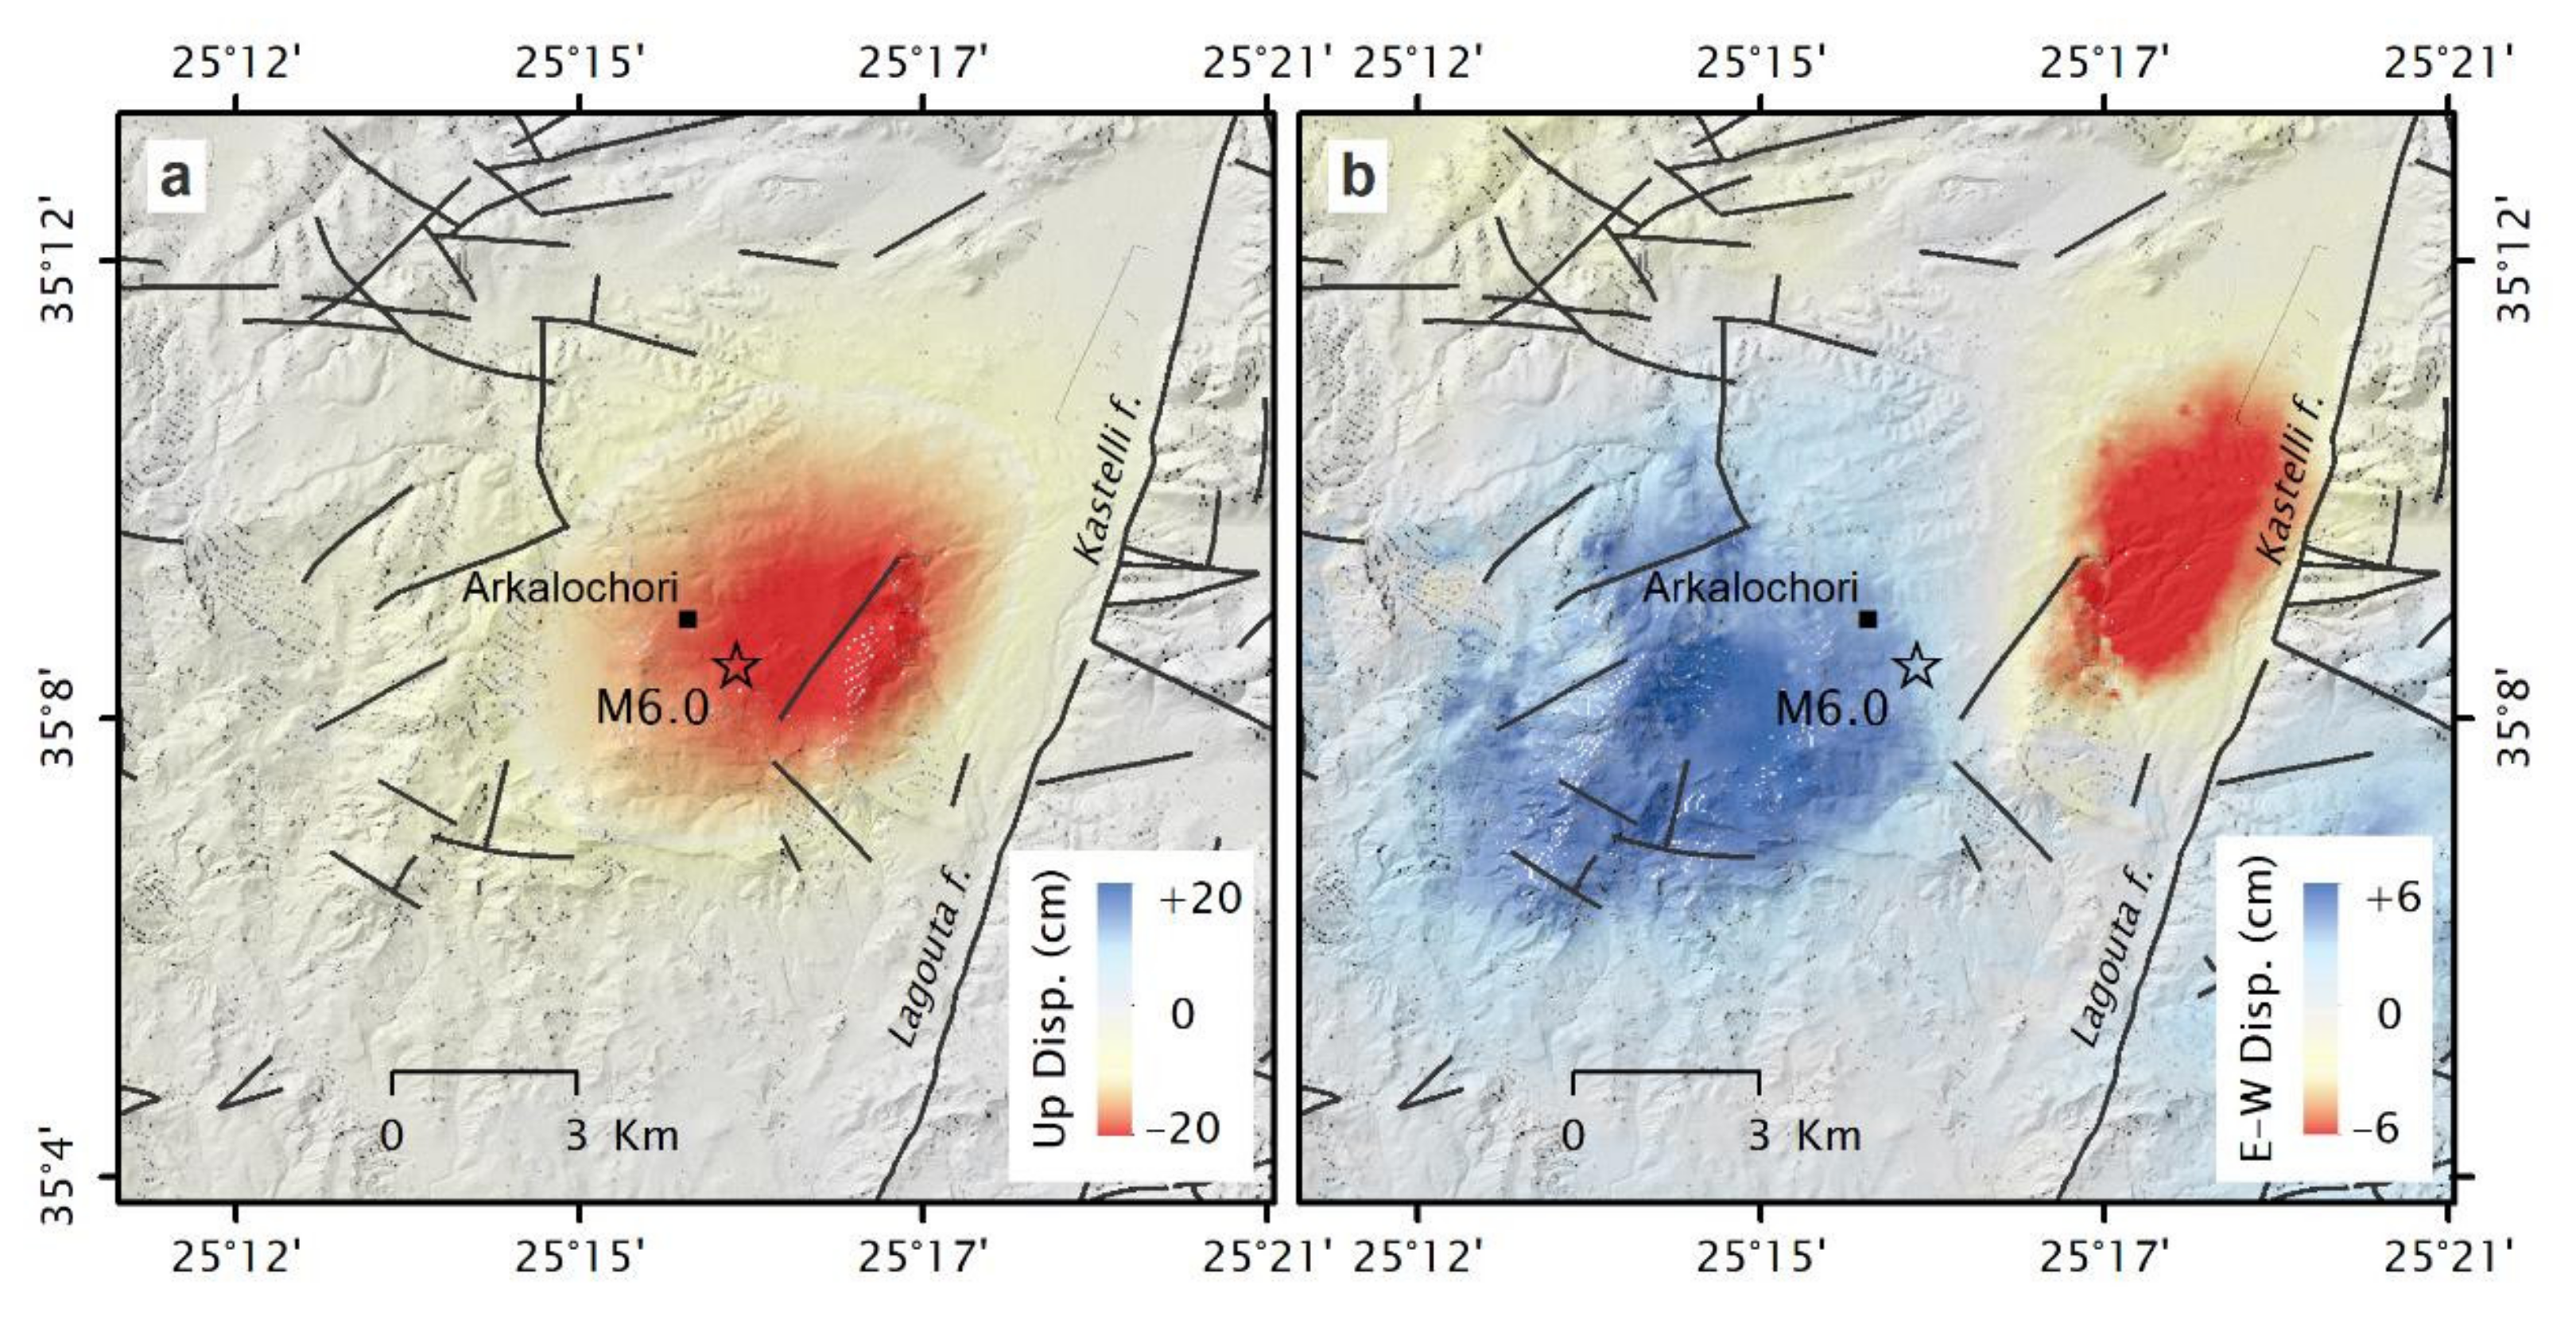
4.3. DInSAR Analysis
5. Discussion and Conclusions
Supplementary Materials
Author Contributions
Funding
Institutional Review Board Statement
Informed Consent Statement
Data Availability Statement
Acknowledgments
Conflicts of Interest
References
- Papanikolaou, D.; Vassilakis, E. Thrust faults and extensional detachment faults in Cretan tectono-stratigraphy: Implications for Middle Miocene extension. Tectonophysics 2010, 488, 233–247. [Google Scholar] [CrossRef]
- Vassilakis, E.; Alexopoulos, J. Recognition of strike-slip faulting on the supra-detachment basin of Messara (central Crete Island) with remote sensing image interpretation techniques. In Proceedings of the 4th EARSeL Workshop on Remote Sensing and Geology, Mykonos, Greece, 24–25 May 2012; pp. 108–115. [Google Scholar]
- Vassilakis, E. Study of the Tectonic Structure of Messara Basin, Central Crete, with the Aid of Remote Sensing Techniques and G.I.S. Ph.D. Thesis, National & Kapodestrian University of Athens, Athens, Greece, 2006. [Google Scholar]
- Van Hinsbergen, D.J.J.; Meulenkamp, J. Neogene supradetachment basin development on Crete (Greece) during exhumation of the South Aegean core complex. Basin Res. 2006, 18, 103–124. [Google Scholar] [CrossRef]
- Kahle, H.G.; Cocard, M.; Peter, Y.; Geiger, A.; Reilenger, R.; Barka, A.; Veis, G. GPS-derived strain rate field within the boundary zones of the Eurasian, African, and Arabian Plates. J. Geophys. Res. 2000, 105, 23353–23370. [Google Scholar] [CrossRef]
- McClusky, S.; Balassanian, S.; Barka, A.; Demir, C.; Ergintav, S.; Georgiev, I.; Gurkan, O.; Hambourger, M.; Hurst, K.; Kahle, H.-G.; et al. Global Positioning System constraints on plate kinematics and dynamic in the eastern Mediterranean and Caucasus. J. Geophys. Res. 2000, 105, 5695–5719. [Google Scholar] [CrossRef]
- Nyst, M.; Thatcher, W. New constraints on the active tectonic deformation of the Aegean. J. Geophys. Res. 2004, 109, B11406. [Google Scholar] [CrossRef] [Green Version]
- Fassoulas, C.; Kilias, A.; Mountrakis, D. Postnappe stacking extension and exhumation of HP/LT rocks in the island of Crete, Greece. Tectonics 1994, 13, 127–138. [Google Scholar] [CrossRef]
- Jolivet, L.; Goffe, B.; Monie, P.; Truffert, C.; Patriat, M.; Bonneau, M. Miocene detachment in Crete and exhumation P-T-t paths of high pressure metamorphic rocks. Tectonics 1996, 15, 1129–1153. [Google Scholar] [CrossRef]
- Ring, U.; Brachert, T.; Fassoulas, C. Middle Miocene graben development in Crete and its possible relation to large-scale detachment faults in the southern Aegean. Terra Nova 2001, 13, 297–304. [Google Scholar] [CrossRef]
- Woessner, J.; Laurentiu, D.; Giardini, D.; Crowley, H.; Cotton, F.; Grünthal, G.; Valensise, G.; Arvidsson, R.; Basili, R.; Demircioglu, M.B.; et al. The 2013 European Seismic Hazard Model: Key components and results. Bull. Earthq. Eng. 2015, 13, 3553–3596. [Google Scholar] [CrossRef] [Green Version]
- Reilinger, R.; McClusky, S.; Paradissis, D.; Ergintav, S.; Vernant, P. Geodetic constraints on the tectonic evolution of the Aegean region and strain accumulation along the Hellenic subduction zone. Tectonophysics 2010, 488, 22–30. [Google Scholar] [CrossRef]
- Ganas, A.; Oikonomou, I.A.; Tsimi, C. NOAfaults: A digital database for active faults in Greece. Bull. Geol. Soc. Greece 2017, 47, 518–530. [Google Scholar] [CrossRef] [Green Version]
- Kapetanidis, V.; Kassaras, I. Contemporary crustal stress of the Greek region deduced from earthquake focal mechanisms. J. Geodyn. 2019, 123, 55–82. [Google Scholar] [CrossRef]
- Stucchi, M.; Rovida, A.; Gomez Capera, A.A.; Alexandre, P.; Camelbeeck, T.; Demircioglu, M.B.; Gasperini, P.; Kouskouna, V.; Musson, R.M.W.; Radulian, M.; et al. The SHARE European Earthquake Catalogue (SHEEC) 1000–1899. J. Seismol. 2013, 17, 523–544. [Google Scholar] [CrossRef] [Green Version]
- Makropoulos, K.; Kaviris, G.; Kouskouna, V. An updated and extended earthquake catalogue for Greece and adjacent areas since 1900. Nat. Hazards Earth Syst. Sci. 2012, 12, 1425–1430. [Google Scholar] [CrossRef] [Green Version]
- Zachariasse, W.J.; van Hinsbergen, D.J.J.; Fortuin, A.R. Formation and fragmentation of a late Miocene supradetachment basin in central Crete: Implications for exhumation mechanisms of high-pressure rocks in the Aegean forearc. Basin Res. 2011, 23, 678–701. [Google Scholar] [CrossRef]
- Angelier, J.; Brebion, P.; Lauriat-Rage, A.; Muller, C. Late Cenozoic biostratigraphy and neotectonic evolution of Crete. Ann. Geol. Pays Hell. 1979, 1, 9–17. [Google Scholar]
- Armijo, R.; Lyon-Caen, H.; Papanastassiou, D. East-west extension and Holocene normal-fault scarps in the Hellenic arc. Geology 1992, 20, 491–494. [Google Scholar] [CrossRef]
- Caputo, R.; Catalano, S.; Monaco, C.; Romagnoli, G.; Tortorici, G.; Tortorici, L. Active faulting on the island of Crete (Greece). Geophys. J. Int. 2010, 183, 111–126. [Google Scholar] [CrossRef]
- Werner, V.; Baika, K.; Fischer, P.; Hadler, H.; Obrocki, L.; Willershäuser, T.; Tzigounaki, A.; Tsigkou, A.; Reicherter, K.; Papanikolaou, I.; et al. The sedimentary and geomorphological imprint of the AD 365 tsunami on the coasts of southwestern Crete (Greece)—Examples from Sougia and Palaiochora. Quat. Int. 2018, 473, 66–90. [Google Scholar] [CrossRef]
- Papazachos, B.C.; Papazachou, C.B. The Earthquakes of Greece; Ziti: Thessaloniki, Greece, 2003; p. 304. [Google Scholar]
- Guidoboni, E.; Comastri, A. Catalogue of Earthquakes and Tsunamis in the Mediterranean Area from the 11th to the 15th Century; INGV-SGA: Roma, Italy, 2005; p. 1037. [Google Scholar]
- Tsapanos, T.M. A seismic hazard scenario for the main cities of Crete island, Greece. Geophys. J. Int. 2003, 153, 403–408. [Google Scholar] [CrossRef] [Green Version]
- Vallianatos, F.; Michas, G.; Hloupis, G.; Chatzopoulos, G. The Evolution of Preseismic Patterns Related to the Central Crete (Mw6.0) Strong Earthquake on 27 September 2021 Revealed by Multiresolution Wavelets and Natural Time Analysis. Geosciences 2022, 12, 33. [Google Scholar] [CrossRef]
- Triantafyllou, I.; Karavias, A.; Koukouvelas, I.; Papadopoulos, G.A.; Parcharidis, I. The Crete Isl. (Greece) Mw6.0 Earthquake of 27 September 2021: Expecting the Unexpected. GeoHazards 2022, 3, 106–124. [Google Scholar] [CrossRef]
- ITSAK. Arkalochori Earthquakes, Μ 6.0 on 27/09/2021 & Μ 5.3 on 28/09/2021: Preliminary Report—Recordings of the ITSAK Accelerometric Network and Damage on the Natural and Built Environment; ITSAK Research Unit: Thessaloniki, Greece, 2021; p. 44. (In Greek) [Google Scholar]
- EPPO. New National Building Code; EPPO: Athens, Greece, 2003; p. 72. [Google Scholar]
- Delibasis, N.D.; Ziazia, M.; Voulgaris, N.; Papadopoulos, T.; Stavrakakis, G.N.; Papanastassiou, D.; Drakatos, G. Microseismic activity and seismotectonics of Heraklion Area (central Crete Island, Greece). Tectonophysics 1999, 308, 237–248. [Google Scholar] [CrossRef] [Green Version]
- Dula, W.F., Jr. Geometric Models of Listric Normal Faults and Rollover Folds1. AAPG Bull. 1991, 75, 1609–1625. [Google Scholar] [CrossRef]
- Williams, G.; Vann, I. The geometry of listric normal faults and deformation in their hangingwalls. J. Struct. Geol. 1987, 9, 789–795. [Google Scholar] [CrossRef]
- Wernicke, B.; Burchfiel, B.C. Modes of extensional tectonics. J. Struct. Geol. 1982, 4, 105–115. [Google Scholar] [CrossRef] [Green Version]
- Papanikolaou, D.; Vassilakis, E. Middle Miocene E-W tectonic horst structure of Crete through extensional detachment faults. Earth Environ. Sci. 2008, 2, 012003. [Google Scholar] [CrossRef] [Green Version]
- Faccenna, C.; Jolivet, L.; Piromallo, C.; Morelli, A. Subduction and the depth of convection in the Mediterranean mantle. J. Geophys. Res. 2003, 108, 2099. [Google Scholar] [CrossRef]
- Brun, J.-P.; Faccenna, C. Exhumation of high-pressure rocks driven by slab rollback. Earth Planet. Sci. Lett. 2008, 272, 1–7. [Google Scholar] [CrossRef] [Green Version]
- Kaviris, G.; Fountoulakis, I.; Spingos, I.; Millas, C.; Papadimitriou, P.; Drakatos, G. Mantle dynamics beneath Greece from SKS and PKS seismic anisotropy study. Acta Geophys. 2018, 66, 1341–1357. [Google Scholar] [CrossRef]
- Royden, L.H.; Papanikolaou, D.J. Slab segmentation and late Cenozoic disruption of the Hellenic arc. Geochem. Geophys. Geosyst. 2011, 12, Q03010. [Google Scholar] [CrossRef]
- Peterek, A.; Schwarze, J. Architecture and Late Pliocene to recent evolution of outer-arc basins of the Hellenic subduction zone (south-central Crete, Greece). J. Geodyn. 2004, 38, 19–55. [Google Scholar] [CrossRef]
- Becker, D.; Meier, T.; Bohnhoff, M.; Harjes, H.P. Seismicity at the convergent plate boundary offshore Crete, Greece, observed by an amphibian network. J. Seismol. 2010, 14, 369–392. [Google Scholar] [CrossRef] [Green Version]
- Kokinou, E.; Vallianatos, F. Seismic velocity Structure and Waveform Modelling in the southern Hellenic Arc (offshore Crete). In Proceedings of the 2nd IASME/WSEAS International Conference on Geology and Seismology (GES’08), Cambridge, UK, 23–25 February 2008. [Google Scholar]
- Vassilakis, E.; Alexopoulos, J.; Farangitakis, G.P. Combination of Earth Observation and Seismic Reflection Data Analysis for the Definition of Strike Slip Fault Zones in Central Crete. In Proceedings of the EGU2020, Vienna, Austria, 4–8 May 2020. [Google Scholar]
- Kaviris, G.; Papadimitriou, P.; Kravvariti, P.; Kapetanidis, V.; Karakonstantis, A.; Voulgaris, N.; Makropoulos, K. A detailed seismic anisotropy study during the 2011–2012 unrest period in the Santorini Volcanic Complex. Phys. Earth Planet. Inter. 2015, 238, 51–88. [Google Scholar] [CrossRef]
- Papadimitriou, P.; Kapetanidis, V.; Karakonstantis, A.; Kaviris, G.; Voulgaris, N.; Makropoulos, K. The Santorini Volcanic Complex: A detailed multi-parameter seismological approach with emphasis on the 2011–2012 unrest period. J. Geodyn. 2015, 85, 32–57. [Google Scholar] [CrossRef]
- Kokinou, E.; Moisidi, M.; Tsanaki, I.; Tsakalaki, E.; Tsiskaki, E.; Sarris, A.; Vallianatos, F. A seismotectonic study for the Heraklion basin in Crete (Southern Hellenic arc, Greece). Int. J. Geol. 2008, 2, 9–16. [Google Scholar]
- Floyd, M.A.; Billiris, H.; Paradissis, D.; Veis, G.; Avallone, A.; Briole, P.; McClusky, S.; Nocquet, J.M.; Palamartchouk, K.; Parsons, B.; et al. A new velocity field for Greece: Implications for the kinematics and dynamics of the Aegean. J. Geophys. Res. 2010, 115, B10403. [Google Scholar] [CrossRef]
- Hatzfeld, D.; Besnard, M.; Makropoulos, K.; Hatzidimitriou, P. Microearthquake seismicity and fault-plane solutions in the southern Aegean and its geodynamic implications. Geophys. J. Int. 1993, 115, 799–818. [Google Scholar] [CrossRef] [Green Version]
- Sakellariou, D.; Mascle, J.; Lykousis, V. Strike slip tectonics and transtensional deformation in the Aegean region and the Hellenic arc: Preliminary results. Bull. Geol. Soc. Greece 2017, 47, 647. [Google Scholar] [CrossRef] [Green Version]
- De Chabalier, J.B.; Lyon-Caen, H.; Zollo, A.; Deschamps, A.; Bernard, P.; Hatzfeld, D. A detailed analysis of microearthquakes in western Crete from digital three-component seismograms. Geophys. J. Int. 1992, 110, 347–360. [Google Scholar] [CrossRef] [Green Version]
- Yamaji, A.; Sato, K. Multiple Inverse Method Software Package User’s Guide, v. 4.0; Kyoto University: Kyoto, Japan, 2004.
- Technological Educational Institute of Crete. Seismological Network of Crete; 10.7914/SN/HC; International Federation of Digital Seismograph Networks: Crete, Greece, 2006. [Google Scholar]
- National Observatory of Athens, Institute of Geodynamics. National Observatory of Athens Seismic Network; 10.7914/SN/HL; International Federation of Digital Seismograph Networks: Athens, Greece, 1975. [Google Scholar]
- Klein, F.W. User’s Guide to HYPOINVERSE-2000, a Fortran Program to Solve for Earthquake Locations and Magnitudes, 2002-171; United States Department Of The Interior Geological Survey: Menlo Park, CA, USA, 2002; 123.
- Chatelain, J.L. Etude Fine de la Sismicité en Zone de Collision Continentale au Moyen d’un Réseau de Stations Portables: La Région Hindu-Kush Pamir. Doctoral Dissertation, Université Scientifique et Médicale de Grenoble, Grenoble, France, 1978. [Google Scholar]
- Waldhauser, F. hypoDD-A Program to Compute Double-Difference Hypocenter Locations, open-file report, 01-113; U.S. Geological Survey: Menlo Park, CA, USA, 2001.
- Kapetanidis, V. Spatiotemporal Patterns of Microseismicity for the Identification of Active Fault Structures Using Seismic Waveform Cross-Correlation and Double-Difference Relocation. Doctoral Dissertation, University of Athens, Athens, Greece, 2017. [Google Scholar]
- Massonnet, D.; Rossi, M.; Carmona, C.; Adragna, F.; Peltzer, G.; Feigl, K.; Rabaute, T. The displacement field of the Landers earthquake mapped by radar interferometry. Nature 1993, 364, 138–142. [Google Scholar] [CrossRef]
- Papadaki, E.S. Monitoring subsidence at Messara basin using radar interferometry. Environ. Earth Sci. 2014, 72, 1965–1977. [Google Scholar] [CrossRef]
- Svigkas, N.; Atzori, S.; Kiratzi, A.; Tolomei, C.; Salvi, S. Isolation of swarm sources using InSAR: The case of the February 2017 seismic swarm in western Anatolia (Turkey). Geophys. J. Int. 2019, 217, 1479–1495. [Google Scholar] [CrossRef]
- Elias, P.; Spingos, I.; Kaviris, G.; Karavias, A.; Gatsios, T.; Sakkas, V.; Parcharidis, I. Combined Geodetic and Seismological Study of the December 2020 Mw = 4.6 Thiva (Central Greece) Shallow Earthquake. Appl. Sci. 2021, 11, 5947. [Google Scholar] [CrossRef]
- Cornou, C.; Ampuero, J.-P.; Aubert, C.; Audin, L.; Baize, S.; Billant, J.; Brenguier, F.; Causse, M.; Chlieh, M.; Combey, A.; et al. Rapid response to the Mw 4.9 earthquake of November 11, 2019 in Le Teil, Lower Rhône Valley, France. Comptes Rendus. Géosci. 2021, 353, 441–463. [Google Scholar] [CrossRef]
- Karakostas, V.; Papazachos, C.; Papadimitriou, E.; Foumelis, M.; Kiratzi, A.; Pikridas, C.; Kostoglou, A.; Kkallas, C.; Chatzis, N.; Bitharis, S.; et al. The March 2021 Tyrnavos, central Greece, doublet (Μw6.3 and Mw6.0): Aftershock relocation, faulting details, coseismic slip and deformation. Bull. Geol. Soc. Greece 2021, 58, 131–178. [Google Scholar] [CrossRef]
- Kaviris, G.; Elias, P.; Kapetanidis, V.; Serpetsidaki, A.; Karakonstantis, A.; Plicka, V.; De Barros, L.; Sokos, E.; Kassaras, I.; Sakkas, V.; et al. The Western Gulf of Corinth (Greece) 2020–2021 Seismic Crisis and Cascading Events: First Results from the Corinth Rift Laboratory Network. Seism. Rec. 2021, 1, 85–95. [Google Scholar] [CrossRef]
- Tolomei, C.; Caputo, R.; Polcari, M.; Famiglietti, N.A.; Maggini, M.; Stramondo, S. The Use of Interferometric Synthetic Aperture Radar for Isolating the Contribution of Major Shocks: The Case of the March 2021 Thessaly, Greece, Seismic Sequence. Geosciences 2021, 11, 191. [Google Scholar] [CrossRef]
- Foumelis, M.; Papazachos, C.; Papadimitriou, E.; Karakostas, V.; Ampatzidis, D.; Moschopoulos, G.; Kostoglou, A.; Ilieva, M.; Minos-Minopoulos, D.; Mouratidis, A.; et al. On rapid multidisciplinary response aspects for Samos 2020 M7.0 earthquake. Acta Geophys. 2021, 69, 1025–1048. [Google Scholar] [CrossRef]
- Le Cozannet, G.; Kervyn, M.; Russo, S.; Ifejika Speranza, C.; Ferrier, P.; Foumelis, M.; Lopez, T.; Modaressi, H. Space-Based Earth Observations for Disaster Risk Management. Surv. Geophys. 2020, 41, 1209–1235. [Google Scholar] [CrossRef] [Green Version]
- Foumelis, M.; Papadopoulou, T.; Bally, P.; Pacini, F.; Provost, F.; Patruno, J. Monitoring Geohazards Using On-Demand And Systematic Services On Esa’s Geohazards Exploitation Platform. In Proceedings of the IGARSS 2019—2019 IEEE International Geoscience and Remote Sensing Symposium, Yokohama, Japan, 28 July–2 August 2019; pp. 5457–5460. [Google Scholar]
- Foumelis, M.; Parcharidis, I.; Lagios, E.; Voulgaris, N. Evolution of post-seismic ground deformation of the Athens 1999 earthquake observed by SAR interferometry. J. Appl. Geophys. 2009, 69, 16–23. [Google Scholar] [CrossRef]
- Papageorgiou, E.; Foumelis, M.; Parcharidis, I. Long-and Short-Term Deformation Monitoring of Santorini Volcano: Unrest Evidence by DInSAR Analysis. IEEE J. Sel. Top. Appl. Earth Obs. Remote Sens. 2012, 5, 1531–1537. [Google Scholar] [CrossRef]
- Samieie-Esfahany, S.; Hanssen, R.F.; van Thienen-Visser, K.; Muntendam-Bos, A. On the Effect of Horizontal Deformation on InSAR Subsidence Estimates. In Proceedings of the Fringe 2009 Workshop, Frascati, Italy, 30 November–4 December 2009. [Google Scholar]
- Tranos, M.D. TR method (TRM): A separation and stress inversion method for heterogeneous fault-slip data driven by Andersonian extensional and compressional stress regimes. J. Struct. Geol. 2015, 79, 57–74. [Google Scholar] [CrossRef]
- Meulenkamp, J.E.; van der Zwaan, G.L.; van Wamel, W.A. On late Miocene to recent vertical motions in the Cretan segment of the Hellenic Arc. Tectonophysics 1994, 234, 53–72. [Google Scholar] [CrossRef]
- Ward, J.H. Hierarchical Grouping to Optimize an Objective Function. J. Am. Stat. Assoc. 1963, 58, 236–244. [Google Scholar] [CrossRef]
- Papanikolaou, D.; Royden, L. Disruption of the Hellenic arc: Late Miocene extensional detachment faults and steep Pliocene-Quaternary normal faults—Or what happened at Corinth? Tectonics 2007, 26, TC5003. [Google Scholar] [CrossRef]
- Van Hinsbergen, D.J.J.; Zachariasse, W.J.; Wortel, M.J.R.; Meulenkamp, J.E. Underthrusting and exhumation: A comparison between the External Hellenides and the hot Cycladic and cold South Aegean core complexes (Greece). Tectonics 2005, 24, TC2011. [Google Scholar] [CrossRef] [Green Version]
- Van Hinsbergen, D.J.J.; Hafkenscheid, E.; Spakman, W.; Meulenkamp, J.; Wortel, R. Nappe stacking resulting from subduction of oceanic and continental lithosphere below Greece. Geology 2005, 33, 325–328. [Google Scholar] [CrossRef] [Green Version]
- Sakellariou, D.; Tsampouraki-Kraounaki, K. Plio-Quaternary Extension and Strike-Slip Tectonics in the Aegean. In Transform Plate Boundaries and Fracture Zones; Duarte, J.C., Ed.; Elsevier: Amsterdam, The Netherlands, 2019; pp. 339–374. [Google Scholar] [CrossRef]
- Mason, J.; Schneiderwind, S.; Pallikarakis, A.; Wiatr, T.; Mechernich, S.; Papanikolaou, I.; Reicherter, K. Fault structure and deformation rates at the Lastros-Sfaka Graben, Crete. Tectonophysics 2016, 683, 216–232. [Google Scholar] [CrossRef]
- Krijgsman, W.; Hilgen, F.J. Langereis, C.G.; Zachariasse, W.J. The age of the Tortonian/Messinian boundary. Earth Planet. Sci. Lett. 1994, 121, 533–547. [Google Scholar] [CrossRef]
- Papadimitriou, P.; Voulgaris, N.; Kassaras, I.; Kaviris, G.; Delibasis, N.; Makropoulos, K. The Mw = 6.0, 7 September 1999 Athens Earthquake. Nat. Hazards 2002, 27, 15–33. [Google Scholar] [CrossRef]
- Kapetanidis, V.; Karakonstantis, A.; Papadimitriou, P.; Pavlou, K.; Spingos, I.; Kaviris, G.; Voulgaris, N. The 19 July 2019 earthquake in Athens, Greece: A delayed major aftershock of the 1999 Mw = 6.0 event, or the activation of a different structure? J. Geodyn. 2020, 139, 101766. [Google Scholar] [CrossRef]
- Ganas, A.; Elias, P.; Kapetanidis, V.; Valkaniotis, S.; Briole, P.; Kassaras, I.; Argyrakis, P.; Barberopoulou, A.; Moshou, A. The July 20, 2017 M6.6 Kos Earthquake: Seismic and Geodetic Evidence for an Active North-Dipping Normal Fault at the Western End of the Gulf of Gökova (SE Aegean Sea). Pure Appl. Geophys. 2019, 176, 4177–4211. [Google Scholar] [CrossRef]
- Triantafyllou, I.; Papadopoulos, G.A.; Lekkas, E. Impact on built and natural environment of the strong earthquakes of April 23, 1933, and July 20, 2017, in the southeast Aegean Sea, eastern Mediterranean. Nat. Hazards 2020, 100, 671–695. [Google Scholar] [CrossRef]
- Triantafyllou, I.; Gogou, M.; Mavroulis, S.; Lekkas, E.; Papadopoulos, G.A.; Thravalos, M. The Tsunami Caused by the 30 October 2020 Samos (Aegean Sea) Mw7.0 Earthquake: Hydrodynamic Features, Source Properties and Impact Assessment from Post-Event Field Survey and Video Records. J. Mar. Sci. Eng. 2021, 9, 68. [Google Scholar] [CrossRef]
- Papadimitriou, P.; Kapetanidis, V.; Karakonstantis, A.; Spingos, I.; Kassaras, I.; Sakkas, V.; Kouskouna, V.; Karatzetzou, A.; Pavlou, K.; Kaviris, G.; et al. First Results on the Mw=6.9 Samos Earthquake of 30 October 2020. Bull. Geol. Soc. Greece 2020, 56, 251–279. [Google Scholar] [CrossRef]
- Karakostas, V.; Tan, O.; Kostoglou, A.; Papadimitriou, E.; Bonatis, P. Seismotectonic implications of the 2020 Samos, Greece, Mw 7.0 mainshock based on high-resolution aftershock relocation and source slip model. Acta Geophys. 2021, 69, 979–996. [Google Scholar] [CrossRef]
- Kaviris, G.; Spingos, I.; Kapetanidis, V.; Papadimitriou, P.; Voulgaris, N. On the origin of upper crustal shear-wave anisotropy at Samos Island, Greece. Acta Geophys. 2021, 69, 1051–1064. [Google Scholar] [CrossRef]
- Aristotle University of Thessaloniki. Aristotle University of Thessaloniki Seismological Network [Data Set]. International Federation of Digital Seismograph Networks. 1981. Available online: https://www.fdsn.org/networks/detail/HT/ (accessed on 26 January 2022).
- (ITSAK) Institute of Engineering Seimology Earthquake Engineering. ITSAK Strong Motion Network [Data Set]. International Federation of Digital Seismograph Networks. 1981. Available online: https://www.fdsn.org/networks/detail/HI/ (accessed on 26 January 2022).
- University of Athens. Hellenic Seismological Network, University of Athens, Seismological Laboratory [Data Set]. International Federation of Digital Seismograph Networks. 2008. Available online: https://www.fdsn.org/networks/detail/HA/ (accessed on 26 January 2022).
- Evangelidis, C.P.; Triantafyllis, N.; Samios, M.; Boukouras, K.; Kontakos, K.; Ktenidou, O.J.; Fountoulakis, I.; Kalogeras, I.; Melis, N.S.; Galanis, O.; et al. Seismic Waveform Data from Greece and Cyprus: Integration, Archival, and Open Access. Seismol. Res. Lett. 2021, 92, 1672–1684. [Google Scholar] [CrossRef]


| Mission | Orbit | Track | Incidence Angle (Degrees) | Observation Period | Span after Mainshock |
|---|---|---|---|---|---|
| Sentinel 1B-Sentinel 1A | Ascending | 102 | 43.8 | 23 September 2021–29 September 2021 | 2 days |
| Sentinel 1A-Sentinel 1B | Descending | 036 | 43.8 | 25 September 2021–1 October 2021 | 5 days |
| Sentinel 1B-Sentinel 1B | Ascending | 029 | 33.8 | 18 September 2021–30 September 2021 | 3 days |
| Sentinel 1B-Sentinel 1A | Descending | 109 | 33.8 | 24 September 2021–30 September 2021 | 3 days |
| Period A | Period B | |
|---|---|---|
| Number of events | 843 | 1657 |
| Mean RMS error (s) | 0.219 | 0.128 |
| Median ERH (km) | 0.530 | 0.390 |
| Mean ERZ (km) | 3.471 | 1.064 |
| Median ERZ (km) | 2.180 | 0.900 |
| Median Depth (km) | 7.120 | 8.370 |
| Median min.stat.dist. (km) | 17 | 6.3 |
| Mean azim. gap (°) | 138 | 110 |
Publisher’s Note: MDPI stays neutral with regard to jurisdictional claims in published maps and institutional affiliations. |
© 2022 by the authors. Licensee MDPI, Basel, Switzerland. This article is an open access article distributed under the terms and conditions of the Creative Commons Attribution (CC BY) license (https://creativecommons.org/licenses/by/4.0/).
Share and Cite
Vassilakis, E.; Kaviris, G.; Kapetanidis, V.; Papageorgiou, E.; Foumelis, M.; Konsolaki, A.; Petrakis, S.; Evangelidis, C.P.; Alexopoulos, J.; Karastathis, V.; et al. The 27 September 2021 Earthquake in Central Crete (Greece)—Detailed Analysis of the Earthquake Sequence and Indications for Contemporary Arc-Parallel Extension to the Hellenic Arc. Appl. Sci. 2022, 12, 2815. https://doi.org/10.3390/app12062815
Vassilakis E, Kaviris G, Kapetanidis V, Papageorgiou E, Foumelis M, Konsolaki A, Petrakis S, Evangelidis CP, Alexopoulos J, Karastathis V, et al. The 27 September 2021 Earthquake in Central Crete (Greece)—Detailed Analysis of the Earthquake Sequence and Indications for Contemporary Arc-Parallel Extension to the Hellenic Arc. Applied Sciences. 2022; 12(6):2815. https://doi.org/10.3390/app12062815
Chicago/Turabian StyleVassilakis, Emmanuel, George Kaviris, Vasilis Kapetanidis, Elena Papageorgiou, Michael Foumelis, Aliki Konsolaki, Stelios Petrakis, Christos P. Evangelidis, John Alexopoulos, Vassilios Karastathis, and et al. 2022. "The 27 September 2021 Earthquake in Central Crete (Greece)—Detailed Analysis of the Earthquake Sequence and Indications for Contemporary Arc-Parallel Extension to the Hellenic Arc" Applied Sciences 12, no. 6: 2815. https://doi.org/10.3390/app12062815