Article

Investigation of Petroleum Hydrocarbon Fingerprints of Water and Sediment Samples of the Nestos River Estuary in Northern Greece

by
Sophia Mitkidou
1,2,*,
Nikolaos Kokkinos
1,2,*,
Elissavet Emmanouilidou
1,2,
Yusuf Yohannah
1,2,
Thomas Spanos
1,
Christina Chatzichristou
1 and
Antoaneta Ene
3,*
1
Department of Chemistry, School of Science, International Hellenic University, Ag. Loukas, 654 04 Kavala, Greece
2
Hephaestus Advanced Laboratory, Division of Petroleum Forensic Fingerprinting, School of Science, International Hellenic University, Ag. Loukas, 654 04 Kavala, Greece
3
Department of Chemistry, Physics and Environment, Faculty of Sciences and Environment, Dunarea de Jos University of Galati, 47 Domneasca Street, 800008 Galati, Romania
*
Authors to whom correspondence should be addressed.
Appl. Sci. 2022, 12(3), 1636; https://doi.org/10.3390/app12031636
Submission received: 5 January 2022 / Revised: 31 January 2022 / Accepted: 3 February 2022 / Published: 4 February 2022
(This article belongs to the Special Issue Monitoring and Analysis of Environmental Pollution)

Abstract

:
The oil and gas industry is definitely considered the main contributor in the energy sector, acting as the lifeblood of our planet. However, environmental contamination by crude oil and petroleum products due to anthropogenic activities is of great concern. Nestos River springs from Bulgaria and has a total length of 234 km, from which 135 km belong on Greek land. It is globally recognized as nature’s miracle accommodating a variety of habitats, flora, and fauna species at the deltaic area protected by the RAMSAR Convention. In the current study, water and sediment samples from three different sites along the river course and other six sites of the delta region and the surrounding sea area were selected in order to investigate the potential environmental impact of the nearby oil and gas industry in the Prinos-Kavala basin that operates over 40 years. The samples were analyzed by fingerprinting techniques using gas chromatography-mass spectrometry. Crude oil samples and different petroleum products were also analyzed to disclose specific markers (biomarkers) that characterize the different sources of oil spills. The analytical data revealed that the distribution of biomarkers is a valuable tool in oil spill identification as well as in their correlation to suspected sources. Extract ion chromatograms of the reference samples showed significant differences in the distribution of n-alkane, isoprenoid, sterane, triterpane, and dibenzothiophene compounds. The results on the analyzed water and sediment samples bared no evidence of environmental hazards associated with the hydrocarbon exploration and production activities of the neighboring oil and gas company.

1. Introduction

Environmental contamination by petroleum products comprises a crucial issue over the years, which mainly involves anthropogenic activities such as exploration, production, refining, storage, and transportation of crude oil and its products. Air emissions, water, and soil pollution are those types of pollution that the petroleum industry has to deal with [1,2]. Hence, characterization of spilled oils and their linking to potential sources are very important issues for environmental damage assessment, as accidental oil spills can cause severe harm to the environment and ecosystem [3,4]. Toxicological health problems to humans and animals are associated with petroleum hydrocarbon contaminants [5]. The type of oil, as well as the extent of exposure, are some basic factors that affect humans’ health [6]. Blood disorders, respiratory issues, and mental health impacts are some of the human health effects caused by acute or chronic exposure to crude oil and its products [7,8].
The successful forensic investigation and the analysis of oil contaminants using the proper techniques provide a plethora of chemical fingerprinting data [9,10]. Target-compound analysis is a powerful advantage of gas chromatography-mass spectrometry (GC-MS), and it has been extensively applied in petroleum geochemistry [11,12]. Compounds of interest can be identified and quantified by characteristic ions from GC-MS in selected ion monitoring (SIM) mode [13,14]. The selection of appropriate oil analytes for oil spill identification depends on the type of oil spilled, on the specific environmental conditions being examined, and on the comparison of data in function with time [15,16,17,18]. Furthermore, the chemical analysis of biomarkers by GC-MS provides additional information of great significance to environmental forensics investigations [19,20]. The biomarkers distribution is unique for different types of petroleum products representing specific fingerprinting that oil samples can be correlated [21,22]. Comparing GC-MS with other methods, gas chromatography coupled with mass spectrometry presents high selectivity, mainly in mixtures of compounds with great complexity, great sensitivity, and high efficiency in petroleum hydrocarbons analysis [10,23]. Compounds can be precisely identified by analyzing retention times and unique mass spectra.
Moreover, crude oils and refined petroleum products are characterized by a great abundance of many polycyclic aromatic hydrocarbons (PAHs) and heterocyclic PAHs, particularly the alkylated homologs of naphthalene, phenanthrene, dibenzothiophene, fluorene, and chrysene [24,25]. Τhe alkylated polycyclic aromatic hydrocarbons (APAHs) have extensive applications in forensic investigations providing useful information on petroleum, coal tar, and creosote weathering in the environment [26,27]. The distribution of APAHs in fresh crude oils (referred to as C0- to C4-) and refined products usually presents a characteristic bell-shaped profile, which is related to the different alkylation levels. Most abundant in fresh crude oils are C1- to C3- naphthalenes; however, in the case of heavy oils, they can be found in very low concentrations [15]. Alkylated dibenzothiophenes (DBTs) can be used as maturity indicators for crude oil and source rock as the position of the alkyl group affects the molecular thermodynamic stability of these compounds [28]. Hence, one substance can be differentiated from another, while the weathering effects can be estimated based upon alkylated homologs of dibenzothiophene [29,30].
In the present research, water and sediment samples from three (3) different sites along the Nestos River’s course in Northern Greece and other six (6) sites of the delta region as well as the surrounding sea area were analyzed by fingerprinting techniques using GC-MS. These sites were selected in order to investigate the potential environmental impact of the nearby oil and gas industry in the Prinos-Kavala basin. Crude oil samples and different petroleum products were also analyzed in order to disclose biomarkers that characterize the different sources of oil spills.

2. Experimental Details
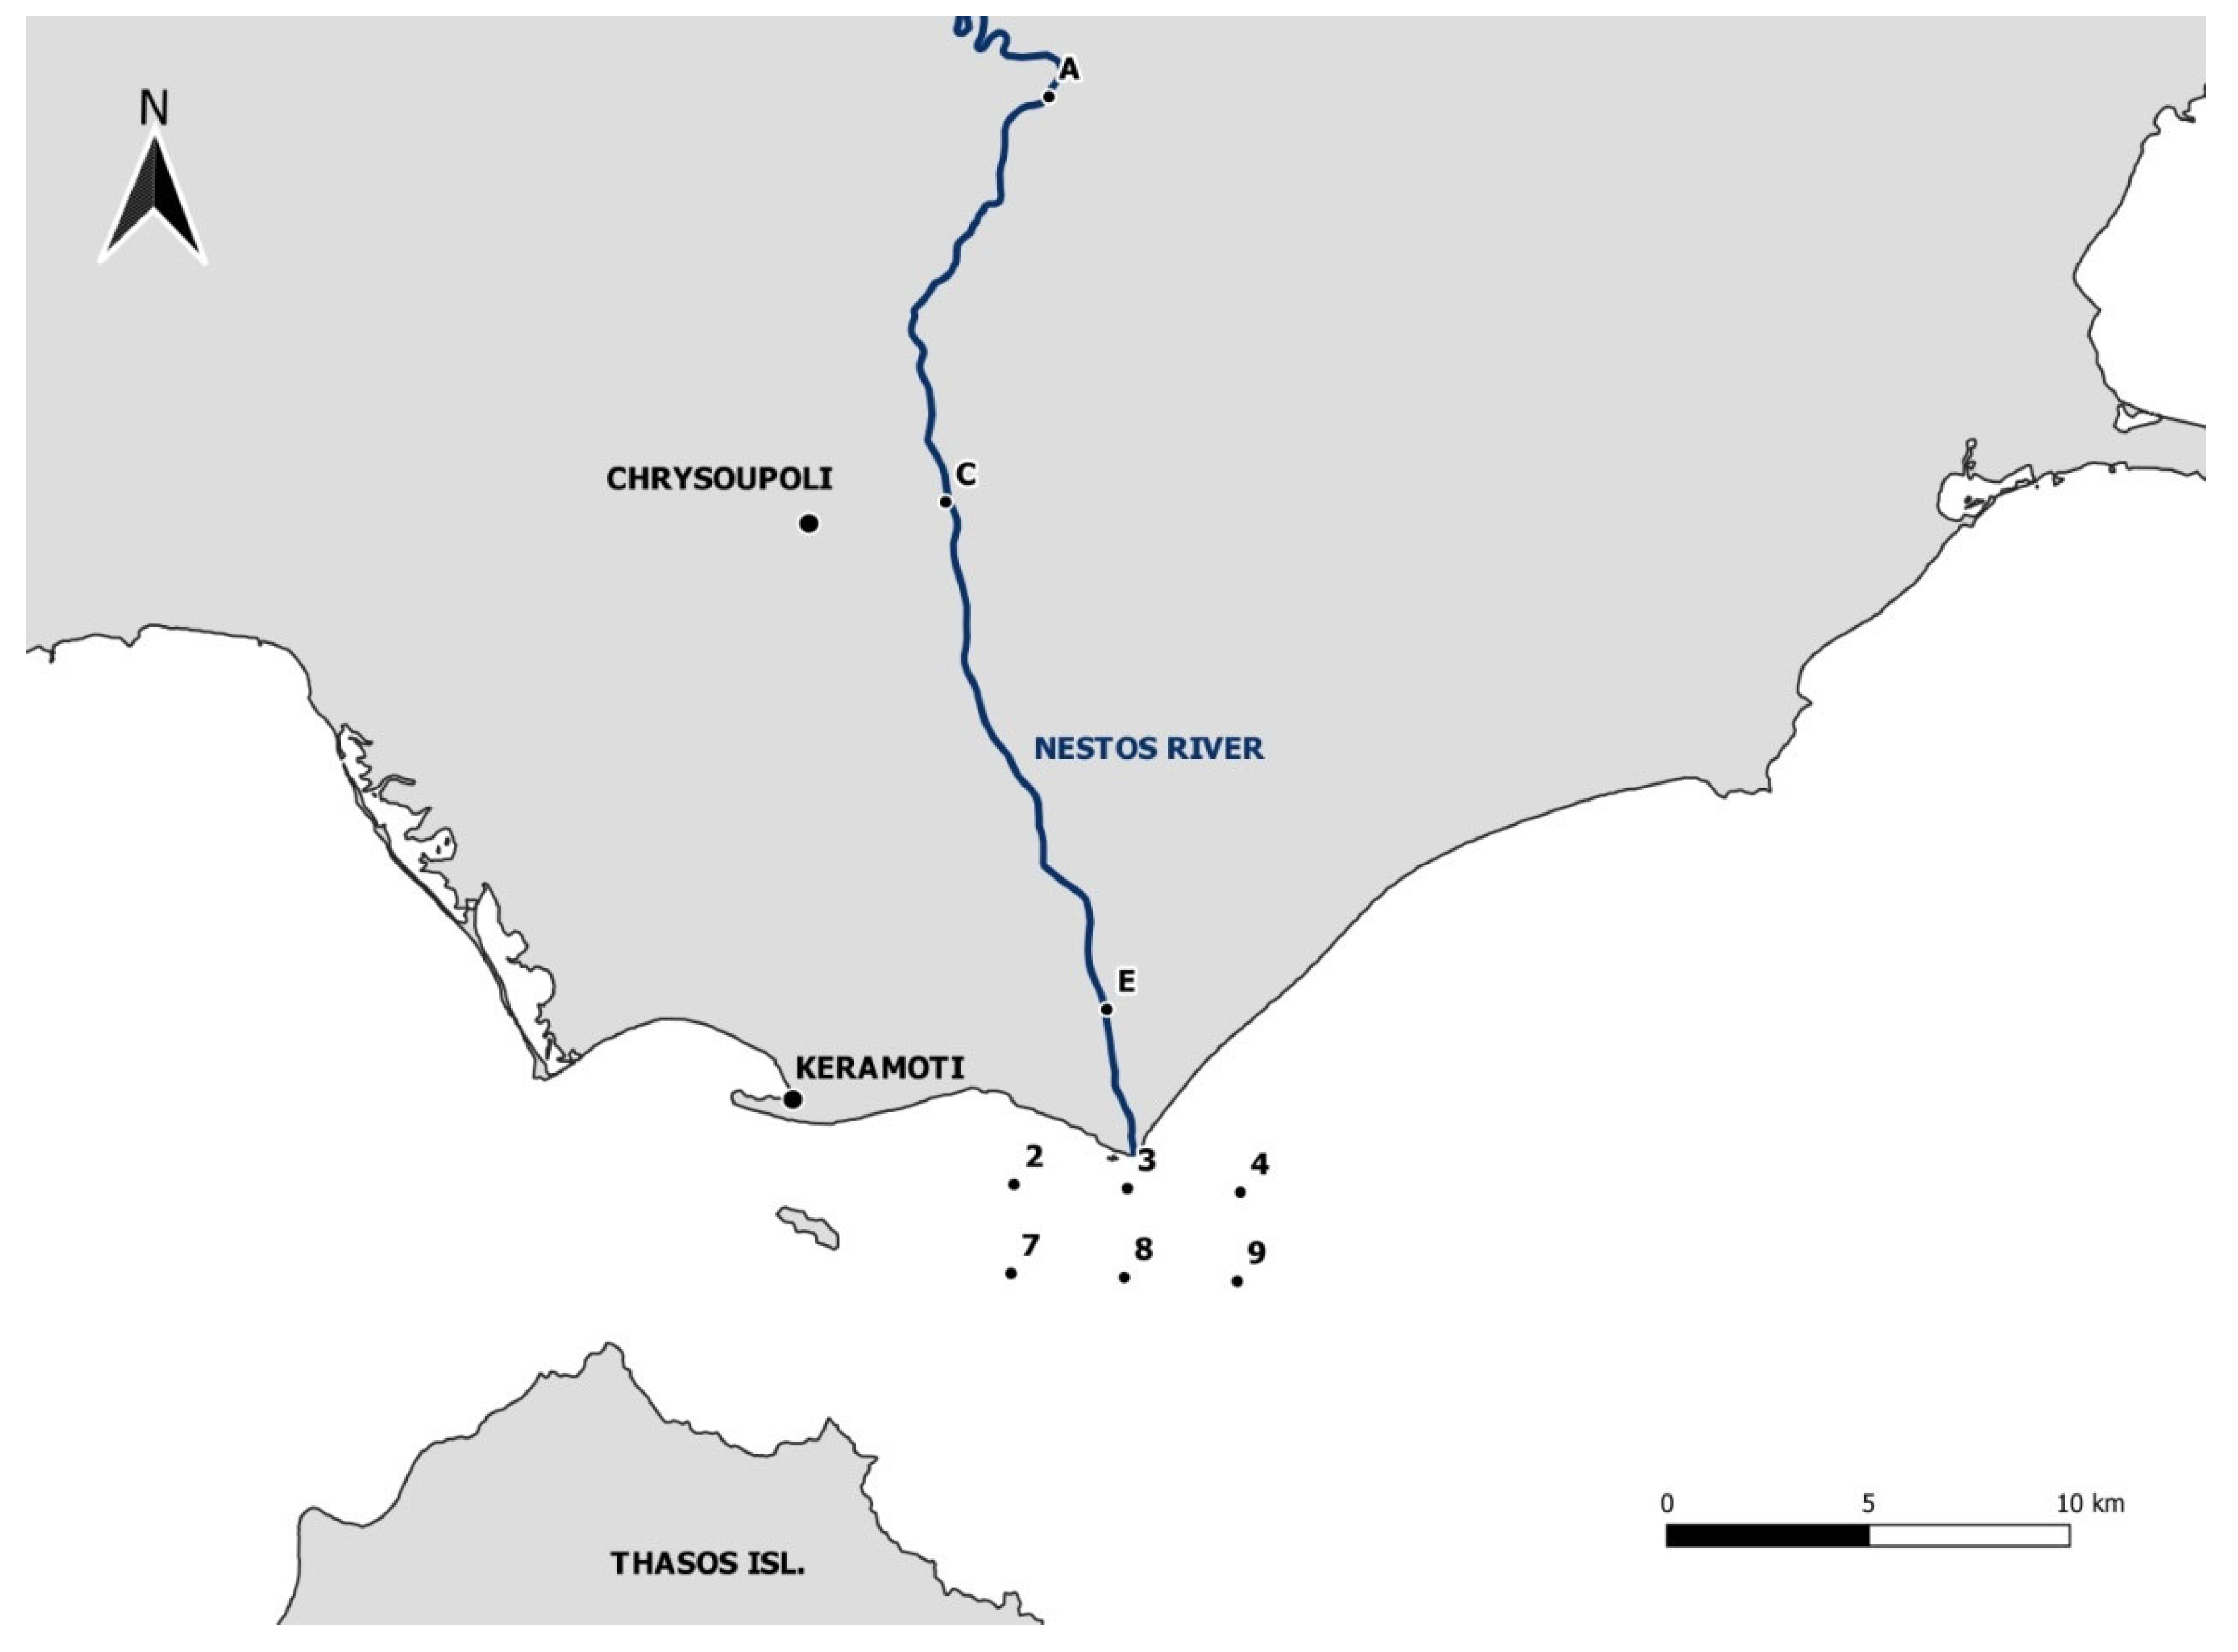
2.1. Study Area

The study area of the current work included the Nestos River and its surrounding area in Northern Greece (Figure 1). The hydrogeological behavior of Nestos River’s basin depends on its geological formations. Nestos River’s basin is characterized by sedimentary formulations with high permeability (5.8%), semi-permeable sedimentary (66.2%), and impervious sedimentary (28%) [31].
In the area of the Gulf of Kavala, there are offshore oil and gas (O&G) facilities that have been producing hydrocarbons since 1981. The produced hydrocarbons are being pretreated at the offshore facilities and transported via submarine pipelines to the onshore facilities for further processing. Both the onshore and offshore O&G facilities have been in continuous operation for over four decades in an environmentally sensitive area, which includes the west coastline with numerous tourist beaches and the east estuary protected area of the Nestos River delta.
The Nestos River is one of the five biggest rivers in Greece. It is of great importance not only for the local economies but also in environmental terms since it is considered to be one of the most important water biotopes in Greece [32,33,34,35,36]. It springs from Rila Mountain in Bulgaria, having a total length of 234 km, from which 135 km belong to Greek land. The famous delta of the Nestos River hosts a variety of habitats, flora, and fauna species, and it is protected by RAMSAR Convention [37,38,39,40].

2.2. Materials and Instrumentation

All the reagents of Table 1 were purchased from international chemical companies via Greek distributors in Athens. O-terphenyl was used as a surrogate standard in solution with dichloromethane. Acetone and n-hexane were selected as solvents. Polycyclic aromatic hydrocarbons (PAHs) were used as reference solutions, such as fluorene and phenanthrene, naphthalene, and anthracene. Clean sediment was used as substrate for spiked sediment samples and anhydrous sodium sulfate for drying. A crude oil sample was granted by the drilling operations at Prinos. Five petroleum product samples (jet fuel, gasoline, diesel fuel, heating oil, and bunker fuel) were granted by Aspropyrgos refinery (Athens, Greece), and they were used for spiking samples of clean water and clean sand.
All samples were analyzed by an Agilent 6890N (vendor: Hellamco, Athens, Greece) gas chromatograph coupled with an MSD 5973B mass spectrometer system (GC-MS). Specifically, extracts were introduced in a split/splitless injector equipped with a backflush configuration in the pulsed splitless mode or in the split mode with a split ratio of 10:1. Chromatographic separation occurred by using an Agilent DB-XLB column (low polarity, 30 m × 0.25 mm I.D., and 0.25 μm film thickness) with deactivated silica pre-column. The column temperature was held isothermally at 50 °C for 2 min immediately after injection, then was increased from 50 to 150 °C with a ramp rate of 15 °C/min and then ramped to 300 °C at 6 °C/min and held at the final temperature for 10 min. Injector temperature was at 270 °C. Helium (5.0 N) was used as a carrier gas, with the flow rate being stable at 1.8 mL/min. An Agilent 7683B automatic liquid sampler was used for the injection of 1 μL per sample.
The mass spectrometer operated in the EI-positive mode (70 eV). The transfer line temperature was at 280 °C. The ion production source was set at 230 °C and the quadrupole analyzer at 150 °C. A full scan mode with a mass range from 50 to 700 and a single ion monitoring technique (SIM mode) was used for analysis purposes. The identification of the organic compounds was determined by comparison of their mass spectra with data available on the NIST 2.0MS database as well as with published data.

2.3. Sampling Method

Fifteen (15) water and other six (6) sediment samples were collected from three sites along the river course and from six sites from the delta region and the sea area (Figure 1) during April, August, and September 2020. Before sampling, all used apparatuses were thoroughly washed with detergent and water and rinsed with organic solvents in the laboratory. Dark-colored 2 L glass bottles with Teflon-lined screw caps were used for keeping water samples. The bottles were rinsed in situ with the sampling water and filled to the brim, overflowed, sealed, and marked with the date and place of sampling. The flasks were stored in portable refrigerators with ice packs to avoid affecting by light and heat during transport to the laboratory. For better conservation, the samples were acidified with hydrochloric acid at pH 1–2. In the laboratory, both water and sediment samples were stored in a refrigerator at 1–5 °C prior to analysis. The shelf life of the samples is 14 days, while their extracts can be stored for 40 days prior to analysis by GC-MS.

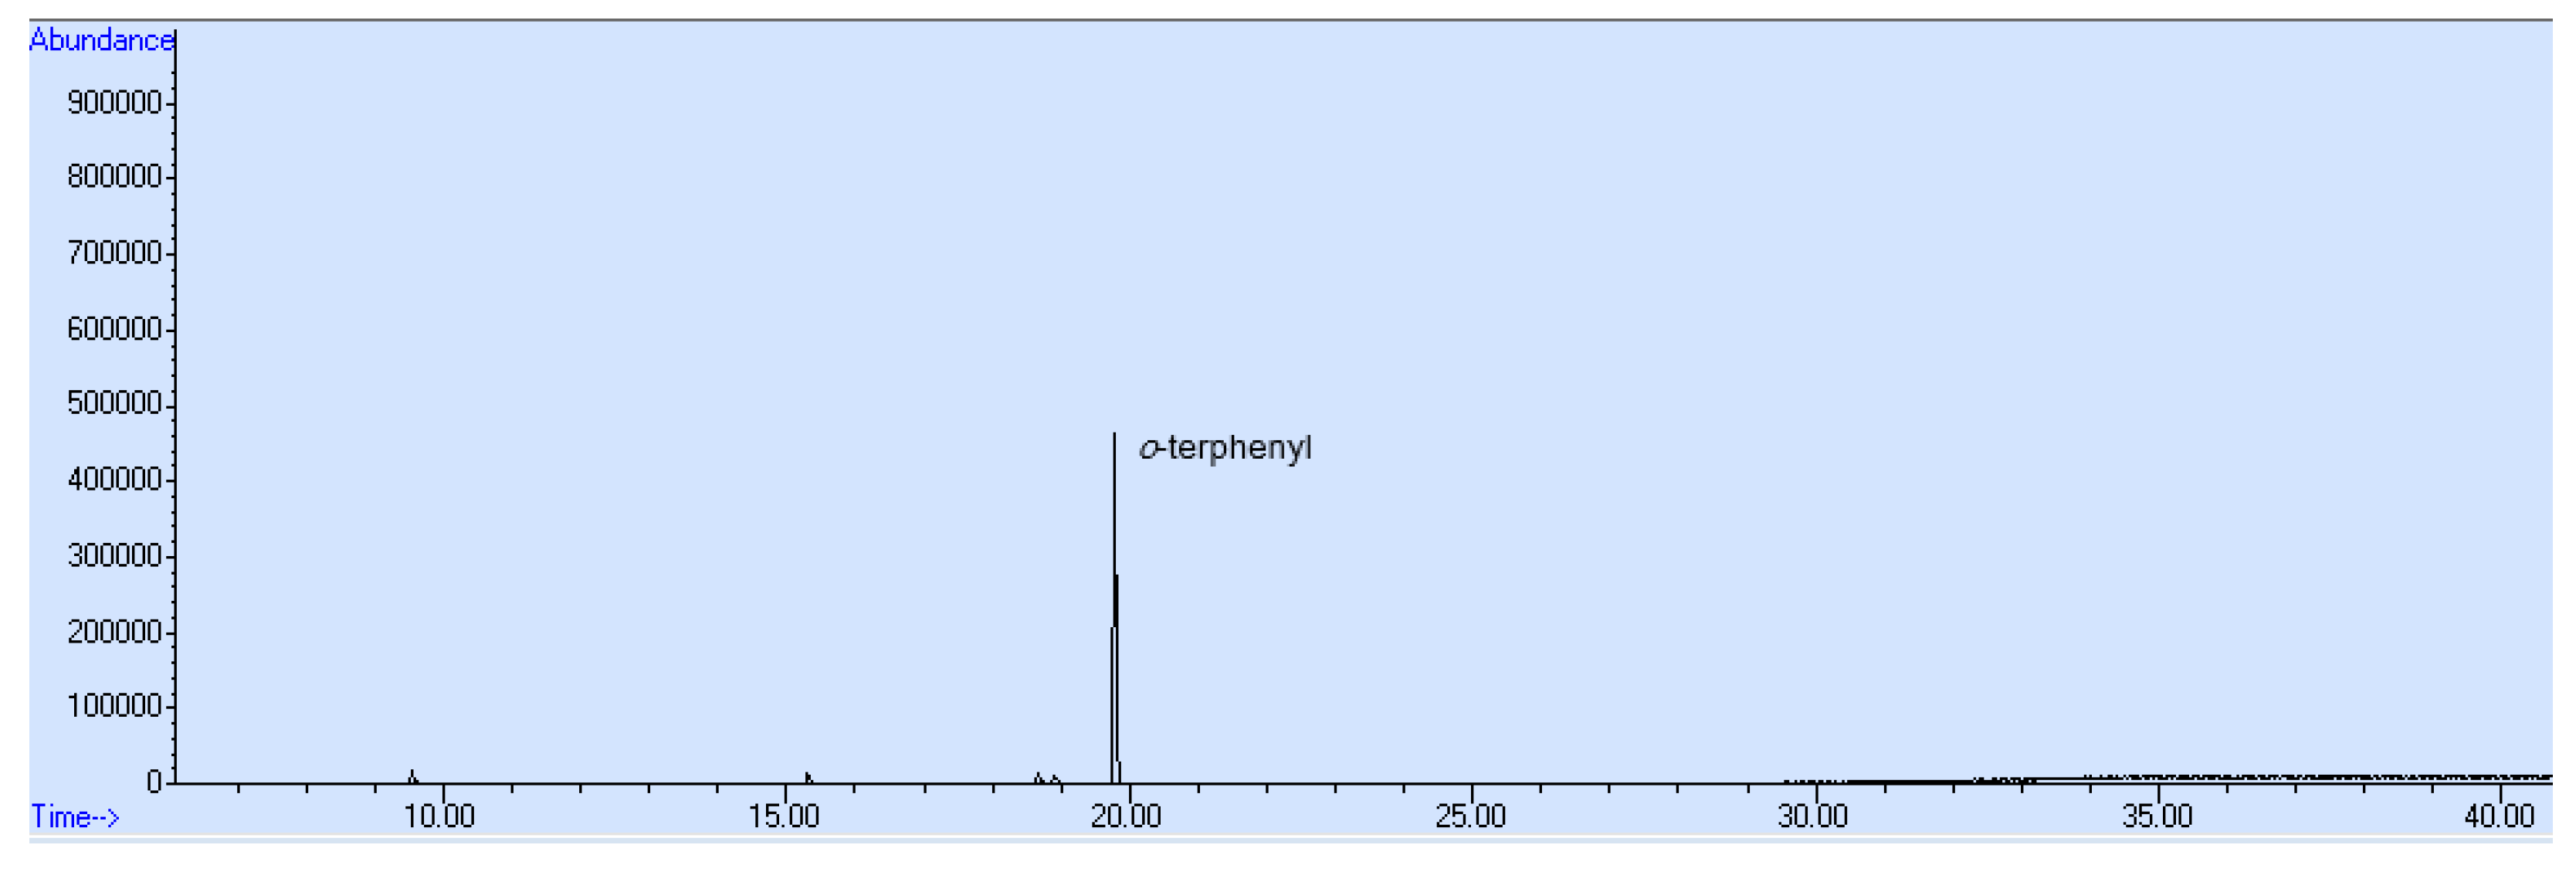
2.4. Recovery Control and Spiking Method

A solution of 100 ppm/mL o-terphenyl in dichloromethane was used as a surrogate in order to control the recovery during the extraction process of the sediment samples. In the water samples, a surrogate solution of 5000 ppm/mL o-terphenyl was obtained by dissolving 0.05 g of o-terphenyl in 10 mL of dichloromethane. In both sediment and water samples, 0.5 mL of surrogate solution was added to each sample [41].
The granted sample of crude oil and the five samples of petroleum products (jet fuel, gasoline, diesel fuel, heating oil, and bunker fuel) were used for spiking samples of clean water and clean sand. Spiked sediment samples were composed by adding 0.5 mL of crude oil and each petroleum product with a volumetric pipette of 500 μL in a beaker containing 5 g of clean sediment. In the water samples, 1 mL of each petroleum product/crude oil was added in 100 mL water (LC-MS grade) and allowed to stand in the fume cupboard for 1 day. Furthermore, four PAHs (fluorene, anthracene, phenanthrene, naphthalene) in three different concentrations of 1, 0.1, and 0.01 mg/mL on 1:1 solvent mixtures of n-hexane and acetone were also used for spiking clean water and clean sediment samples.
Blank and duplicate samples were stored, processed, and analyzed with exactly the same method in order to verify the reliability of the analysis and to reduce unintentional errors. Each sample was analyzed twice, as well as duplicate samples that have been put in a random position of a running sequence. The blank samples contained pure water instead of the sampling material.

2.5. Organic Extraction from Water Samples

The EPA 3510 separatory funnel liquid-liquid extraction method was used for delivering the petroleum hydrocarbons from aqueous samples [41]. The liquid-liquid extraction achieves the separation of the organic compounds based on solubility in different immiscible liquids. Thus, a mixture of dichloromethane and n-hexane in a 1:1 ratio was used as extraction solvents. Initially, 500 mL of water sample was sealed and shaken with 50 mL of solvent for 15 min. The extraction was repeated three times with 50 mL of solvent each time. The extracts were dried through a chromatographic glass column containing anhydrous sodium sulfate and were concentrated using a rotary evaporator to a final volume of 5 mL. The column was preconditioned with hexane. Further evaporation of the solvent was achieved by blowing down a gentle stream of nitrogen.

2.6. Organic Extraction from Sediment Samples

A weighted amount of 15 g from each sediment sample, including clean sediment, was transferred in conical flasks of 100 mL. Then, 50 mL and 5 mL of CH2Cl2 and CH3OH were respectively added to each sediment sample. Additionally, 20 g Na2SO4 and 0.5 mL of surrogate solution were added to each sediment sample. Sodium sulfate was used in order to absorb the content moisture of sediments. Ultrasonic extraction was then applied in all sediment samples at room temperature and at 50–60 Hz frequency. The whole procedure occurred in an ultrasonic bath, and the extraction process was repeated twice for 30 min each run. After extraction, all sediments samples were filtered by common filtration, and the procedure was repeated three times by adding solvent mixture at the precipitate. The collected organic filtrates were finally carried to the top of a sodium sulfate chromatographic column for clean-up. The column was preconditioned with dichloromethane. The total collected organic phase was first condensed to a volume of 2–3 mL by rotary evaporation and then condensed under gentle injection of nitrogen steam to a final volume of 1 mL [41].

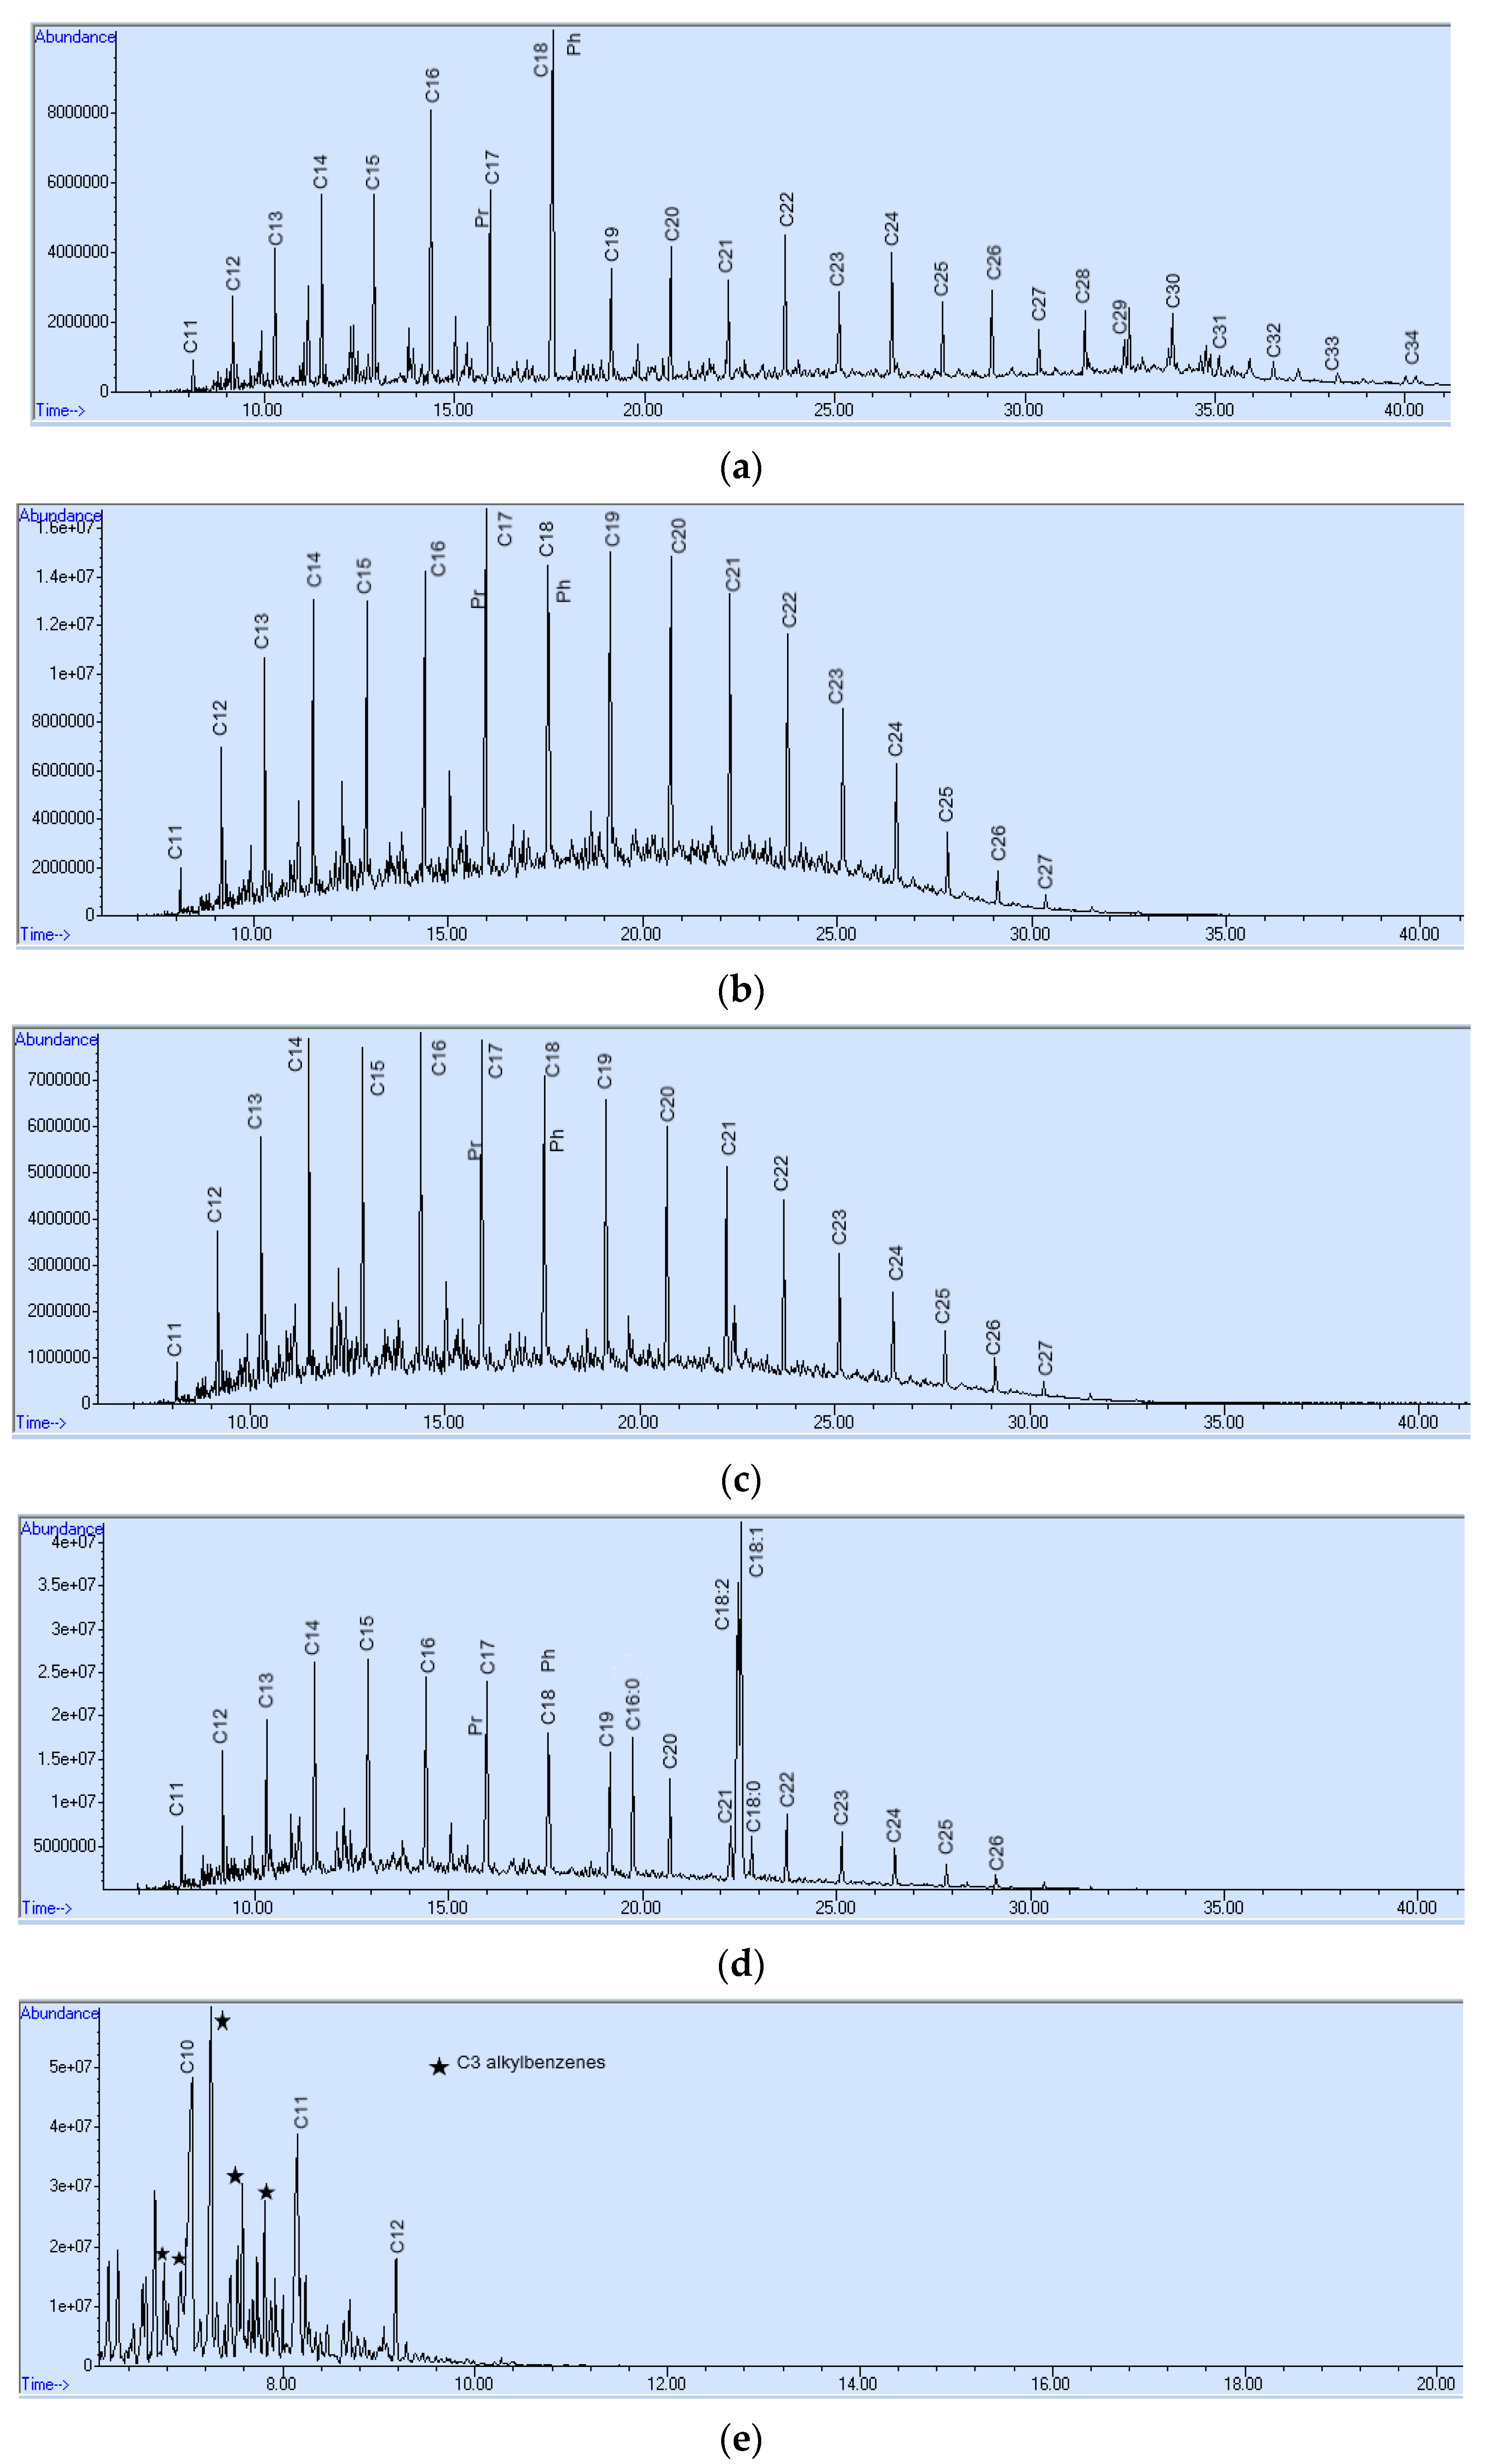
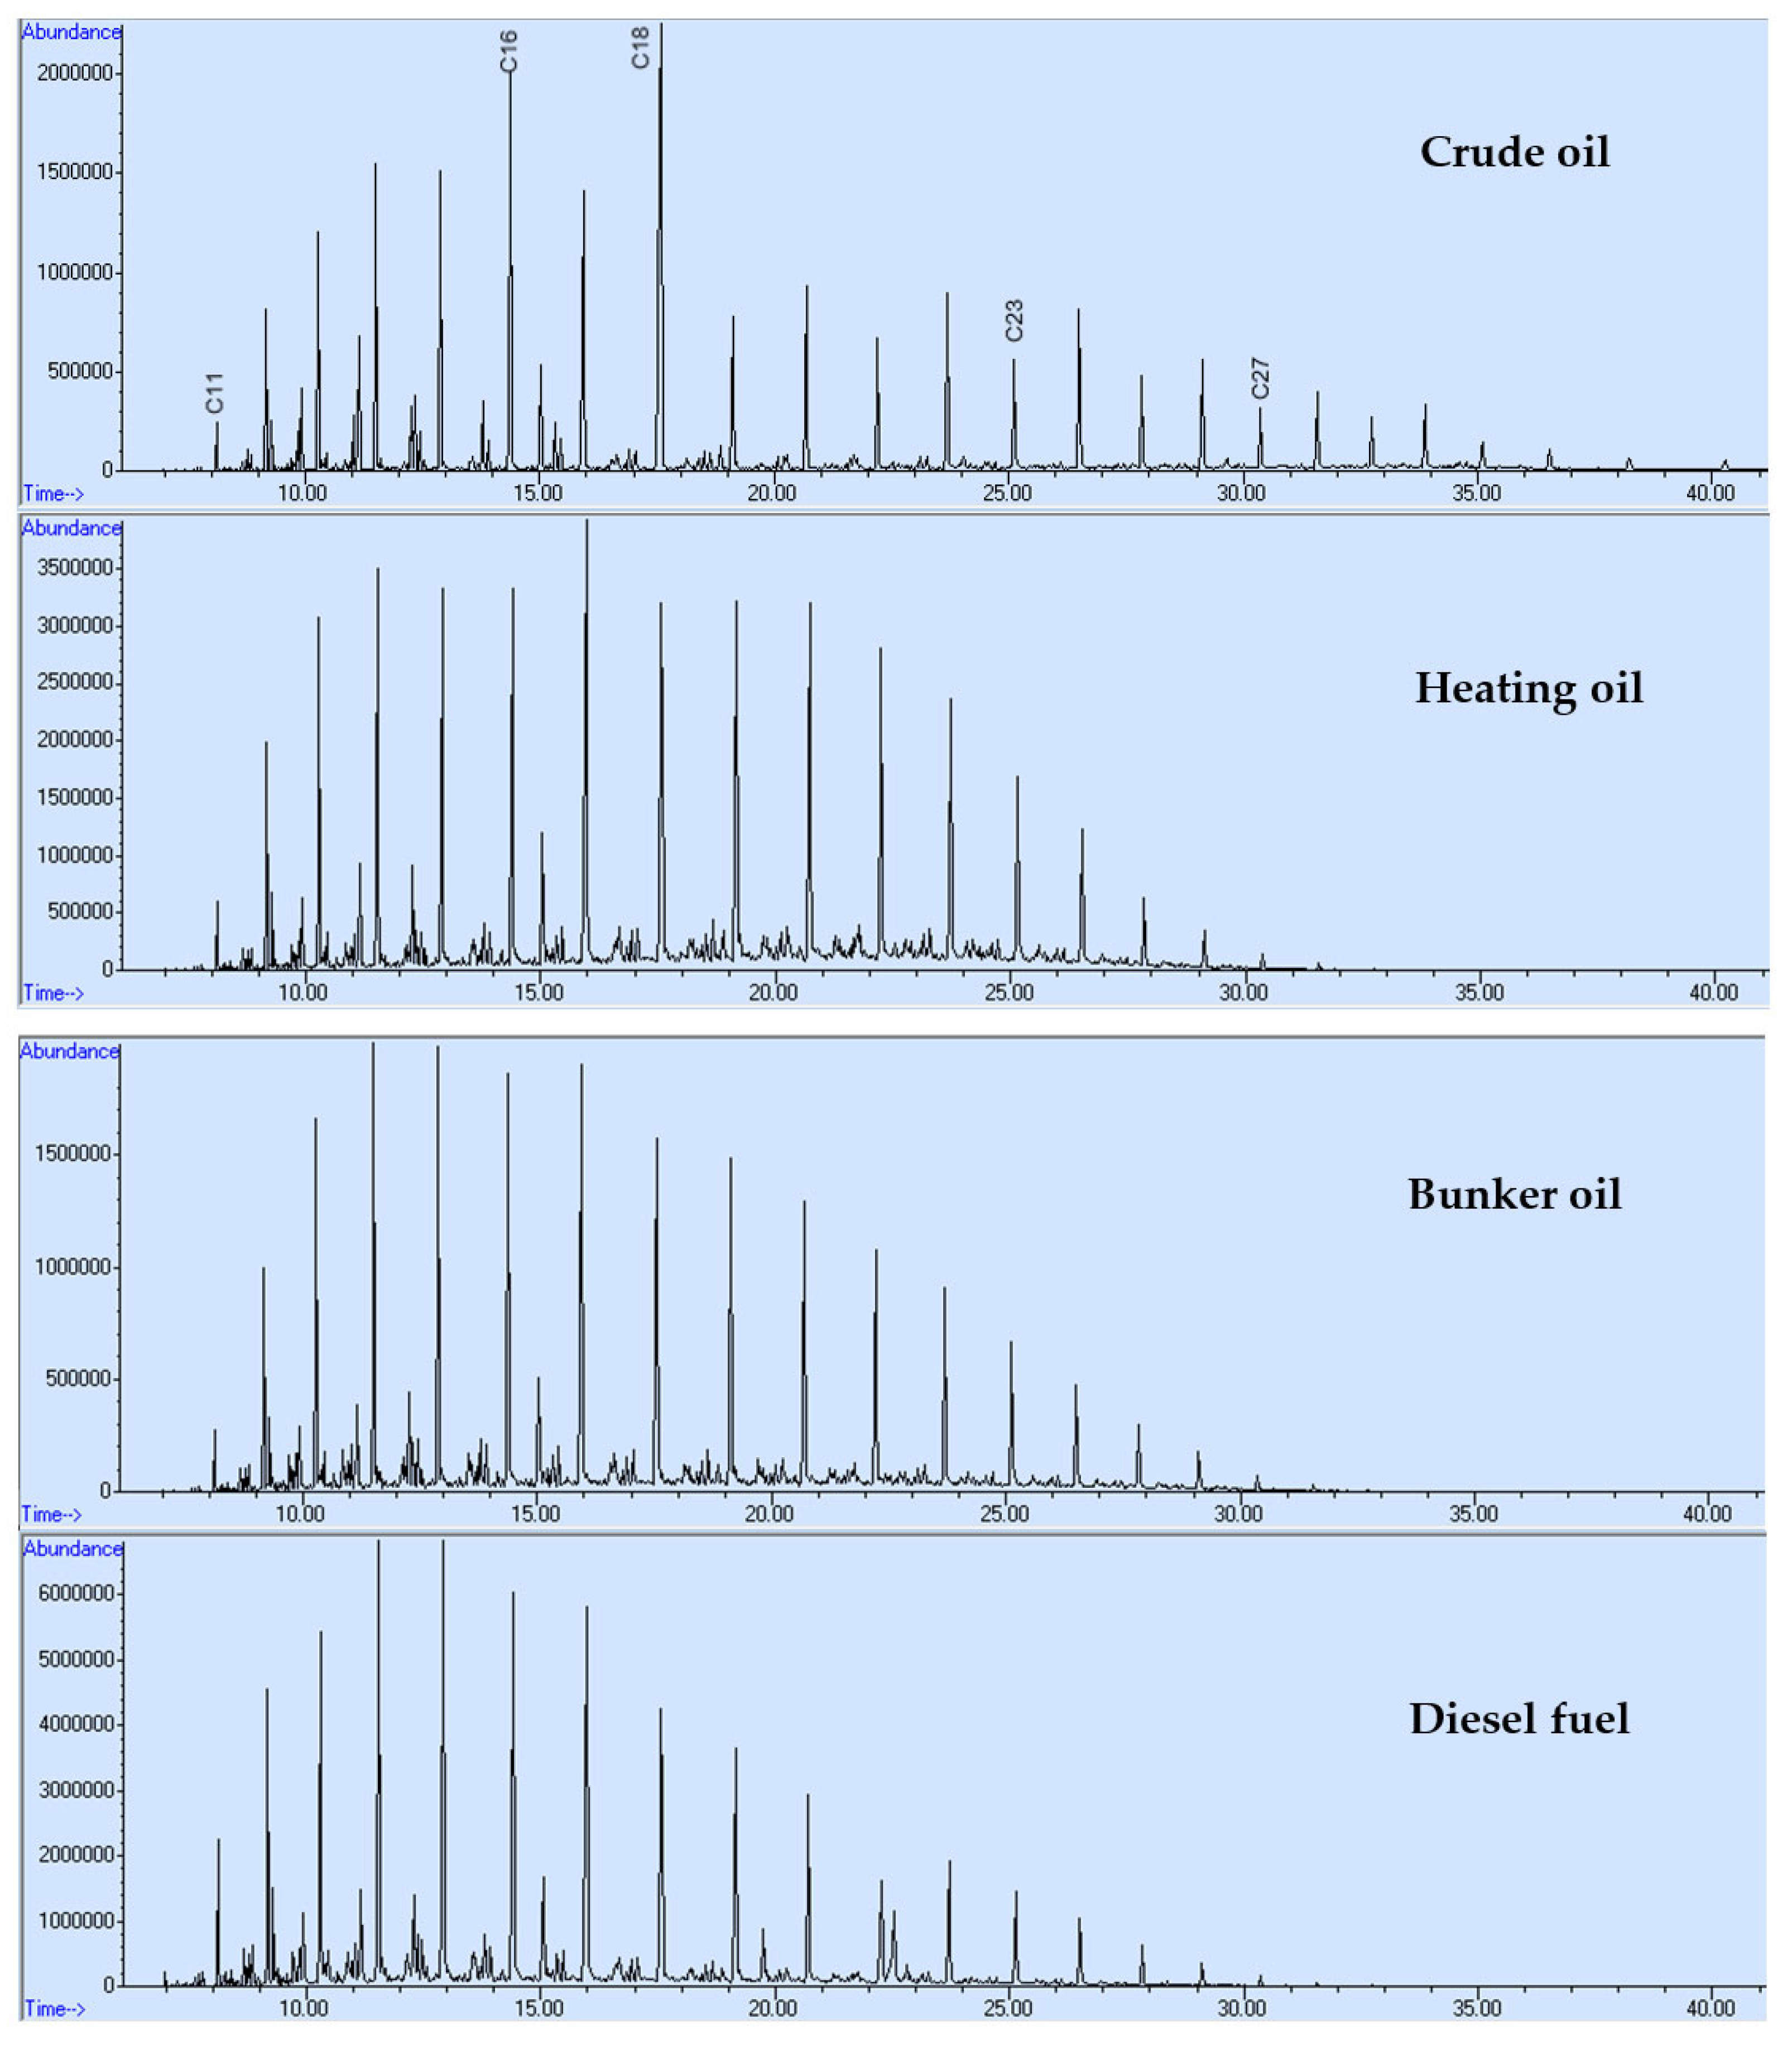
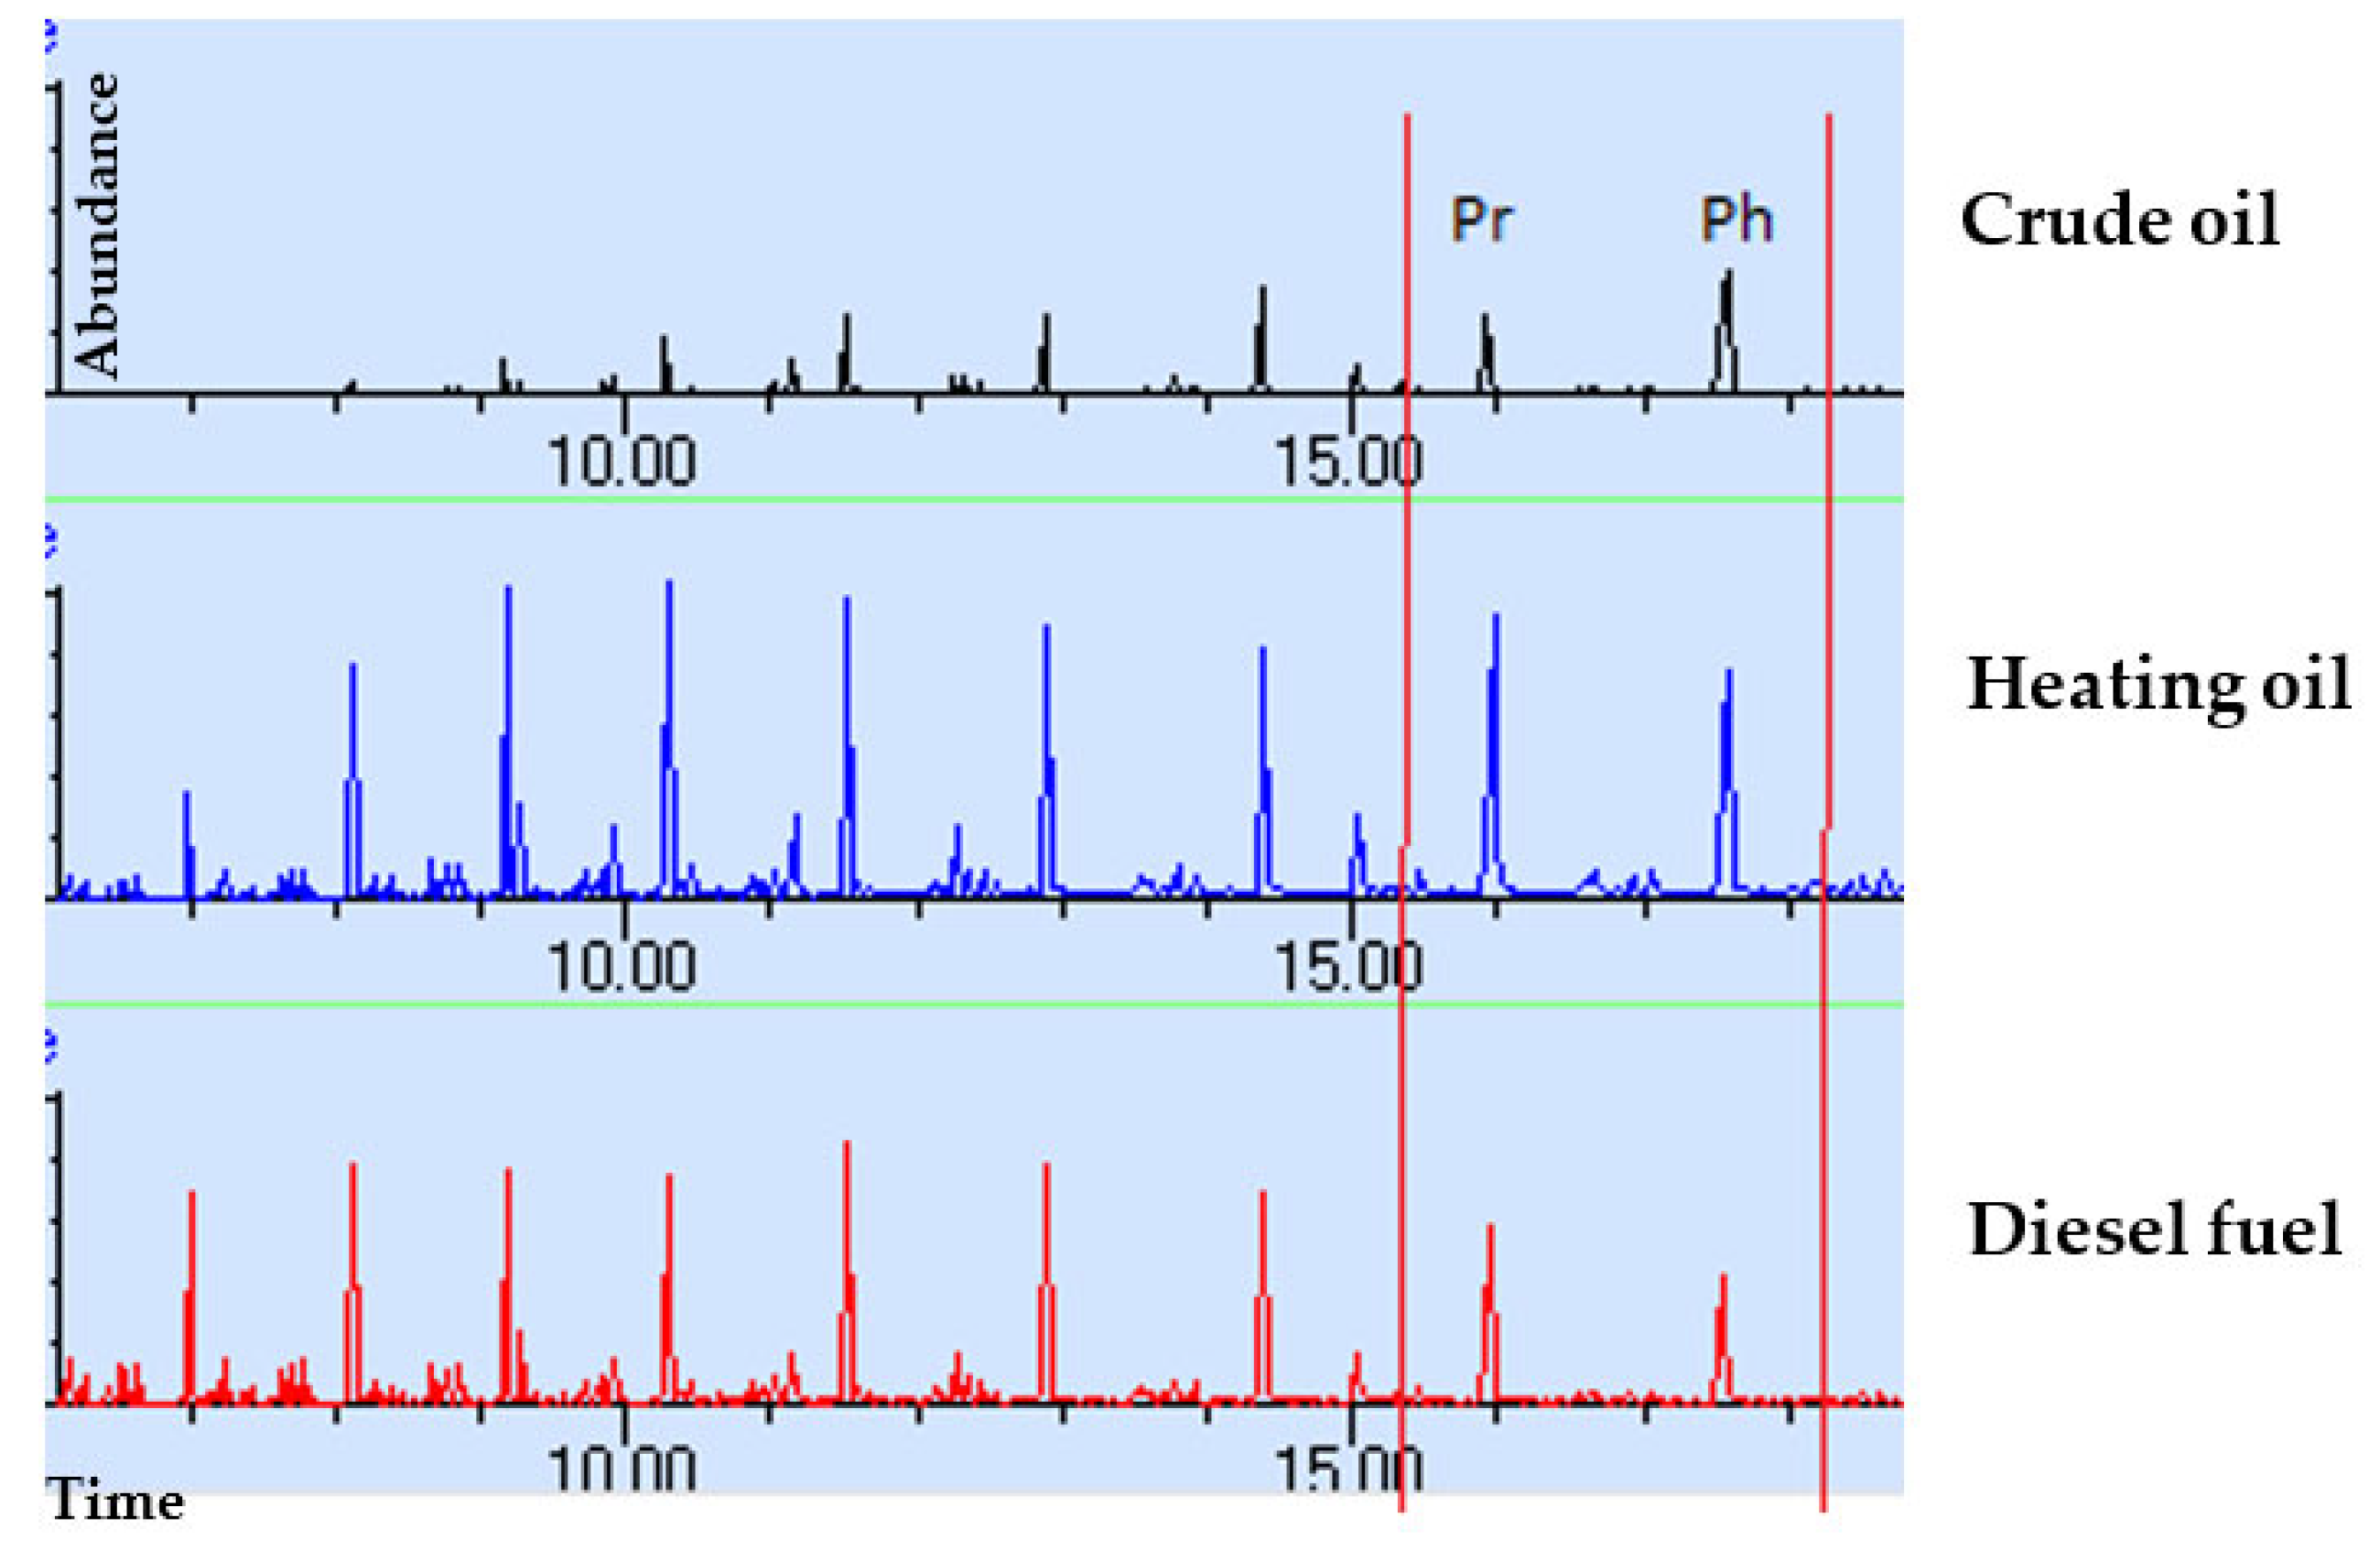
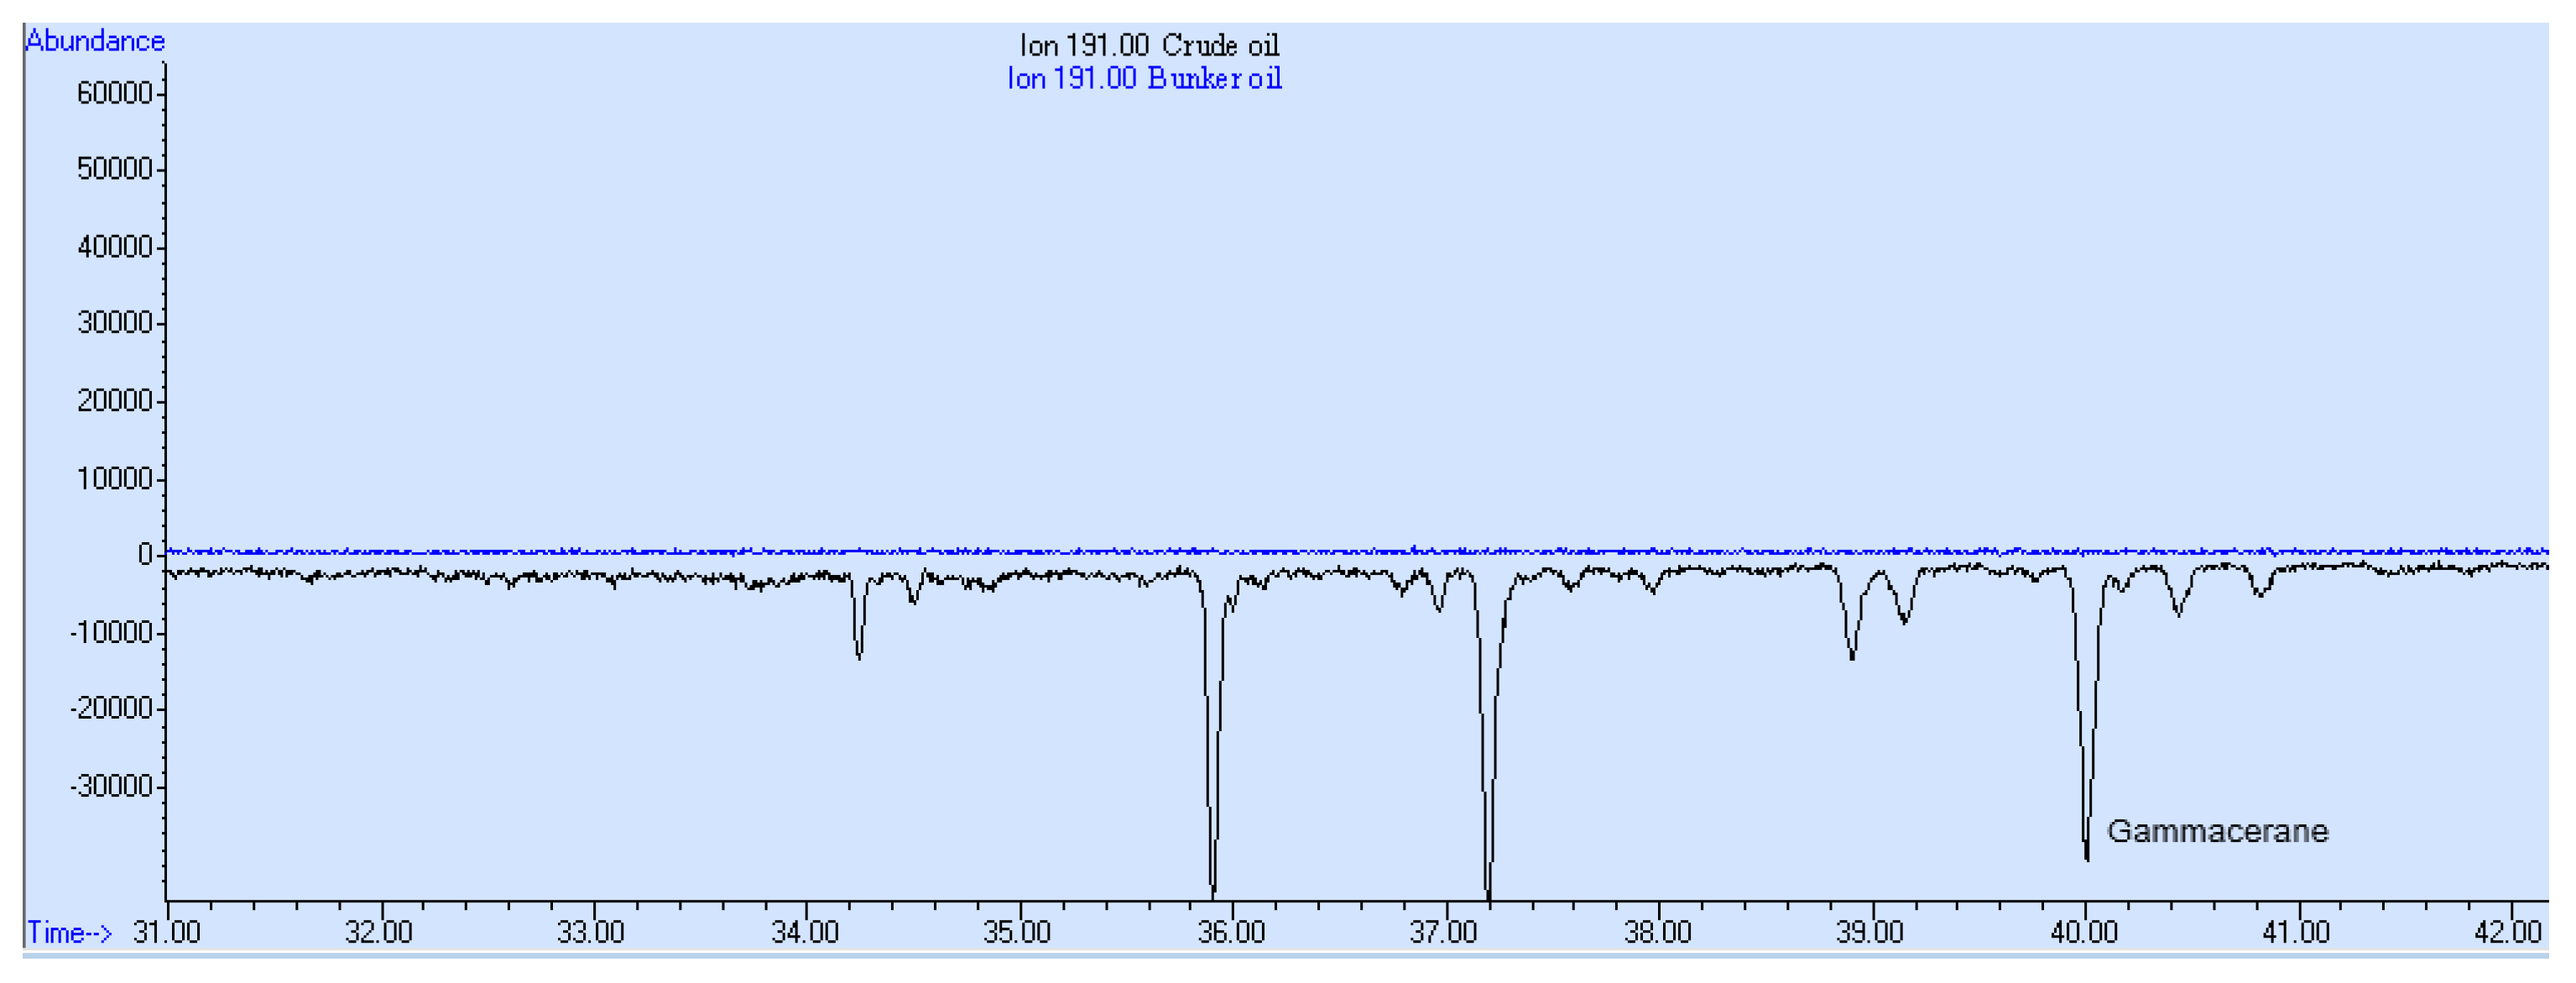
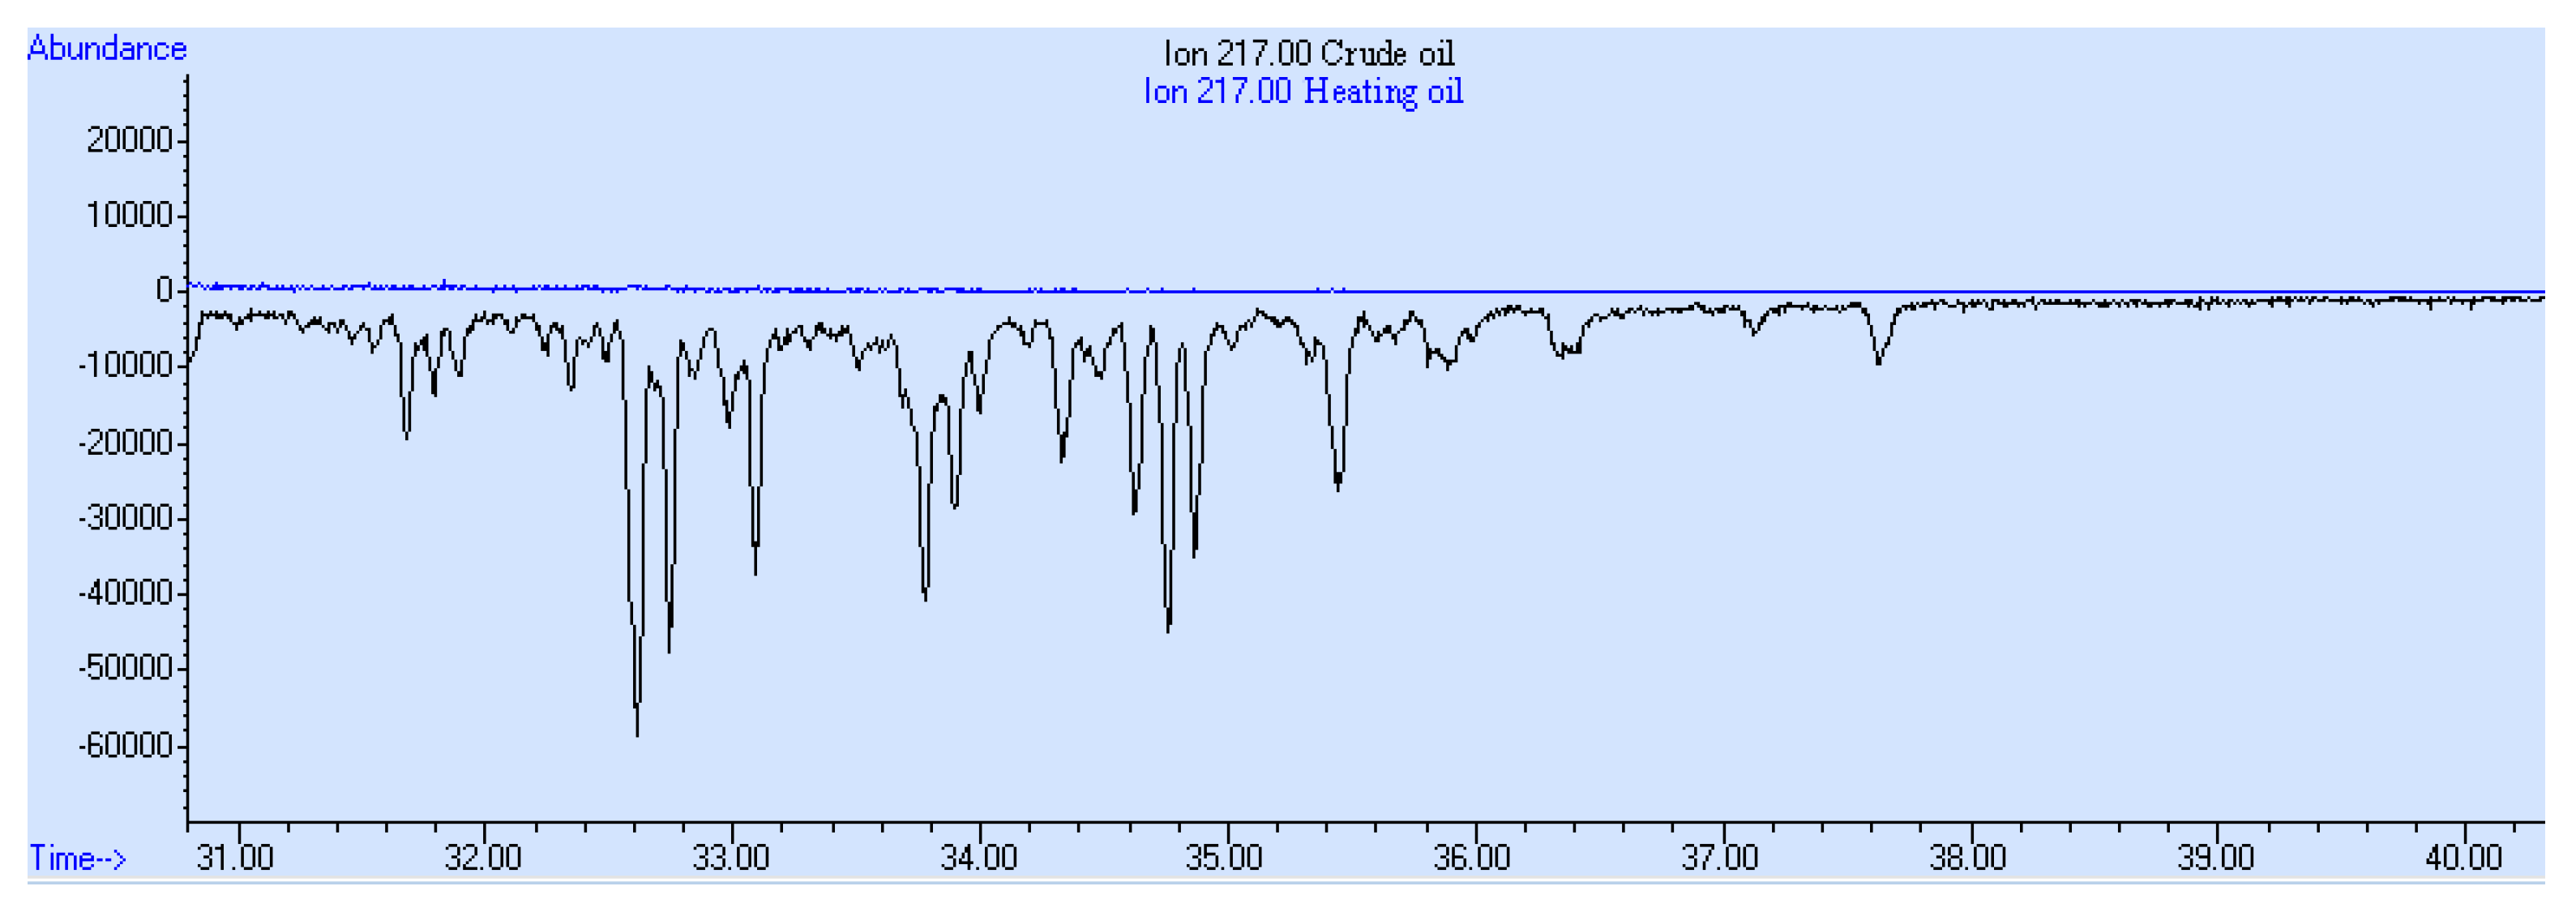
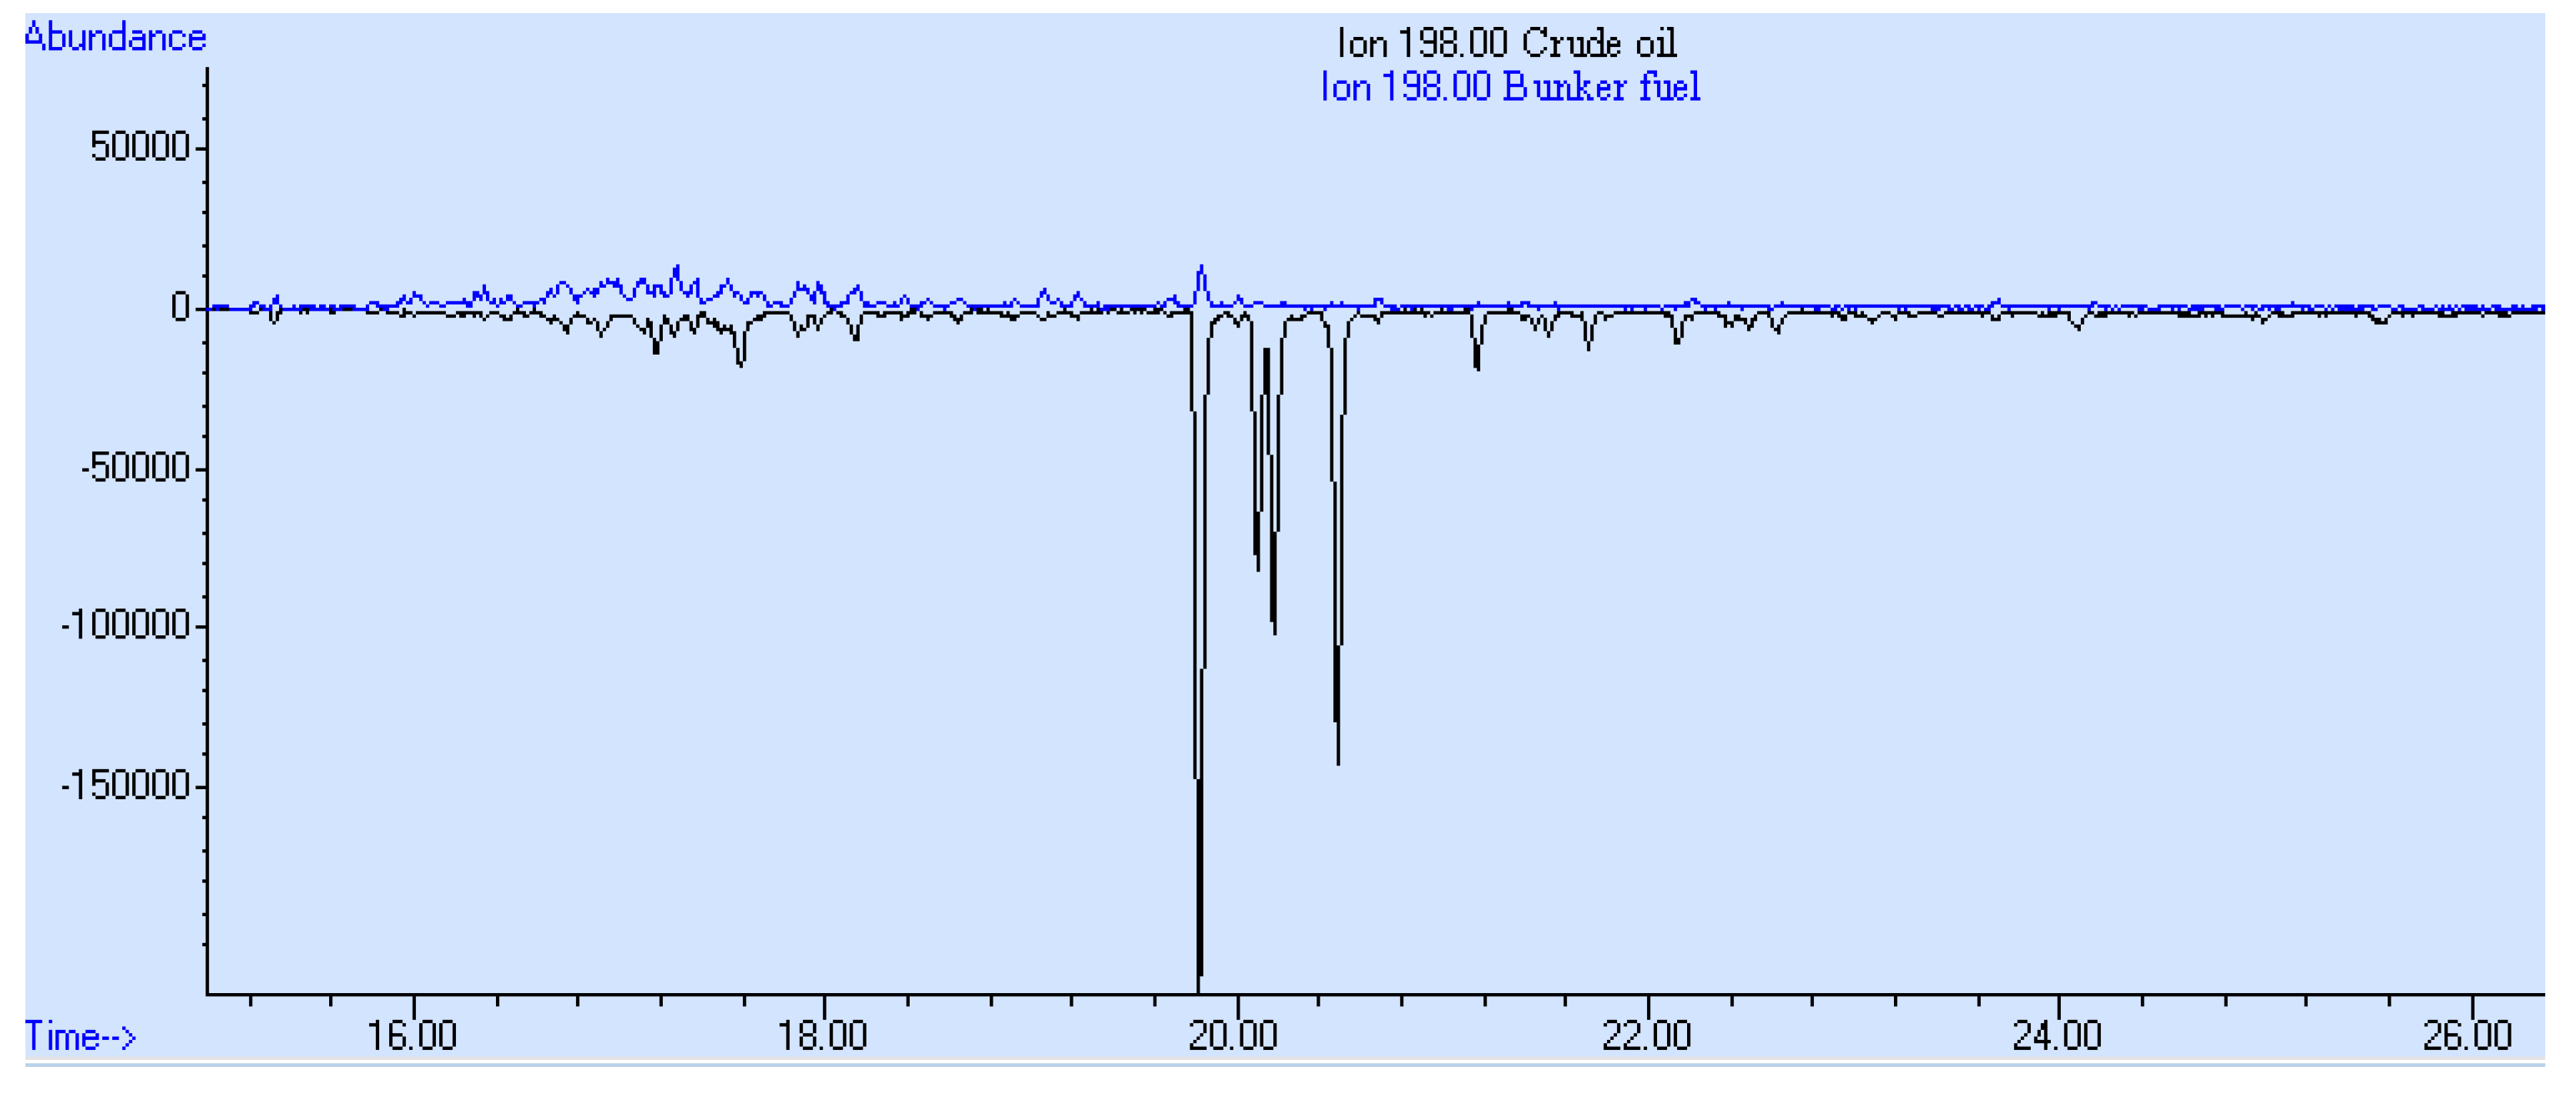
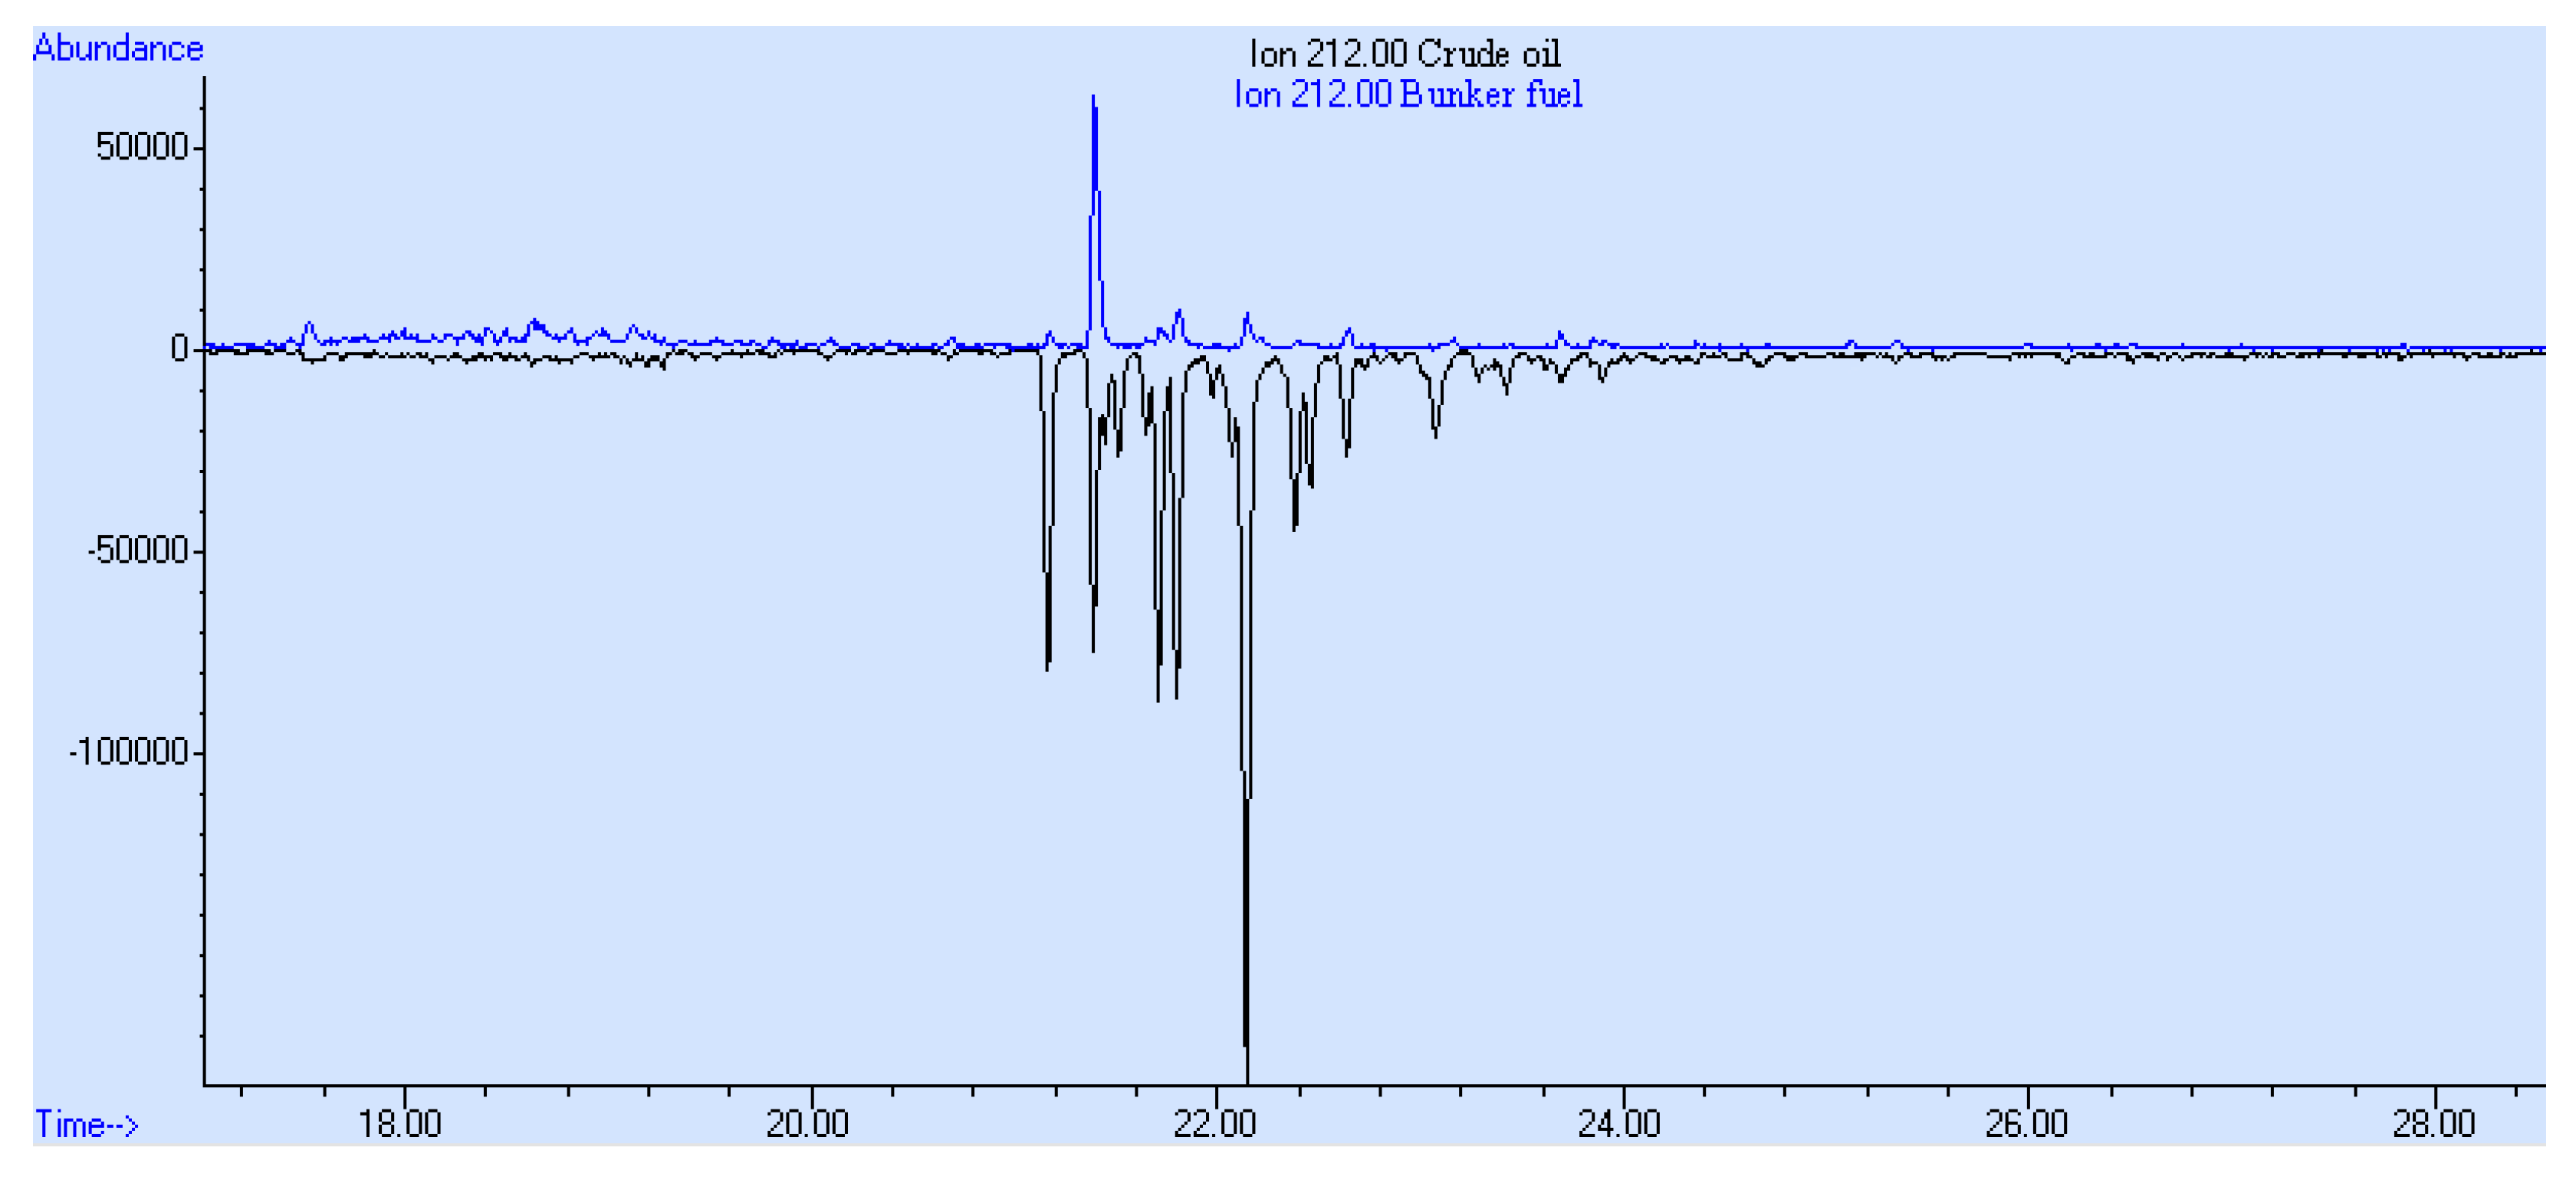
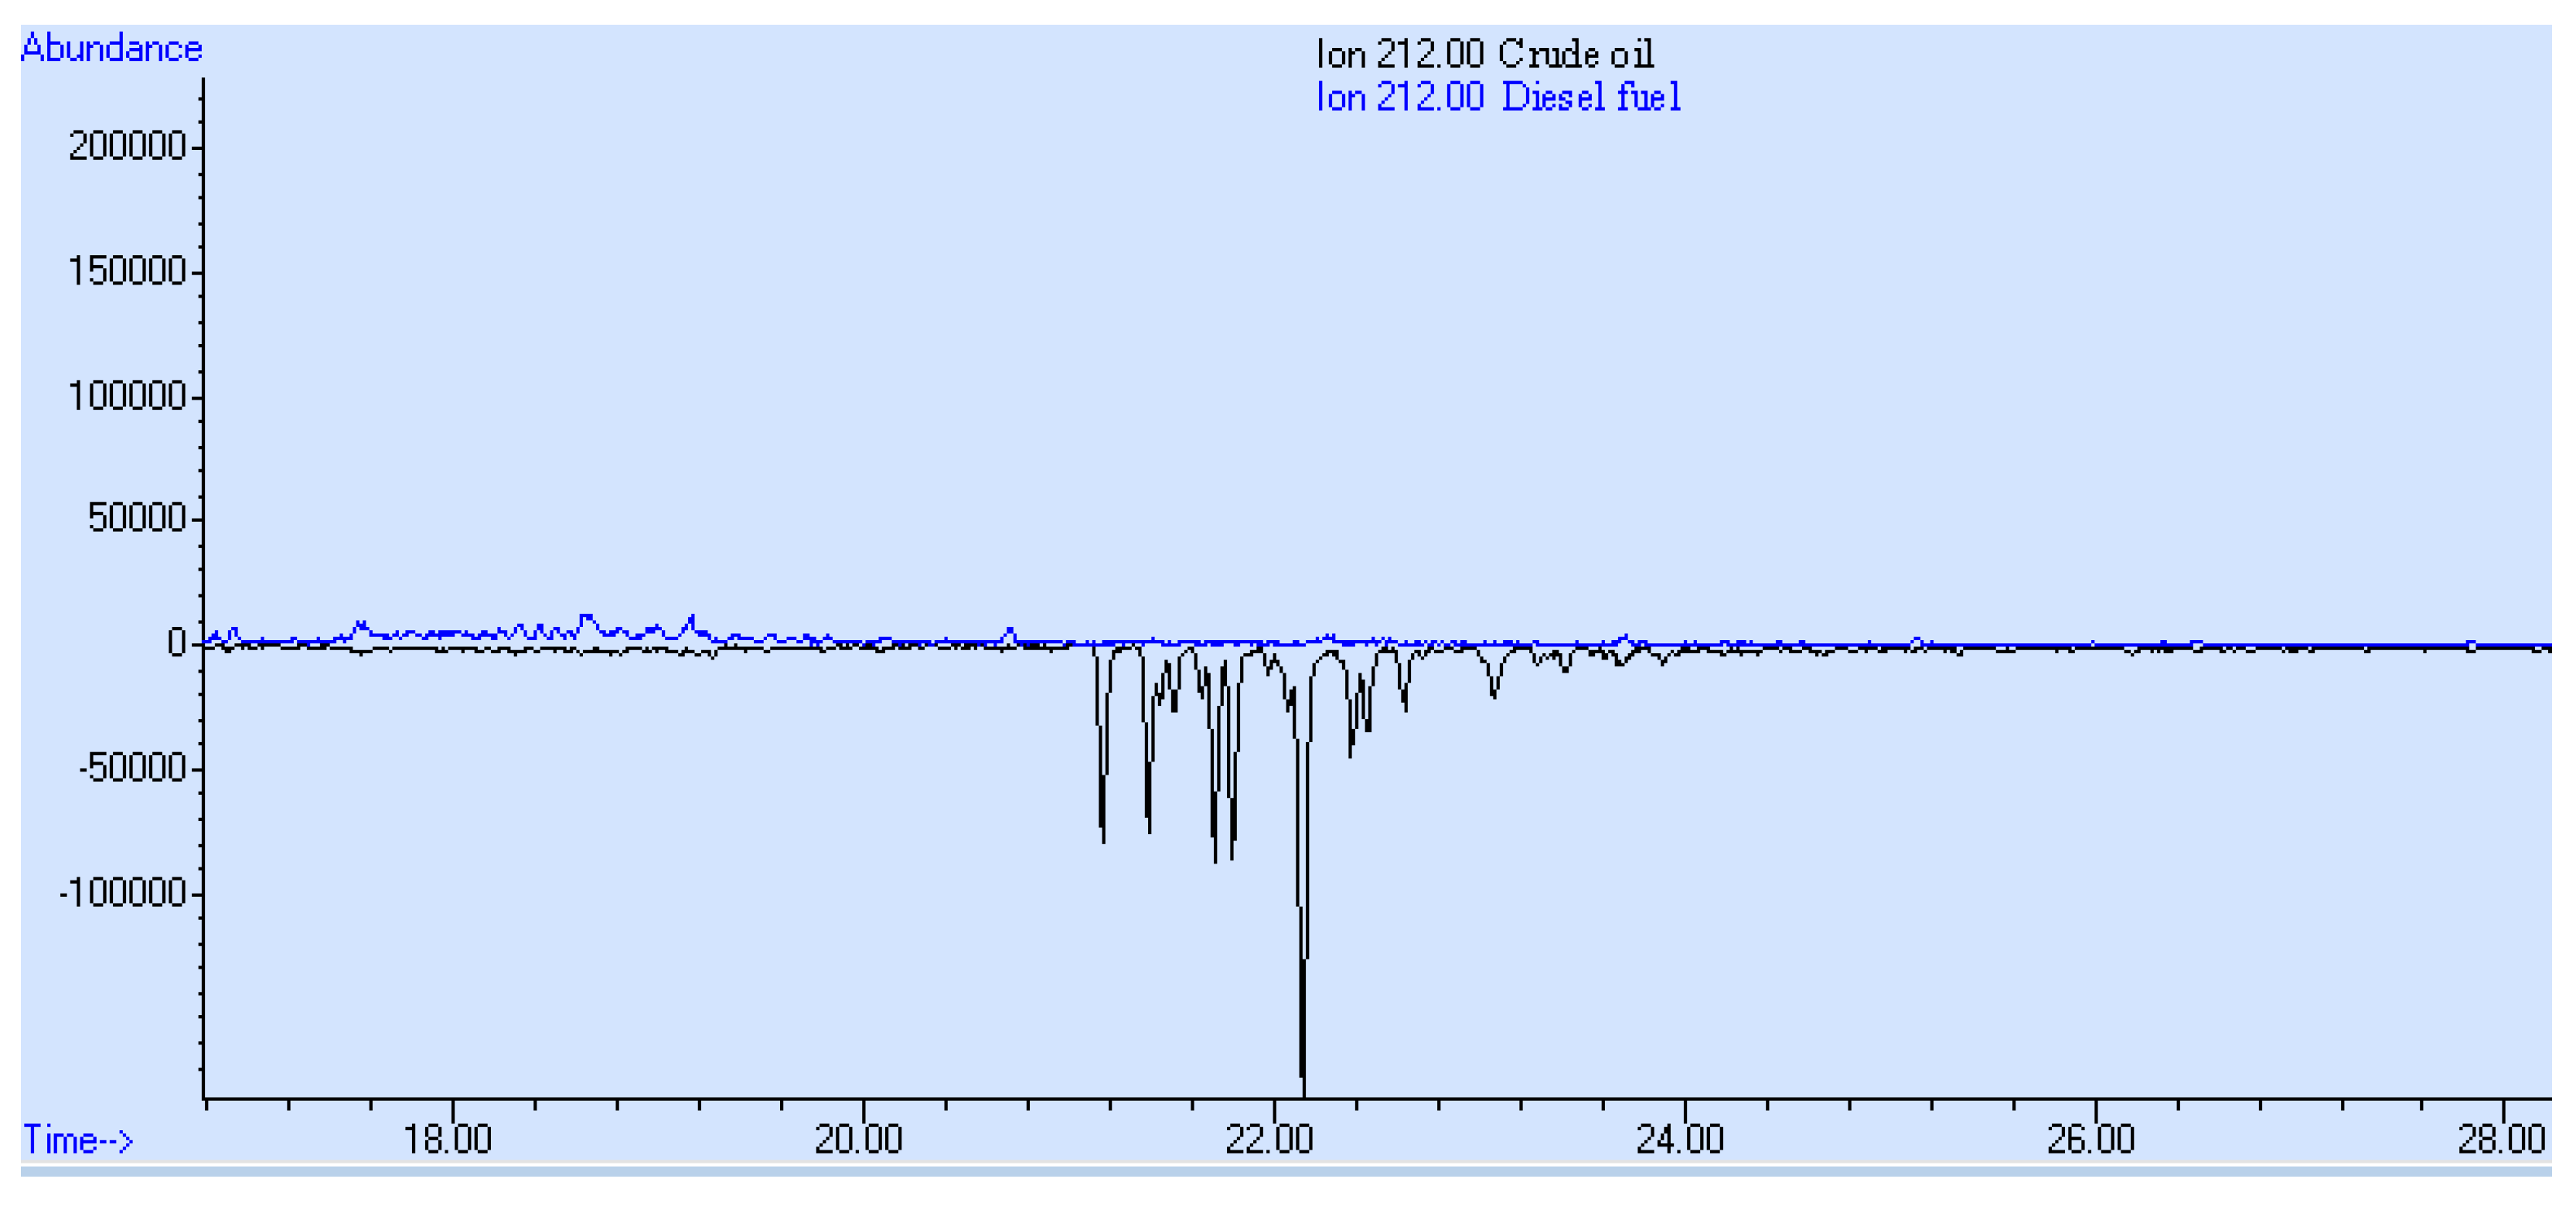
3. Results and Discussion

Identification of petroleum hydrocarbons and differentiation between crude oil and petroleum products were based on the total ion chromatographs (TICs) (Figure 2) and the extracted ion chromatographs (EICs) of the examining water and sediment samples [42]. Specifically, the following structural features were examined thoroughly by GC-MS:
  • The shape of chromatograms conforming to the standards peaks;
  • The ratio between n-alkanes with even and odd numbers of carbon atoms;
  • The ratio between phytane and pristine;
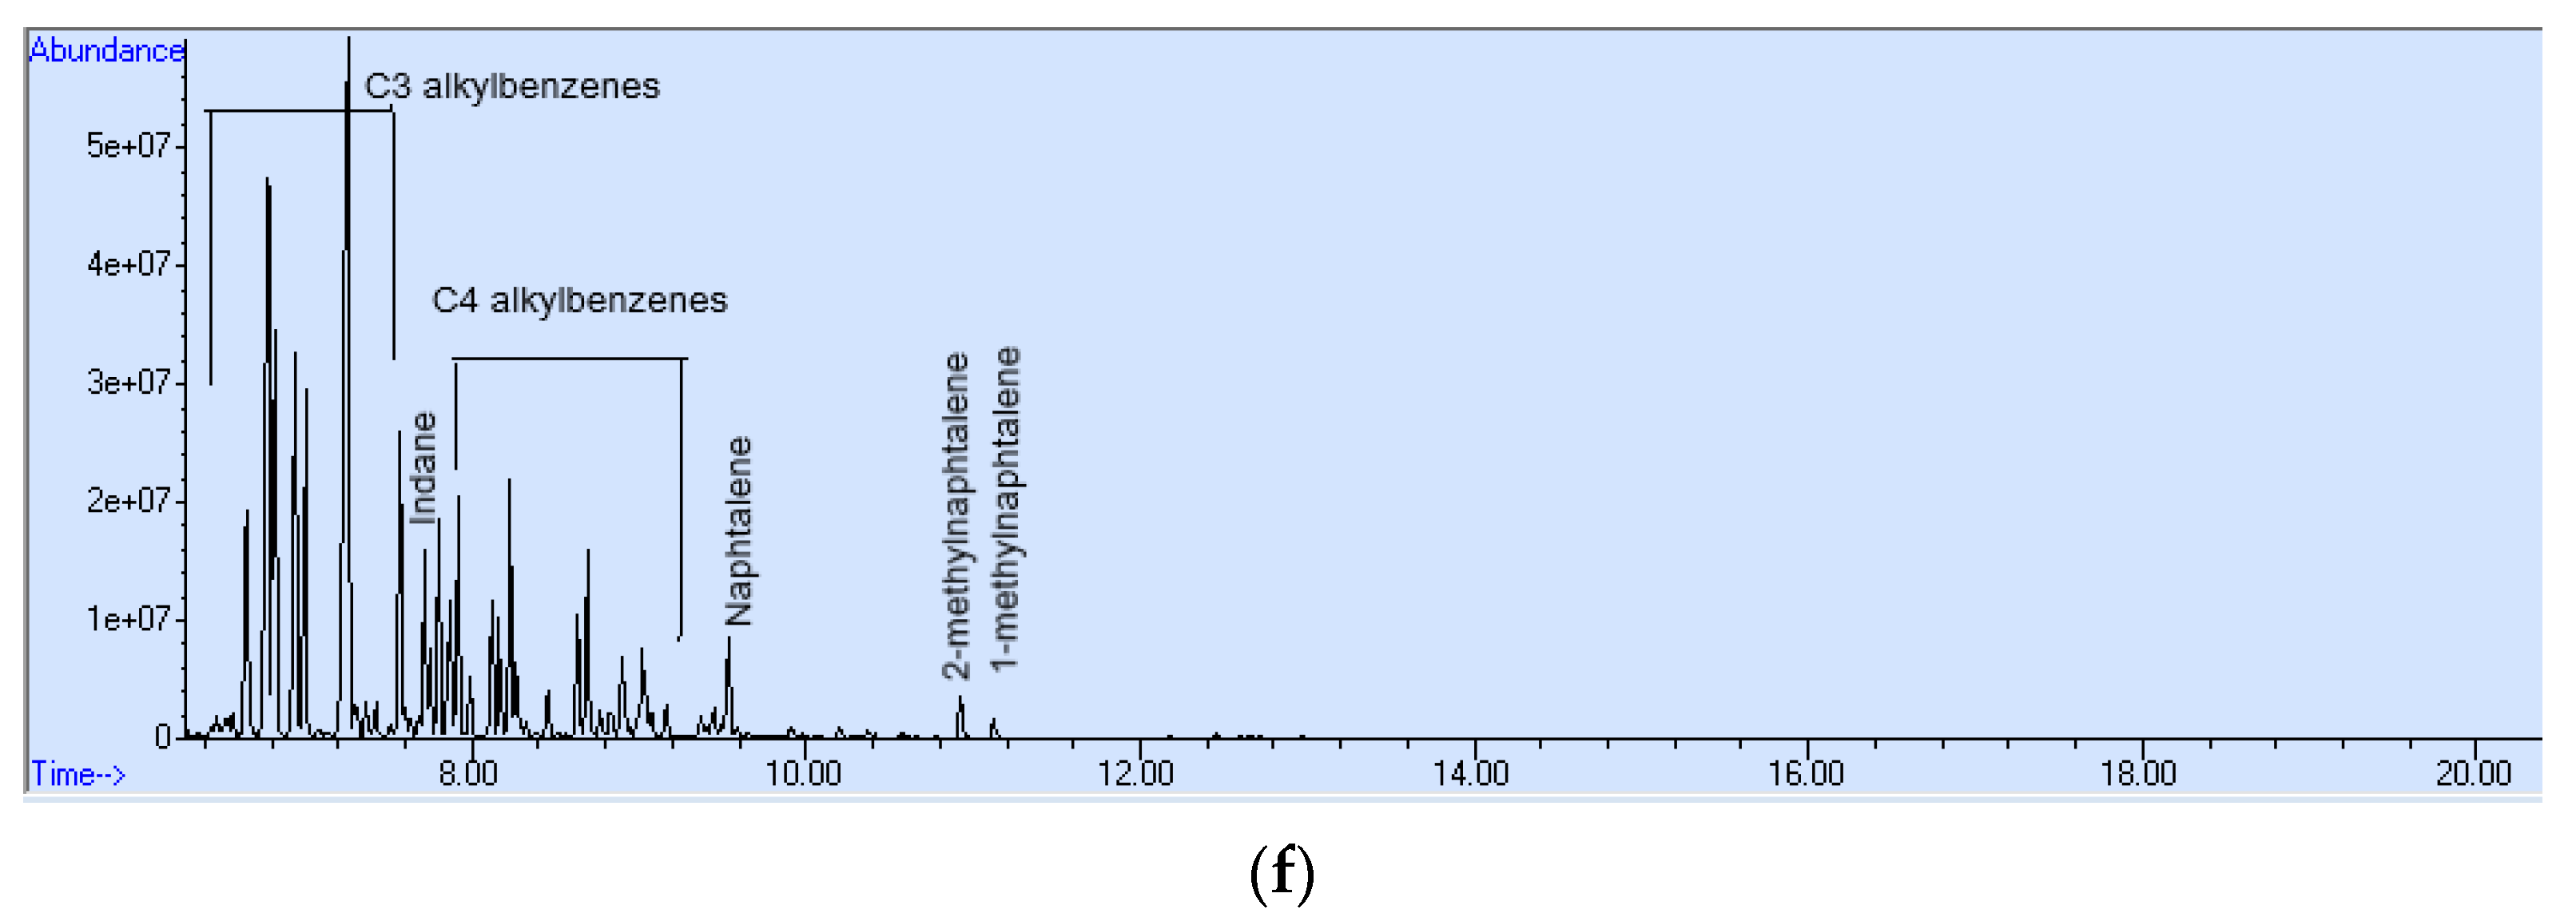
  • The presence of parent and alkylated PAHs;
  • The presence of alkyl-substituted and unsubstituted aromatic hydrocarbons;
  • The presence of sulfur heterocyclic aromatic compounds.
The refined petroleum products, such as heating oil, bunker oil, diesel fuel, gasoline, jet fuel, etc., may diverge in the carbon range, the hydrocarbon distribution pattern, and unresolved complex mixture (UCM) profile due to the various feedstocks of crude oil used in their production process [43]. Figure 2a illustrates the total ion chromatogram of the crude oil sample obtained from Prinos oilfield. It is dominated by even-numbered carbon atoms in a carbon range between C11-C34, which probably indicates anoxic, hyperasaline depositional environment. Moreover, the relatively low concentrations of n-alkanes in the carbon range between C21-C35 indicate additional evidence of marine origin [44]. The peaks of isoalkanes, cycloalkanes, and aromatic hydrocarbons appeared among peaks of n-alkanes with a lower intensity. The refined petroleum products are differentiated by the presence and concentration of the n-alkane peaks. After the C27 peak, n-alkanes were only present in the crude oil samples. In the heating oil (Figure 2b), the most abundant identified n-alkanes were C17 and C19, while in the bunker oil (Figure 2c), the distribution was more bell-shaped with a prevalence of C14 and C16. In the diesel fuel sample (Figure 2d), maxima were observed from nC14 to nC17, as well as peaks from fatty acid methyl esters (FAMEs) denoting the presence of biodiesel [45].
There were apparent differentiations in the chromatogram comparison of gasoline (Figure 2e) and jet fuel (Figure 2f) samples with crude oil and diesel oil samples, respectively. The chromatograms of gasoline and jet fuel illustrated peaks only within the C9–C12 window of n-alkanes. Gasoline as a light petroleum cut presents light-end, resolved hydrocarbons with very slight UCM content. The identification of gasoline in the environment is hard enough as volatile hydrocarbons evaporate rapidly. After leaving the spiked samples with gasoline for three days at room temperature, the chromatograms of the spiked samples revealed significant differences from the original samples with obvious evaporation of most gasoline components. Hence, the identification of gasoline is usually based on the detection of characteristic compounds, which are used as additives, such as methyl tert-butyl ether (MTBE) [46]. On the other hand, the TIC of the jet fuel sample (Figure 2f) was characterized by an abundance of aromatic compounds, such as C3 and C4 alkyl benzenes, and the presence of naphthalene, 1- and 2-methylnaphthalene, and indane.
EICs provided higher discrimination capacity among samples than TICs. The comparison of the EICs at m/z 57 (Figure 3) indicated a clear diversity in the occurrence of n-alkanes, isoprenoid alkanes, and mid-chain methylalkanes in samples. The n-alkanes of the diesel samples (heating oil, bunker oil, and diesel fuel) were distributed in a carbon range from n-C11 to n-C27, much narrower than the carbon range of crude oil sample from n-C11 to n-C34. Low molecular weight hydrocarbons (<n-C11) were evaporated under experimental conditions. In the crude oil sample, a little predominance of even over odd number of n-alkanes occurred, whereas, in the diesel samples, there was no preference for odd nor for even numbers.
The C19 and C20 isoprenoid compounds, pristane (Pr) and phytane (Ph) have particular diagnostic value in determining the source of oil. The Pr/Ph is a very commonly used ratio in oil spill fingerprinting. Pristane and phytane peaks were observed in the region between the peaks of C17 and C18 n-alkanes. They were identified by their m/z 183 fragments. Moreover, in the crude oil sample, phytane was predominant over pristane, and it was definitely the most abundant compound in the whole chromatogram. The low Pr/Ph ratio is a typical characteristic of the crude oil of the Kavala basin. Contrariwise, the Pr/Ph ratio of the petroleum products was more than 1.0 (Figure 4) [15,44].
For correlations among crude oil and refined products, the m/z 191 and m/z 217 chromatograms were considered principally useful. The m/z 191 is a characteristic ion fragment of the terpanes, whereas the m/z 217 is a characteristic fragment of the steranes [47]. Triterpanes and steranes are common biomarkers found in crude oils. They are considered very useful compounds for environmental forensic investigations due to their relative resistance to weathering processes [9,15]. Biomarker fingerprinting at m/z 191 (Figure 5) and 217 (Figure 6) revealed that no terpanes and steranes were detected in petroleum products samples. The main characteristic found in the chromatogram of the Prinos’ crude oil was the existence of gammacerane in high concentration, which indicates a high salinity environment in the genesis of petroleum [44].
Dibenzothiophene (DBT) and its derivatives comprise major polycyclic aromatic sulfur heterocyclic compounds found in crude oils and in sedimentary organic matter, providing useful information for studying petroleum correlations [48]. The identification of isomers of methyldibenzothiophene (MDBT) and isomers of dimethyldibenzothiophene (DMDBT) in crude oil was achieved by GC-MS in SIM mode at m/z 198 and 212, respectively [49]. Thus, differentiations in alkylated dibenzothiophenes between crude oil and diesel oil samples were detected at m/z 198, which is indicative of methyl-dibenzothiophenes compounds (Figure 7). Particularly, crude oil samples contained a much higher quantity of MDBT.
Furthermore, results have shown that between crude oil and diesel samples, no correlation occurred comparing their EIC at m/z 212. In the case of the crude oil sample, the abundance of DMDBT was higher enough compared to the bunker oil sample (Figure 8), while in the diesel fuel sample, the dimethyl-dibenzothiophenes were totally absent (Figure 9).
Eventually, the analysis of the TIC of the sediment and water samples clearly showed that there was no organic pollution suggesting that there was no impact from human activities on the part of the river under investigation. Moreover, no crude oil and organic toxic substances were detected from industrial waste, neither in river water nor in the river basin and seawater samples (Figure 10). PAHs were also not detected under the experimental conditions described previously. The interpretation of TIC was exactly the same for all sediment and water samples. The only peak observed was the surrogate’s solution peak (o-terphenyl). This result is of great significance for the Nestos River area, where no petroleum hydrocarbons were detected.
The results are in line with the reported literature. According to the monitoring study of Albanakis, et al. [50], the water of Nestos near the Thisavros dam was clear, although, in rainy seasons, pollution was exacerbated along the river course. Moreover, the COD (chemical oxygen demand) measured values of the groundwater of the Nestos River were less than 1.5 mg/L [31]. Likewise, Hatzianestis [51], Hatzianestis and Sklivagou [52], and Hatzianestis and Sklivagou [52] mentioned the role of rivers in transporting organic contaminants in the marine environment of Greece, characterizing Nestos River as a no hydrocarbon supplier in the marine environment.

4. Conclusions

The Nestos River and its surrounding area in Northern Greece were nominated by the BSB27-MONITOX research project as the study area of this research work due to the special Nestos River’s biodiversity in Europe and the nearby O&G production facilities. Petroleum forensic fingerprinting by GC-MS analysis was revealed as a useful tool for examining potential contamination of petroleum hydrocarbons’ presence in soil and water samples and identifying their source. No petroleum hydrocarbons were detected in all sediment and water samples collected from the area under investigation showing no evidence of environmental hazards associated with the hydrocarbon exploration and production activities of the neighboring O&G company.

Author Contributions

Conceptualization, S.M. and N.K.; methodology, S.M. and N.K.; software, S.M. and N.K.; validation, N.K. and S.M.; formal analysis, S.M., N.K., C.C., E.E. and Y.Y.; investigation, S.M., N.K., C.C., E.E. and Y.Y.; resources, S.M., N.K., C.C., E.E. and Y.Y.; data curation, S.M., N.K., E.E. and Y.Y.; writing—original draft preparation, N.K., S.M. and E.E.; writing—review and editing, N.K. and S.M.; visualization, N.K. and S.M.; supervision, S.M., N.K., T.S. and A.E.; project administration, S.M., N.K., T.S. and A.E.; funding acquisition, T.S. and A.E. All authors have read and agreed to the published version of the manuscript.

Funding

This research was funded by project BSB27-MONITOX (2018–2021), Joint Operational Programme Black Sea Basin 2014–2020. The APC is funded by Dunarea de Jos University of Galati, Romania.

Institutional Review Board Statement

Not applicable.

Informed Consent Statement

Not applicable.

Acknowledgments

Special thanks are due to Petroleum and Natural Gas Chemistry Laboratory and to Organic Chemistry Laboratory at the Department of Chemistry of the International Hellenic University for providing reference samples and scientific instrumentation. The MSc Program in Oil and Gas Technology at the Department of Chemistry of the International Hellenic University is gratefully acknowledged for its support by well-qualified and highly trained MSc candidates.

Conflicts of Interest

The authors declare no conflict of interest. The funders had no role in the design of the study, in the collection, analyses, or interpretation of data, in the writing of the manuscript, or in the decision to publish the results.

References

  1. Cholakov, G. Control of pollution in the petroleum industry. Pollut. Control Technol. 2009, 3, 86–107. [Google Scholar]
  2. Mariano, J.B.; Rovere, E. Environmental Impacts of the Oil Industry; LAP LAMBERT Academic Publishing: Sunnyvale, CA, USA, 2017. [Google Scholar]
  3. Wang, Z.; Fingas, M. Differentiation of the source of spilled oil and monitoring of the oil weathering process using gas chromatography-mass spectrometry. J. Chromatogr. A 1995, 712, 321–343. [Google Scholar] [CrossRef]
  4. Dincer Kırman, Z.; Sericano, J.L.; Wade, T.L.; Bianchi, T.S.; Marcantonio, F.; Kolker, A.S. Composition and depth distribution of hydrocarbons in barataria bay marsh sediments after the deepwater horizon oil spill. Environ. Pollut. 2016, 214, 101–113. [Google Scholar] [CrossRef] [PubMed]
  5. Ossai, I.C.; Ahmed, A.; Hassan, A.; Hamid, F.S. Remediation of soil and water contaminated with petroleum hydrocarbon: A review. Environ. Technol. Innov. 2020, 17, 100526. [Google Scholar] [CrossRef]
  6. Kuppusamy, S.; Maddela, N.R.; Megharaj, M.; Venkateswarlu, K. Impact of total petroleum hydrocarbons on human health. In Total Petroleum Hydrocarbons: Environmental Fate, Toxicity, and Remediation; Springer: Berlin/Heidelberg, Germany, 2020; pp. 139–165. [Google Scholar]
  7. Ahmed, F.; Fakhruddin, A.N.M. A review on environmental contamination of petroleum hydrocarbons and its biodegradation. Int. J. Environ. Sci. Nat. Res. 2018, 11, 63–69. [Google Scholar]
  8. Ramirez, M.I.; Arevalo, A.P.; Sotomayor, S.; Bailon-Moscoso, N. Contamination by oil crude extraction—Refinement and their effects on human health. Environ. Pollut. 2017, 231, 415–425. [Google Scholar] [CrossRef]
  9. Wang, Z.; Yang, C.; Yang, Z.; Brown, C.E.; Hollebone, B.P.; Stout, S.A. 4-petroleum biomarker fingerprinting for oil spill characterization and source identification. In Standard Handbook Oil Spill Environmental Forensics, 2nd ed.; Stout, S.A., Wang, Z., Eds.; Academic Press: Boston, MA, USA, 2016; pp. 131–254. [Google Scholar]
  10. Wang, Z.; Fingas, M.; Yang, C.; Christensen, J.H. Crude oil and refined product fingerprinting: Principles. In Environmental Forensics; Elsevier: Amsterdam, The Netherlands, 1964; pp. 339–407. [Google Scholar]
  11. Blomberg, J.; Schoenmakers, P.J.; Brinkman, U.A.T. Gas chromatographic methods for oil analysis. J. Chromatogr. A 2002, 37, 137–173. [Google Scholar] [CrossRef]
  12. Hunt, J.M. Petroleum Geochemistry and Geology; W.H. Freeman: New York, NY, USA, 1996. [Google Scholar]
  13. Wang, Z.; Fingas, M.; Page, D. Oil spill identification. J. Chromatogr. A 1999, 843, 369–411. [Google Scholar] [CrossRef]
  14. Walters, C.C.; Moldowan, J.M.; Peters, K.E. The Biomarker Guide: Biomarkers and Isotopes in the Environment and Human History, 2nd ed.; Cambridge University Press: Cambridge, UK, 2004; Volume 1, pp. 1–2. [Google Scholar]
  15. Yang, C.; Brown, C.E.; Hollebone, B.; Yang, Z.; Lambert, P.; Fieldhouse, B.; Landriault, M.; Wang, Z. Chemical fingerprints of crude oils and petroleum products. In Oil Spill Science and Technology; Elsevier: Amsterdam, The Netherlands, 2017; pp. 209–304. [Google Scholar]
  16. Barakat, A.O.; Mostafa, A.R.; Qian, Y.; Kennicutt, M.C. Application of petroleum hydrocarbon chemical fingerprinting in oil spill investigations—Gulf of Suez, Egypt. Spill Sci. Technol. Bull. 2002, 7, 229–239. [Google Scholar] [CrossRef]
  17. Wang, C.; Chen, B.; Zhang, B.; He, S.; Zhao, M. Fingerprint and weathering characteristics of crude oils after dalian oil spill, China. Mar. Pollut. Bull. 2013, 71, 64–68. [Google Scholar] [CrossRef]
  18. Wang, C.; He, S.; Zhang, H.; Li, Y. Fingerprint and weathering characteristics of petroleum hydrocarbons in the coastal zone following the “7-16” Dalian crude oil spill, China. In Oil Spill Environmental Forensics Case Studies; Elsevier: Amsterdam, The Netherlands, 2018; pp. 483–497. [Google Scholar]
  19. Wang, Z.; Fingas, M.; Sigouin, L. Characterization and source identification of an unknown spilled oil using fingerprinting techniques by gc-ms and gc-fid. LC GC N. Am. 2000, 18, 1058–1067. [Google Scholar]
  20. Kiepper, A.P.; Casilli, A.; Azevedo, D.A. Depositional paleoenvironment of brazilian crude oils from unusual biomarkers revealed using comprehensive two dimensional gas chromatography coupled to time of flight mass spectrometry. Org. Geochem. 2014, 70, 62–75. [Google Scholar] [CrossRef]
  21. Meyer, B.M.; Overton, E.B.; Turner, R.E. Oil source identification using diagnostic biomarker ratio analyses. Int. Oil Spill Conf. Proc. 2014, 2014, 2064–2073. [Google Scholar] [CrossRef]
  22. Yasser, M.M. Biomarkers. In Chromatography and Its Applications; Rania, E.M.E.D.S.D., Ed.; IntechOpen: Rijeka, Croatia, 2012; p. 9. [Google Scholar]
  23. Okparanma, R.N.; Mouazen, A.M. Determination of total petroleum hydrocarbon (tph) and polycyclic aromatic hydrocarbon (pah) in soils: A review of spectroscopic and nonspectroscopic techniques. Appl. Spectrosc. Rev. 2013, 48, 458–486. [Google Scholar] [CrossRef] [Green Version]
  24. Yang, C.; Zhang, G.; Wang, Z.; Yang, Z.; Hollebone, B.; Landriault, M.; Shah, K.; Brown, C.E. Development of a methodology for accurate quantitation of alkylated polycyclic aromatic hydrocarbons in petroleum and oil contaminated environmental samples. Anal. Methods 2014, 6, 7760–7771. [Google Scholar] [CrossRef]
  25. Rocha, A.C.; Palma, C. Source identification of polycyclic aromatic hydrocarbons in soil sediments: Application of different methods. Sci. Total Environ. 2019, 652, 1077–1089. [Google Scholar] [CrossRef]
  26. Zhao, Y.; Hong, B.; Fan, Y.; Wen, M.; Han, X. Accurate analysis of polycyclic aromatic hydrocarbons (pahs) and alkylated pahs homologs in crude oil for improving the gas chromatography/mass spectrometry performance. Ecotoxicol. Environ. Saf. 2014, 100, 242–250. [Google Scholar] [CrossRef]
  27. Sørensen, L.; Meier, S.; Mjøs, S.A. Application of gas chromatography/tandem mass spectrometry to determine a wide range of petrogenic alkylated polycyclic aromatic hydrocarbons in biotic samples: Application of gc/ms/ms to determine a wide range of alkylated pahs. Rapid Commun. Mass Spectrom. 2016, 30, 2052–2058. [Google Scholar] [CrossRef]
  28. Chakhmakhchev, A.; Suzuki, M.; Takayama, K. Distribution of alkylated dibenzothiophenes in petroleum as a tool for maturity assessments. Org. Geochem. 1997, 26, 483–489. [Google Scholar] [CrossRef]
  29. Li, M.; Wang, T.; Zhong, N.; Zhang, W.; Sadik, A.; Li, H. Ternary diagram of fluorenes, dibenzothiophenes and dibenzofurans: Indicating depositional environment of crude oil source rocks. Energy Explor. Exploit. 2013, 31, 569–588. [Google Scholar] [CrossRef]
  30. Zeigler, C.; Schantz, M.; Wise, S.; Robbat, A. Mass spectra and retention indexes for polycyclic aromatic sulfur heterocycles and some alkylated analogs. Polycycl. Aromat. Compd. 2012, 32, 154–176. [Google Scholar] [CrossRef]
  31. TAP. Integrated Esia Greece Annex 6.6.2—Groundwater Baseline Study; Trans Adriatic Pipeline: Athens, Greece, 2013. [Google Scholar]
  32. Christoforidis, A.; Stamatis, N.; Schmieder, K.; Tsachalidis, E. Organochlorine and mercury contamination in fish tissues from the river Nestos, Greece. Chemosphere 2008, 70, 694–702. [Google Scholar] [CrossRef] [PubMed]
  33. Petalas, C.; Pliakas, F.; Diamantis, I.; Kallioras, A. Development of an integrated conceptual model for the rational management of the transboundary nestos river, greece. Environ. Geol. 2005, 48, 941–954. [Google Scholar] [CrossRef]
  34. Zaimes, G.N.; Gounaridis, D.; Fotakis, D. Assessing riparian land-uses/vegetation cover along the Nestos river in Greece. Fresenius Environ. Bull. 2011, 20, 3217–3225. [Google Scholar]
  35. Zaimes, G.N.; Iakovoglou, V.; Syropoulos, D.; Kaltsas, D.; Avtzis, D. Article assessment of two adjacent mountainous riparian areas along Nestos river tributaries of Greece. Forests 2021, 12, 1284. [Google Scholar] [CrossRef]
  36. Zaimes, G.N.; Gounaridis, D.; Symeonakis, E. Assessing the impact of dams on riparian and deltaic vegetation using remotely-sensed vegetation indices and random forests modelling. Ecol. Indic. 2019, 103, 630–641. [Google Scholar] [CrossRef]
  37. Papastergios, G.; Fernández-Turiel, J.-L.; Georgakopoulos, A.; Gimeno, D. Natural and anthropogenic effects on the sediment geochemistry of Nestos river, northern Greece. Environ. Geol. 2009, 58, 1361–1370. [Google Scholar] [CrossRef]
  38. Kallioras, A.; Pliakas, F.; Diamantis, I. The legislative framework and policy for the water resources management of transboundary rivers in europe: The case of Nestos/Mesta river, between Greece and Bulgaria. Environ. Sci. Policy 2006, 9, 291–301. [Google Scholar] [CrossRef]
  39. Psilovikos, A.; Margoni, S.; Psilovikos, A. Simulation and trend analysis of the water quality monitoring daily data in Nestos river delta. Contribution to the sustainable management and results for the years 2000–2002. Environ. Monit. Assess. 2006, 116, 543–562. [Google Scholar] [CrossRef]
  40. Emmanouloudis, D.; Myronidis, D.; Panilas, S.; Efthimiou, G. The Role of Sediments in the Dynamics and Preservation of the Aquatic Forest in the Nestos Delta (Northern Greece); IAHS-AISH Publication: Wallingford, UK, 2006; pp. 214–222. [Google Scholar]
  41. Edgell, K.W.; Wesselman, R.J. USEPA (Environmental Protection Agency) Method Study 36 sw-846 Methods 8270/3510, gc/ms (Gas Chromatography/Mass Spectrometry) Method for Semivolatile Organics: Capillary-Column Technique Separatory-Funnel Liquid-Liquid Extraction. Final Report, September 1986–December 1987; United States Environmental Protection Agency: Washington, DC, USA, 1989.
  42. Hsu, C.S.; Walters, C.C.; Isaksen, G.H.; Schaps, M.E.; Peters, K.E. Biomarker analysis in petroleum exploration. In Analytical Advances for Hydrocarbon Research; Hsu, C.S., Ed.; Springer: Berlin/Heidelberg, Germany, 2003; pp. 223–245. [Google Scholar]
  43. Stout, S.A.; Wang, Z. 3-chemical fingerprinting methods and factors affecting petroleum fingerprints in the environment. In Standard Handbook Oil Spill Environmental Forensics, 2nd ed.; Stout, S.A., Wang, Z., Eds.; Academic Press: Boston, MA, USA, 2016; pp. 61–129. [Google Scholar]
  44. Kiomourtzi, P.; Pasadakis, N.; Zelilidis, A. Source rock and depositional environment study of three hydrocarbon fields in Prinos–Kavala basin (north Aegean). Open Pet. Eng. J. 2008, 1, 16–29. [Google Scholar] [CrossRef] [Green Version]
  45. Ko, M.-S.; Lee, S. Discrimination methods for diesel origin by analyzing fatty acid methyl ester (fame) composition in diesel-contaminated soil. Sci. Rep. 2021, 11, 16245. [Google Scholar] [CrossRef] [PubMed]
  46. Suppajariyawat, P.; Andrade, A.F.B.d.; Elie, M.; Baron, M.; Gonzalez-Rodriguez, J. The use of chemical composition and additives to classify petrol and diesel using gas chromatography–mass spectrometry and chemometric analysis: A UK study. Open Chem. 2019, 17, 183–197. [Google Scholar] [CrossRef]
  47. Yang, C.; Wang, Z.; Liu, Y.; Yang, Z.; Li, Y.; Shah, K.; Zhang, G.; Landriault, M.; Hollebone, B.; Brown, C.; et al. Aromatic steroids in crude oils and petroleum products and their applications in forensic oil spill identification. Environ. Forensics 2013, 14, 278–293. [Google Scholar] [CrossRef]
  48. Hegazi, A.H.; Andersson, J.T. 6-polycyclic aromatic sulfur heterocycles as source diagnostics of petroleum pollutants in the marine environment. In Standard Handbook Oil Spill Environmental Forensics, 2nd ed.; Stout, S.A., Wang, Z., Eds.; Academic Press: Boston, MA, USA, 2016; pp. 313–342. [Google Scholar]
  49. Zeigler, C.D.; Robbat, A. Comprehensive profiling of coal tar and crude oil to obtain mass spectra and retention indices for alkylated pah shows why current methods err. Environ. Sci. Technol. 2012, 46, 3935–3942. [Google Scholar] [CrossRef]
  50. Albanakis, K.; Psilovikos, A.; Margoni, S.; Styllas, M. Some recent observations on the nestos river sediment outflow and dispersion in the deltaic region. In Proceedings of the INTERREG Meeting—North Aegean System Functioning and Inter-Regional Pollution, Kavala, Greece, 28–30 May 2001; p. 18. [Google Scholar]
  51. Hatzianestis, I. The role of rivers in transporting organic contaminants in the marine environment of Greece. Geophys. Res. Abstr. 2013, 15, 11873. [Google Scholar]
  52. Hatzianestis, I.; Sklivagou, E. Dissolved and suspended polycyclic aromatic hydrocarbons (pah) in the north Aegean sea. Mediterr. Mar. Sci. 2002, 3, 89–98. [Google Scholar] [CrossRef]
Figure 1. Map of study area indicating the positions of water and sediment sampling across the river, in the deltaic area, and in the sea.
Applsci 12 01636 g001
Figure 2. Total ion chromatogram (TIC) of (a) crude oil and petroleum products samples: (b) heating oil, (c) bunker oil, (d) diesel fuel, (e) gasoline, and (f) jet fuel. Cx = n-alkanes with x carbon atoms, Cx:y = fatty acid methyl esters with x carbon atoms, and y unsaturation. Ph: phytane, Pr: pristane.
Applsci 12 01636 g002aApplsci 12 01636 g002b
Figure 3. EIC comparison of m/z 57 between crude oil and diesel samples (heating oil, bunker oil, and diesel fuel).
Applsci 12 01636 g003
Figure 4. Comparison of Pr/Ph ratio between crude oil and petroleum products.
Applsci 12 01636 g004
Figure 5. Comparison of EIC at m/z 191 between crude oil and banker oil samples.
Applsci 12 01636 g005
Figure 6. Comparison of EIC at m/z 217 between crude oil and heating oil samples.
Applsci 12 01636 g006
Figure 7. Comparison of EIC at m/z 198 between crude oil and bunker oil samples.
Applsci 12 01636 g007
Figure 8. Comparison of EIC at m/z 212 between crude oil and bunker oil samples.
Applsci 12 01636 g008
Figure 9. Comparison of EIC at m/z 212 between crude oil and diesel fuel samples.
Applsci 12 01636 g009
Figure 10. Indicative TIC of the sediment and water samples from the study area.
Applsci 12 01636 g010
Table 1. Reagents used in the research.
Reagents Company
O-terphenylMerck
DichloromethaneCarlo Erba
AcetoneMerck
n-HexaneMerck
NaphthaleneSigma-Aldrich
AnthraceneSigma-Aldrich
FluoreneFluka
PhenanthreneFluka
Clean sedimentSigma-Aldrich
Anhydrous sodium sulfatePanreac
Publisher’s Note: MDPI stays neutral with regard to jurisdictional claims in published maps and institutional affiliations.

