Article

Prestress Force Monitoring and Quantification of Precast Segmental Beams through Neutral Axis Location Identification

1
Centre for Infrastructural Monitoring and Protection, School of Civil and Mechanical Engineering, Curtin University, Kent Street, Bentley, WA 6102, Australia
2
College of Civil Engineering, Hefei University of Technology, Hefei 230009, China
*
Author to whom correspondence should be addressed.
Appl. Sci. 2022, 12(5), 2756; https://doi.org/10.3390/app12052756
Submission received: 10 January 2022 / Revised: 20 February 2022 / Accepted: 28 February 2022 / Published: 7 March 2022
(This article belongs to the Special Issue Inspection and Monitoring Techniques for Bridges and Civil Structures)

Abstract

:
This paper proposes using neutral axis locations to monitor and quantify the prestress force in post-tensioned precast segmental beams. Strain measurements are used to obtain the neutral axis locations of specific cross-sections of the precast prestressed segmental beams, based on the plane–remains–plane and linear strain distribution assumption. A theoretical calculation method based on the static equilibrium of a specific cross-section is developed to calculate the prestress force in segmental beams based on the neutral axis location. To verify the accuracy of the proposed method, a post-tensioned prestressed segmental beam is built and tested in the laboratory. A corresponding high-fidelity finite element model is also developed based on the beam design and material properties. Experimental studies and numerical simulations are conducted to verify the feasibility and accuracy of the proposed method in quantifying the prestress force in precast segmental beams. Both experimental and numerical results demonstrate that the proposed method can reliably estimate the prestress force, which can be used to monitor the prestress force loss in post-tensioned structures.

1. Introduction

Loss of prestress force jeopardizes the structural integrity, and in extreme cases could lead to catastrophic collapse of prefabricated segmented structures. As prefabrication has been becoming more and more popular in construction, effective monitoring of the prestress force is one of the primary concerns for management of prefabricated structures. Many studies have been conducted to investigate the effect of prestress force on the vibration characteristics of prestressed concrete beams for developing methods to monitor the prestress force through vibration tests. The researchers [1,2,3] reported that an increase in the prestress force could lead to a decrease in the natural vibration frequencies of prestressed beams. However, different, or even opposite observations and conclusions have also been reported, with respect to the effect of prestress force on the natural vibration frequency of the prestressed concrete beams. The studies [4,5,6,7] concluded that the prestress force has a negligible effect on the vibration frequencies of prestressed beams, while [8,9,10,11] have demonstrated that prestress force and natural vibration frequency are positively correlated. Besides the mixed observations of the relationship between prestress force and vibration frequency, the vibration frequency of a structure is not always sensitive to the change in prestress force [12]. The effectiveness of using the natural vibration frequency as a feature to evaluate prestress force is also affected by other factors, e.g., measurement noise [13,14], temperature, and humidity [14,15], which may cause even more substantial variations in vibration frequencies of a structure than the change in prestress force. Therefore, the natural vibration frequencies of prefabricated structures, although they are relatively easily obtained through vibration tests, are not a reliable indicator for identification of the changes of the prestress force.
The neutral axis is a universal parameter of beam-like structures that is related to the centroid of stiffness in a cross-section. Anastasopoulos et al. [14] reported that temperature changes in a concrete beam do not have a measurable influence on the neutral axis location, which is directly related with bending stiffness of the structural cross-section. The neutral axis location is only dependent on the material and geometric properties of the beam cross-section [16]. It remains stable under changing temperature, and it is insensitive to environmental noise, therefore making it a promising feature for structural condition identification. This characteristic of the neutral axis implies that it has the potential to be used for damage detection [17,18,19,20], and condition assessment of the structures due to typical damage such as cracking, delamination, and loss of materials, which affects the cross-section, and may lead to a change in the location of the centroid [17]. The above studies focused on using the neutral axis location to detect whether damage has occurred. However, the possibility and feasibility of using the neutral axis location to quantify the prestress force, to the best of our knowledge, is yet to be reported. Since the neutral axis location depends on the force equilibrium over the cross-section, identification of the neutral axis location would lead to the determination of prestress force. Abdel-Jaber and Glisic [21] reviewed the currently available prestress force monitoring methods for prestressed concrete structures, and found that most studies focused on monitoring the occurrence of prestress force loss rather than the quantification of the prestress force level.
In recent years, precast prestressed segmental beams have been widely used in bridge constructions around the world, owing to the merits of better quality control and efficient construction on site. The prestress force has a significant effect on the static flexural and dynamic behavior of the precast prestressed segmental beams, and the loss of prestress force owing to the corrosion or other causes, such as relaxation or friction, could affect the service life of precast segmental beams [22,23]. Therefore, monitoring the prestress force loss and quantifying the prestress force in precast prestressed segmental beams is essential to ensure the integrity and performance of the prefabricated structures.
In this paper, a theoretical method is proposed to quantify the prestress force in precast segmental beams, based on strain measurements to obtain the neutral axis location. This method is developed based on the static equilibrium over a specific cross-section of the segmental beam. Experimental tests on a scaled precast segmental concrete beam with post-tensioned unbonded external prestressed tendons are conducted to verify the proposed approach. The corresponding high-fidelity FEM of the tested segmental beam is also established. Parametric sensitivity analysis is conducted using the verified FEM to identify the most sensitive parameters to the prestress force change. The response surface (RS) method is used to update the initial FEM based on the measured static displacement responses and the neutral axis location, to refine and ensure that the updated FEM can better reflect the behavior and status of the real tested structure. Numerical simulations for quantifying the prestress force by using the proposed approach are conducted. Based on experimental verifications and numerical simulations, the accuracy and reliability of the proposed approach for quantifying the prestress force are validated.
The reminder of this paper is organized as follows. Section 2 provides a detailed theoretical derivation for quantifying the prestress force in precast segmental beams based on neutral axis location obtained from strain measurements. Section 3 describes the experimental testing specimen of the prestressed segmental beam. This section includes a detailed description of the design, the geometry and material properties of the tested prestressed segmental beam. Experimental test setup, post-tensioning process, loading process, and strain data acquisition are described in this section. The experimental validation on the proposed approach is conducted, and the discussions on the difference between the theoretically predicted and experimental measured results are also provided in this section. Section 4 describes a corresponding high-fidelity FEM based on the design of the experimental segmental beam. In Section 5, the parametric sensitivity analysis and model updating are conducted for refining the initial model. Numerical simulations with different levels of prestress forces are conducted, and the strain measurements are taken. Studies are conducted to further validate the accuracy of using the proposed approach for quantifying the prestress force with the strain data in numerical simulations. In addition, the strain responses at the web of the bridge model subjected to a dynamic load are also used for identifying the prestress force by the proposed method. Section 6 provides a brief conclusion and discussion of the feasibility and accuracy of the proposed approach.

2. Theoretical Derivation

In this study, a static equilibrium over a cross-section of the prestressed segmental beam is employed to obtain the neutral axis location with strain measurement data. The strain data-based methods were used for obtaining the neutral-axis location due to the maturity of the well-established relationship between strain and stress [21]. This cross-section analysis uses strain values on a specific cross-section of a segmental beam to compute the neutral axis location by adopting the assumption of the linear strain distribution. Figure 1 shows two parallel strain gauges installed at the web in the longitudinal direction, with one placed at the top denoted as ε st and one at the bottom denoted as ε sb , with a distance of h between them. The distance between the bottom strain gauge and the bottom of the beam section is denoted as m . The neutral axis location X 0 can be calculated based on the linear strain distribution as [24]:
X 0 = ε sb h ( ε sb + ε st ) + m
By assuming linear strain distributions, which implies the cross-section remains plane during deformation, and the beam is considered to be composed of discrete linear fibers [20], the longitudinal strain ε I at any point on the cross-section of the beam can be calculated based on the distance hi from the neutral axis location. The strains at the top and bottom of the cross-section of the beam are denoted as ε t and ε b , respectively, as shown in Figure 1. The relationship between I and ε sb , and the ratio of the top strain gauge ε st and bottom strain gauge ε sb can be expressed as:
ε i ε sb = h i h sb ,   ε st ε sb = h st   h sb
where I i , h sb and h st , as indicated in Figure 1, represent the distances from the point of interest, bottom strain gauge, and top strain gauge to the neutral axis, respectively.
During the post-tensioning process, only the stress in the prestress tendons causes the deformation of the entire precast segmental beam, since no external loading force is applied on the beam. Accordingly, the static equilibrium of a specific cross-section of the segmental beam with the post-tensioning force is obtained, as shown in Equation (3). The schematic of the force equilibrium of the beam is illustrated in Figure 2.
A σ dA = F
During the post-tensioning process, concrete is in the linear elastic range, wherein stress σ is proportional to strain ε . Following Hooke’s law, it has σ   = ε   × E C , where E C denotes the elastic modulus of concrete. The concrete stresses at the top and bottom locations at the cross-section of the beam are denoted as σ b and σ t , respectively, as shown in Figure 2. Since tensile reinforcements, which discontinue between segments, have only small deformation, and remain in the elastic range ( σ s < f y ) , the stress of the reinforcements can be calculated from the corresponding strain by σ s = ε s × E s , where E s is the elastic modulus of steel. Accordingly, based on the static equilibrium of the cross-section, the relationship between the neutral axis location X 0 and the prestress force F can be derived from the below equation:
0 X 0   f σ i bdy σ bs A bs σ ms A ms F + X 0 H b f σ i bdy + H b H   f σ i b f dy + σ ts A ts = 0
where f σ i denotes a function of the stress distribution along the cross-section, which is calculated based on the strain distribution over the cross-section. A ts and σ ts represent the area and stress of the top reinforcements, respectively; A bs and σ bs are the area and stress of the bottom reinforcements, respectively; and A ms and σ ms denote the area and stress of the middle reinforcements, i.e., the reinforcements above the prestress tendon, which may or may not exist in practice, respectively. These reinforcements are included herein for the completeness. H b represents the height of the flange, and H is the total height of the cross-section of the structure; b and b f are the web thickness and flange width of the T-shaped cross-section, respectively. Therefore, the prestress force of the tendon can be calculated as:
F = ( σ t + σ b ) 2 H 2 bX 0 2 + bH   b 2 + b f H     2 b f H   b 2 + σ b 2 bX 0 bH b b f H   + b f H b σ bs A bs σ ms A ms + σ ts A ts
In this paper, experimental investigations and numerical verification of this proposed approach for quantifying the prestress force in a segmental beam are conducted. The results are compared to those obtained in the test to verify the reliability and accuracy of the proposed method. The relative errors between experimental measured and theoretically predicted prestress forces, and between numerically simulated and theoretically predicted prestress forces, are calculated and denoted by using the symbol ‘RE’ in the subsequent studies.

3. Experimental Verification

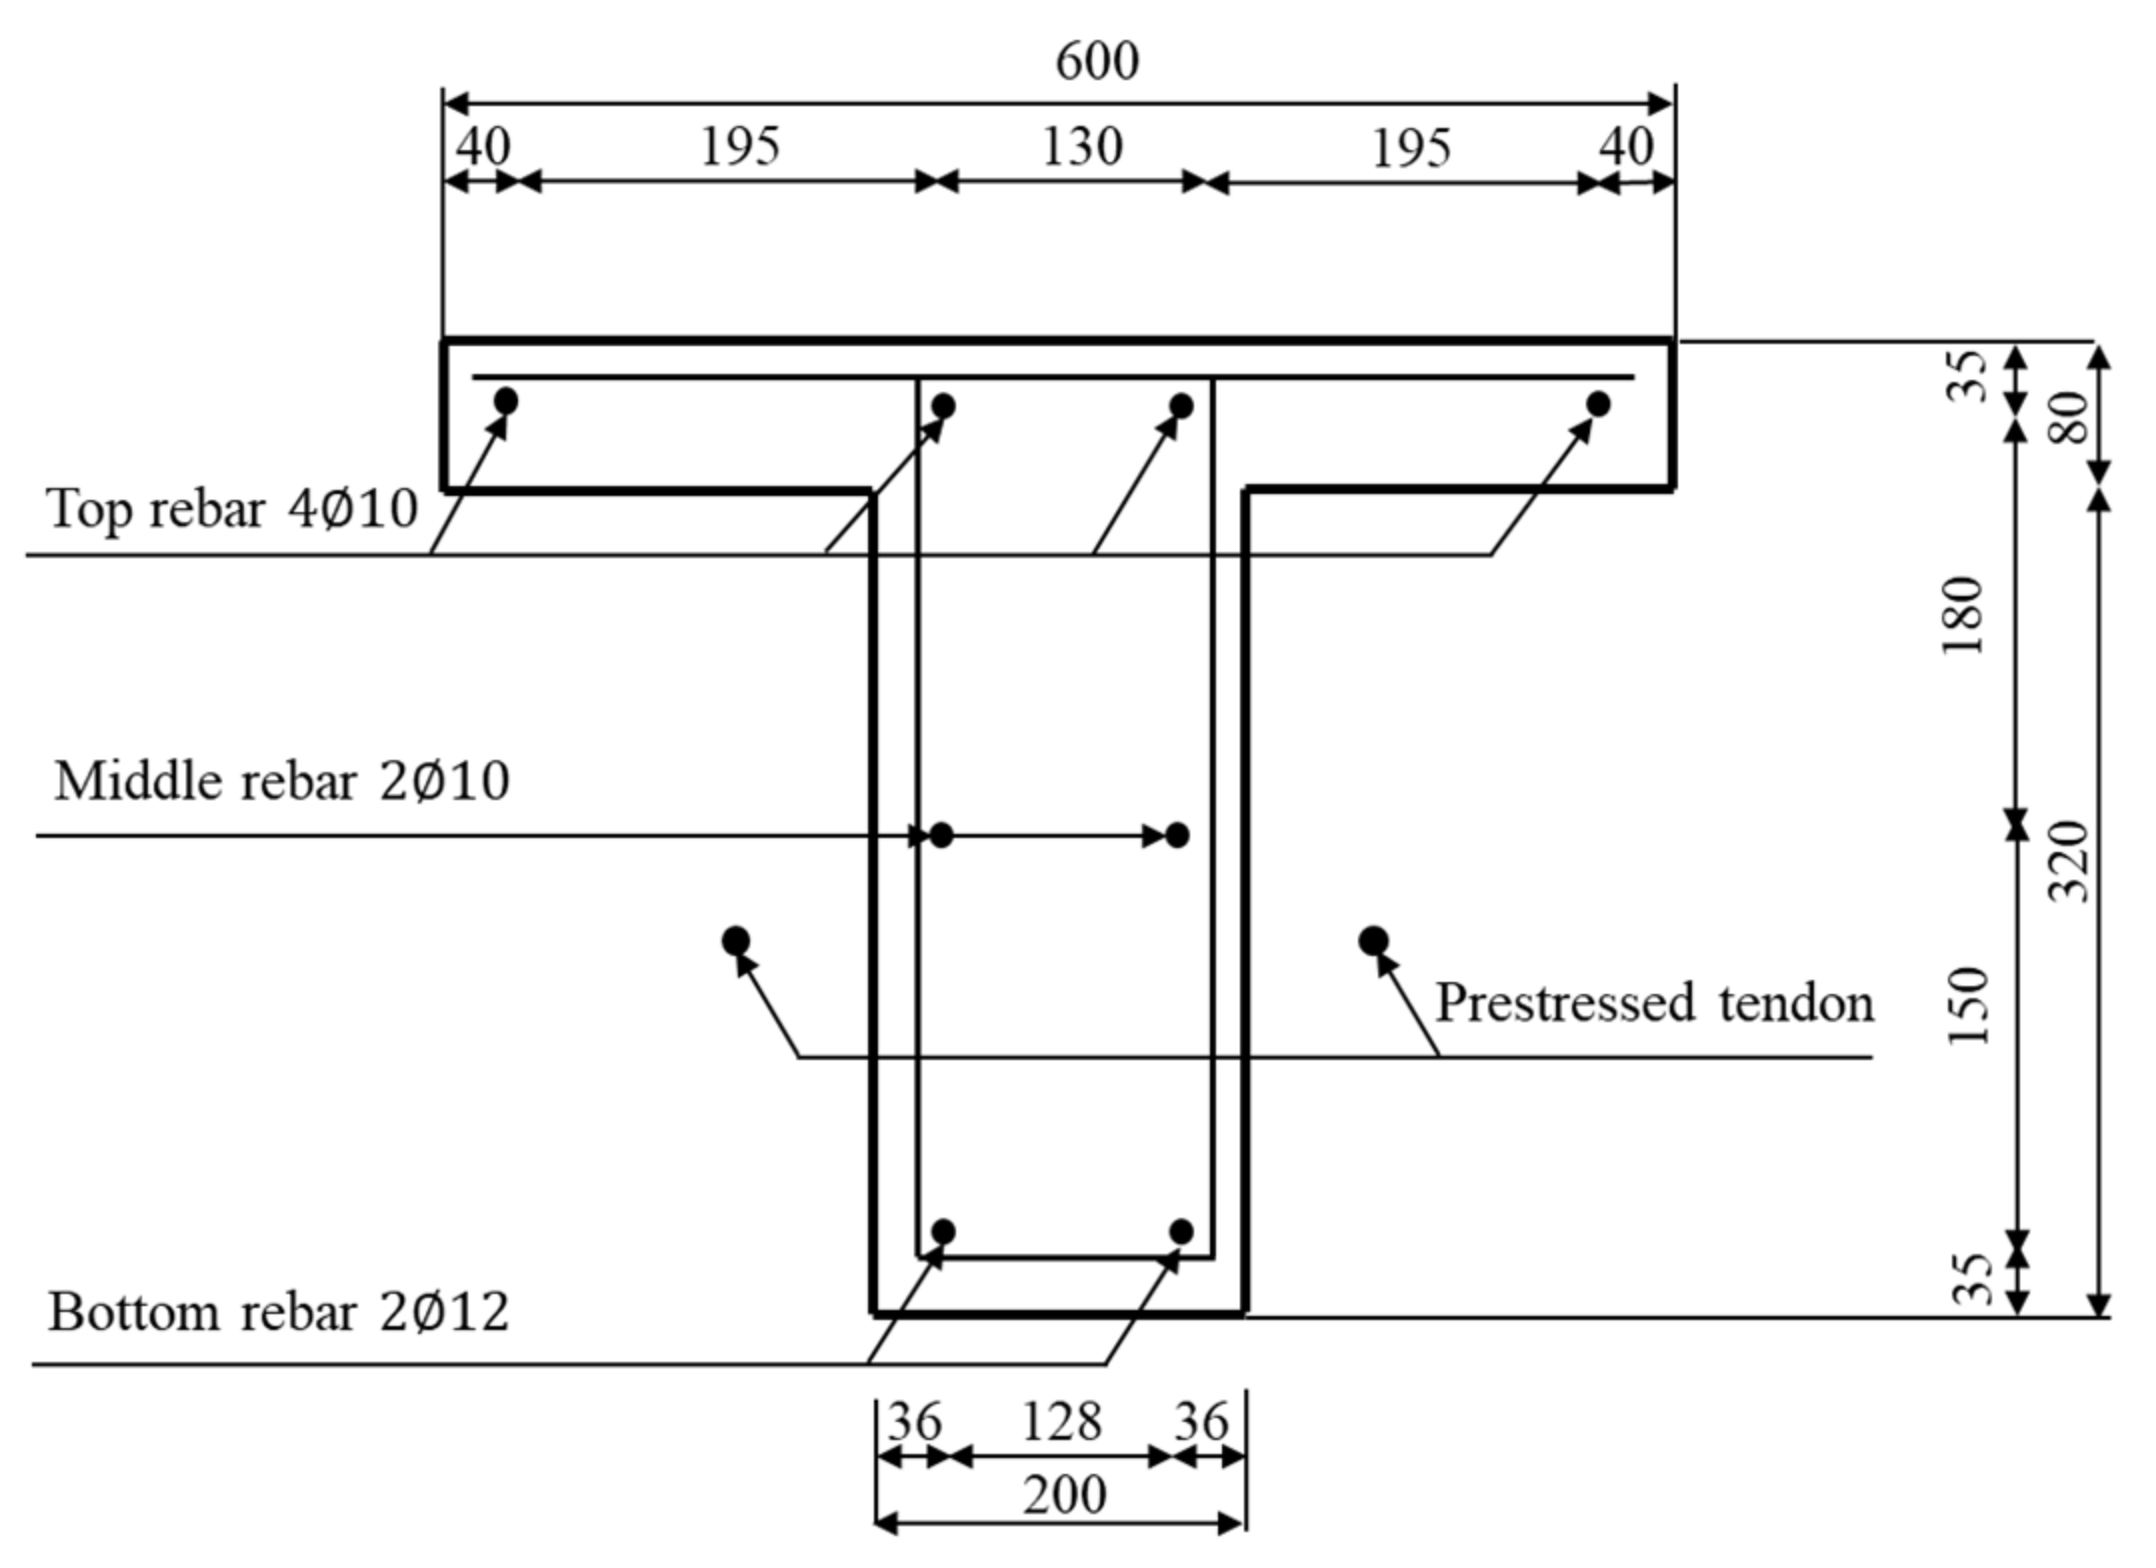
3.1. Description of the Experimental Beam

In this study, a scaled precast segmental concrete beam with external post-tensioned unbonded tendons is fabricated, as shown in Figure 3. The total length of the precast prestressed segmental beam is 3.9 m. This precast segmental beam consists of four concrete segments, which are connected by two external post-tensioned unbonded tendons. The cross-section of the tested beam is shown in Figure 4. The height of the cross-section is 400 mm. The dimensions of the web of the T-shaped cross-section are 200 mm × 320 mm, and the flange size is 600 mm × 80 mm. The dry joints between every two segments are designed with multiple shear keys. Young’s modulus of the concrete used in the segmental beam measures 3.047 × 10¹⁰ Pa. More detailed information of the tested beam can be found in Le et al. [22]. The material properties of steel reinforcement bars and prestressed steel tendons are listed in Table 1.

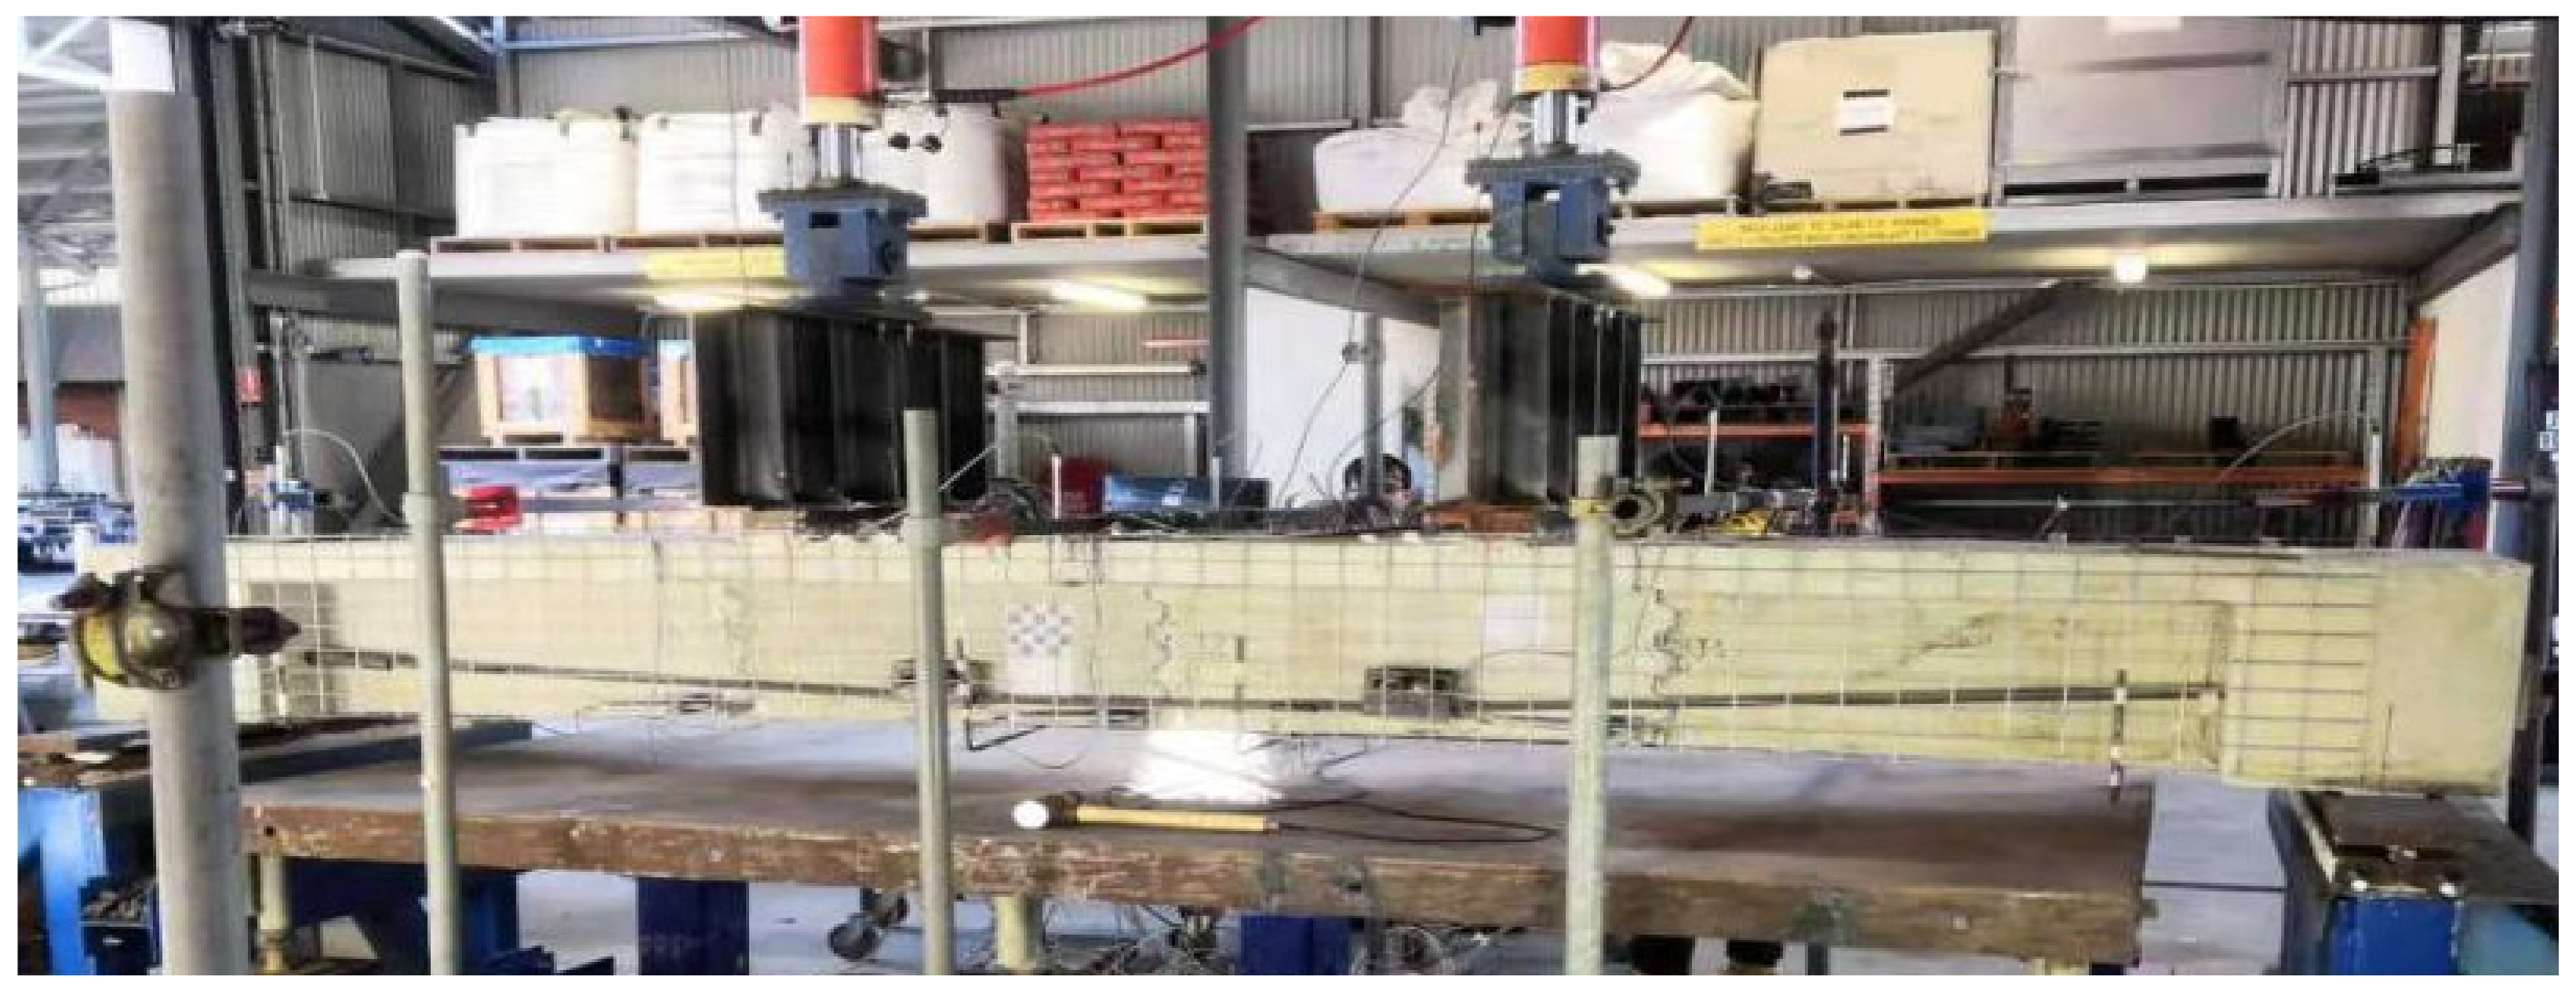
3.2. Experimental Testing

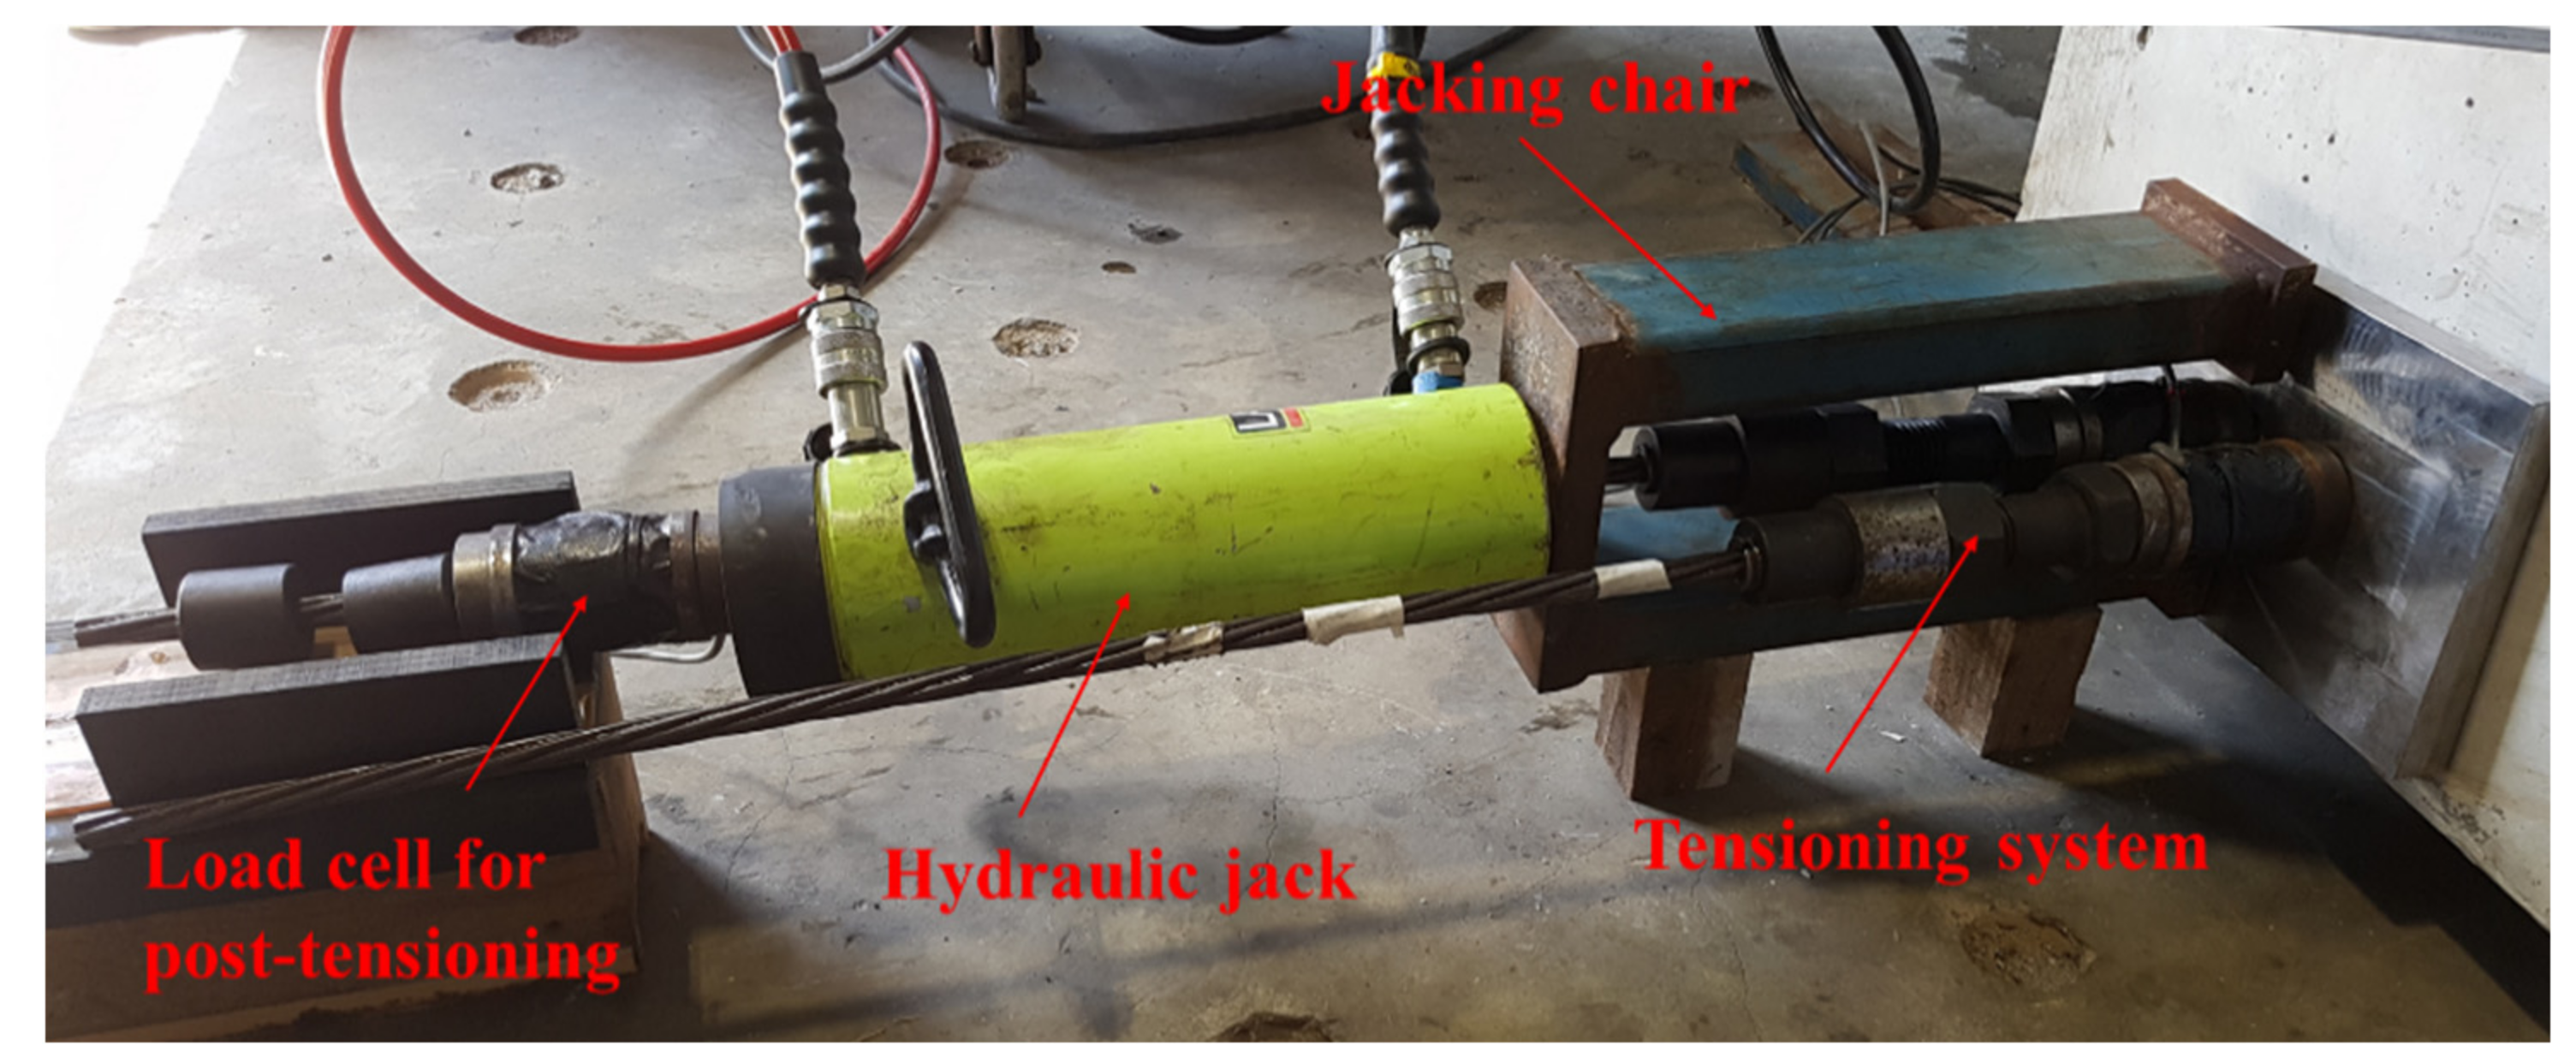
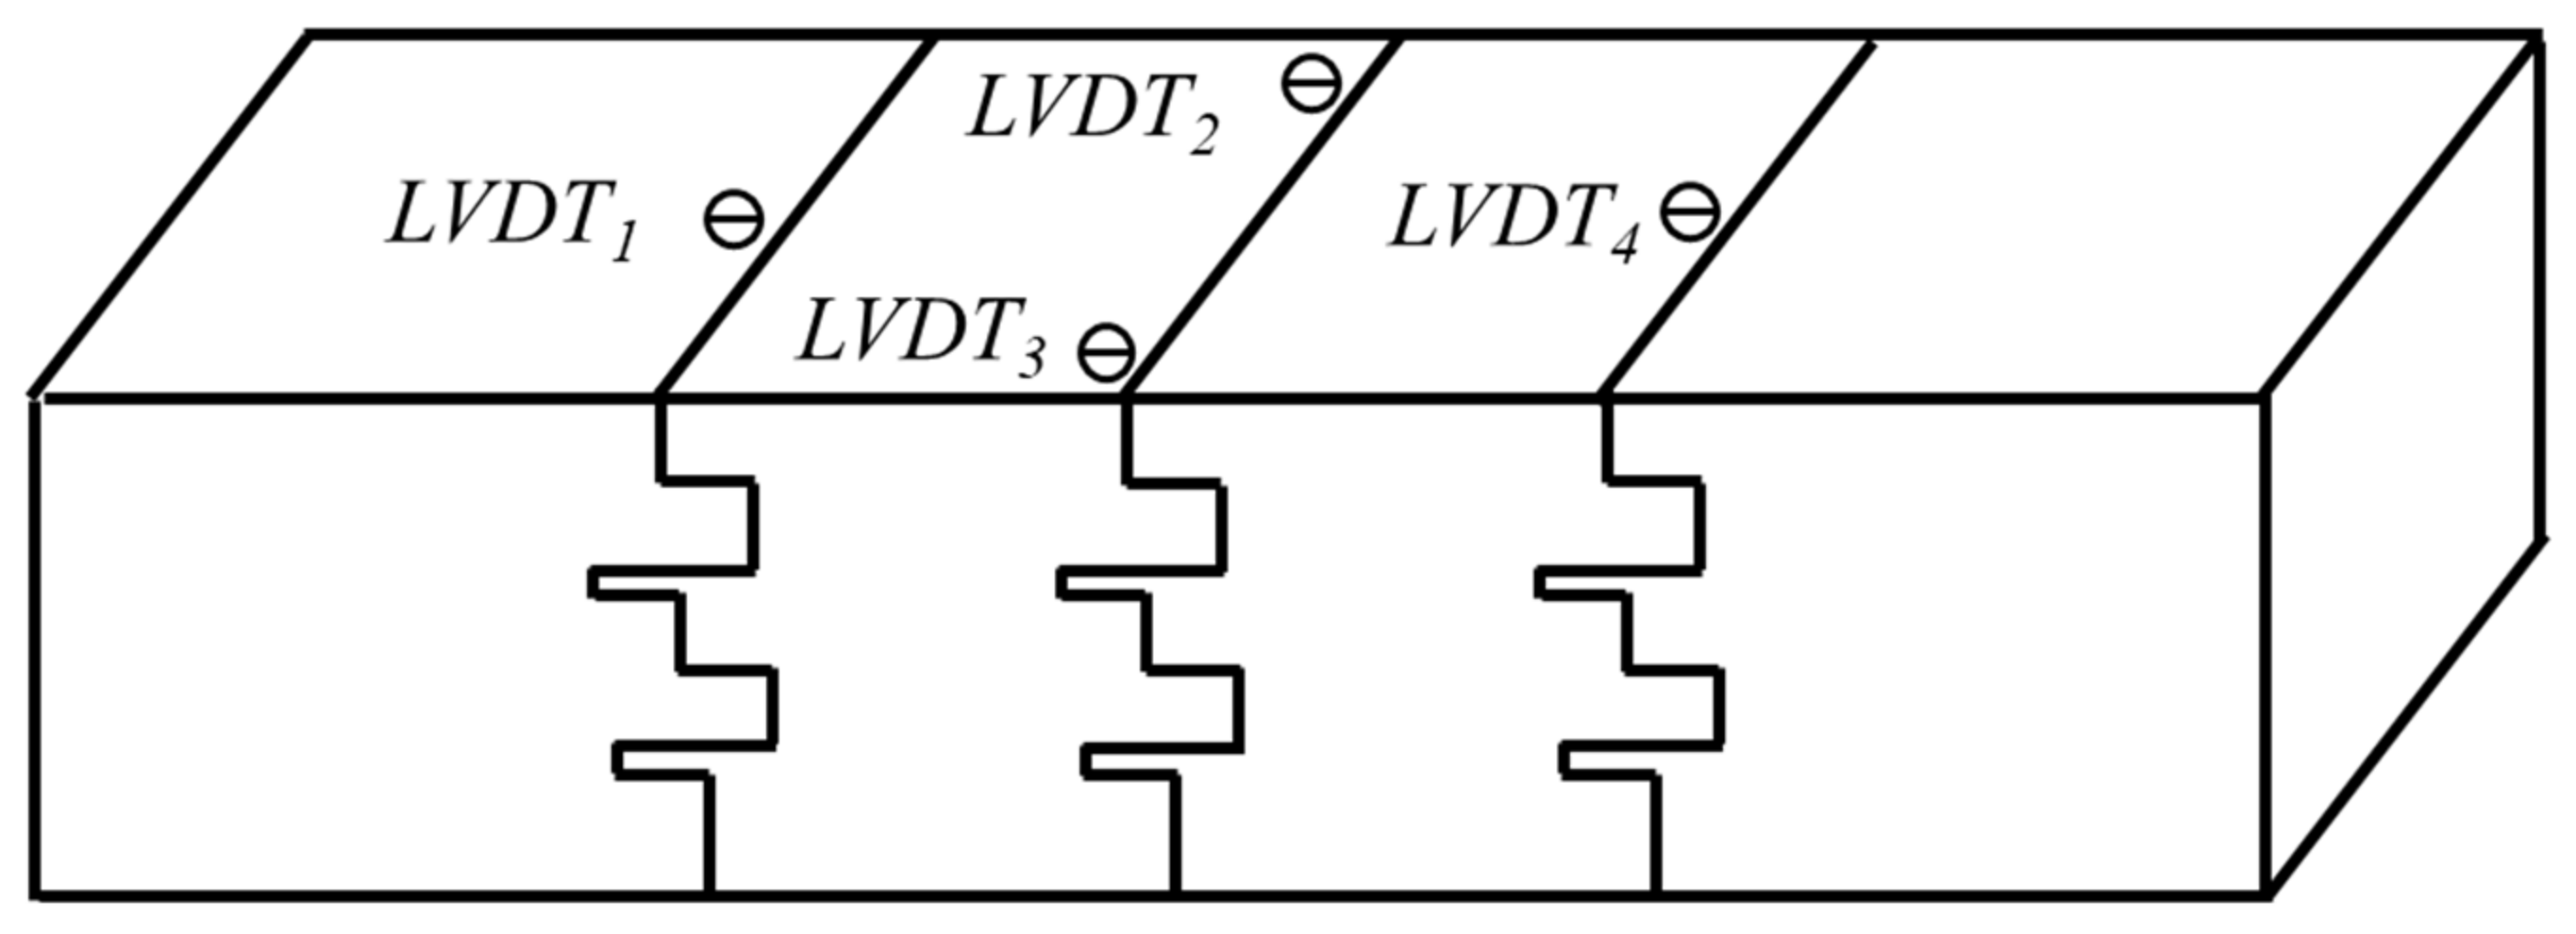
3.2.1. Post-Tensioning and Installed Strain Gauges

A typical experimental setup for applying the post-tensioning force is shown in Figure 5. A hydraulic jack of 30 tons was used to generate the tension force of the external steel tendons. The details of the post-tensioning procedure are described by Le et al. [22]. They are therefore only briefly described here. The post-tensioning procedure consisted of six steps. In the first and second steps, two steel tendons were subsequently pressurized to 10% of the yield stress force of the tendon, which aims to close the gap and eliminate the slack between the segments. Then, two tendons were alternately post-tensioned to 50% and 100% of the designed post-tensioning force. The designed effective prestress of the steel tendons was equal to 60% of the tendons’ nominal tensile strength, which is 110 kN. Then, two load cells were attached to the steel tendons to record the stress of the steel tendons during the post-tensioning process. Next, four Kyowa PL-60-11 strain gauges were attached to the web of the second and third segments of the beam in the experimental tests, as shown in Figure 6, to measure the strain responses during the post-tensioning process. These strain measurements are used to determine the neutral axis location and quantify the prestress force in the precast prestressed segmental beam in the study.
The segment of the beam is denoted by the symbol S, for example, S2 and S3 denote the second and third segments of the tested beam, respectively. Figure 6 shows that the top strain gauges attached to S2 and S3 are denoted as II_t and III_t, respectively. The strain gauges attached at the bottom location are denoted as II_b and III_b, respectively. II_t and II_b were attached near the mid-span of S2, while III_t and III_b were bonded near the joint between S2 and S3. The strain values measured during the post-tensioning process are used to quantify the prestressing force in the tendons, which are compared with the values measured by the load cells installed at the end of the tendons.

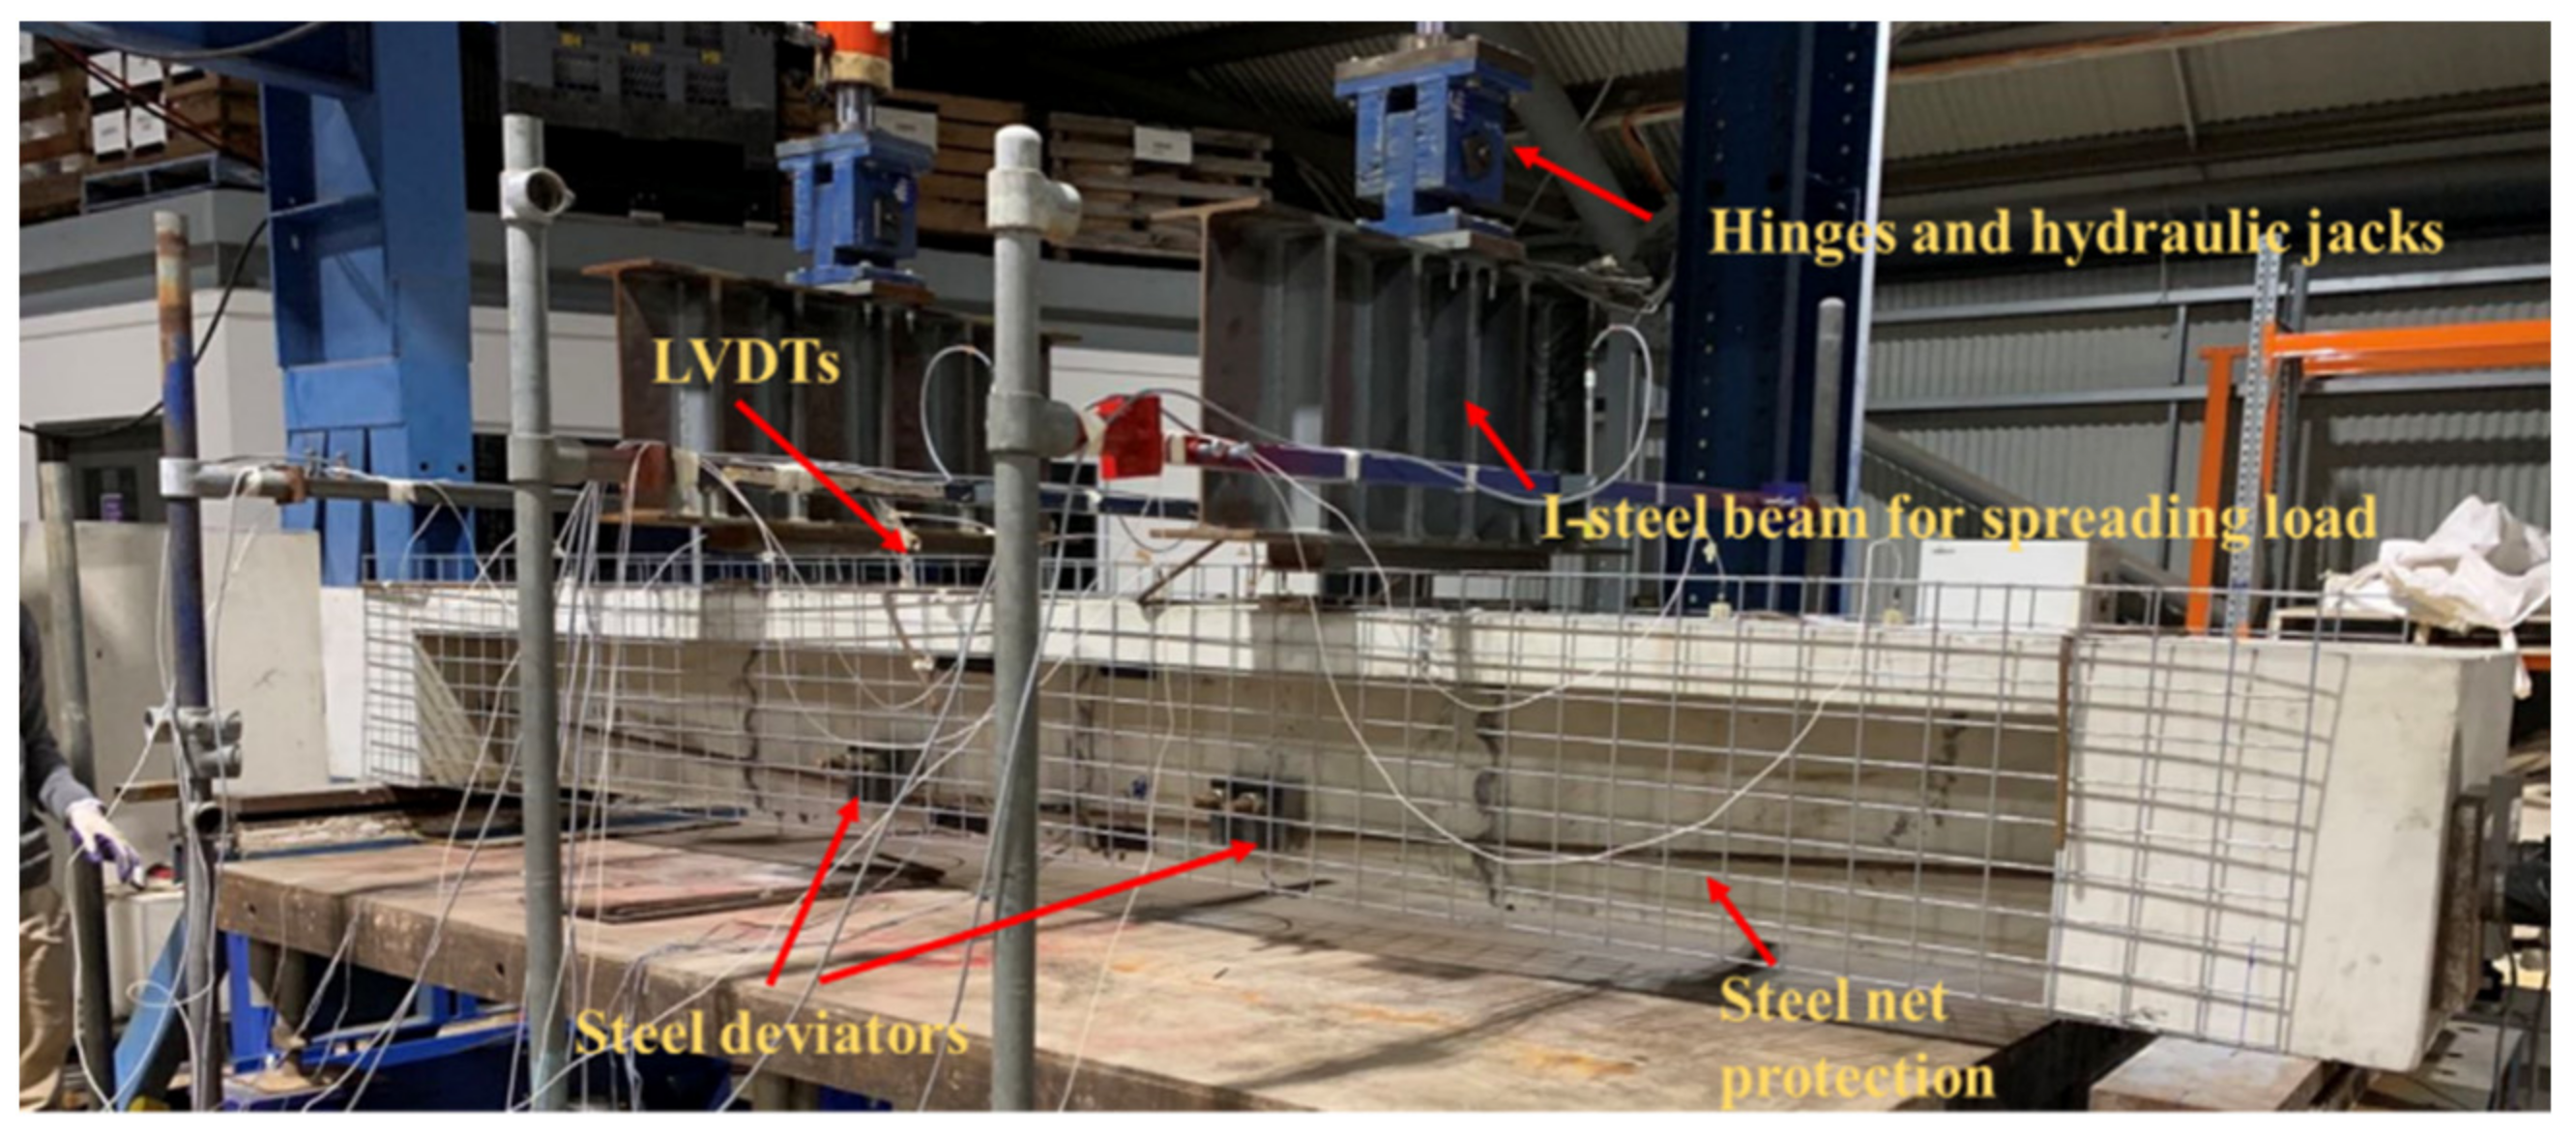
3.2.2. Loading Process

The static loading test was performed after the completion of the post-tensioning process. The vertical load was generated by hydraulic jacks, and it was transferred through two horizontal I-steel spreading beams to the segmental beam uniformly, as shown in Figure 7. The beam was tested for two cycles under the selected applied load of 20 kN. In the first cycle, the applied load was increased progressively to 20 kN and then decreased to approximately 5 kN before starting the second cycle. In the second cycle, the applied load was reduced to 0 kN. A load of 20 kN was selected here for analysis to ensure that no joint opening and damage occurred and that the beam deformed linearly under the applied load. A more detailed loading process is provided in Le et al. [22]. The applied load was monitored by load cells, and the deflection of the beam in the experimental tests was obtained using four linear variable differential transformers (LVDTs). The locations of these installed LVDTs are shown in Figure 8.
All LVDTs were placed at the joints between different segments of the beam as shown in Figure 8. LVDT2 and LVDT3 were located on the top surface of the beam between the second and third segments, whereas LVDT1 and LVDT4 were placed at the center of the top surface between the first and second segments, and the second and third segments, respectively.

3.3. Experimental Results during the Post-Tensioning Process

3.3.1. Experimental Validation of the Proposed Approach to Quantify Prestress Force

In the experiment, during the post-tensioning process, the neutral axis location calculated from the recorded strain at II_t and II-b on segment S2 using Equations (1) and (2) is denoted as ENAL2. Similarly, ENAL3 denotes the neutral axis location calculated from the measured data at III_t and III-b on segment S3 of the beam. The prestress force recorded by the load cell in the experiment is denoted as ‘EF’. The theoretical prestress forces of the tendon (i.e., TF2 and TF3) were calculated based on ENAL2 and ENAL3 by using Equation (5). The obtained neutral axis locations, the experimentally measured prestress force of the beam, the calculated prestress force from strain measurements and neutral axis location, and the relative errors of the calculated prestress force against the measured ones in the test are presented in Table 2.
Table 2 indicates that the theoretically predicted and experimentally measured prestress forces have differences of 4.22% and 15.20% when using strain measurements obtained from segments S2 and S3, respectively, when the prestress force is approximately 62 kN. At a higher prestressing level, i.e., 107 kN, the errors between the theoretical and experimental results based on the measured strains on S2 and S3 are slightly reduced to about 1.48% and 11.77%, respectively. These errors could be induced by a number of reasons. The error analysis of the theoretical calculation results is discussed in the following section.

3.3.2. Discussions

Overall, two sources are considered responsible for inducing such errors, including the variation in the modulus of elasticity of concrete, and the strain gauge measurement error.
First, the error may have originated from the variation in the concrete modulus of elasticity EC. The elastic modulus of concrete is a critical parameter, since it determines the strain and displacement relationship in the section analysis, especially when the concrete is in the elastic region. The elastic modulus value can be calculated based on the compressive strength of the concrete using the empirical formulas provided in the different design standards and codes. However, these existing empirical equations predict the elastic modulus of concrete with an inevitable error [25]. In this paper, the concrete properties were obtained based on the experimental tests of six cylinders with a diameter of 100 mm and a height of 200 mm, in compliance with the Australian Standards 1012.8.1 (AS 2014a) [26] and AS 1012.9 (AS 2014b) [27]. The compressive strength of the concrete obtained on the day of the test was 41.5 MPa, which was taken as the average of six concrete cylinders [22]. The elastic modulus of concrete is 3.047 × 10¹⁰ Pa, which is calculated based on AS 3600: 2018 [28] from the compressive strength of the concrete. However, it should be pointed out that it is clearly stated that the elastic modulus of concrete has a range of ± 20 % from the mean value [28]. Therefore, the error analysis was conducted to analyze the influence of the variation in the elastic modulus of the concrete on the prediction results of the prestress force. Based on the range of the elastic modulus of concrete, the prestress force of the beam obtained from the proposed approach is recalculated based on Equation (5), and the relative errors of the prestress force between the theoretical calculation and experimental results are computed and listed in Table 3.
Table 3 shows the relative errors in the predicted prestress force corresponding to the different errors in elastic modulus of the concrete in the variation range given in the Australian Standard (AS) 3600:2018 [28]. The subscripts numbers of error indicator RE (i.e., 2 and 3) represent the segments S2 and S3, and the numbers (i.e., 62 and 107 kN) stand for the two prestressing force levels. Assuming the estimated elastic modulus based on the obtained average concrete strength in the test is accurate, a variation of the elastic modulus leads to significant variations in the estimated prestress force. A 10% variation in the value of the elastic modulus of concrete can result in an error of more than 10%, based on measured strains on S2, and more than 20%, based strains on S3. This means that the used value of the elastic modulus of concrete can result in a significant variation in the predicted prestress forces, and using strains measured on S2 always yields better results than those on S3. This is because strains on S3 were placed closer to the segment joints, where the deformation over the cross-section is not linear. More discussions on this are presented in Section 5.4. These results demonstrate the influence of the elastic modulus of the concrete on the prestress force estimations, and ideally the elastic modulus of concrete should be directly measured from the tested structure. Otherwise, the range of the identified prestress force can be determined by considering the possible variations in the concrete elastic modulus.
The second factor that could lead to an error between the theoretically predicted result and experimentally measured prestress force is related to the measurement error in the strain gauge values. Since any data acquisition system has a certain level of inaccuracy and is affected by measurement noise, the errors in the strain gauges can potentially affect the theoretical calculation results. Therefore, an error analysis of the effect of the strain gauge measurement accuracy on the prestress force identification is conducted, and the error of the strain measurement values is assumed to be at three different levels, namely, 2%, 5%, and 8%. The four strain gauges as shown in Figure 6 are considered to have these three different error levels, respectively. Random numbers from the standard normal distribution with a mean value of 0 and different standard deviation values (i.e., with different error levels) are added onto the experimental strain data. The relative errors in the calculated prestress force under different error levels in the measured strains are listed in Table 4.
Table 4 indicates that increasing the strain measurement errors from 2% to 8% does not significantly change the estimated prestress force, with the errors remain at the similar level. This is because the errors in measured strains affect the positive and negative forces from both the concrete and reinforcements over the cross-section, which cancel out the error influences on the prestress force. Although both the strain and elastic modulus are linearly proportional to the force, i.e., Eε, an error in the concrete elastic modulus has more significant effect on the estimated prestress force since it only affects the concrete force over the cross-section. These results indicate that the reliability of the equipment and measurement noise in strain data would also influence the theoretical calculation results, but are less significant as compared to that owing to the error in concrete elastic modulus.
The experimental verification of using the proposed approach for quantifying the prestress force based on the neutral axis location shows that the predicted results have certain differences, when compared with the experimental measured result. This may be attributed to the uncertainty of the estimated elastic modulus or strain gauge measurements. However, the proposed approach can identify the prestress force variation. Therefore, the method can be used to identify the change in prestress force, and also approximately quantify the prestress level with an error range depending on the accuracy of the used concrete elastic modulus and measured strains. The above results also show that using the strains measured close to the segment joint leads to larger errors than using the strains measured in the mid of the segment. Discussions and explanations of this observation will be given in the subsequent section.

4. Numerical Verifications

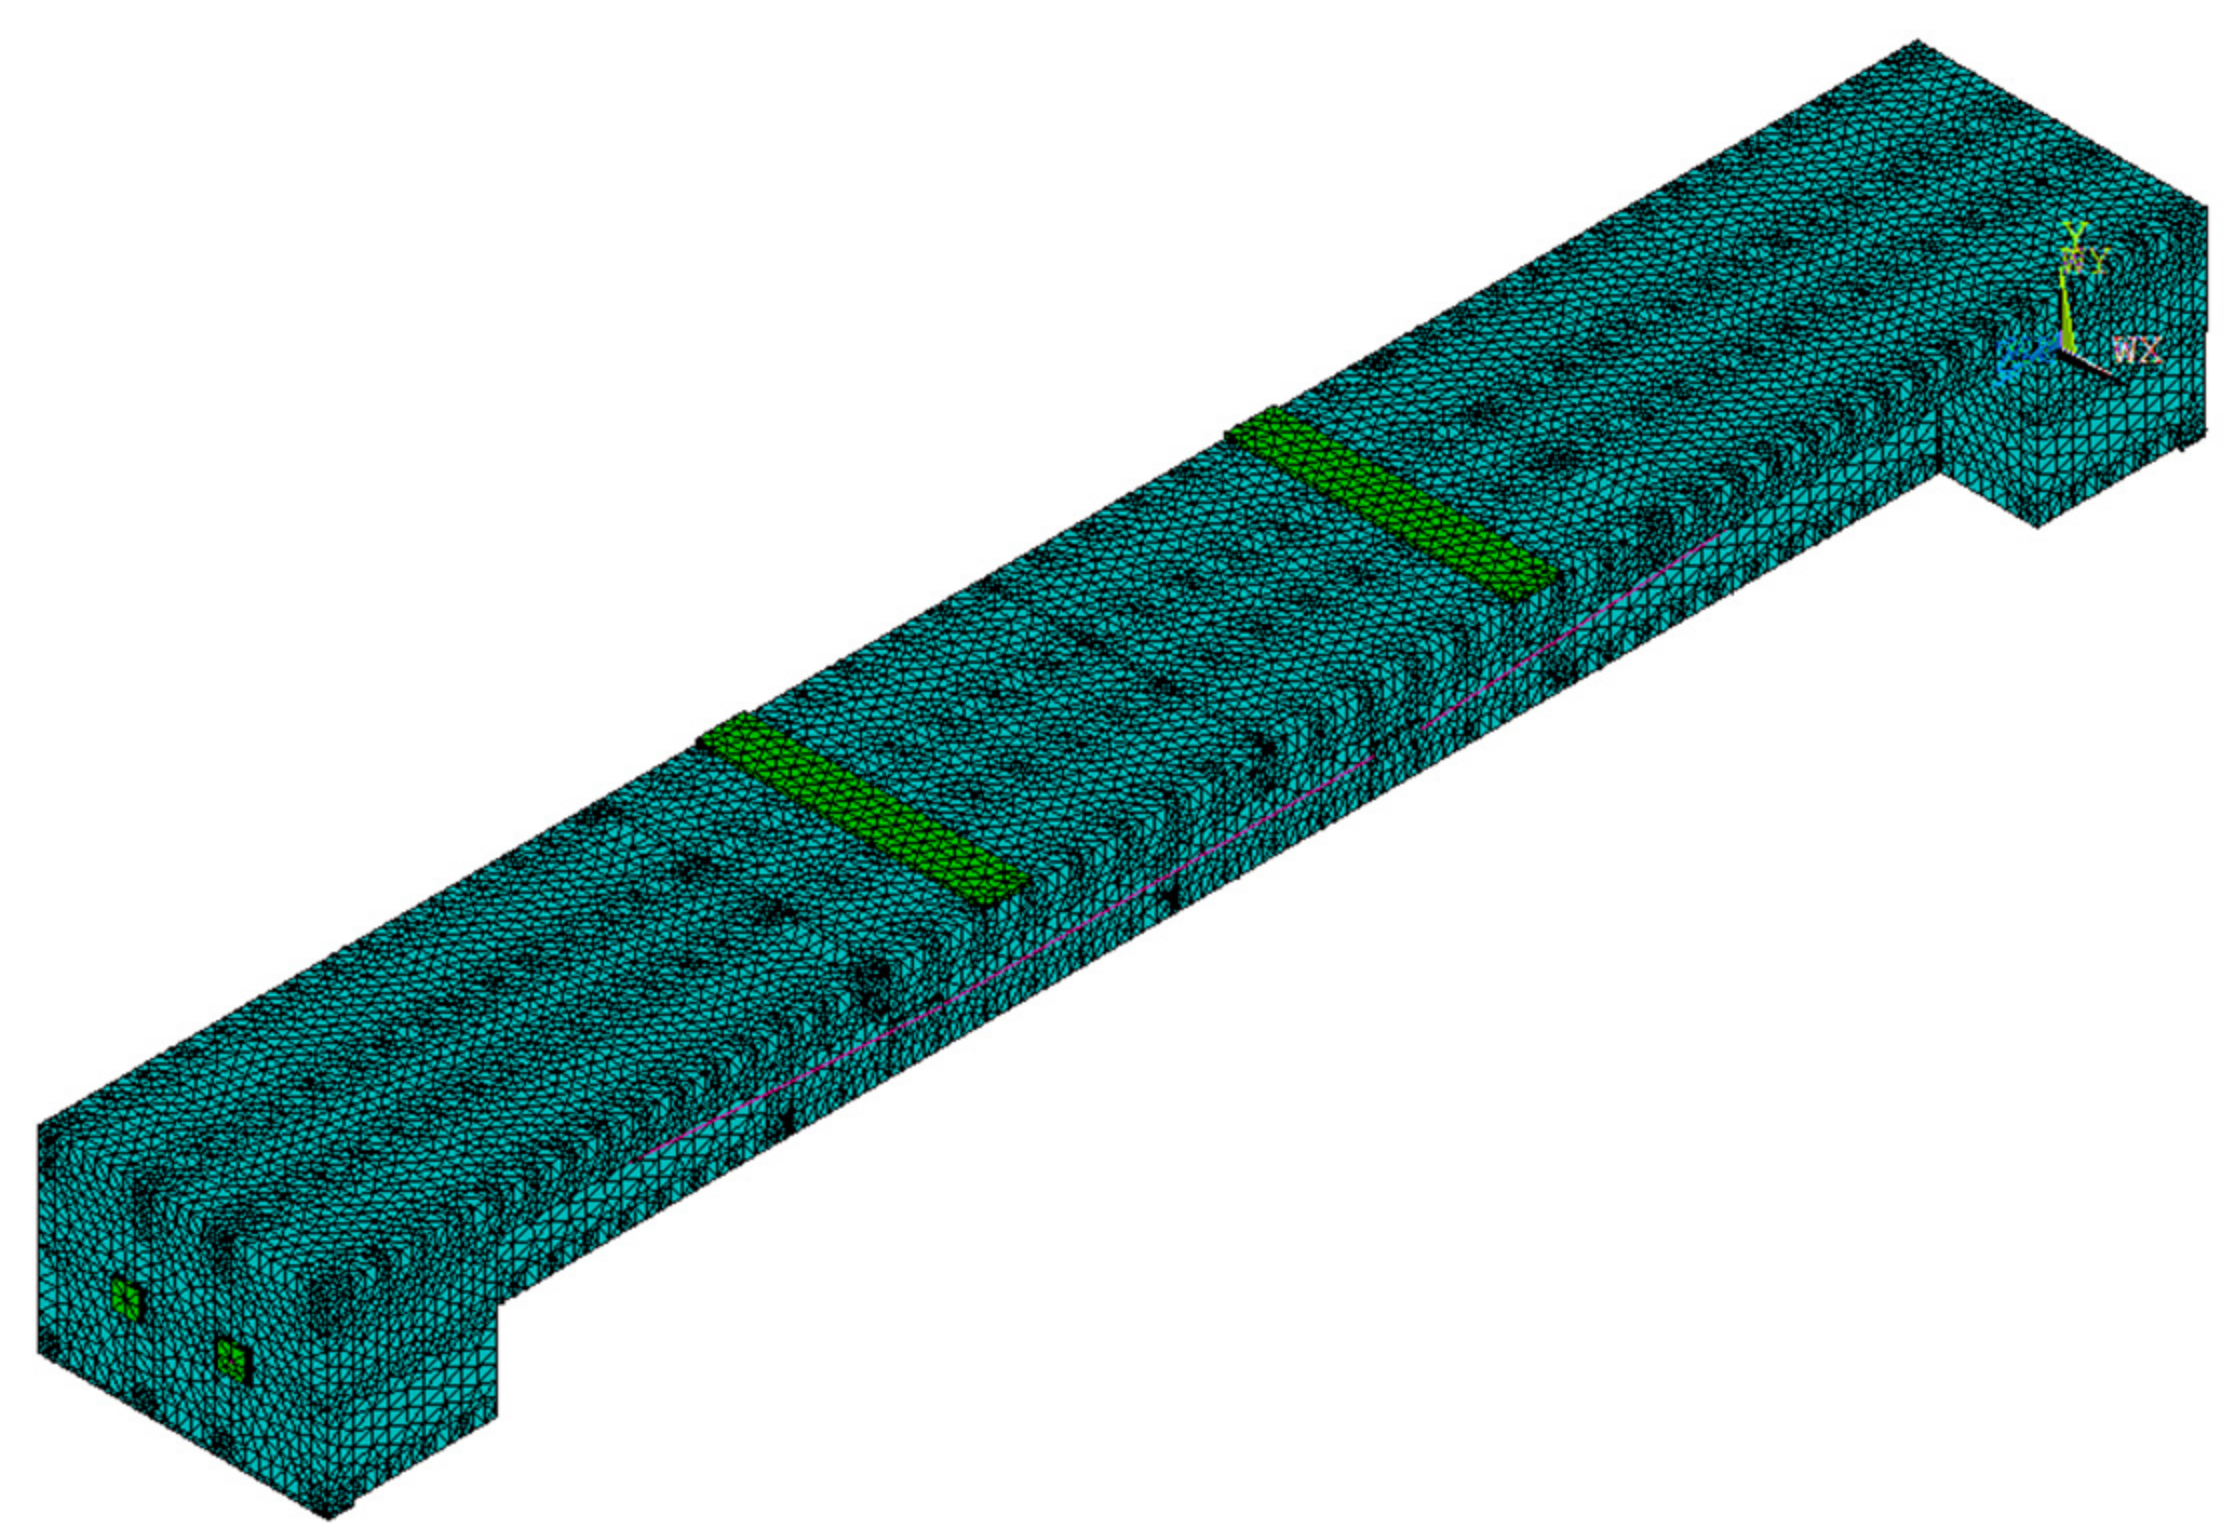
4.1. Numerical Finite Element Model of this Precast Segmental Beam

A 3D precast segmental beam model of the tested structure was built by using commercial finite element package ANSYS to numerically investigate the accuracy of the proposed theoretical method using the neutral axis location of the segmental beam for obtaining the prestress force in externally prestressed tendons. The developed finite-element model is illustrated in Figure 9. Geometric and material properties of this numerical model are the same as those in the experimental studies, as described in Section 3. In this numerical simulation, the concrete segments are simulated using SOLID92 elements, which consider stress stiffening and large deflection geometrical nonlinearity. This element is defined by ten nodes with three degrees of freedom at each node, that is, translational displacements in the nodal x, y and z directions. SOLID45 elements are used to simulate two 20-mm-thick steel plates with external loading added to the top surface of the beam. This is because the SOLID45 element can be used to obtain a more uniform stress distribution over the pressurized area. The locations of the steel plates placed on the segmental beam, which remain at the same location as that in the experimental tests, are denoted as the green area in Figure 9. They are placed equally at one-third and two-thirds of the beam. LINK8 elements are employed to simulate steel reinforcements, including steel bars and stirrups inside the concrete, and the prestressed tendon. For the prestressed tendon, different initial strain values are applied to simulate the different prestressing levels based on the measured prestress value in the experiment. The dry joints between segments of the beam model are simulated using contact elements. TARGE170 and CONTA174 elements are adopted for target and contact elements, respectively. Node coupling is applied to the contact point between the concrete and external prestressed tendons at the anchorage location.

4.2. Model Validation

The neutral axis locations were calculated using the strain extracted from the FEM under the same conditions as the experimental test of the beam during the post-tensioning process, i.e., the beam is subjected to a prestress force of 62 kN and 107 kN, respectively. The locations of the extracted strain are the same as those of the strain gauges attached to S2 and S3 of the beam in the experimental test. The neutral axis locations obtained from the strains for the second and third segments of the numerical beam model are denoted by MNAL2 and MNAL3, respectively. Furthermore, the static responses, namely, vertical deflections under 15 kN and 20 kN loading levels, are also used for verifying the accuracy of the numerical model. The locations of the deflections extracted from the FEM are the same as those LVDTs installed in the experimental tests, as shown in Figure 8. Mid-span deflection is calculated as the average value of the displacement data measured from LVDT2 and LVDT3. The deflections obtained from the experimental test are represented as EL 1 , EL 23 , and EL 4 , and the deflections from the FEM are expressed as ML 1 , ML 23 , and ML 4 . The results of neutral axis locations and the deflections from the numerical model are compared with experimental results and presented in Table 5 and Table 6, respectively.
Table 5 indicates that the neutral axis locations from the experimental and numerical results of the segmental beams are close to each other for the cases of 62 kN and 107 kN prestress force. The relative errors are less than 3%, which implies that this model can basically represent the tested beam. The experimental deflection results of the segmented beam in general also agree with the numerical results, except at location L4, where a larger error of 11.81% is obtained. These errors might be introduced by the uncertainties in the FEM, such as the assumptions of the boundary conditions and material properties of the initial model. The differences in the neutral axis locations and the deflections between the experimental and numerical results show that it is necessary to refine the original FEM to ensure that the built numerical model can be used to represent the structural behavior more accurately. Therefore, in this study, the neutral axis locations and structural deflections under static loading tests are adopted to conduct the finite element model updating analysis. In particular, the neutral axis locations with 107 kN prestress force during the post-tension process and the deflections at four locations on the top of the beam under two specific static loading levels of 15 kN and 20 kN, are used.

5. Model Updating for the Segmental Beam

5.1. Parametric Sensitivity Analysis

Parametric sensitivity analysis for selecting the parameters to be updated is conducted to determine which model parameters significantly affect the neutral axis locations and static displacement responses, before updating the original segmental beam model. The geometric parameters of the prestress tendons are measured, and therefore not considered in the model updating analysis. For the segmental beam model, the model parameters, including three material parameters and two joint parameters, are selected as the parameters to be updated. The geometric parameters of the prestress tendons are measured and therefore not considered in the model updating analysis.
The selected material parameters comprise the elastic modulus of concrete E c , density of concrete ρ c , elastic modulus of the prestress tendon E s , normal contact stiffness factor NSct, and tangent contact stiffness factor TSct. NSct and TSct are the scale parameters of contact stiffness. In ANSYS, for the normal contact stiffness, there are two possible approaches to determine their values, which include defining a stiffness factor NSct that acts as a scale factor of the contact stiffness Kn, or specifying the magnitude of the contact stiffness Kn directly. It is not evident if the determined stiffness value from these approaches is correct or reasonable for each contact problem since the value of the contact stiffness Kn is determined by certain parameters, such as Young’s modulus, contact area, and scale factor NSct. Thus, scale factors are used to define the stiffness of the contact elements. For the normal contact stiffness, the normal stiffness factor NSct has a range of 0.01–1.0. The default value in ANSYS is 1.0, and a higher stiffness value leads to a lower amount of penetration or slip [29].
The method for selecting more influential parameters from these candidate parameters is based on the sensitivity analysis, where the corresponding change in the structural displacement responses and neutral axis locations is calculated when there is a 10% change in these parameters. The sensitivity analysis results are given in Table 7. When the sensitivity of displacement responses is greater than 2%, and the sensitivity of neutral axis position calculated from S2 and S3 is larger than 0.03%, the corresponding structural parameters are considered as candidate parameters for model updating.
Based on the aforementioned criteria, it can be observed from Table 7 that the elastic modulus of the concrete and prestress tendons have significant influences on the displacement response and the neutral axis location. The density of concrete affects the displacement responses more significantly than that of the neutral axis location. Both the normal and tangent contact stiffness factors show a relatively smaller influence on the displacement and neutral axis location than the other structural parameters. Accordingly, these three parameters, E c , ρ c , and E s , are selected as the critical parameters to be updated for the segmental beam model.

5.2. Model Updating Based on the Measured Static Data

The objective of the model updating is to minimize the objective function H θ formulated as the difference in the deflections and neutral axis locations between the experimentally measured and numerical results when the prestress level of the beam is 107 kN for obtaining the optimal value of the candidate parameters. In this paper, the RS method [30] is employed for updating the selected parameters. The second-order polynomial function with interaction effects is used to build the relationship between the physical system parameters (i.e., E c ,   ρ c ,   E s ) and output response in terms of vertical deflection and neutral-axis location.
H θ =   H L α 15 θ + H L α 20 θ + H S 2 θ + H S 3 θ
where
H L α 15 θ = i = 1 n RSM L α 15 θ EL α _ 15   EL α _ 15   2  
H L α 20 θ = i = 1 n RSM L α 20 θ EL α _ 20   EL α _ 20   2  
H S 2 θ = i = 1 n RSM S 2 θ ENAL 2 ENAL 2 2
H S 3 θ = i = 1 n RSM S 3 θ ENAL 3 ENAL 3 2
in which the vector of parameters to be updated is defined as θ = E c ,   ρ c ,   E s , EL α _ 15 and EL α _ 20   represent the measured static displacements of the segmental beam at location α corresponding to the four LVDTs during the static loading tests of 15 kN and 20 kN, respectively, and RSM L α 15 θ and RSM L α 20 θ are the respective predicted static displacements at location α from the numerical analysis. The term RSM S 2 θ denotes the predicted neutral axis locations of the second segment during the post-tensioning process, and RSM S 3 θ denotes the predicted neutral axis locations of the third segment of the tested beam. The estimated RS function can thus be expressed as:
RSM θ =   β 0 + i n β i θ i + i n β ii θ i 2 + i < j j = 2 n β ij θ i θ j
where βi denotes the partial regression coefficient, θ i represents the model parameters, and θ i θ j denotes the interaction effect between these parameters.
When the RS model is determined with numerical analysis, the objective function H θ described in Equation (6) can be built based on the measured data. Then, the simulated annealing global optimization algorithm is used to minimize the objective function H θ , and obtain the optimal parameters of the segmental beam model. To validate the accuracy of the updated finite element model, the relative error is used to evaluate the difference in structural responses between the updated model and measured data in the experiment.
After the model updating of the segmental beam model, the calibrated model parameters are presented in Table 8. The corresponding predicted structural responses of the updated segmental beam model are listed in Table 9. Table 9 indicates that the updated segmental beam model can accurately predict the structural displacement responses and neutral axis locations with a maximum error less than 5%. This means that the calibrated segmental beam model can reliably be used to predict the structural deflections.
From Table 9, the accuracy of the updated model exhibits an appreciable improvement when comparing with the initial model. The relative errors in neutral axis locations and static deflection responses are significantly reduced. After model updating, the relative errors of neutral-axis locations are less than 1%. For the deflections under two different loading levels, although the results are not as good as that of the neutral axis locations, the relative errors are within an acceptable range, which is less than 5%. This means that an accurate FEM is obtained to represent the tested precast segmental beam under the static loads. To further validate the accuracy of the updated segmental beam model, a case with a prestress force of 62 kN is applied to the model, and a comparison between the numerical model analysis and experimental results of the neutral axis locations is summarized in Table 10.
Table 10 indicates that the relative errors in the neural axis locations of the updated model are 0.99% and 1.34%, compared with the experimental results. Both the relative errors in the neutral axis locations of the updated model at S2 and S3 are below 2%, indicating that the same conclusion as summarized before, that is, the updated model can provide a good representation of the tested beam under different levels of prestressing forces.

5.3. Numerical Simulations of Prestress Force Identifications by the Proposed Approach

To further verify the reliability of the proposed method for identifying the prestress force of the segmental beam, a total of five loading cases are considered from 62 kN to 107 kN. For each case with a different prestress force, the strains at those predefined four locations as shown in Figure 6 are obtained from the updated finite element model, and the corresponding neutral axis locations are calculated based on Equations (1) and (2). The comparison between the prestress force applied to the numerical model and the predicted prestress force by the proposed approach are summarized in Table 11.
It can be seen from Table 11 that, under these five prestress force levels, the predicted prestress force results obtained from S2 are closer to the applied prestress force to the model, with relative error values less than 3.31%. However, the results calculated from strains on S3 give relatively larger errors. The same observation is also obtained from experimental verifications presented in Section 4. It should be noted that the location of the strain gauges attached to the second segment is close to the middle of the segment, whereas the location of the strain gauges on the third segment is close to the joint. This means that the proposed method can provide more accurate estimations of prestress force when the strains are measured at locations away from the joint. Strain is a local parameter that only measures the influence in the vicinity of the sensor [21].
The strains measured near the segment joint are affected by the joint and affect the accuracy of prestress force identification of the proposed method in this study. The following investigates the influence of strain measurement locations on the prestress force quantification by using the proposed method.

5.4. Discussions

From the above results, the prestress force calculated based on the strains measured at locations away from the segment joint is closer to the real values, while there is a relatively larger difference by using the strains near the joint of the beam. In this section, the stress distributions of the beam at the corresponding locations from segments S2 and S3 are extracted from the ANSYS model. Figure 10 shows the stress distributions when the prestress force is 107 kN. As shown in the stress contour, the stress over the cross-section in S3 close to the joint obviously does not distribute linearly. The assumption of plane-remains plane therefore is not satisfied at this section close to the joint, which results in the large errors in prestress estimation from neutral axis location. To further observe this, the stress values along the height of the cross-section in S2 and S3 are extracted and shown in Figure 11 and Figure 12, respectively.
As shown in Figure 10, the green and yellow areas represent the compressive stress of the beam induced by posttensioning force, while the tension area of the beam is in the red region. The greener the area, the greater is the compressive stress in the beam. The stress values are extracted at different locations along the height of the cross-section. Figure 11 shows the stress distribution at the section with strain gauges in the segment S2, the compressive zone is at the bottom of the beam, the tensile stress is observed at the top of the beam, and the stress is distributed almost linearly over the cross-section. These observations indicate that plane–remains–plane assumption is satisfied, therefore the above derived relation of neutral axis location and the prestress force amplitude is valid.
The stress distribution in the section in the segment S3 near the joint location is shown in Figure 12. Large compressive stresses closer to the bottom of the section are observed. This may be caused by the influence of squeezing two shear keys under the effect of the prestress tendon. Stress concentration is also observed at shear keys along this section. Therefore, the stress and hence the strain are not linearly distributed along the cross-section, indicating the plane–remains–plane assumption is not satisfied. As a result, the above relation between neutral axis location and the prestress force amplitude based on plane–remains–plane assumption leads to larger errors. From the above discussions, the strains should be measured at locations away from the joints in segmental beam structure for estimating the prestress force. The above results also indicate that even the proposed method based on neutral axis location may not give a very accurate estimation of the prestress force if the fundamental Bernoulli beam plane–remains–-plane assumption is not satisfied, it is very sensitive to prestress force change, therefore the proposed method can still be used to identify the loss of prestress force, and also approximately estimate the prestress force amplitude. In practical applications, the strains should be measured at sections away from the segment joints, which leads to more accurate prestress force identification.

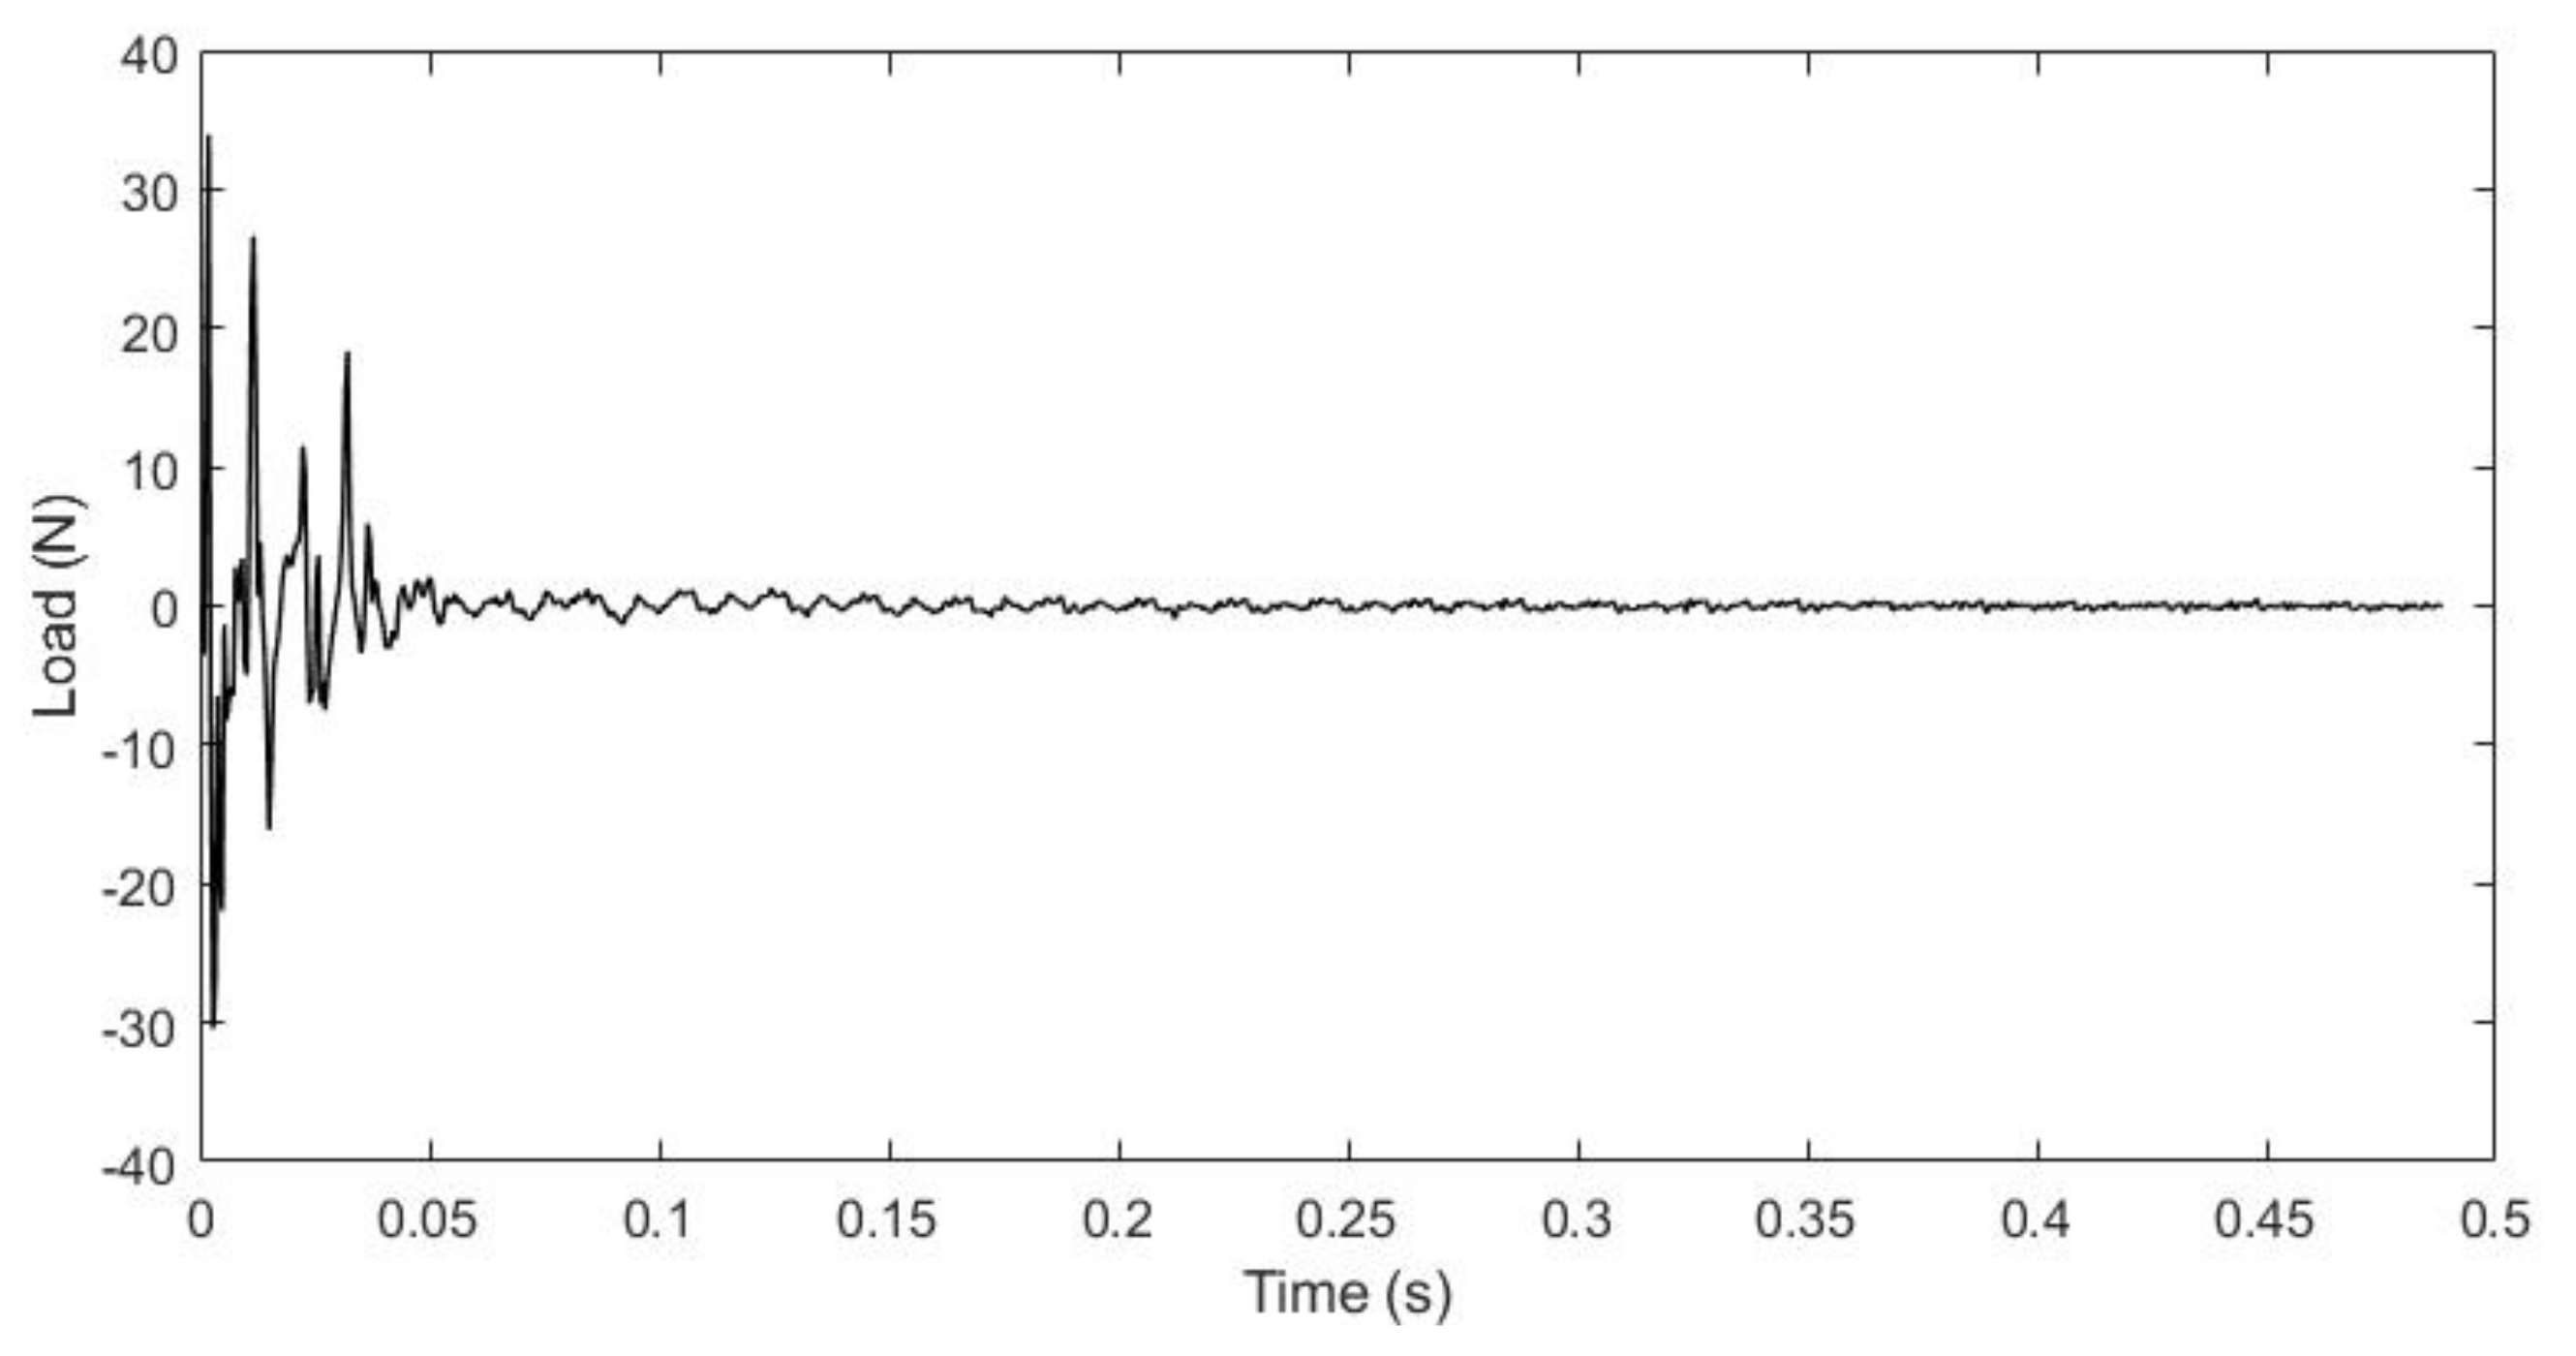
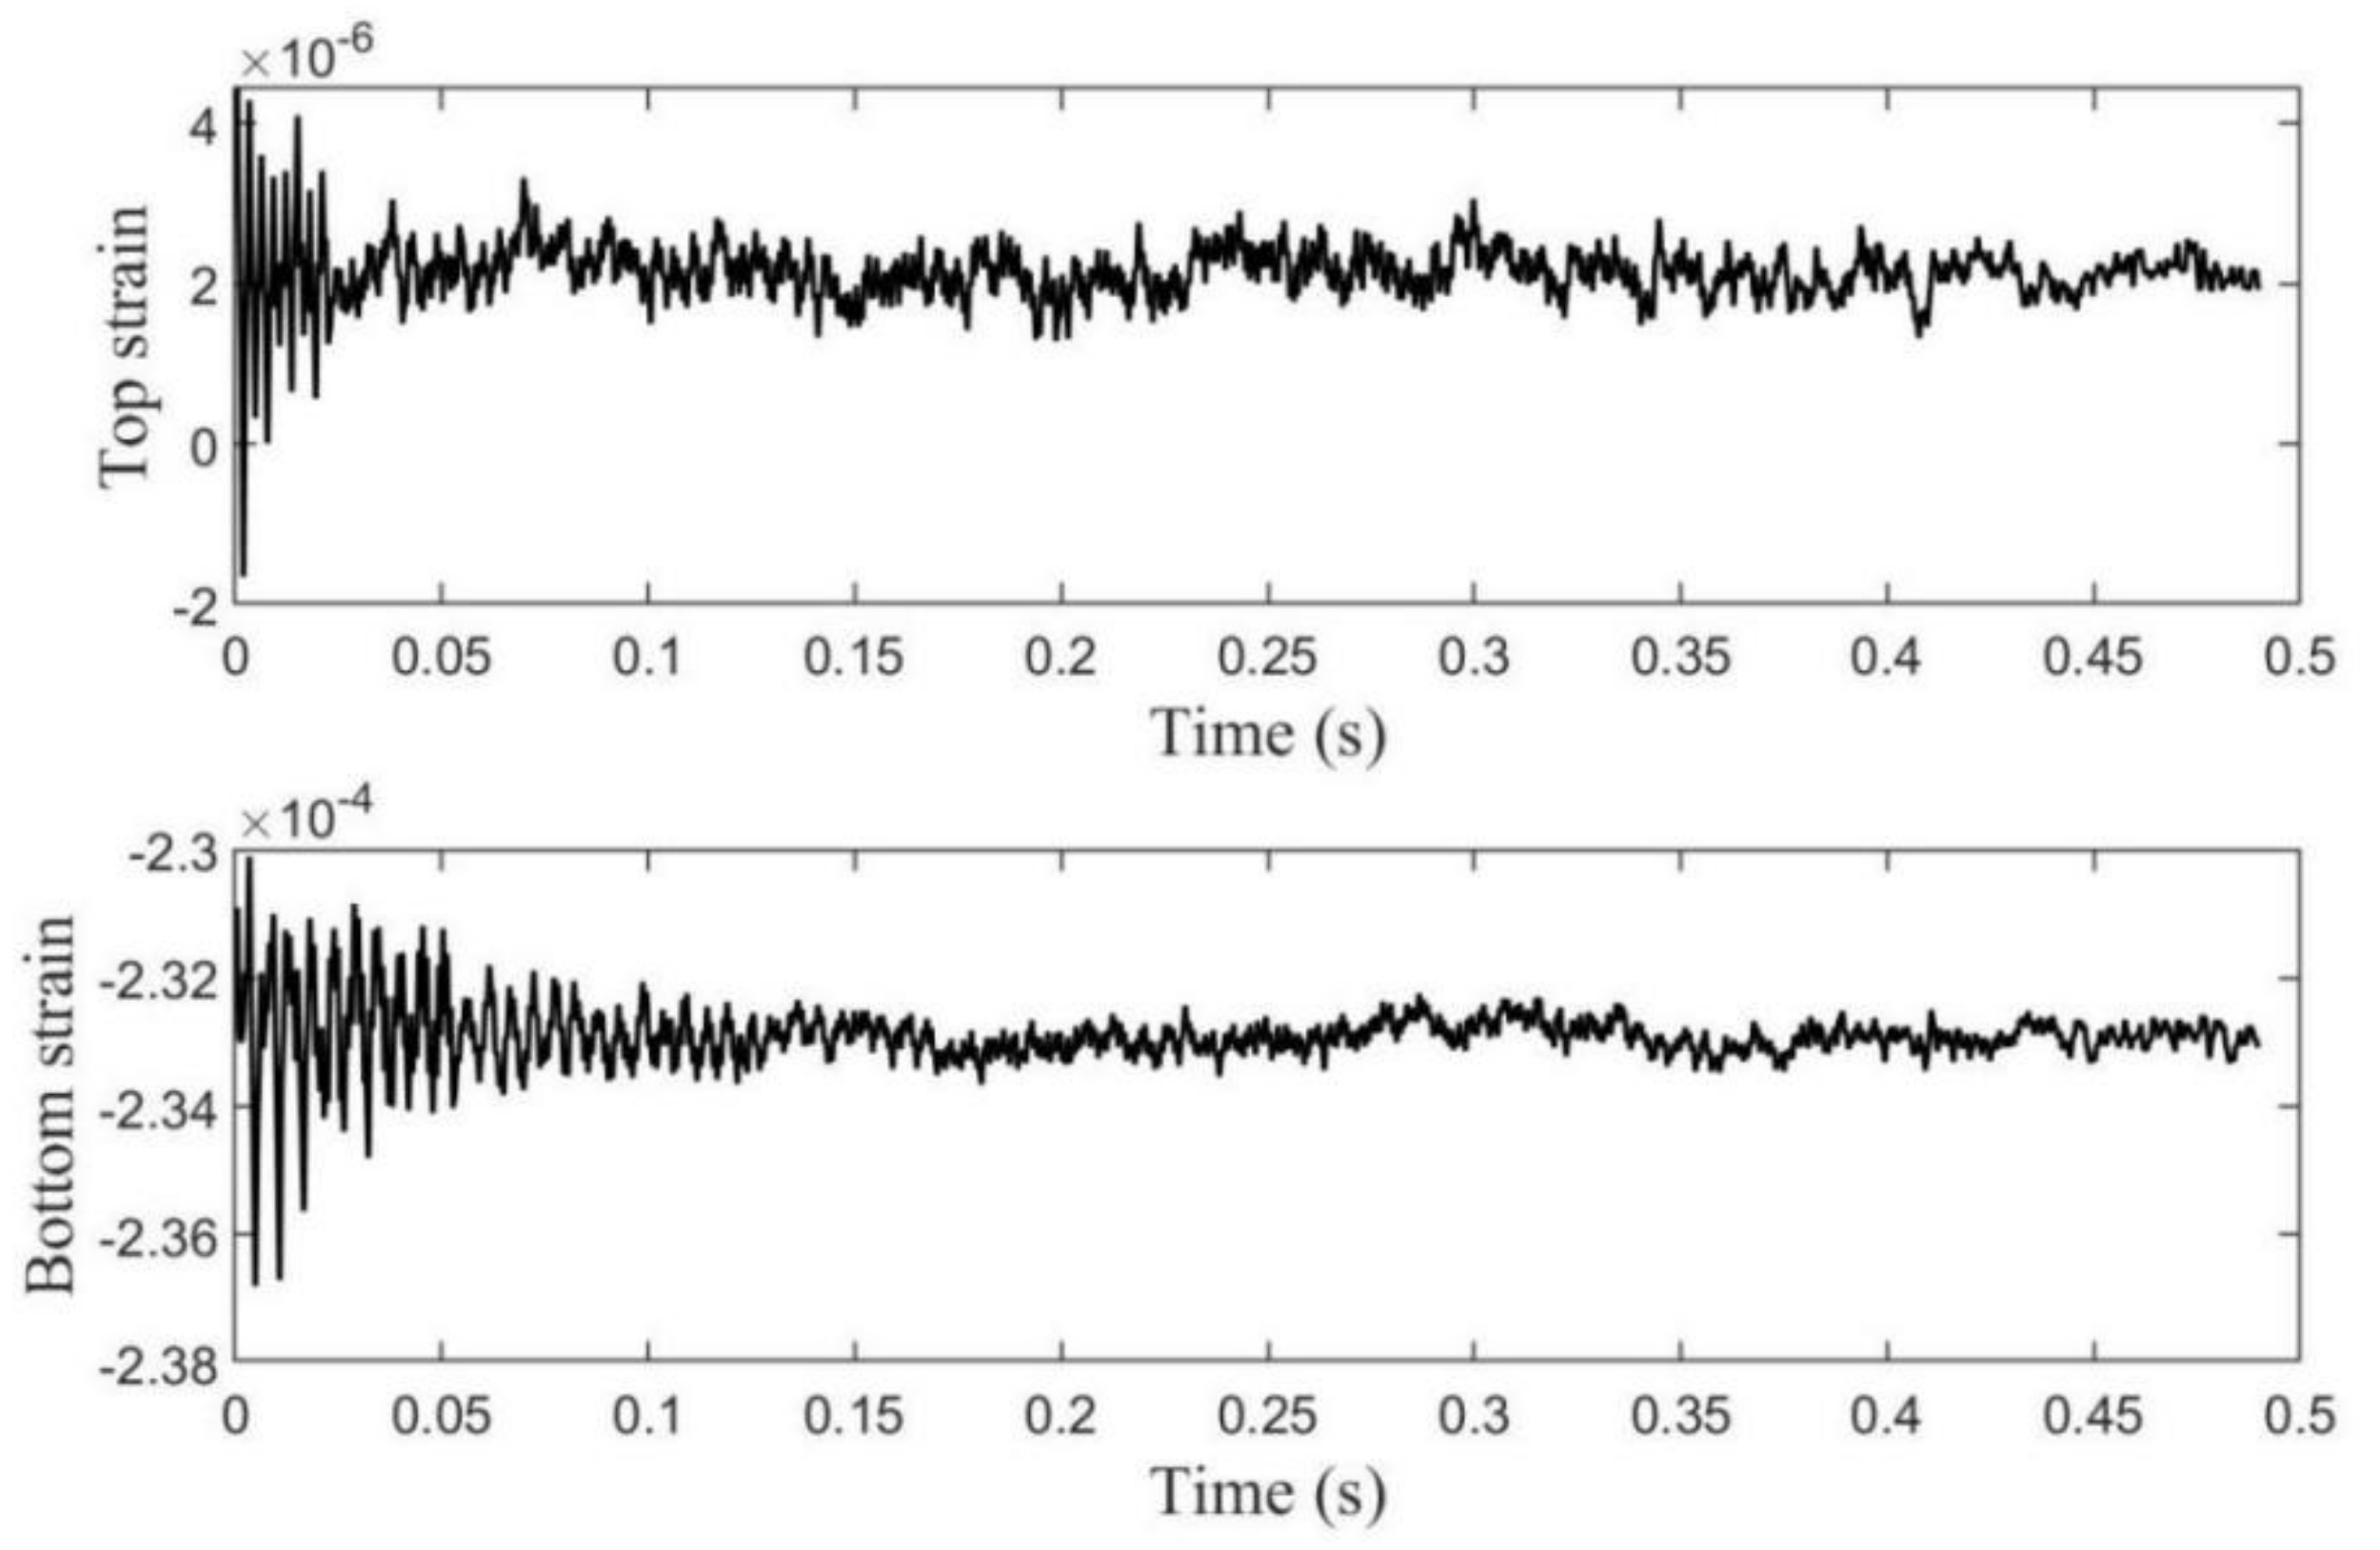
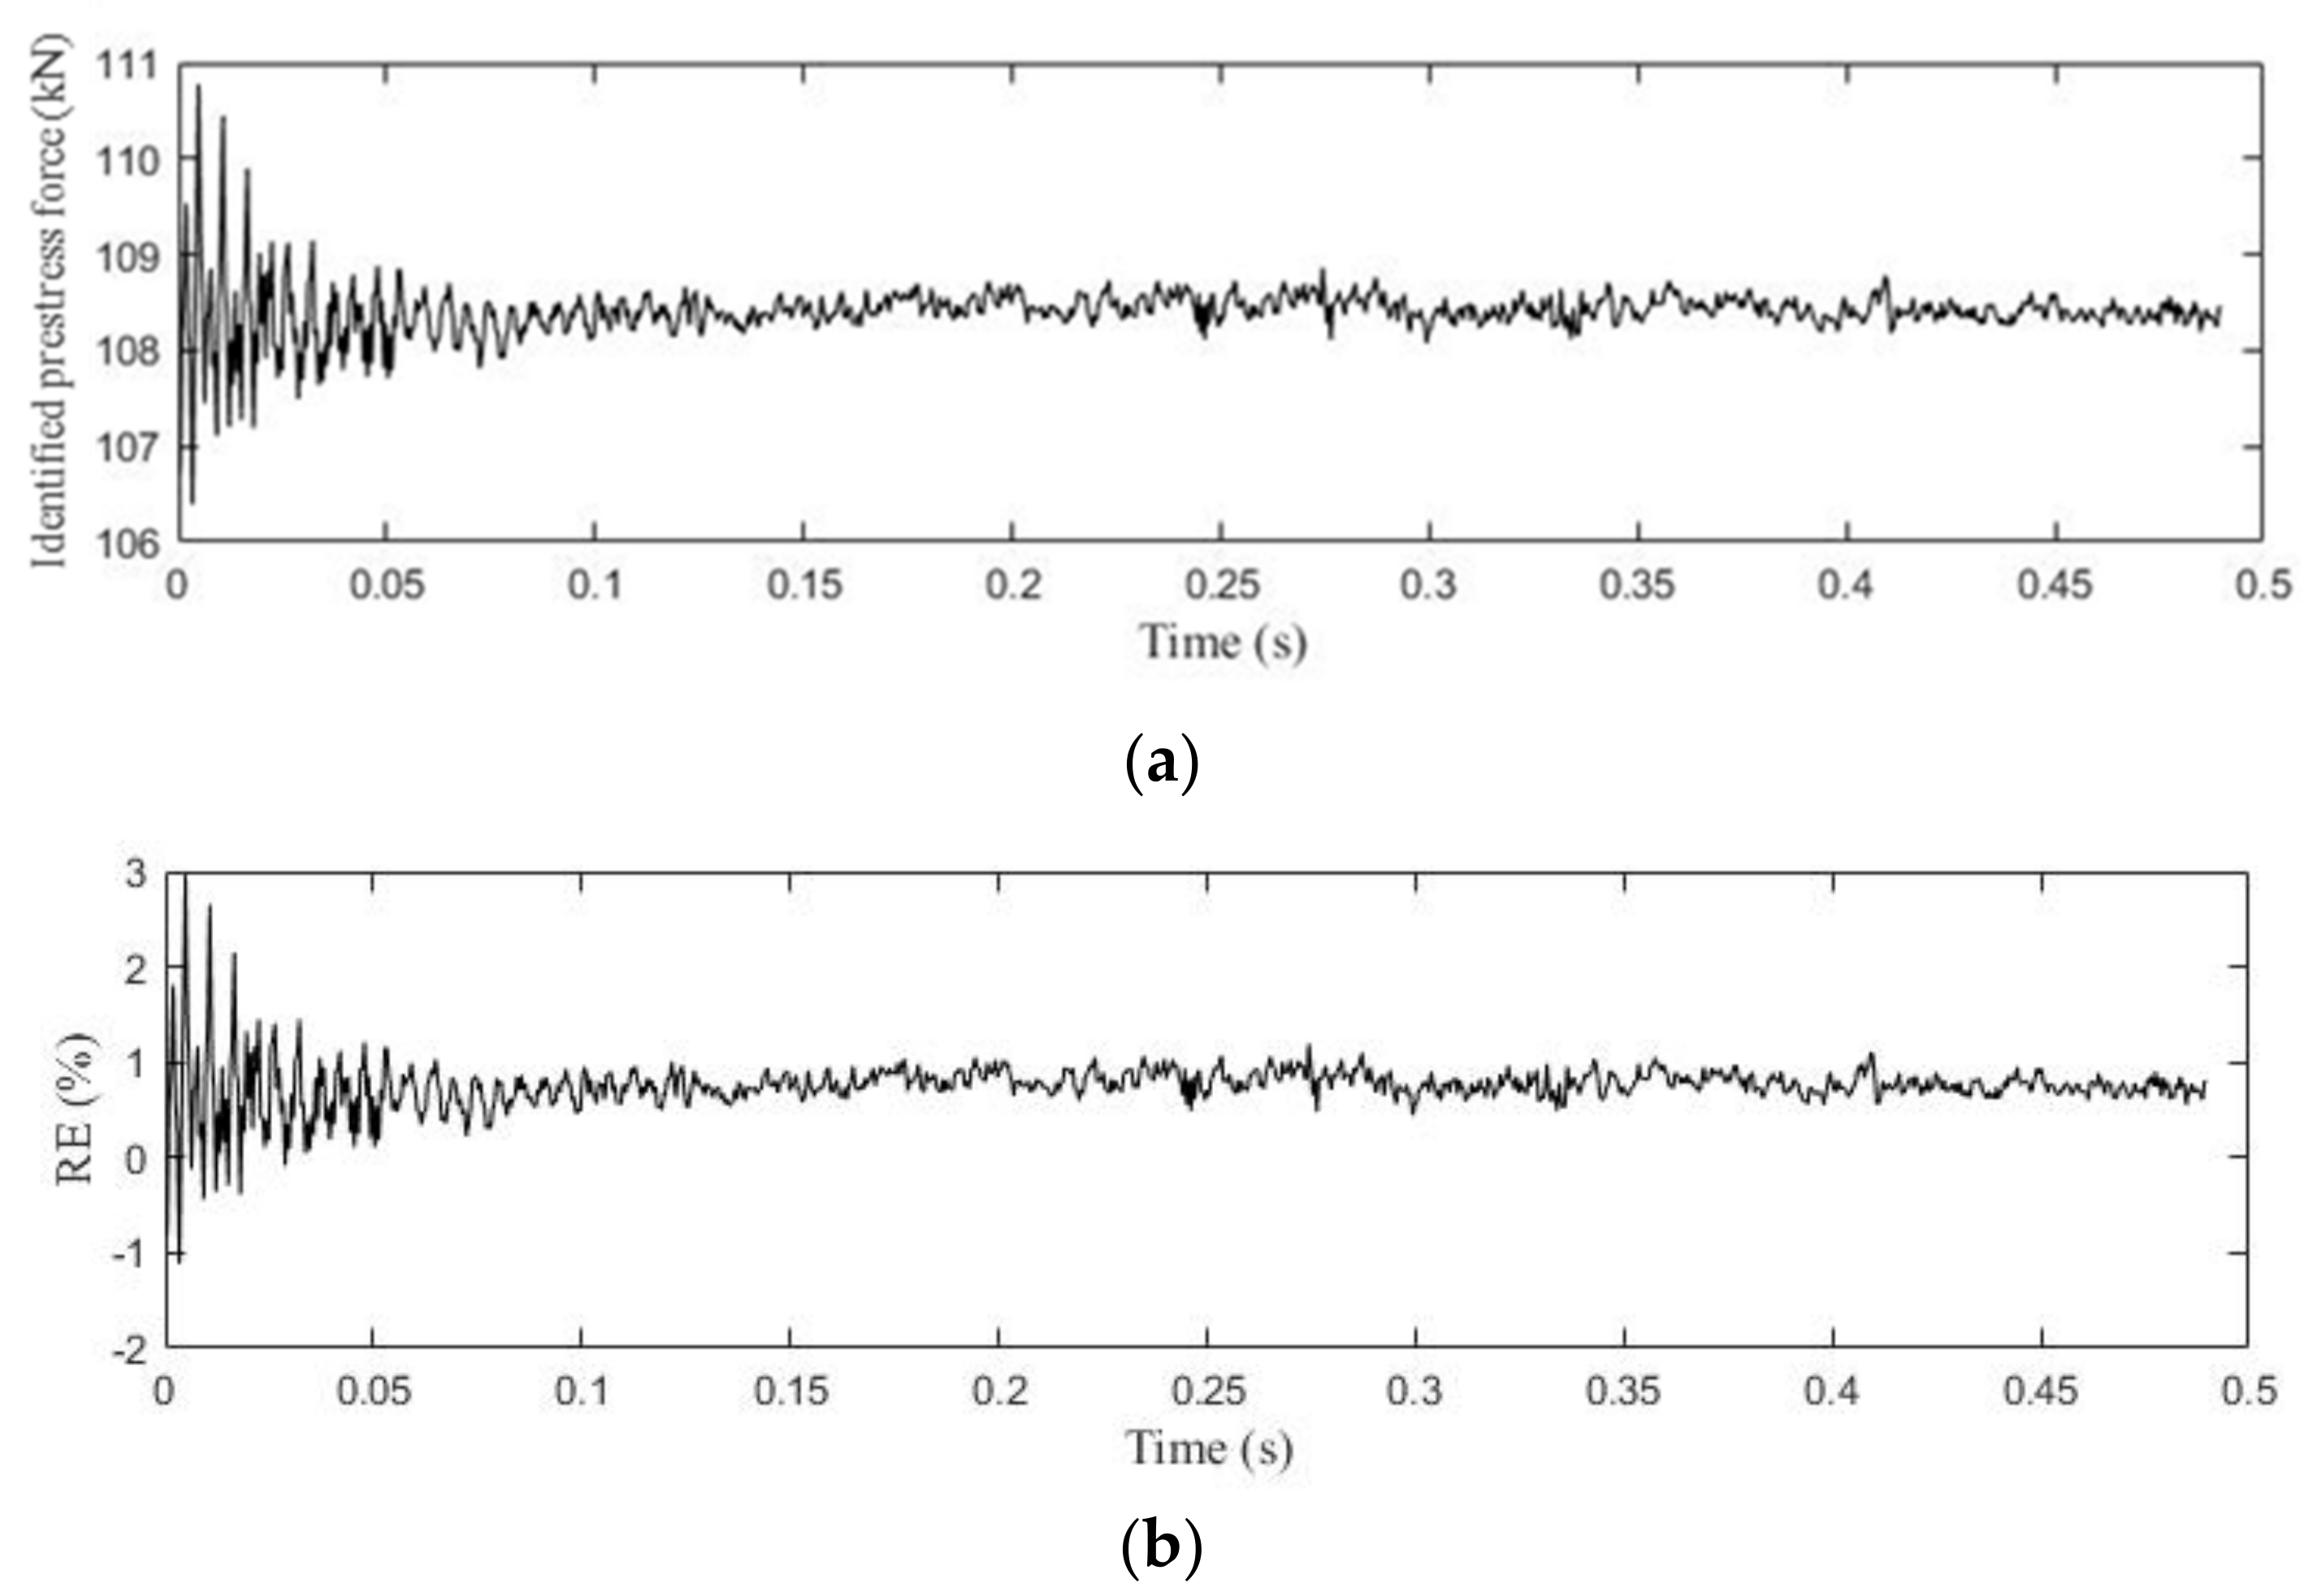
5.5. Prestress Force Quantification under the Dynamic Load

In practice, dynamic testing is relatively easier to carry out than static loading tests. In this section, numerical study is conducted to identify the prestress force by using the strain responses at the web of the bridge model subjected to a dynamic load. This investigation is conducted to simulate the realistic situation to predict the prestress force of the segmental beam from ordinary dynamic tests after the post-tensioning force has been applied, such as hammer impact tests. Figure 13 shows the hammer impact load applied on the middle of the second segment with a sampling rate of 2048 Hz and a sampling duration of 0.5 s. It is noted that this hammer impact force is measured from a real vibration test with an instrumented hammer, and this force is used as the external load applied in this numerical simulation to calculate the strain response data. The true applied prestress force of the numerical model is 107 kN. The strain responses calculated from the FEM at the top and bottom locations at the middle of the segment S2, i.e., II_t and II_b described in the above experimental tests, under the applied dynamic load, are shown in Figure 14.
The prestress force is identified by using the proposed method based on Equations (3)–(5), with the above-extracted strain values at the same locations as those in the experimental test. The identified prestress force from strain measurements, and the relative error between the applied prestress force in the FEM and the identified prestress force during the dynamic testing period, are shown in Figure 15a,b, respectively.
It can be observed from Figure 15 that the identified prestress forces have relatively large fluctuations within the first 0.05 s, owing to the influence of the applied external force acting on the beam at the beginning, which in fact changes the prestress force. However, as the vibration level is small, the change of the prestress force level is also small. The largest error of the identified prestress force level is less than 3%. In the free-vibration phase, the vibration level is smaller, the identified prestress force is relatively stable, that is, it oscillates between 108–109 kN. The relative error between the identified average prestress force and the actual applied prestress force in the numerical model in the free-vibration phase from 0.4–0.5 s is given in Table 12, and it is 1.32%, indicating that using the strain measurements in segment S2 in standard vibration test, which is relatively easy to carry out, gives good prestress force identification. These results demonstrate the feasibility and accuracy of using the proposed method in practical applications for quantifying the prestress force.

6. Conclusions

This paper proposes a method to quantify the prestress force in the precast prestressed segmental beams based on the strain measurement and neutral axis location. Under the plane–remains–plane assumption, neutral axis location is obtained by using the strain measurements. The static force equilibrium of a specific cross-section of the precast segmental beam is established to calculate the prestress force. The accuracy and reliability of the proposed method are verified through experimental and numerical studies on a prestressed segmental beam.
The experimental results verify that the prestress forces can be predicted by using the strain measurement during the post-tensioning process, or during service through a dynamic test. The results show that the theoretical prediction results have certain differences when compared with the experimental measured results obtained near the segmental joints. Discussions on the possible sources, such as the concrete modulus of elasticity and uncertainty of strain measurements that may lead to the inaccurate predictions of the prestress force, are provided. However, using the strains measured in the middle of the segment of the beam for calculating the prestress force shows a good correlation with the theoretical prediction.
In the numerical verification, five prestress levels from 62 kN to 100 kN are used to verify the credibility of the proposed method. Similar to the experimental verifications, the results at the middle of the segment match well with the experimental results than that obtained from the location near the joints of the beam. Discussions are provided by showing stress distribution contour in the longitudinal direction of the cross-section obtained in numerical simulations. It is found that the plane–remains–plane assumption is not valid at sections near the segmental joints, which explains why a relatively big difference is observed when measured data near the joint between the segments are used in the analysis. The results suggest that the measurements should be made at locations away from the joints in segmental beams for quantifying the prestress force. The reliability of the proposed method in identifying the prestress force of segmental beams in service condition through a dynamic test is also verified. The results demonstrate that the proposed method can be used for identifying the prestress force.
To sum up, both the experimental test and numerical simulation results demonstrate that the proposed approach can reliably identify the change in prestress force, and well quantify the prestress force level when selecting the strains away from the joints.

Author Contributions

Conceptualization, H.H., J.L. and H.L.; methodology, H.L., J.L., Y.X. and H.H.; validation, H.L., T.D.L. and T.M.P.; formal analysis, H.L. and Y.X.; investigation, J.L. and T.M.P.; data curation, H.L. and T.D.L.; writing—original draft preparation, H.L. and Y.X.; writing—review and editing, J.L., H.H. and T.M.P.; visualization, H.L.; supervision, J.L. and H.H.; project administration, J.L. and H.H.; funding acquisition, H.H. All authors have read and agreed to the published version of the manuscript.

Funding

This research was funded by: Australian Research Council, grant number: FL180100196.

Data Availability Statement

The data presented in this study might be available on reasonable request from the corresponding author.

Acknowledgments

The work described in this paper was supported by the Australian Research Council Laureate Fellowship project FL180100196: Development of multi-hazard resilient and sustainable infrastructure. The first author would like to acknowledge the Australian Research Training Program Scholarship for supporting her PhD study at Curtin University.

Conflicts of Interest

The authors declare no conflict of interest.

References

  1. Saiidi, M.; Douglas, B.; Feng, S. Prestress Force Effect on Vibration Frequency of Concrete Bridges. J. Struct. Eng. 1994, 120, 2233–2241. [Google Scholar] [CrossRef]
  2. Miyamoto, A.; Tei, K.; Nakamura, H.; Bull, J. Behavior of Prestressed Beam Strengthened with External Tendons. J. Struct. Eng. 2000, 126, 1033–1044. [Google Scholar] [CrossRef]
  3. Chan, T.; Yung, T. A theoretical study of force identification using prestressed concrete bridges. Eng. Struct. 2000, 22, 1529–1537. [Google Scholar] [CrossRef]
  4. Hamed, E.; Frostig, Y. Natural frequencies of bonded and unbonded prestressed beams—Prestress force effects. J. Sound Vib. 2006, 295, 28–39. [Google Scholar] [CrossRef]
  5. Dall’Asta, A.; Dezi, L. Discussion of “Prestress Force Effect on Vibration Frequency of Concrete Bridges” by M. Saiidi, B. Douglas and S. Feng. J. Struct. Eng. 1996, 122, 458. [Google Scholar] [CrossRef]
  6. Wang, T.; Huang, R.; Wang, T. The variation of flexural rigidity for post-tensioned prestressed concrete beams. J. Mar. Sci. Technol. 2013, 21, 300–308. [Google Scholar]
  7. Noble, D.; Nogal, M.; O’Connor, A.; Pakrashi, V. The effect of prestress force magnitude and eccentricity on the natural bending frequencies of uncracked prestressed concrete beams. J. Sound Vib. 2016, 365, 22–44. [Google Scholar] [CrossRef] [Green Version]
  8. Jang, J.; Lee, H.; Hwang, K.; Song, Y. A sensitivity analysis of the key parameters for the prediction of the prestress force on bonded tendons. Nucl. Eng. Technol. 2010, 42, 319–328. [Google Scholar] [CrossRef] [Green Version]
  9. Toyota, Y.; Hirose, T.; Ono, S.; Shidara, K. Experimental Study on Vibration Characteristics of Prestressed Concrete Beam. Procedia Eng. 2017, 171, 1165–1172. [Google Scholar] [CrossRef]
  10. Lu, Z.; Law, S. Identification of prestress force from measured structural responses. Mech. Syst. Signal Process. 2006, 20, 2186–2199. [Google Scholar] [CrossRef]
  11. Ho, D.; Kim, J.; Stubbs, N.; Park, W. Prestress-Force Estimation in PSC Girder Using Modal Parameters and System Identification. Adv. Struct. Eng. 2012, 15, 997–1012. [Google Scholar] [CrossRef]
  12. Xia, Y.; Hao, H.; Zanardo, G.; Deeks, A. Long term vibration monitoring of an RC slab: Temperature and humidity effect. Eng. Struct. 2006, 28, 441–452. [Google Scholar] [CrossRef]
  13. Xiang, Z.; Chan, T.; Thambiratnam, D.; Nguyen, T. Synergic identification of prestress force and moving load on prestressed concrete beam based on virtual distortion method. Smart Struct. Syst. 2016, 17, 917–933. [Google Scholar] [CrossRef]
  14. Anastasopoulos, D.; de Roeck, G.; Reynders, E. Influence of damage versus temperature on modal strains and neutral axis positions of beam-like structures. Mech. Syst. Signal Process. 2019, 134, 106311. [Google Scholar] [CrossRef]
  15. Peeters, B.; de Roeck, G. One-year monitoring of the Z24-Bridge: Environmental effects versus damage events. Earthq. Eng. Struct. Dyn. 2001, 30, 149–171. [Google Scholar] [CrossRef]
  16. Soman, R.; Majewska, K.; Mieloszyk, M.; Malinowski, P.; Ostachowicz, W. Application of Kalman Filter based Neutral Axis tracking for damage detection in composites structures. Compos. Struct. 2018, 184, 66–77. [Google Scholar] [CrossRef]
  17. Xia, Y.; Lei, X.; Wang, P.; Liu, G.; Sun, L. Long-term performance monitoring and assessment of concrete beam bridges using neutral axis indicator. Struct. Control Health Monit. 2020, 27, 12. [Google Scholar] [CrossRef]
  18. Sigurdardottir, D.; Glisic, B. Neutral axis as damage sensitive feature. Smart Mater. Struct. 2013, 22, 75030. [Google Scholar] [CrossRef]
  19. Sigurdardottir, D.; Glisic, B. Detecting minute damage in beam-like structures using the neutral axis location. Smart Mater. Struct. 2014, 23, 125042. [Google Scholar] [CrossRef]
  20. Xia, H. SHM-Based Condition Assessment of In-Service Bridge Structures Using Strain Measurement. Ph.D. Thesis, The Hong Kong Polytechnic University, Hong Kong, China, 2012. [Google Scholar]
  21. Abdel-Jaber, H.; Glisic, B. Monitoring of prestressing forces in prestressed concrete structures—An overview. Struct. Control Health Monit. 2019, 26, 8. [Google Scholar] [CrossRef] [Green Version]
  22. Le, T.; Pham, T.; Hao, H.; Li, H. Behavior of Precast Segmental Concrete Beams Prestressed with External Steel and CFRP Tendons. J. Compos. Constr. 2020, 24, 4020053. [Google Scholar] [CrossRef]
  23. Le, T.; Pham, T.; Hao, H.; Yuan, C. Performance of precast segmental concrete beams posttensioned with carbon fiber-reinforced polymer (CFRP) tendons. Compos. Struct. 2019, 208, 56–69. [Google Scholar] [CrossRef]
  24. Zhan, H.; Jiang, H.; Zhang, J.; Jiang, R. Condition Evaluation of an Existing T-Beam Bridge Based on Neutral Axis Variation Monitored with Ultrasonic Coda Waves in a Network of Sensors. Sensors 2020, 20, 3895. [Google Scholar] [CrossRef] [PubMed]
  25. Noguchi, T.; Tomosawa, F.; Nemati, K.; Chiaia, B.; Fantilli, A. A Practical Equation for Elastic Modulus of Concrete. ACI Struct. J. 2009, 106, 690–696. [Google Scholar]
  26. AS 1012.8.1; Methods of Testing Concrete—Method 8.1: Method for Making and Curing Concrete—Compression and Indirect Tensile Test Specimens. Standards Australia International Ltd.: Sydney, NSW, Australia, 2014.
  27. AS 1012.9; Methods of Testing Concrete—Method 9: Compressive Strength Tests—Concrete, Mortar and Grout Specimens. Standards Australia International Ltd.: Sydney, NSW, Australia, 2014.
  28. AS 3600:2018; Concrete Structures. Standards Australia International Ltd.: Sydney, NSW, Australia, 2018.
  29. Hattori, G.; Serpa, A. Contact stiffness estimation in ANSYS using simplified models and artificial neural networks. Finite Elem. Anal. Des. 2015, 97, 43–53. [Google Scholar] [CrossRef] [Green Version]
  30. Ren, W.; Fang, S.; Deng, M. Response Surface—Based Finite-Element-Model Updating Using Structural Static Responses. J. Eng. Mech. 2011, 137, 248–257. [Google Scholar] [CrossRef]
Figure 1. Strain distribution along the cross-section of the beam.
Applsci 12 02756 g001
Figure 2. Schematic for the force equilibrium of the beam.
Applsci 12 02756 g002
Figure 3. Tested precast prestressed concrete segmental beam.
Applsci 12 02756 g003
Figure 4. Cross-section of the segmental beam.
Applsci 12 02756 g004
Figure 5. Typical setup for applying the post-tensioning force.
Applsci 12 02756 g005
Figure 6. Locations of the strain gauges attached on the segmental beams.
Applsci 12 02756 g006
Figure 7. Typical experimental setup for static loading test.
Applsci 12 02756 g007
Figure 8. Location of linear variable differential transformers (LVDTs).
Applsci 12 02756 g008
Figure 9. Developed finite element model in ANSYS.
Applsci 12 02756 g009
Figure 10. Longitudinal stress contours of the beam under prestress force of 107 kN.
Applsci 12 02756 g010
Figure 11. (a) The stress distribution contour in the longitudinal direction of the cross-section with strain gauges in S2. (b) Stress distribution over the cross-section with strain gauges in S2.
Applsci 12 02756 g011
Figure 12. (a) The stress distribution in the longitudinal direction of the cross-section of strain gauge locations in S3. (b) Stress distribution over the cross-section with strain gauges in S3.
Applsci 12 02756 g012aApplsci 12 02756 g012b
Figure 13. Dynamic load applied on the numerical model.
Applsci 12 02756 g013
Figure 14. The strain responses calculated from the FEM at the locations of II_t and II_b.
Applsci 12 02756 g014
Figure 15. Prestress force identification results: (a) The identified prestress force from strain measurements. (b) The relative error between the simulated prestress force in the FEM and the identified prestress force with strain responses.
Applsci 12 02756 g015
Table 1. Material properties of steel bars and prestressed steel tendon.
TypeDiameter (mm)Cross-Sectional Area (mm2) f y   ( MPa ) f u   ( Mpa ) Es (Gpa)
Steel   bar   12 12113534587200
Steel   bar   10 1078.5489538200
Prestressed Steel tendon12.710016741860195
Table 2. Comparison between the measured and calculated prestress forces of the beam.
E N A L 2   m m E F   k N T F 2   k N R E 2 E N A L 3   m m E F   k N T F 3   k N R E 3
305.0561.5764.174.22%314.7261.5770.9315.20%
297.54107.11108.71.48%303107.11119.7211.77%
Table 3. Error analysis considering variations in modulus of elasticity of concrete.
VariationEC (Pa)S2S3
R E 2 _ 62 R E 2 _ 107   R E 3 _ 62 R E 3 _ 107
−20%2.438 × 10¹⁰−18.77%−20.06%−10.42%−11.97%
−10%2.742 × 10¹⁰−7.86%−9.29%1.65%−0.09%
10%3.352 × 101013.97%12.26%25.78%23.65%
20%3.656 × 101024.88%23.03%37.85%36.52%
Original3.047 × 10103.06%1.48%13.72%11.77%
Table 4. Error analysis on the effect of strain measurement accuracy.
Uncertainty Error LevelS2S3
R E 2 _ 62   % R E 2 _ 107   % R E 3 _ 62   % R E 3 _ 107   %
2%2.841.3812.6811.44
5%2.761.2512.5611.28
8%2.431.0512.2410.99
Original3.061.4813.7211.77
Table 5. Comparison of the neutral axis locations between the experimental and numerical results.
Prestress Force (kN)ENAL2 (mm)MNAL2 (mm)RE (%)ENAL3 (mm)MNAL3 (mm)RE (%)
62305.05301.55−1.15%314.72308.85−1.87%
107297.54290.36−2.41%303298.08−1.62%
Table 6. Comparison of the deflections between experimental tests and numerical analysis.
Static   Loads   k N E L 1   m m M L 1   m m RE (%) E L 23   m m M L 23   m m RE (%) E L 4   m m M L 4   m m RE (%)
15−0.80−0.833.75−1.03−1.01−1.94−0.94−0.84−10.64
20−1.04−1.116.73−1.35−1.43.70−1.27−1.12−11.81
Table 7. Sensitivity analysis results of the candidate model parameters.
ParametersChanges of
Parameters (%)
Sensitivity of Displacement
Responses with Respect to the
Parameter (%)
Sensitivity of Neutral Axis Location (%)
ML1ML23ML4MNAL2MNAL2
E c 108.048.048.040.140.08
ρ c 101.381.401.37−0.18−0.03
E s 10−10.65−10.67−10.650.410.25
NSct102.022.062.15−0.01−0.02
TSct100.000.000.000.04−0.01
Table 8. Initial values and updated parameters of the candidate parameters.
Parameters   E c     ( Pa ) ρ c   k g / m 3 E s   ( Pa )
Initial values3.047 × 101024501.95 × 1011
Updated values3.045 × 101026252.05 × 1011
Table 9. Defined error indices for the updated model.
CasesNeural Axis Location15 kN20 kN
MNAL2MNAL3ML1ML23ML4ML1ML23ML4
RE (%)Original−2.47−1.654.151.9211.296.733.8613.73
Updated0.49−0.15−3.39−0.961.25−3.49−3.554.9
Table 10. Defined error indices for the updated model under the prestressing force of 62 kN.
CasesNeural Axis Location
MNAL2MNAL3
RE (%)Original−1.16−1.90
Updated0.991.34
Table 11. Comparison between the applied and predicted prestress forces from the proposed approach.
Applied Prestress Force (kN)TF2 (kN)RE (%)TF3 (kN)RE (%)
6259.95−3.31%65.105.00%
7069.10−1.29%77.9511.36%
8080.210.26%91.1813.98%
9092.522.80%103.3914.88%
107109.182.04%118.2710.53%
Table 12. Comparison of the applied and identified average prestress forces from strain measurements during the free vibration period of the dynamic test.
Applied Prestress Force in the
Numerical Model (kN)
Identified Average Prestress Force (kN)Relative Error (%)
107108.411.32
Publisher’s Note: MDPI stays neutral with regard to jurisdictional claims in published maps and institutional affiliations.

