
Insights into Plugging of Pipe Piles Based on Pile Dimensions


Abstract
:1. Introduction
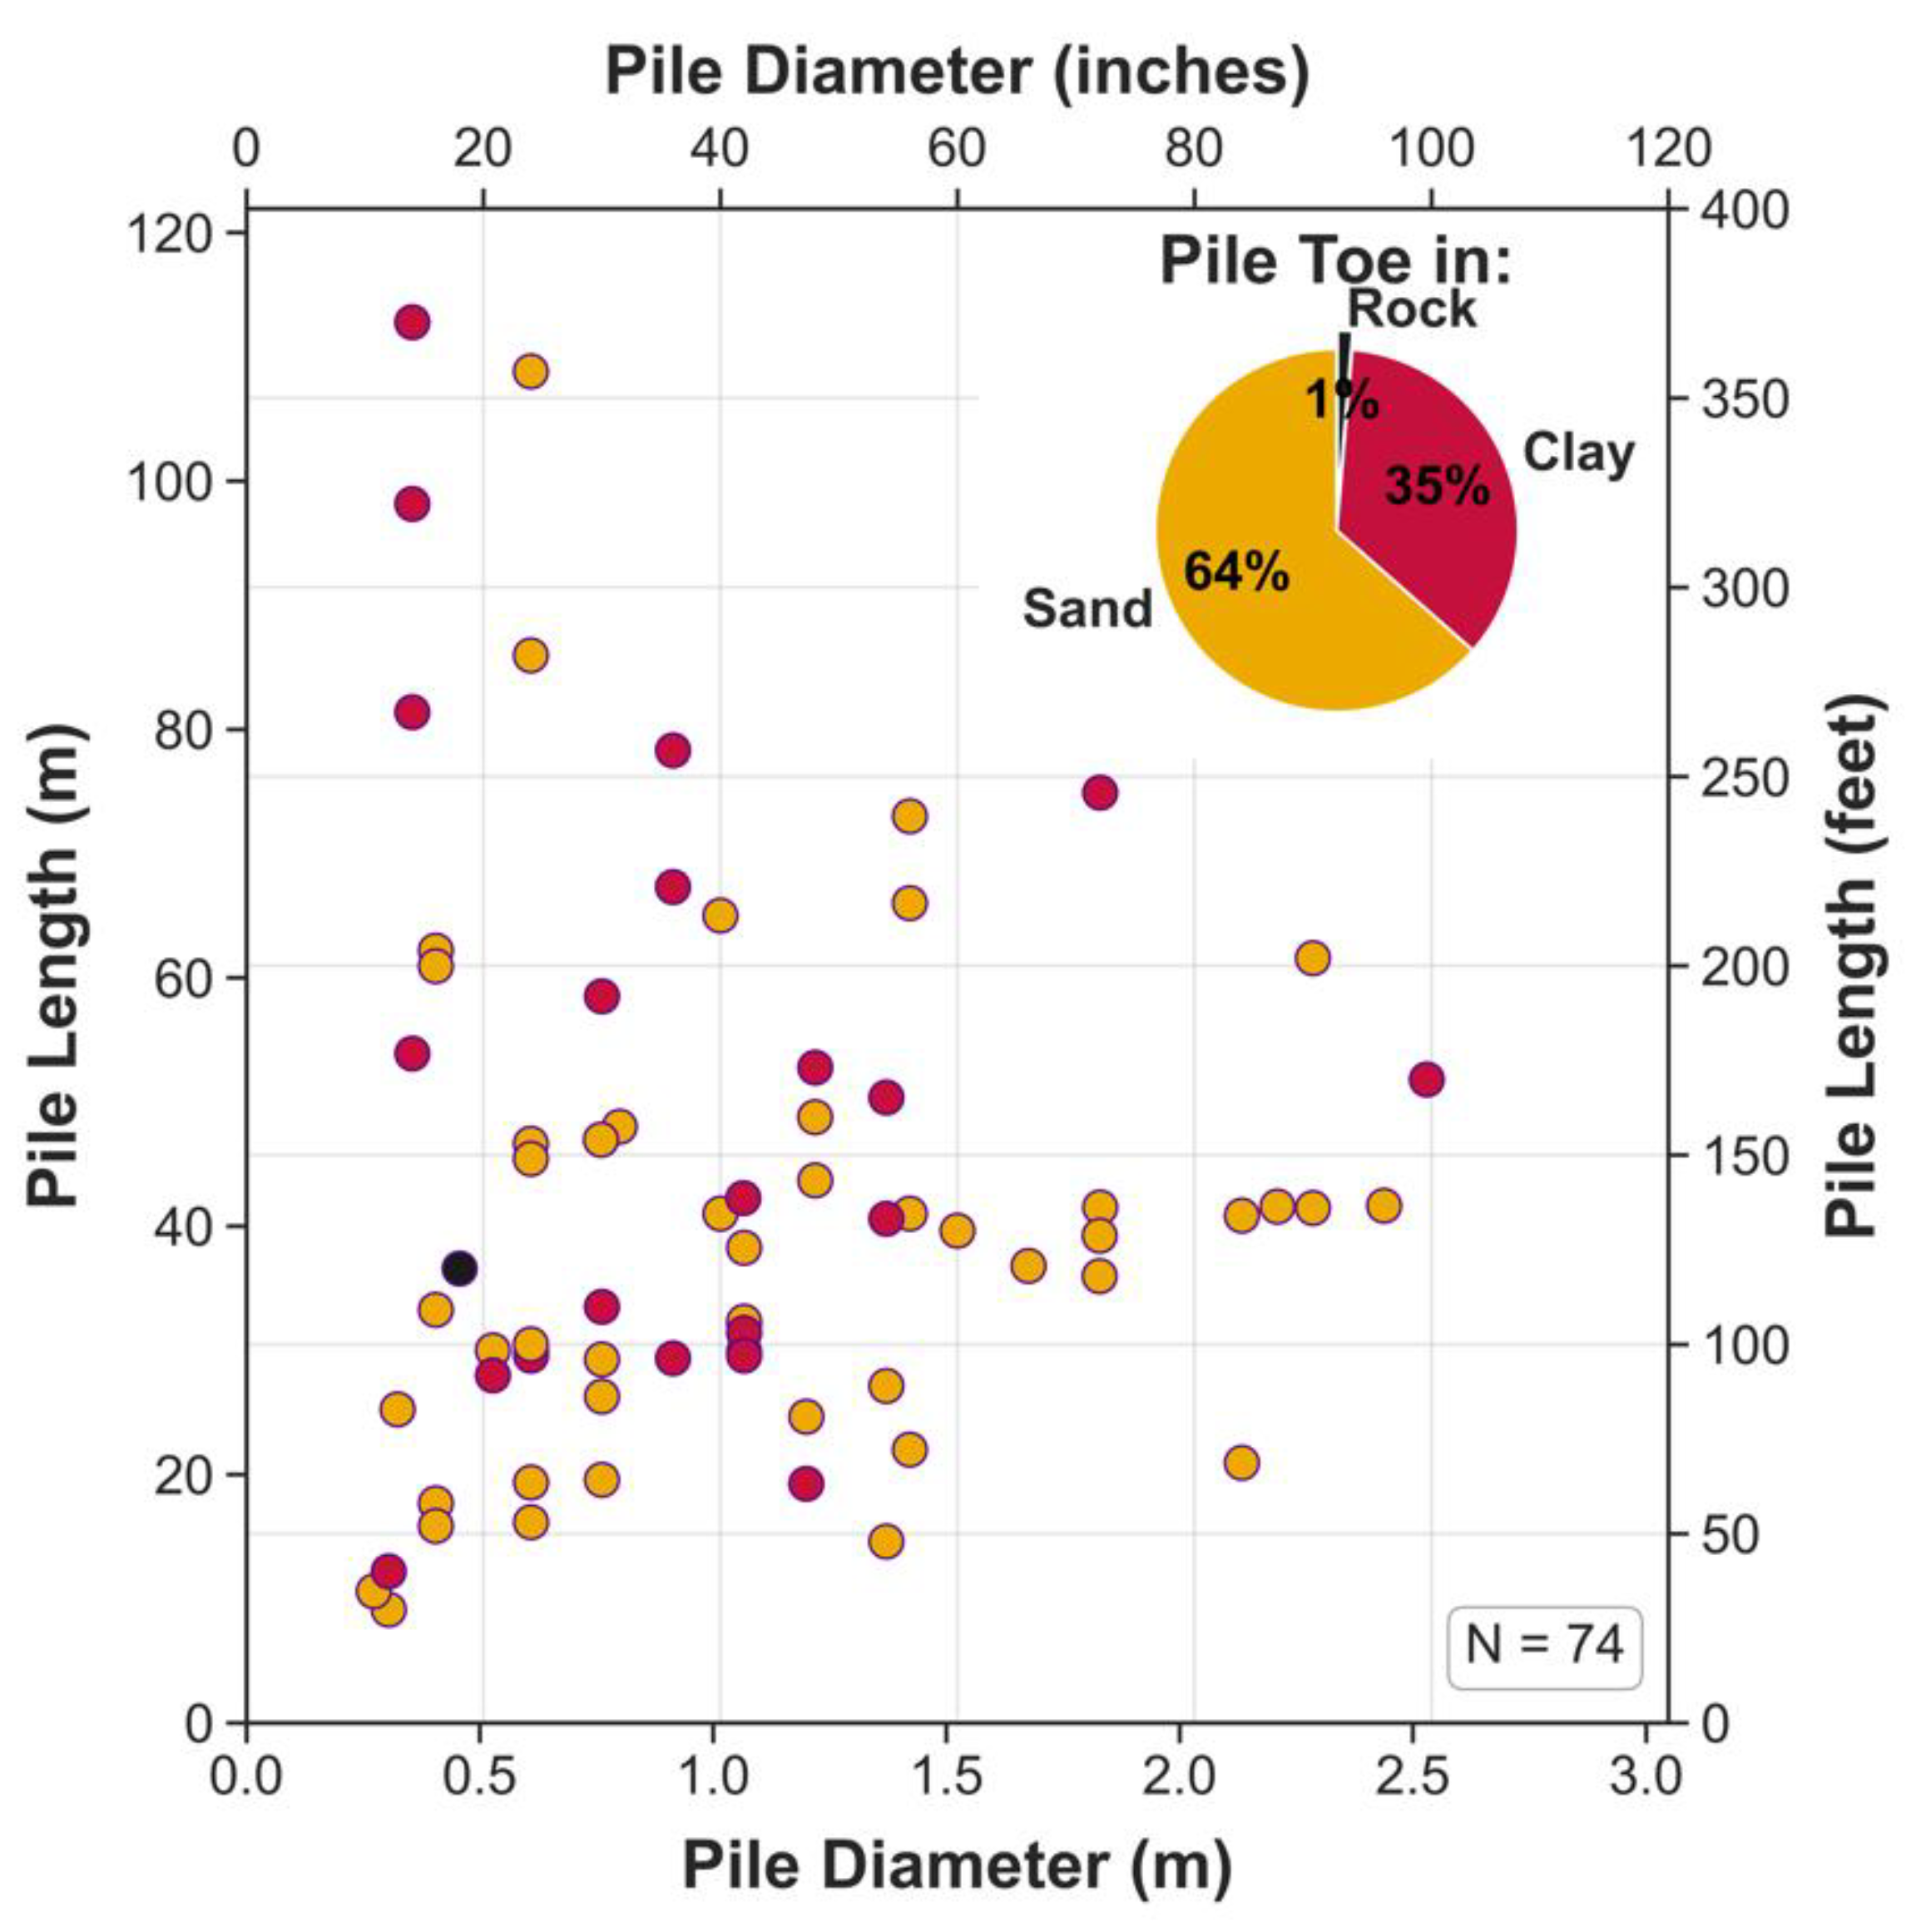
2. Load Test Data
3. Plugging and Capacity
4. Pile Design Methods Employed for Identification of Plugging
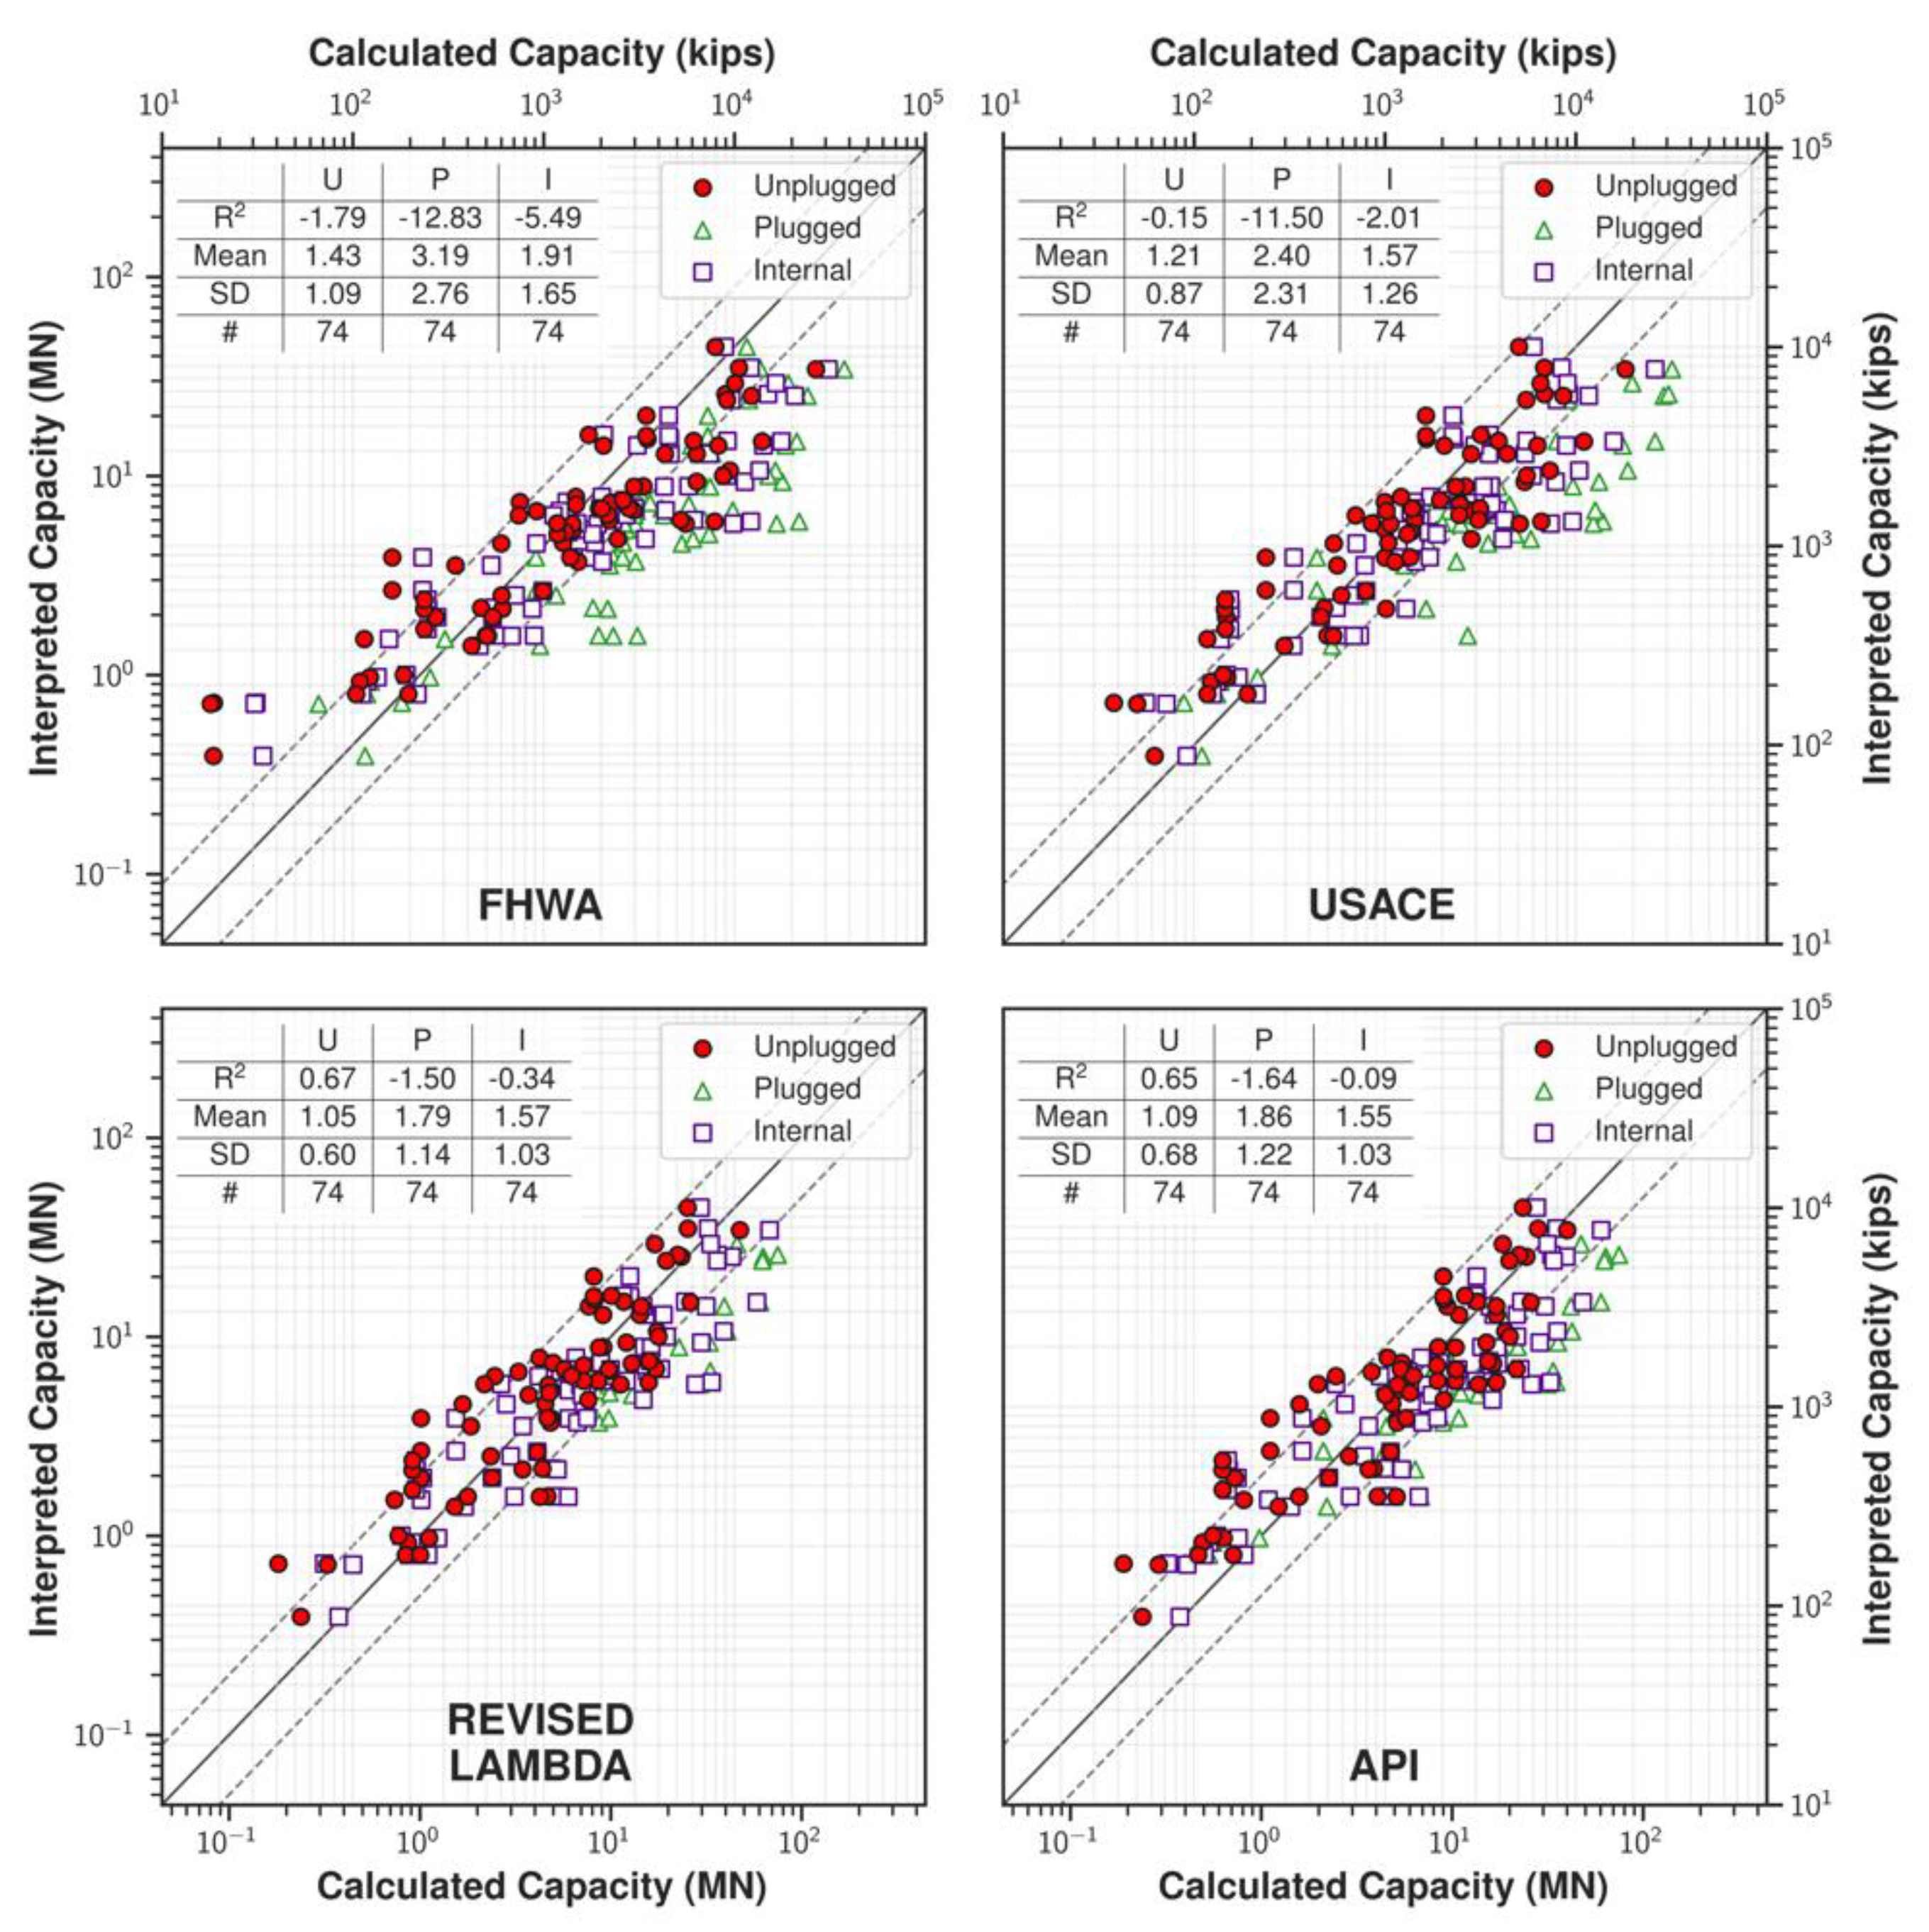
4.1. Federal Highway Administration (FHWA) Method
4.2. United States Army Corps of Engineers (USACE) Method
4.3. Revised Lambda Method
4.4. American Petroleum Institute (API) Method
5. Analysis
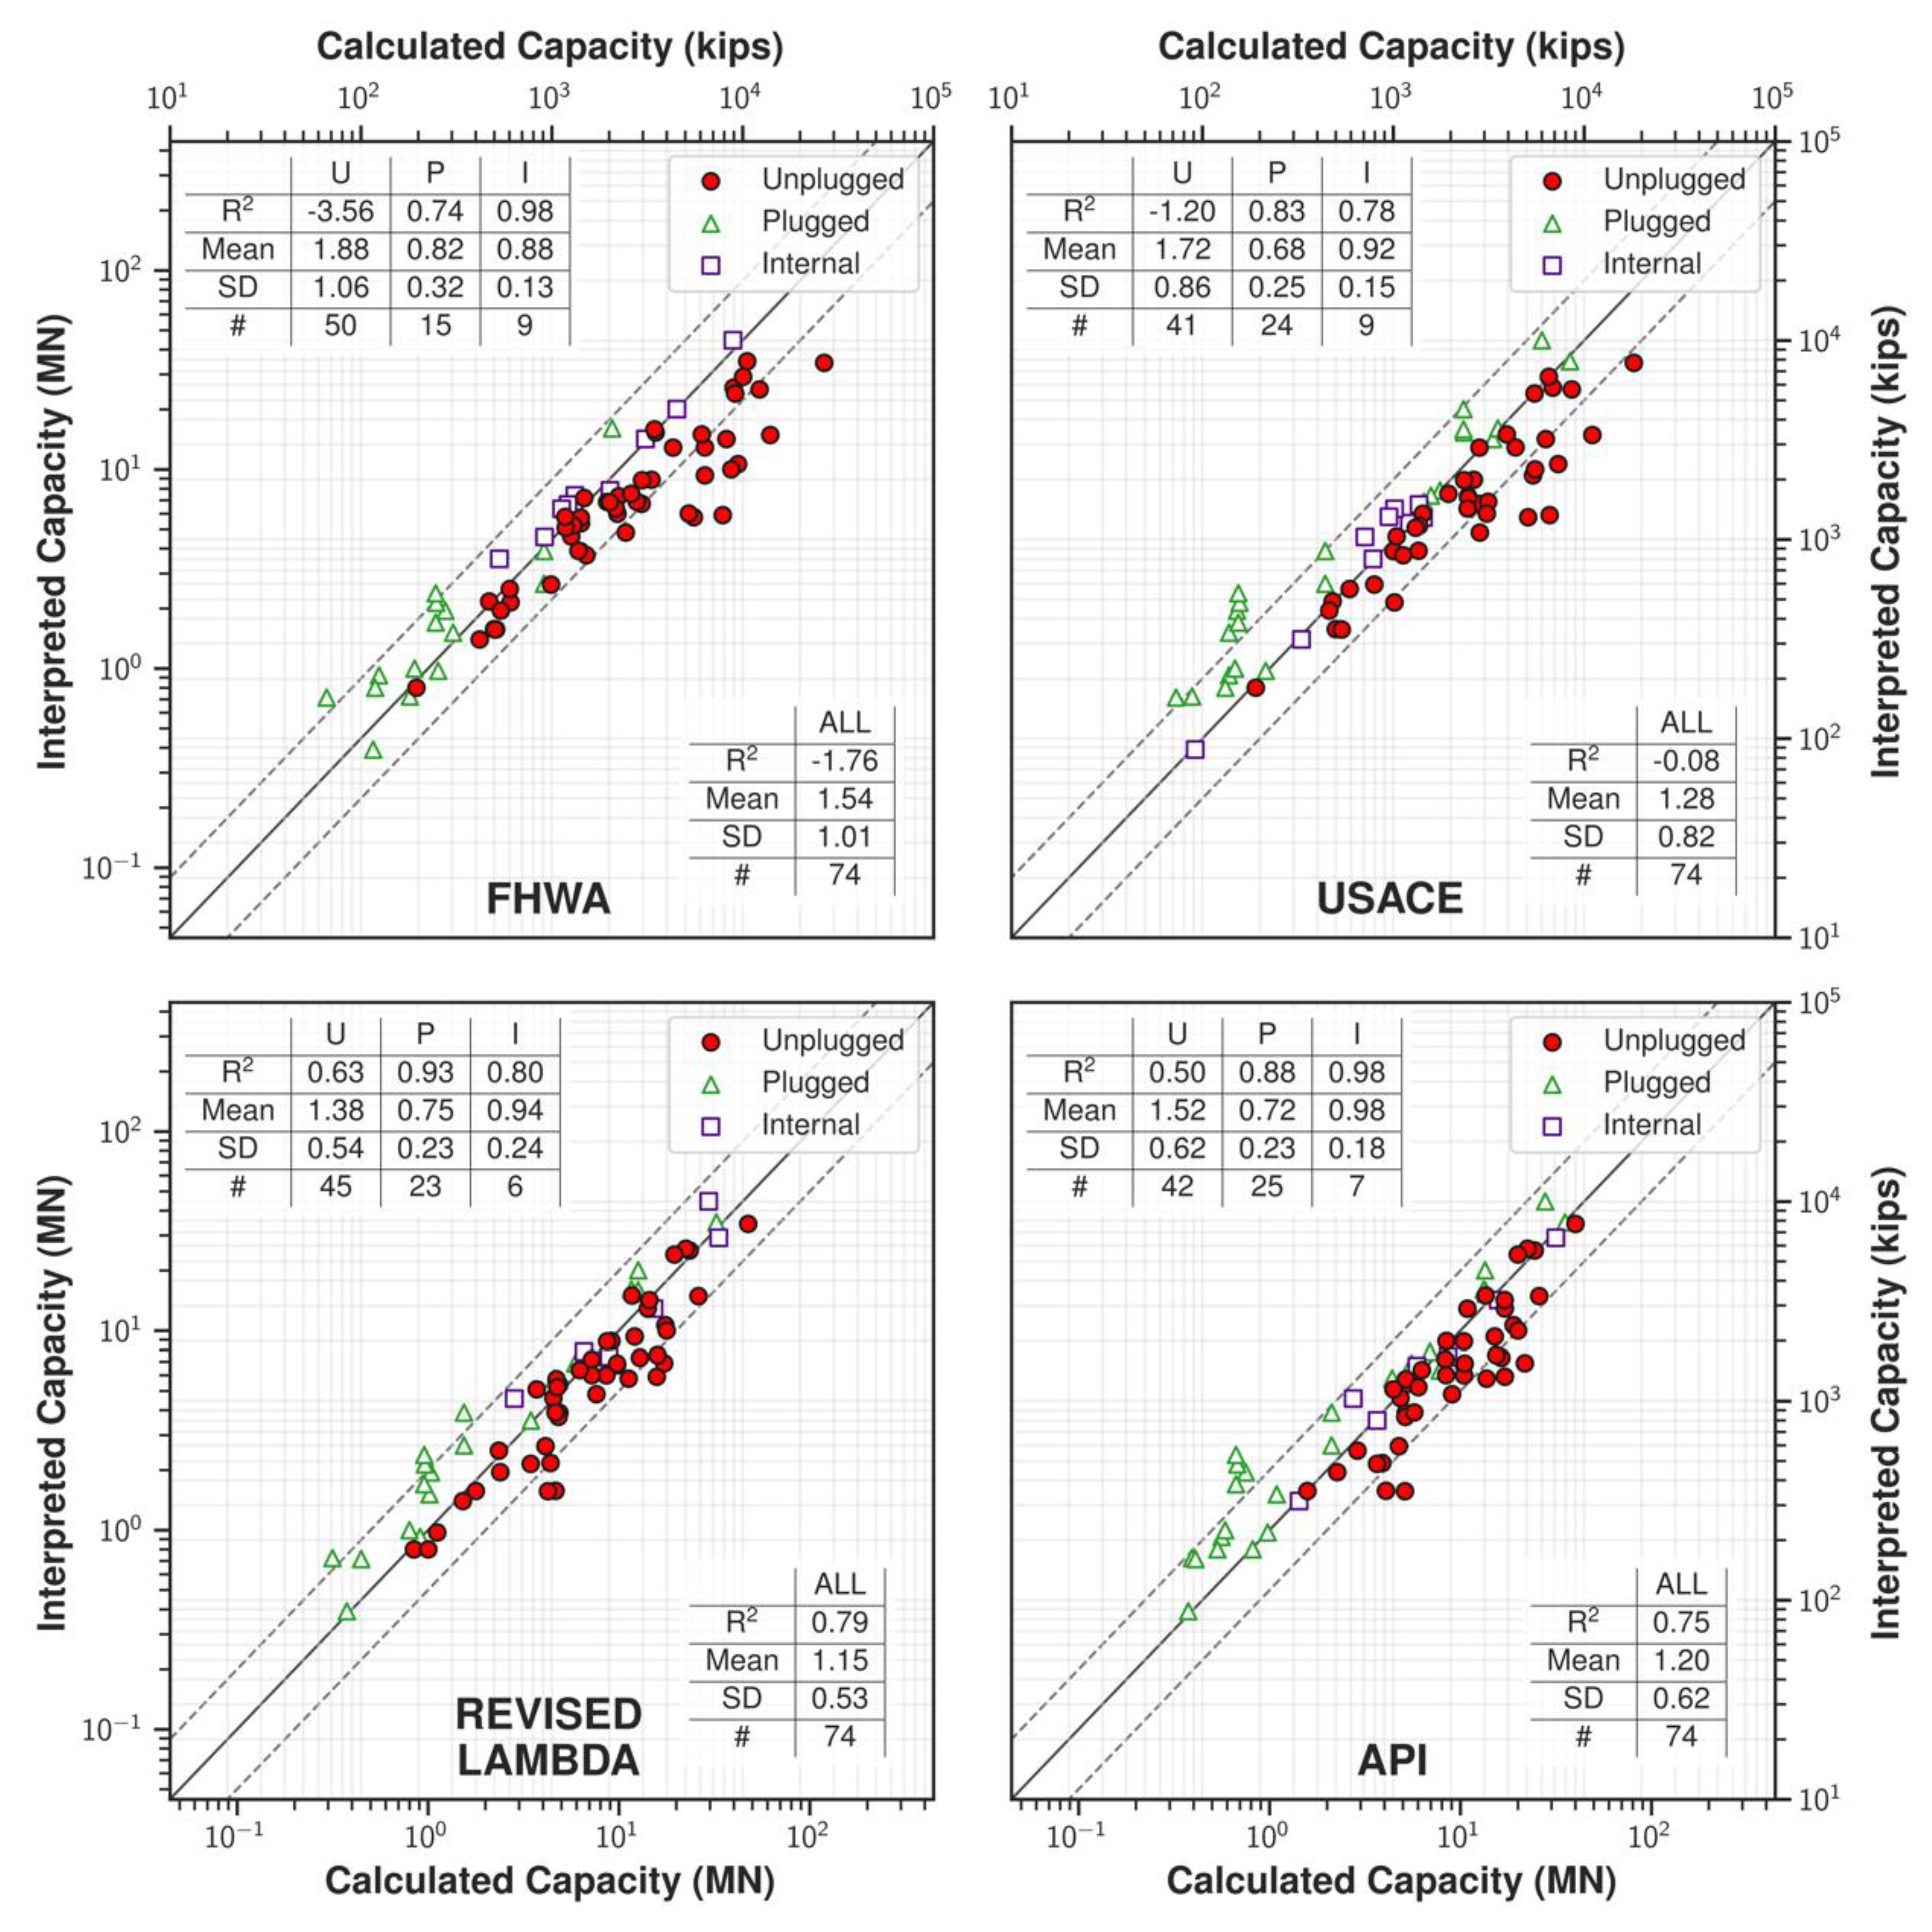
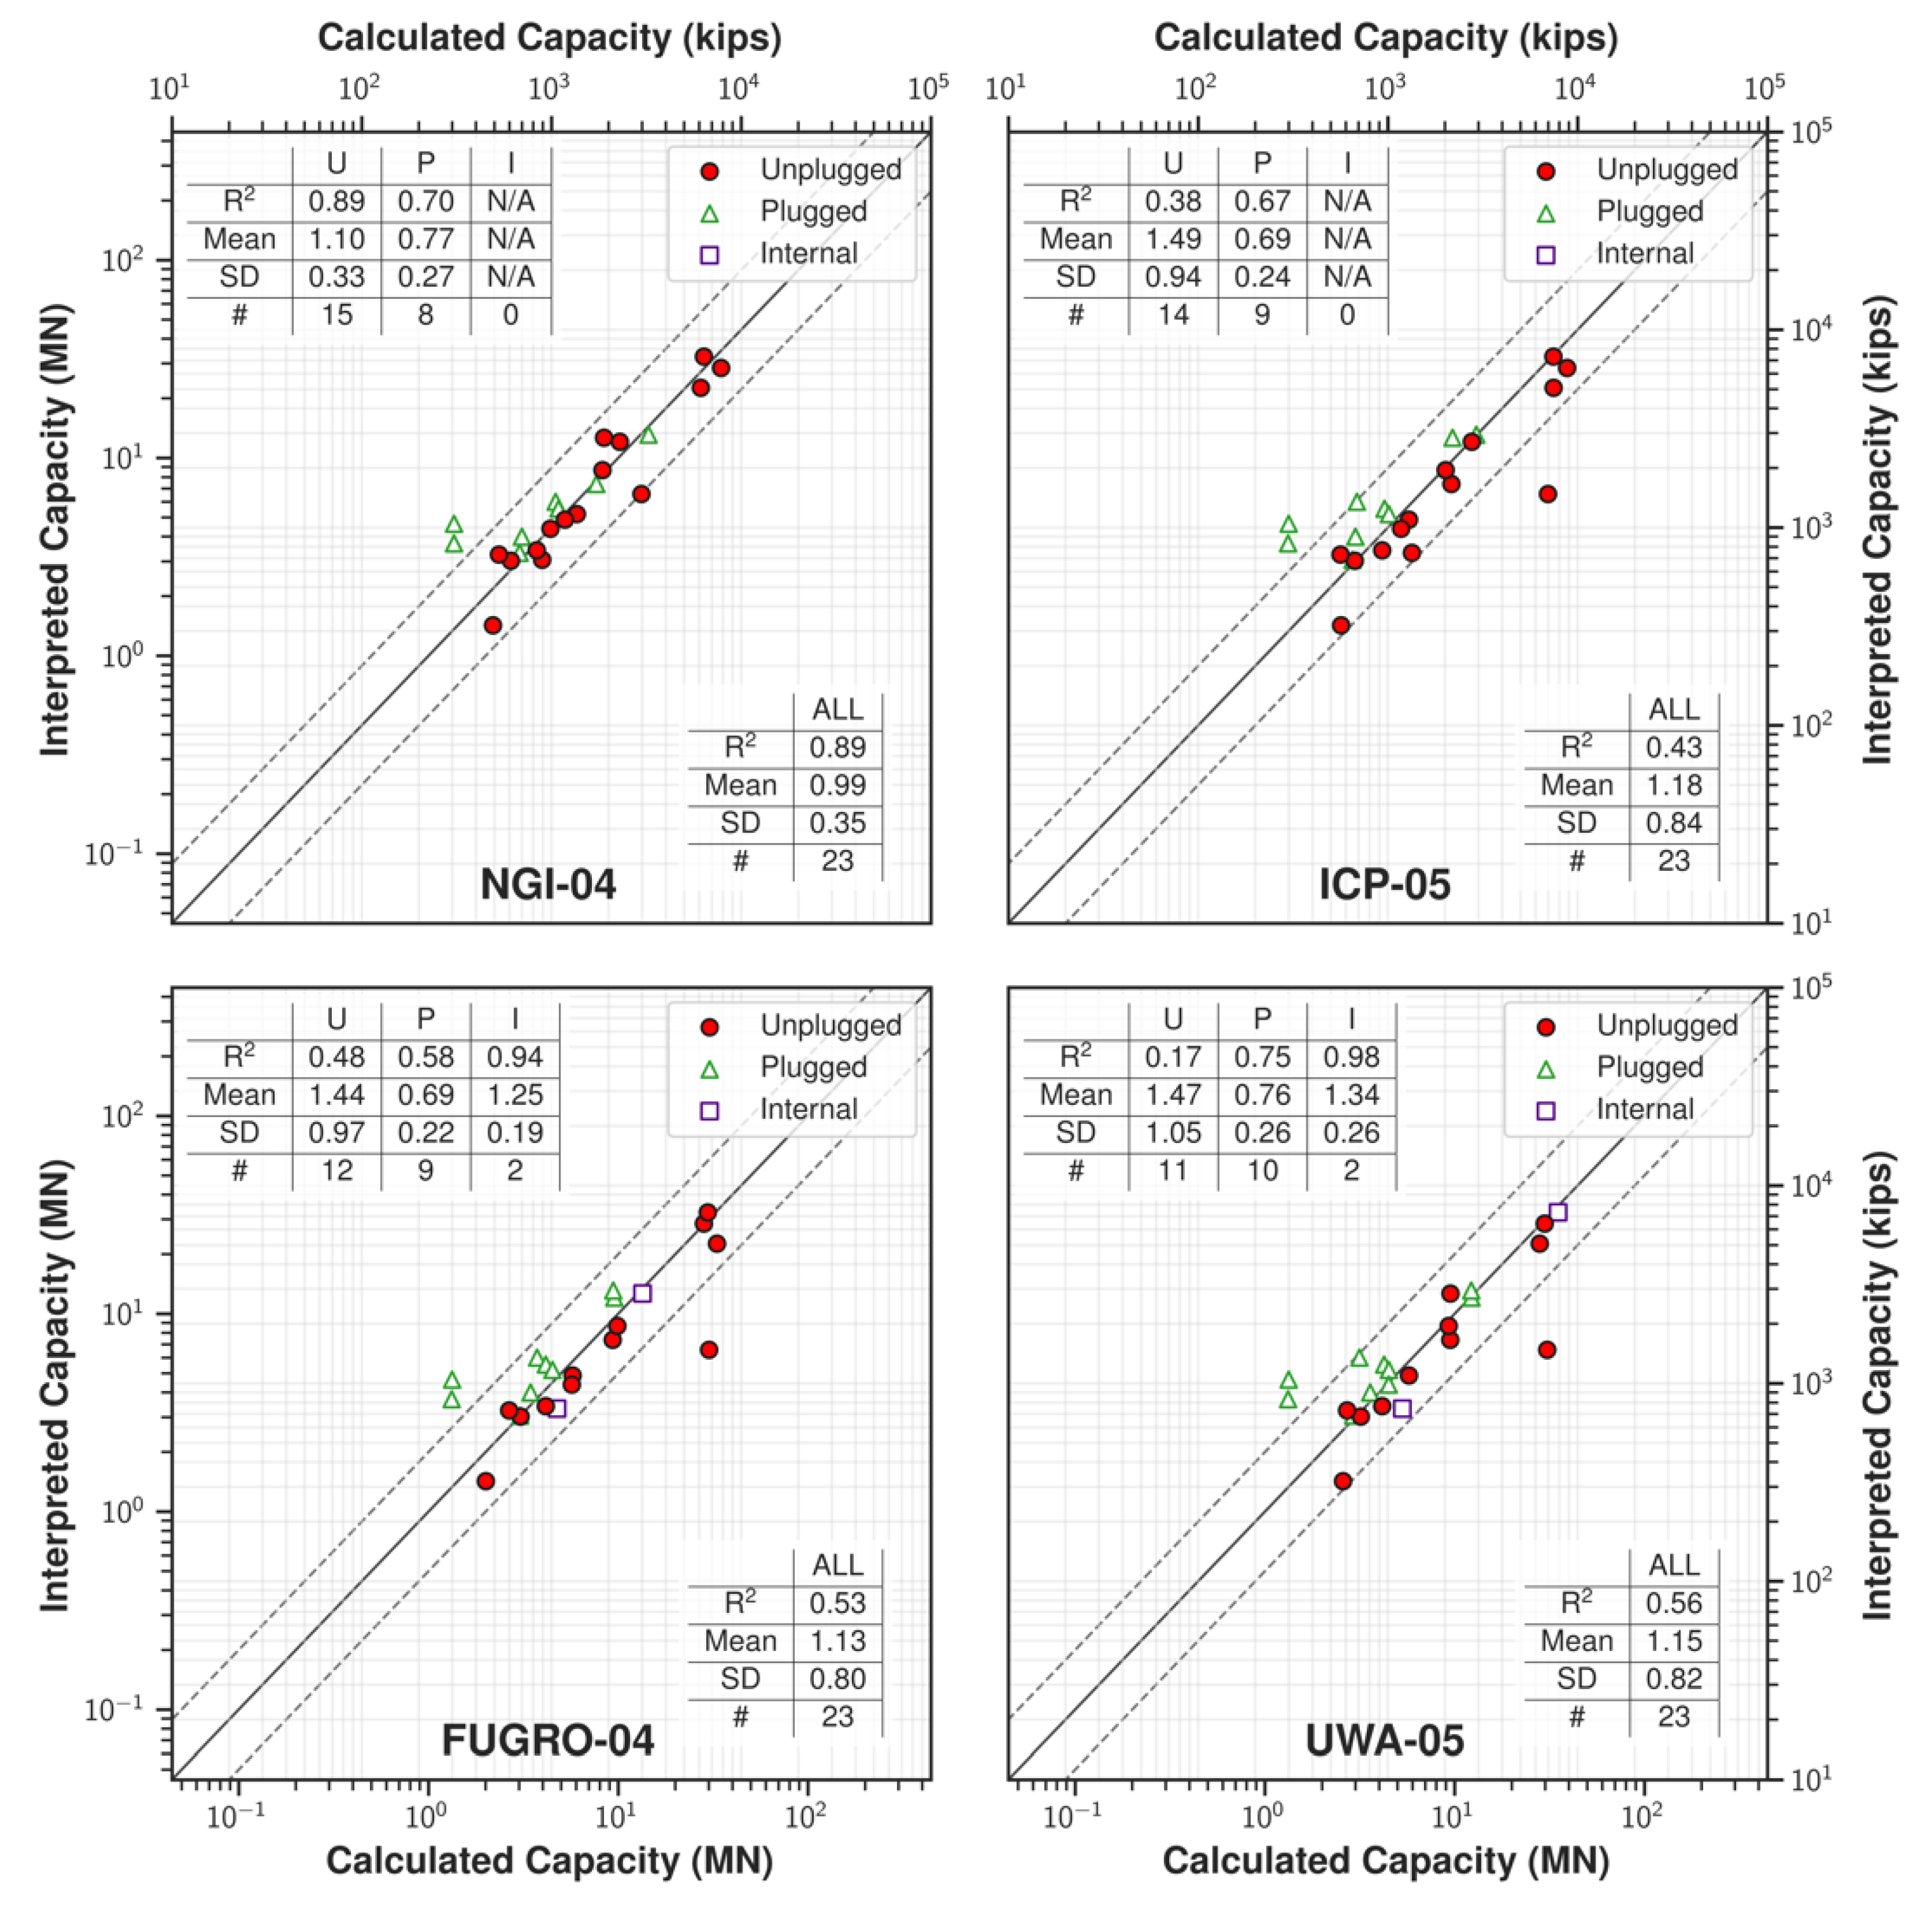
5.1. Performance of Design Methods
5.2. Identification of Plugging Based on Qc/Qm
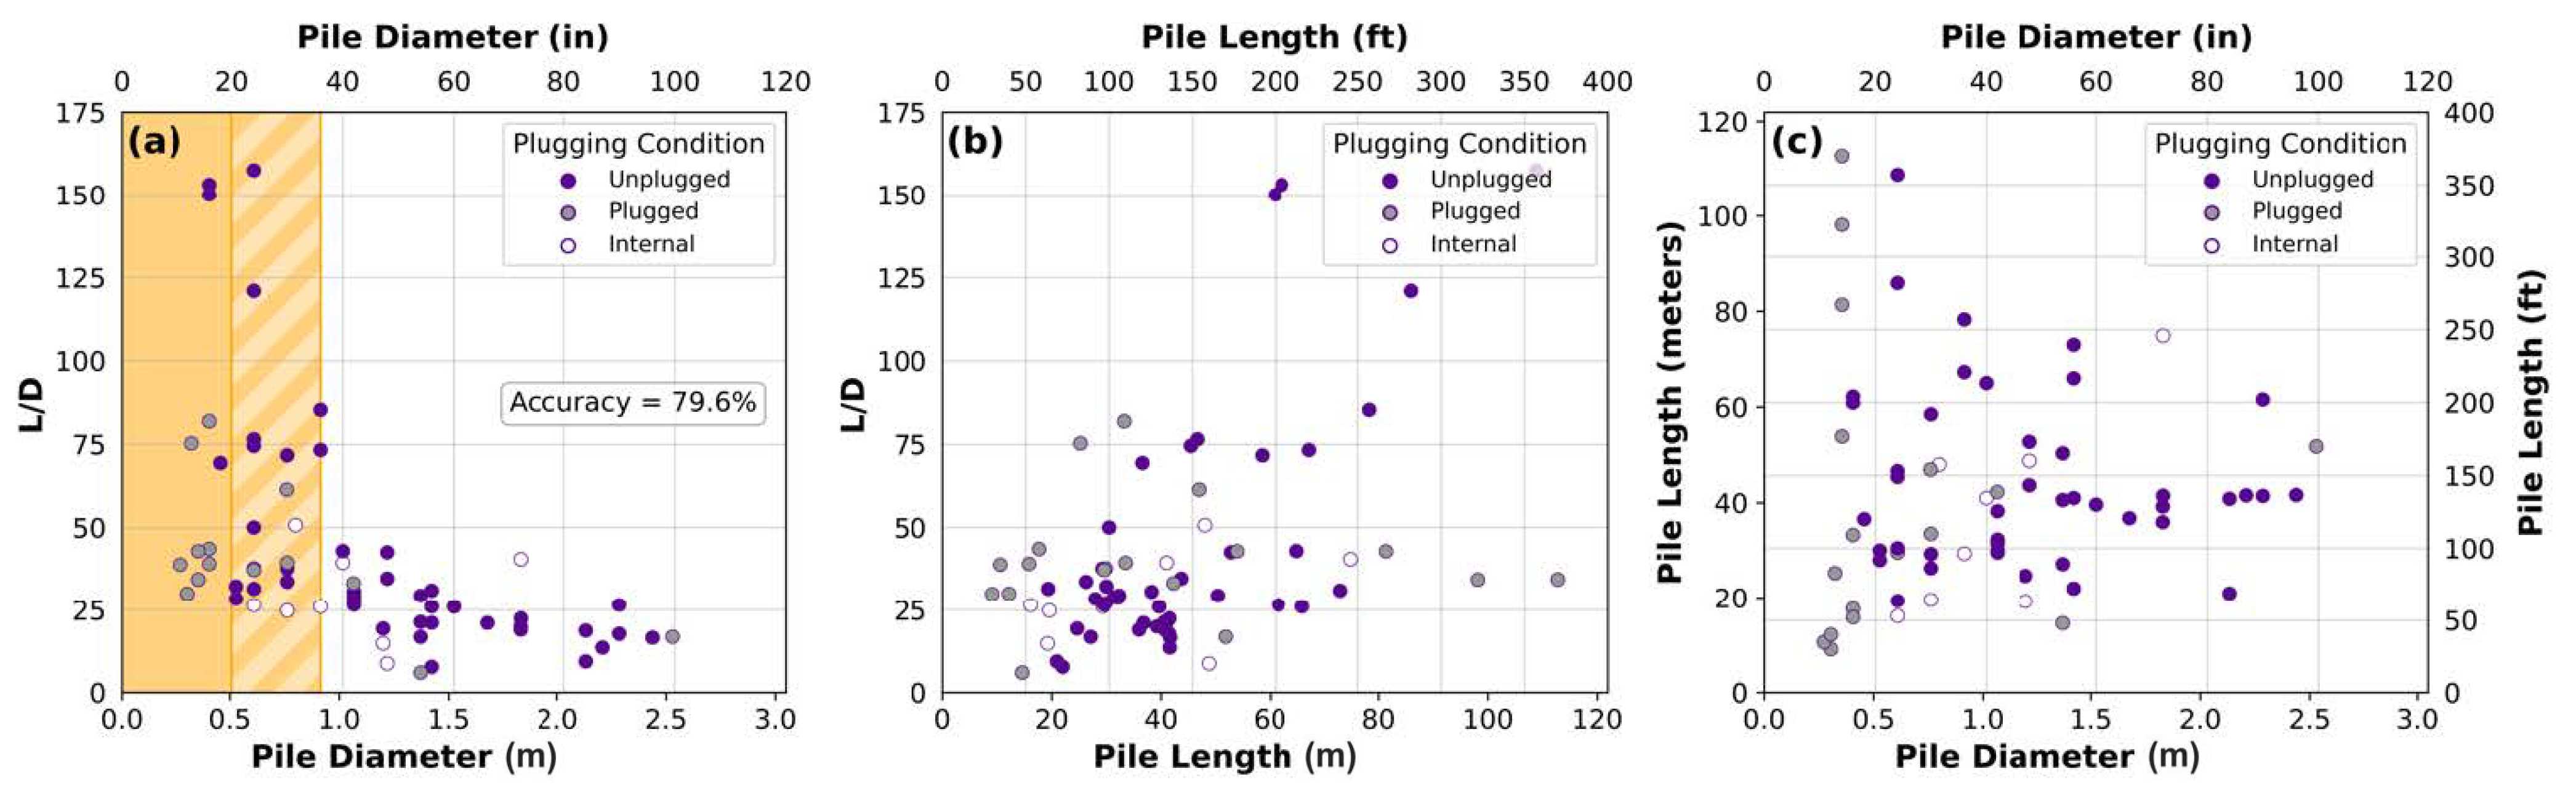
5.3. Relationship between Plugging Condition and the Pile Diameter, Length, and L/D Ratio
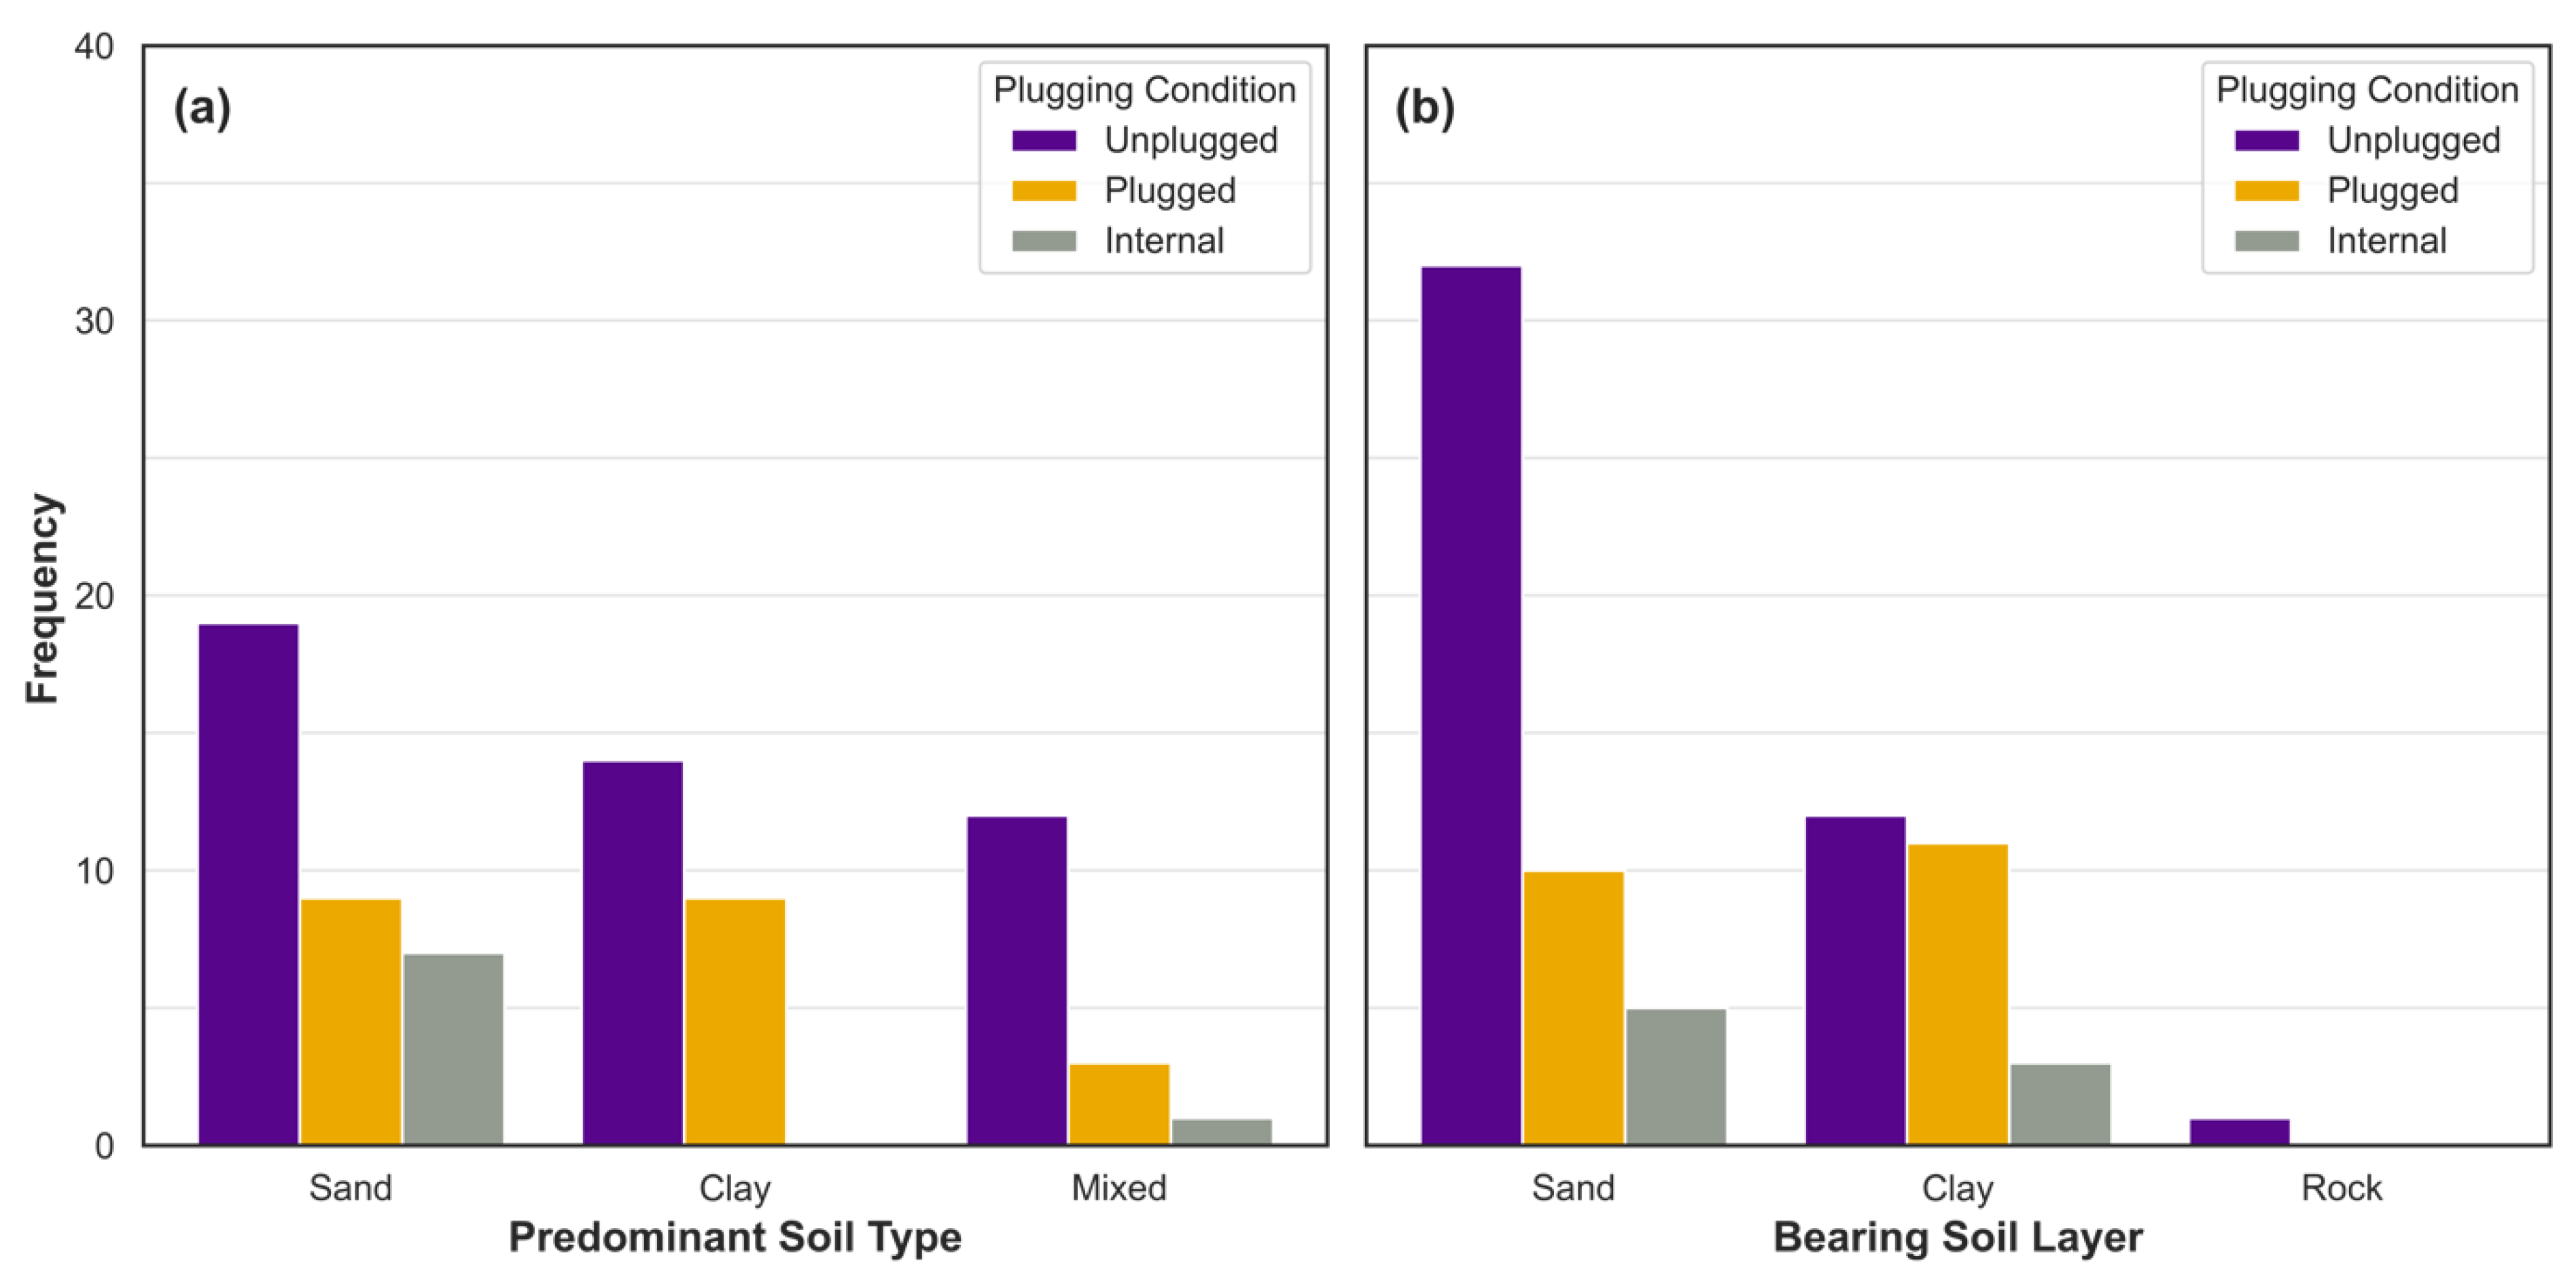
5.4. Relationship between Plugging Condition and Soil Information
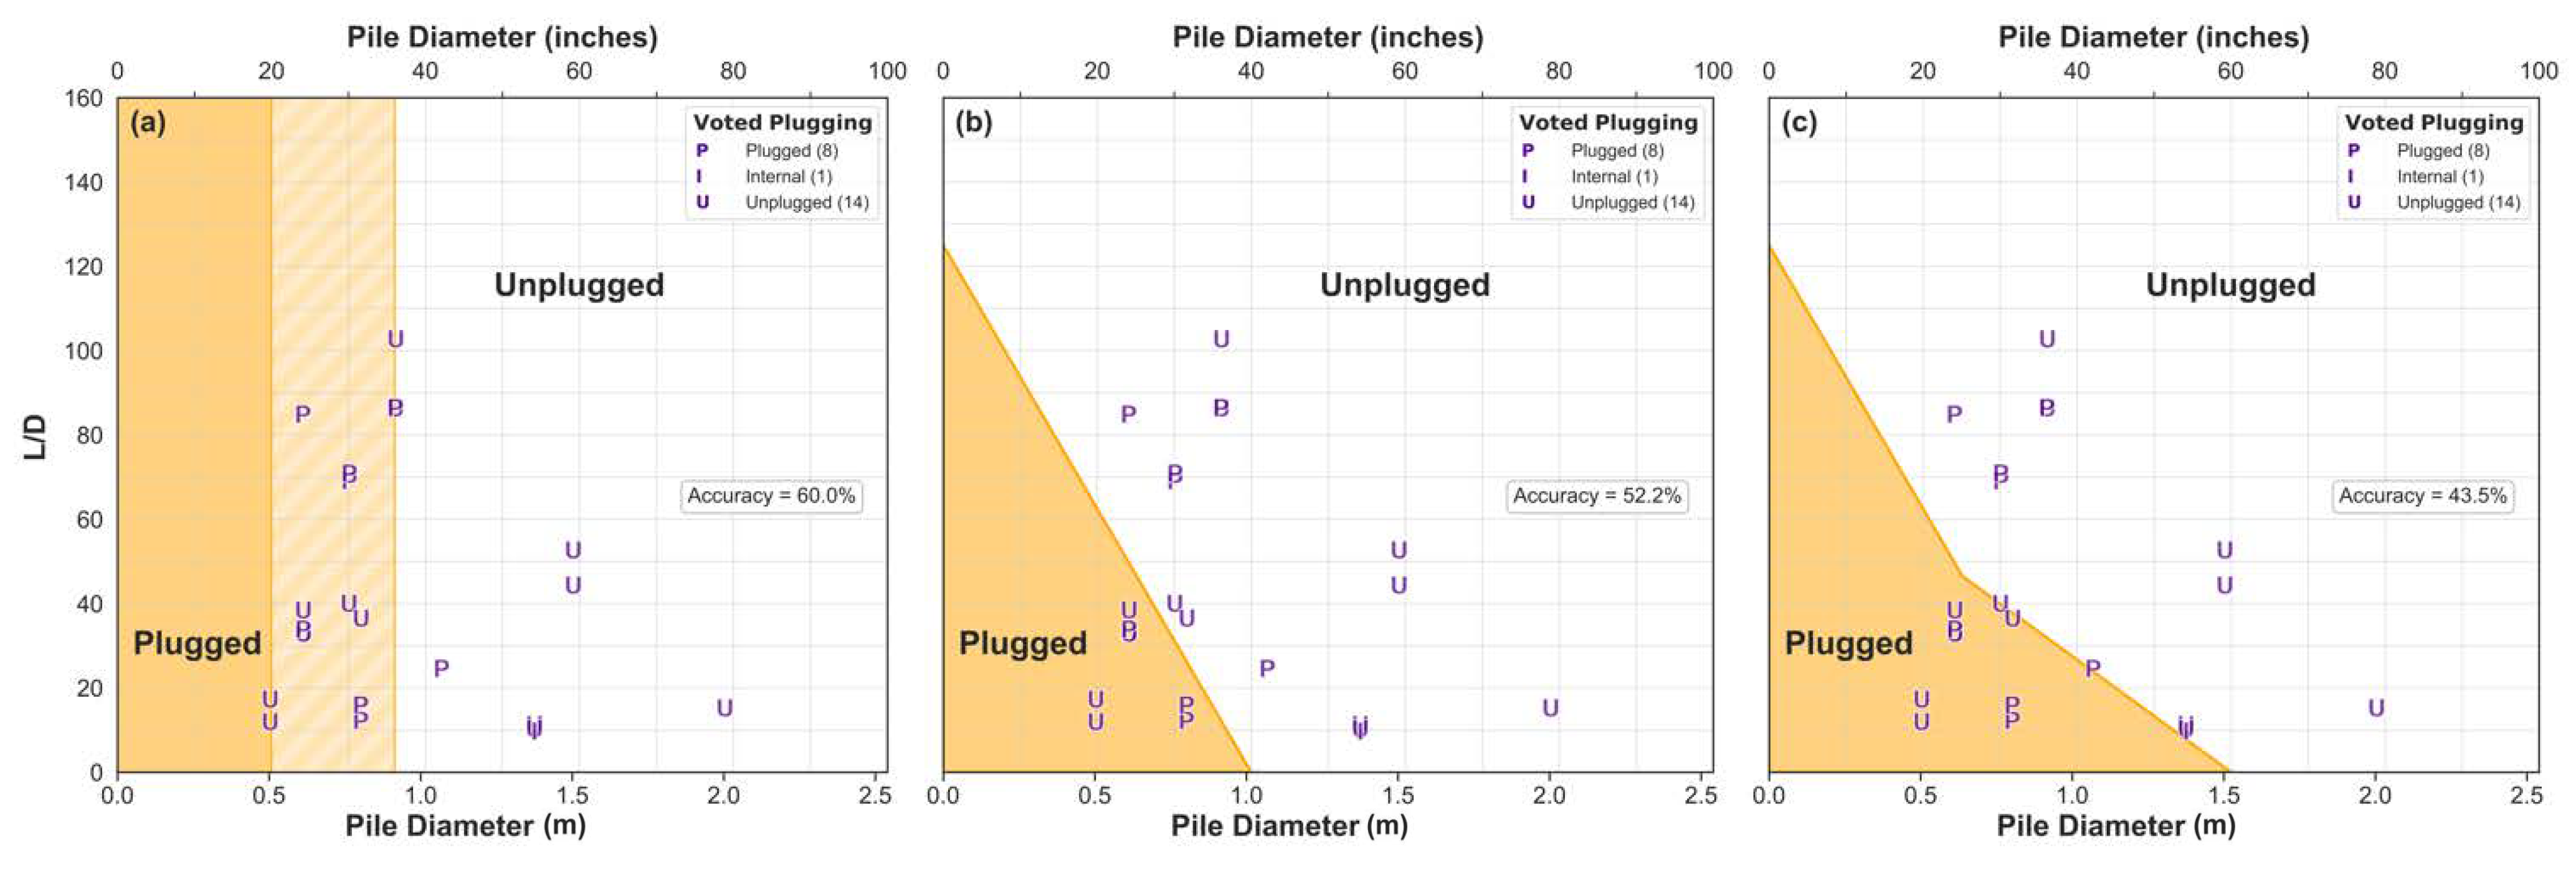
6. Proposed Interaction Diagram for Plugging
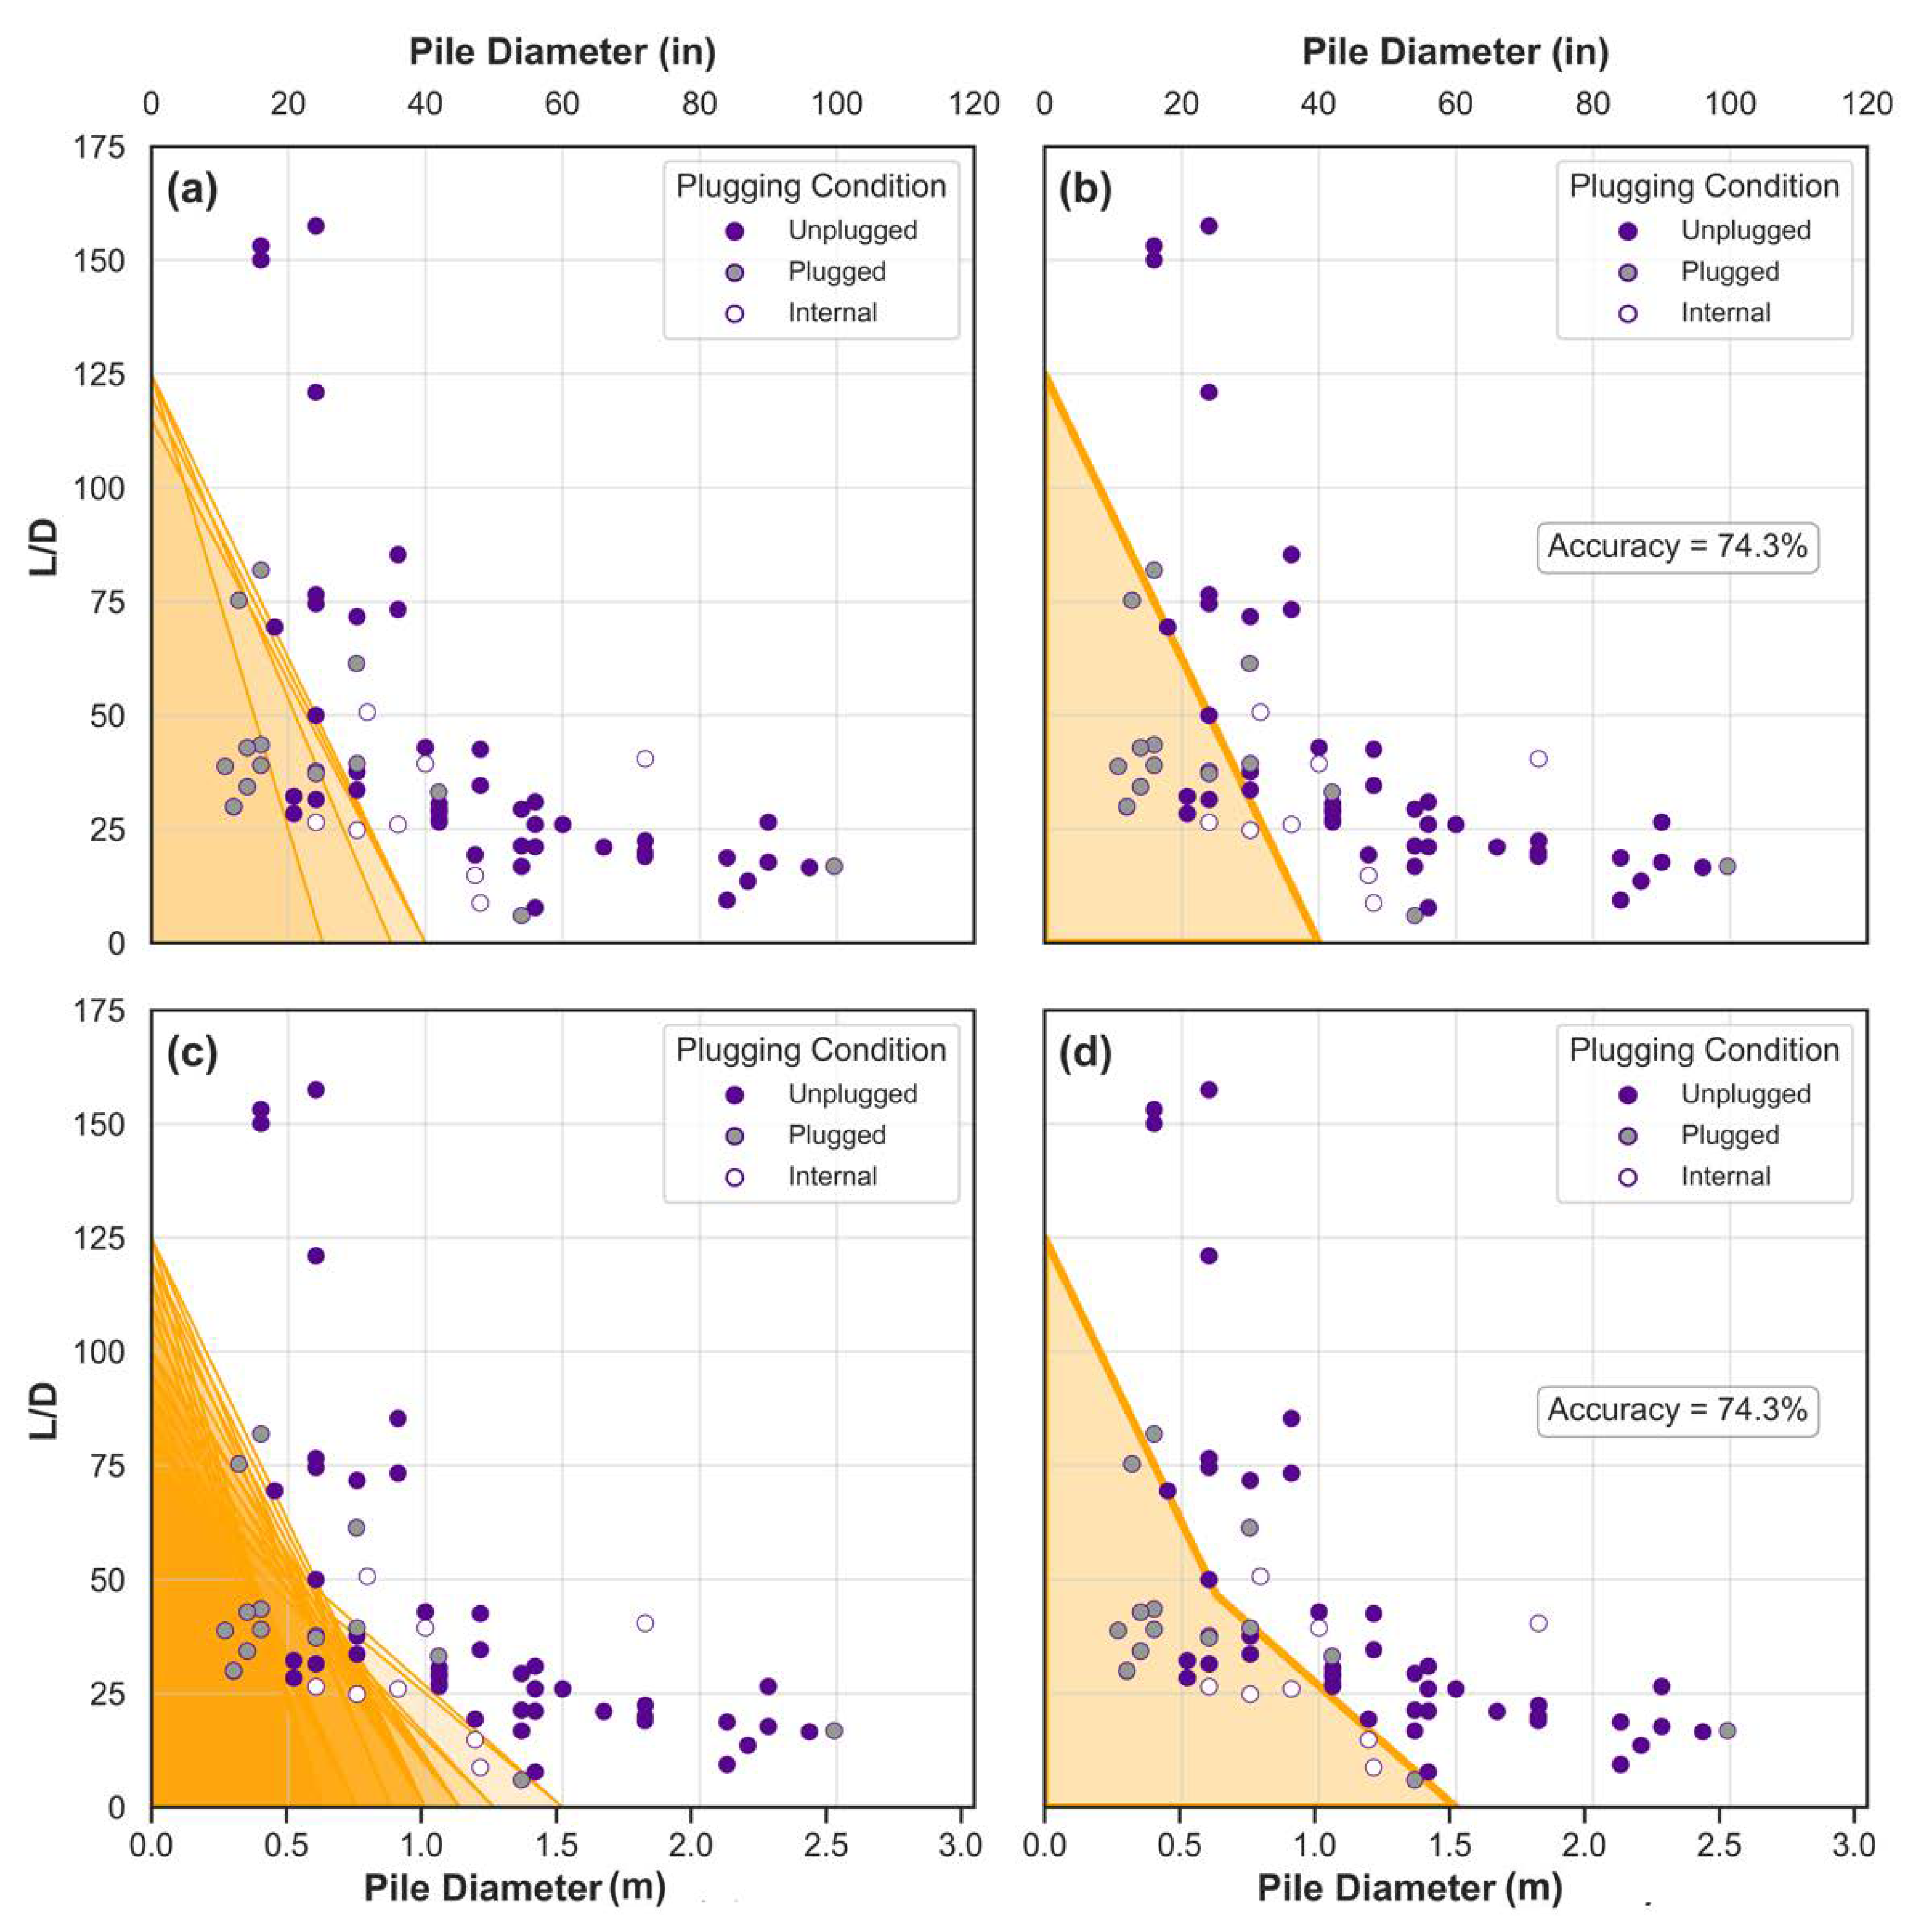
6.1. Development of Interaction Diagram
6.2. Diameter Criterion
6.3. Testing of the Diameter Criterion & Interaction Diagram
7. Validation of the Proposed Diameter Criterion

| # | Reference | Pile ID | Diameter m (in) | Length m (ft) | L/D | IFR (%) | Plugging Condition | |
|---|---|---|---|---|---|---|---|---|
| Actual | Forecasted | |||||||
| 1 | Jeong and Ko [23] | TP-2 | 0.7 (27.6) | 11.4 (37.4) | 16.3 | 60.0 | Unplugged | N/A |
| 2 | TP-3 | 0.9 (36) | 15.5 (50.9) | 17.0 | 60.0 | Unplugged | Unplugged | |
| 3 | Jardine et al. [54] | - | 0.8 (30) | 47 (154.2) | 61.7 | 89.0 | Unplugged | N/A |
| 4 | Kikuchi [57] | TP4 | 1.5 (58.8) | 73.5 (241.1) | 49.2 | 100.0 | Unplugged | Unplugged |
| 5 | TP5 | 1.5 (58.8) | 86 (282.2) | 57.6 | 100.0 | Unplugged | Unplugged | |
| 6 | De Nicola and Randolph [24] | LOD1 | 1.6 (62.4) | 15.7 (51.5) | 9.9 | 65.0 | Unplugged | Unplugged |
| 7 | MOD1 | 1.6 (62.4) | 15.2 (49.9) | 9.6 | 85.0 | Unplugged | Unplugged | |
| 8 | DOD2 | 1.6 (62.4) | 16.7 (54.8) | 10.5 | 115.0 | Unplugged | Unplugged | |
| 9 | Han et al. [58] | - | 0.6 (24) | 30.5 (100) | 50.0 | 70.0 | Unplugged | N/A |
| 10 | Liu et al. [59] | P1 | 0.5 (19.2) | 22 (72.2) | 45.1 | 0.0 | Plugged | Plugged |
| 11 | P2 | 0.5 (19.2) | 22 (72.2) | 45.1 | 0.0 | Plugged | Plugged | |
| 12 | P3 | 0.5 (19.2) | 22 (72.2) | 45.1 | 0.0 | Plugged | Plugged | |
| 13 | Olson and Shantz [29] | Bent E31R | 0.6 (24) | 13.3 (43.6) | 21.8 | 83.0 | Unplugged | N/A |
| 14 | Tveldt et al. [60] | 16 | 0.8 (32.0) | 11 (36.1) | 13.5 | 88.0 | Unplugged | N/A |
| 15 | 25 | 0.8 (32.0) | 16 (52.5) | 19.7 | 88.0 | Unplugged | N/A | |
| 16 | 25 | 0.8 (32.0) | 25 (82.0) | 30.8 | 88.0 | Unplugged | N/A | |
| 17 | Jardine and Standing [61] | C1 | 0.5 (18.0) | 10 (32.8) | 21.9 | 78.0 | Unplugged | Plugged |
| 18 | Williams et al. [62] | P | 1.2 (48.0) | 26 (85.3) | 21.3 | 95.0 | Unplugged | Unplugged |
| 19 | Yang et al. [63] | K24-1 | 0.6 (24) | 33 (108.3) | 54.2 | 74.0 | Unplugged | N/A |
| 20 | K24-2 | 0.6 (24) | 39.8 (130.6) | 65.3 | 74.0 | Unplugged | N/A | |
| 21 | K24-3 | 0.5 (19.2) | 39.8 (130.6) | 81.6 | 73.0 | Unplugged | Plugged | |
| 22 | K34-1 | 0.6 (24) | 29.3 (96.1) | 48.1 | 82.0 | Unplugged | N/A | |
| 23 | Mayne [64] | AL 1 | 0.3 (13.2) | 15.2 (49.9) | 45.4 | 71.0 | Unplugged | Plugged |
| 24 | AL 2 | 0.3 (13.2) | 42.7 (140.1) | 127.4 | 71.0 | Unplugged | Plugged | |
8. Practical Significance of Results
9. Limitations
10. Conclusions
Author Contributions
Funding
Institutional Review Board Statement
Informed Consent Statement
Data Availability Statement
Acknowledgments
Conflicts of Interest
Appendix A. Open-Ended Pipe Piles Adopted into This Study from the FHWA DFLTD v.2 Database
| ID | Project ID | Project | Material | Pile ID | Load Test ID | OD (in) | ID (in) | L (ft) | CPT Data | Soil Profile ID | Major Soil Type | Ref. |
| N-1 | 234 | Salinas River Bridge, USA | S | 1 | 1 | 60 | 59 | 130 | No | B-5 | Sand | [26] |
| N-2 | 843 | 108 GRL Piles-3rd Lake Wash. BR, WA, USA | S | 1 | 1 | 48 | 46 | 160 | No | GRL Piles #108 | Sand | |
| N-3 | 1001 | Port Mann Bridge, Canada | S | 5 | 1 | 72 | 70 | 246 | No | DFSL | Mixed | [65] |
| N-4 | 1002 | Red Sea Coast, Saudi Arabia | S | 1 | 1 | 56 | 54 | 240 | No | Boring-A | Sand | [66] |
| N-5 | 2 | 1 | 56 | 54 | 217 | No | ||||||
| N-6 | 4 | 1 | 56 | 54 | 135 | No | Boring-B | Sand | ||||
| N-7 | 5 | 1 | 56 | 54 | 72 | No | ||||||
| N-8 | 1003 | Louisiana Highway 1 Improvements Phase 1B, USA | S | 1 | 1 | 30 | 29 | 195 | Yes | 1 | Clay | [67] |
| N-9 | 1004 | Tokyo Port Bay Bridge, Japan | S | 1 | 1 | 59 | 57 | 261 | Yes | Generalized | Mixed | [57] |
| N-10 | 2 | 1 | 59 | 57 | 302 | Yes | ||||||
| N-11 | 1005 | Salinas River Bridge, USA | S | 1 | 1 | 72 | 71 | 118 | No | UTB-44 | Mixed | [68] |
| N-12 | 1006 | I-880 Port of Oakland Connector Viaduct, USA | S | 1 | 1 | 42 | 41 | 88 | Yes | 1 | Clay | [26] |
| N-13 | 1007 | I-880 Oakland Bridge Replacement, USA | S | 1 | 1 | 42 | 41 | 106 | No | Generalized Boring | Clay | |
| N-14 | 2 | 1 | 42 | 41 | 106 | No | UTB-12B | Clay | ||||
| N-15 | 1008 | Santa Clara River Bridge, USA | S | 1 | 1 | 84 | 81 | 69 | No | 00-2 | Mixed | [68] |
| N-16 | 2 | 1 | 84 | 81 | 134 | No | 00-2 | Mixed | ||||
| N-17 | 1009 | Noto Peninsula New Highway Route Bridges, Japan | S | 1 | 1 | 31 | 31 | 36 | Yes | DFSL | Clay | [69] |
| N-18 | 2 | 1 | 31 | 31 | 36 | Yes | ||||||
| N-19 | 1010 | Pentre Site, Great Britain | S | 1 | 1 | 30 | 28 | 192 | No | 101 | Clay | [70] |
| N-20 | 1011 | Woodrow Wilson Bridge over Potomac River, VA and MD, USA | S | 1 | 1 | 54 | 52 | 165 | No | ID-63 | Mixed | [68] |
| N-21 | 2 | 1 | 42 | 40 | 126 | No | ID-64 | Mixed | ||||
| N-22 | 3 | 1 | 36 | 34 | 96 | No | ID-65 | Sand | ||||
| N-23 | 1012 | Jin Mao Building, China | S | 1 | 1 | 36 | 34 | 262 | Partial | Generalized Boring | Mixed | [71] |
| N-24 | 2 | 1 | 36 | 34 | 262 | Partial | ||||||
| N-25 | 1013 | Hokkaido, Japan | S | 1 | 1 | 40 | 38 | 135 | No | Generalized Boring | Sand | [26] |
| N-26 | 1014 | Chiba, Japan | S | 1 | 1 | 31 | 30 | 157 | No | Generalized Boring | Sand | [72] |
| N-27 | 1019 | EURIPIDES Joint Industry Project-Offshore test piles, Netherlands | S | 1 | 1 | 30 | 27 | 101 | Yes | CPT-36 | Sand | [26] |
| N-28 | 3 | 1 | 30 | 27 | 154 | No | ||||||
| N-29 | 4 | 1 | 30 | 27 | 154 | No | ||||||
| N-30 | 4 | 2 | 30 | 27 | 154 | No | ||||||
| N-31 | 1020 | Sakonnet River Bridge (Route 138), USA | S | 1 | 1 | 72 | 69 | 136 | No | Generalized Boring | Sand | [73] |
| N-32 | 1021 | Annacis Throughway Bridge Project-Highway 91, Canada | S | 1 | 1 | 36 | 35 | 221 | No | Generalized CPT | Clay | [74] |
| N-33 | 2 | 1 | 36 | 35 | 257 | No | ||||||
| N-34 | 3 | 1 | 36 | 35 | 309 | Yes | ||||||
| N-35 | 1023 | Berenda Slough Bridge, USA | S | 1 | 1 | 42 | 41 | 106 | No | 98-5 | Sand | [68] |
| N-36 | 1024 | Gulf Intracoastal Waterway West Closure Complex Test Site 3 | S | 2 | 1 | 30 | 29 | 190 | Partial | ALGSGS-08-2U | Clay | [75] |
| N-37 | 1025 | I-880 5th Street Overhead Bridge, USA | S | 1 | 1 | 96 | 93 | 137 | No | Generalized Boring | Clay | [76] |
| N-38 | 1035 | Highway 32 Stony Creek Bridge (No. 11-0029), USA | S | 1 | 1 | 100 | 96 | 170 | No | 00-6 | Mixed | [77] |
| N-39 | 1055 | Feather River Bridge (Caltrans Bridge No. 18-0009), USA | S | 1 | 1 | 48 | 46 | 173 | No | 1 | Sand | [78] |
| N-40 | 1056 | Mad River Bridge (Caltrans Bridge No. 04-0025L), USA | S | 1 | 1 | 87 | 84 | 136 | No | 1 | Sand | [79] |
| N-41 | 1057 | Russian River Bridge, USA | S | 1 | 1 | 66 | 64 | 121 | No | 1 | Sand | [80,81] |
| N-42 | 1060 | S | 1 | 1 | 48 | 46 | 143 | No | 1 | Sand | ||
| N-43 | 1061 | Feather River Bridge, USA | S | 1 | 1 | 90 | 87 | 136 | No | 1 | Sand | [26] |
| N-44 | 1061 | S | 2 | 1 | 90 | 87 | 202 | No | ||||
| N-45 | 1062 | Santa Clara River Bridge, USA | S | 1 | 1 | 72 | 69 | 129 | No | 1 | Sand | [82] |
| N-46 | 1063 | Port of Oakland, USA | S | 1 | 1 | 42 | 41 | 98 | No | 1 | Mixed | [83] |
| N-47 | 2 | 1 | 42 | 41 | 103 | No | 2 | Clay | ||||
| N-48 | 3 | 1 | 42 | 41 | 97 | No | 3 | Mixed | ||||
| N-49 | 1068 | Port of Toamasina Offshore Jetty | S | 2 | 1 | 40 | 38 | 213 | No | NP-04 | Sand | [84] |
| N-50 | 1069 | Trans-Tokyo Bay Highway, Japan | S | 1 | 1 | 79 | 76 | 203 | Partial | DFSL | Sand | [85] |
| N-51 | 1070 | Legislative Route 795 section B-6 Philadelphia, Pennsylvania, USA | S | 1 | 1 | 30 | 29 | 96 | No | PLT-E | Mixed | [86] |
| N-52 | 2 | 1 | 30 | 29 | 64 | No | PLT-C | Sand | ||||
| N-53 | 3 | 1 | 30 | 29 | 86 | No | B-620 | Mixed | ||||
| N-54 | 1071 | Nippon Steel Blast Furnace Foundations, Japan | S | 2 | 1 | 47 | 46 | 81 | No | DFSL | Sand | [87] |
| N-55 | 3 | 1 | 47 | 46 | 63 | No | ||||||
| N-56 | 1072 | Tilbrook Grange Site, Great Britain | S | 1 | 1 | 30 | 27 | 110 | No | 201 | Clay | [70] |
| N-57 | 1102 | I-664 Bridge, USA | C | 1 | 1 | 54 | 44 | 48 | No | B-66 | Sand | [68] |
| N-58 | 7 | 1 | 54 | 44 | 133 | No | B-71 | Sand | ||||
| N-59 | 1103 | San Mateo-Hayward Bridge, USA | C | 1 | 1 | 42 | 28 | 139 | No | DFSL-1 | Clay | [68] |
| N-60 | 1104 | St. George Island Bridge Replacement. Pier 20 (Test Pile LT-1), USA | C | 1 | 4 | 54 | 38 | 80 | Partial | B-20 | Sand | [69] |
| N-61 | 1105 | US 13 Chesapeake Bay Bridge—Tunnel, USA | C | 6 | 1 | 54 | 42 | 96 | Partial | DFSL-6 | Mixed | [68] |
| N-62 | 1106 | Crossbay Blvd. Bridge Over North Channel, USA | C | 1 | 1 | 54 | 44 | 89 | No | DFSL | Sand | [88] |
| N-63 | 1116 | St. George Island Bridge Replacement. Pier 124 (Test Pile LT-5), USA | C | 1 | 2 | 54 | 38 | 80 | Partial | 1 | Sand | [68] |
| N-64 | PHC-2 | Wuhu Bridge, China | C | - | - | 31.5 | 21 | 96 | Yes | K27 | Sand | [82] |
| N-65 | 10 | Seismic Retrofit Program-Hwy 280, USA | S | 14 | 2 | 16 | 15 | 109 | No | B2 | Mixed | [26] |
| N-66 | 10 | S | 28 | 1 | 13 | 12 | 83 | No | B8 | Mixed | ||
| N-67 | 10 | S | 29 | 2 | 16 | 15 | 204 | No | B2 | Mixed | ||
| N-68 | 10 | S | 30 | 1 | 16 | 15 | 200 | No | B2 | Mixed | ||
| N-69 | 124 | Ventura Underpass Br # 52-178, USA | S | 69 | 1 | 12 | 11.7 | 30 | No | B-1A | Sand | [26] |
| N-70 | 129 | Nyeland Acres O.C Sta103+00, USA | S | 24 | 1 | 11 | 10.5 | 35 | No | B-2 | Sand | [26] |
| N-71 | 228 | Bayshore Fwy Viaduct Site C, USA | S | 1 | 1 | 16 | 15 | 58 | No | B-5 | Sand | [26] |
| N-72 | 228 | S | 2 | 1 | 16 | 15 | 52 | No | B-5 | Sand | ||
| N-73 | 229 | Bayshore Fwy Viaduct Site B, USA | S | 2 | 1 | 24 | 23 | 64 | No | B-4 | Clay | [26] |
| N-74 | 230 | Bayshore Fwy Viaduct Site D, USA | S | 2 | 1 | 24 | 23 | 53 | No | 95-2 | Sand | [26] |
| N-75 | 231 | Bayshore Fwy Viaduct Site E, USA | S | 1 | 1 | 24 | 23 | 98 | No | 95-3 | Clay | [26] |
| N-76 | 231 | S | 2 | 1 | 24 | 23 | 97 | No | 95-3 | Clay | ||
| N-77 | 235 | Bayshore Fwy Viaduct Site F, USA | S | 1 | 2 | 24 | 23 | 73 | Yes | CPT-1 | Mixed | [26] |
| N-78 | 235 | S | 2 | 1 | 24 | 23 | 72 | Yes | CPT-1 | Mixed | ||
| N-79 | 707 | ABEF Research on Foundation # 84, Great Britain | C | 7 | 2 | 20 | 13 | 30 | Yes | CPT1 | Sand | [26] |
| N-80 | 707 | C | 8 | 2 | 20 | 13 | 25 | Yes | CPT1 | Sand | ||
| N-81 | 788 | GRL Piles-LTV Cont. Caster, Ohio, USA | S | 2 | 1 | 18 | 17 | 120 | No | GRL 42 | Mixed | [26] |
| N-82 | 789 | GRL Piles-ODOT State Rte 22, Ohio, USA | S | 1 | 1 | 12 | 11.6 | 40 | No | GRL 44 | Sand | [26] |
| N-83 | 1024 | Gulf Intracoastal Waterway West Closure Complex Test Site 3, USA | S | 1 | 1 | 24 | 23 | 190 | Yes | ALGSGS-08-10U | Clay | [74] |
Appendix B. Open-Ended Steel Pipe Piles Adopted into This Study from the Olson’s Database
| ID | Olson Project ID | Project Location | OD (in) | ID (in) | L (ft) | CPT Data | Major Soil Type | Original Source |
| N-84 | 43 | British Columbia, CAN | 24 | 23 | 100 | No | Clay | [89] |
| N-85 | 44 | 24 | 23 | 153 | No | Clay | ||
| N-86 | 68 | Alsancak Harbor, Turkey | 20.8 | 18.2 | 98 | No | Clay | [90] |
| N-87 | 70 | 20.8 | 18.2 | 92 | No | Clay | ||
| N-88 | 487 | Empire, Louisiana | 14 | 11.4 | 177 | No | Clay | [91] |
| N-89 | 489 | 14 | 9.75 | 267 | No | Clay | ||
| N-90 | 491 | 14 | 9.75 | 322 | No | Clay | ||
| N-91 | 493 | 14 | 9.75 | 370 | No | Clay | ||
| N-92 | 494 | 14 | 9.75 | 370 | No | Clay | ||
| N-93 | 495 | Kontich, Belgium | 24 | 22 | 79 | Yes | Clay | [92] |
| N-94 | 497 | 24 | 22 | 68 | Yes | Clay | ||
| N-95 | 527 | British Columbia, CAN | 24 | 23 | 149 | No | Clay | [89] |
| N-96 | 868 | Eugene Island, USA | 24 | 18.75 | 357 | No | Clay | Unpublished Data, Source: Confidential |
| N-97 | 869 | 24 | 18.75 | 282 | No | Clay |
Appendix C. Calculated Capacities for the SPT Design Methods
| Load Test Information | Calculated Capacities (kips) | |||||||||||||
| Case ID | Nominal Resistance (kips) | Max. Applied Load (kips) | FHWA | USACE | REVISED LAMBDA | API | ||||||||
| U | P | I | U | P | I | U | P | I | U | P | I | |||
| N-1 | 2100 | 2100 | 6338 | 17,831 | 11,352 | 5390 | 13,240 | 7835 | 2717 | 7384 | 6696 | 3398 | 8065 | 6476 |
| N-2 | 1030 | 2000 | 599 | 5290 | 917 | 539 | 3472 | 711 | 376 | 1712 | 636 | 356 | 1692 | 617 |
| N-3 | 10,022 | 12,061 | 7937 | 11,594 | 8901 | 5037 | 6001 | 6001 | 5679 | 6643 | 6643 | 5272 | 6236 | 6236 |
| N-4 | 1328 | 1417 | 7855 | 21,809 | 12,204 | 6587 | 13,864 | 9612 | 3550 | 7598 | 7598 | 3835 | 7884 | 7348 |
| N-5 | 1296 | 1382 | 5547 | 16,590 | 9864 | 5076 | 12,332 | 7365 | 2527 | 6575 | 6246 | 3080 | 7129 | 5858 |
| N-6 | 1084 | 1458 | 2442 | 6054 | 3413 | 2839 | 5812 | 4149 | 1712 | 3332 | 3332 | 2033 | 3652 | 3652 |
| N-7 | 354 | 611 | 511 | 3098 | 891 | 533 | 2717 | 738 | 400 | 1169 | 703 | 355 | 1124 | 658 |
| N-11 | 1513 | 1513 | 2952 | 9788 | 4355 | 2845 | 12,625 | 3839 | 2196 | 7460 | 3492 | 2340 | 7604 | 3489 |
| N-13 | 875 | 875 | 1409 | 2313 | 1691 | 1003 | 1448 | 1207 | 1095 | 1536 | 1352 | 1162 | 1603 | 1419 |
| N-14 | 1209 | 1209 | 1422 | 2731 | 1697 | 1000 | 1866 | 1213 | 1094 | 1957 | 1352 | 1159 | 2021 | 1417 |
| N-15 | 1995 | 1995 | 3330 | 7016 | 5746 | 2639 | 9654 | 3574 | 2053 | 5120 | 3358 | 1898 | 4965 | 3203 |
| N-16 | 5680 | 8000 | 12,263 | 24,165 | 20,669 | 8596 | 28,799 | 11,698 | 5266 | 14,102 | 9690 | 5498 | 14,335 | 8915 |
| N-19 | 1349 | 1349 | 2206 | 2313 | 2313 | 1427 | 1534 | 1534 | 1932 | 2039 | 2039 | 2350 | 2457 | 2457 |
| N-20 | 2905 | 2925 | 6329 | 7655 | 7391 | 4365 | 5427 | 5427 | 3185 | 4246 | 4246 | 3840 | 4902 | 4902 |
| N-21 | 2899 | 2920 | 4319 | 6469 | 4610 | 2825 | 3510 | 3510 | 2047 | 3698 | 3435 | 2445 | 4096 | 3711 |
| N-22 | 1764 | 1764 | 1475 | 3278 | 2018 | 1214 | 1757 | 1730 | 949 | 1473 | 1473 | 1032 | 1556 | 1556 |
| N-25 | 3195 | 3552 | 2058 | 5923 | 3093 | 2044 | 3326 | 2950 | 1725 | 3323 | 3323 | 2116 | 3713 | 3546 |
| N-26 | 1666 | 1866 | 750 | 3164 | 1322 | 997 | 1573 | 1412 | 1120 | 2115 | 1996 | 1225 | 2220 | 1938 |
| N-28 | 3453 | 5193 | 3499 | 7335 | 4573 | 1651 | 2343 | 2287 | 1846 | 2847 | 2847 | 2037 | 3038 | 3038 |
| N-29 | 3581 | 4766 | 3448 | 7238 | 4523 | 1637 | 2329 | 2267 | 1830 | 2831 | 2830 | 2020 | 3020 | 3020 |
| N-30 | 4517 | 6699 | 3448 | 7238 | 4523 | 1637 | 2329 | 2267 | 1830 | 2831 | 2830 | 2020 | 3020 | 3020 |
| N-31 | 2394 | 2990 | 9455 | 16,382 | 13,558 | 7302 | 18,690 | 10,425 | 3928 | 9189 | 8784 | 4268 | 9529 | 7995 |
| N-32 | 1651 | 1693 | 2241 | 3603 | 2475 | 2461 | 2695 | 2695 | 2894 | 3128 | 3128 | 3678 | 3912 | 3912 |
| N-33 | 1551 | 1610 | 2784 | 4146 | 3018 | 3140 | 3374 | 3374 | 3871 | 4105 | 4105 | 4881 | 5115 | 5115 |
| N-35 | 1618 | 1618 | 1479 | 5748 | 2493 | 2473 | 4490 | 3619 | 1620 | 3431 | 3431 | 1877 | 3688 | 3589 |
| N-37 | 5793 | 6742 | 8953 | 21,296 | 14,985 | 6835 | 30,587 | 9180 | 5037 | 16,831 | 8172 | 5044 | 16,837 | 7454 |
| N-38 | 7859 | 7859 | 10,556 | 13,548 | 12,141 | 6830 | 8415 | 8415 | 5692 | 7278 | 7278 | 6334 | 7919 | 7919 |
| N-39 | 2254 | 2500 | 8709 | 15,027 | 9124 | 5526 | 5942 | 5942 | 3991 | 4407 | 4407 | 4501 | 4917 | 4917 |
| N-40 | 5421 | 7191 | 9131 | 11,938 | 9644 | 5485 | 9107 | 7956 | 4392 | 14,013 | 8126 | 4486 | 14,107 | 7653 |
| N-41 | 3200 | 3200 | 8212 | 18,485 | 14,201 | 6284 | 17,614 | 8936 | 3246 | 8831 | 7111 | 3825 | 9410 | 6904 |
| N-42 | 3377 | 3975 | 6100 | 14,052 | 9199 | 3928 | 7929 | 5517 | 2631 | 5516 | 5516 | 3042 | 5927 | 5182 |
| N-43 | 3351 | 4090 | 13,950 | 21,159 | 17,606 | 11,028 | 26,022 | 15,796 | 5869 | 13,610 | 13,104 | 5811 | 13,552 | 10,867 |
| N-44 | 7725 | 8000 | 26,709 | 37,589 | 31,105 | 18,169 | 31,897 | 26,026 | 10,677 | 15,272 | 15,272 | 8992 | 13,587 | 13,587 |
| N-45 | 6565 | 8045 | 10,048 | 19,095 | 16,500 | 6524 | 19,725 | 9038 | 3821 | 10,313 | 7492 | 4139 | 10,631 | 7105 |
| N-46 | 834 | 845 | 1516 | 3040 | 2034 | 1127 | 2365 | 1454 | 1084 | 1947 | 1502 | 1155 | 2017 | 1572 |
| N-47 | 1037 | 1037 | 1262 | 2602 | 1854 | 1041 | 1676 | 1434 | 1019 | 1636 | 1623 | 1091 | 1709 | 1677 |
| N-48 | 1288 | 1288 | 1416 | 3022 | 1918 | 1068 | 2482 | 1438 | 1058 | 2186 | 1557 | 1164 | 2292 | 1652 |
| N-49 | 1988 | 2029 | 2966 | 7445 | 4288 | 2349 | 3927 | 3282 | 1949 | 3677 | 3664 | 2340 | 4069 | 3873 |
| N-51 | 1176 | 1436 | 1296 | 2517 | 1357 | 1363 | 1691 | 1691 | 1067 | 2213 | 1679 | 1351 | 2497 | 1913 |
| N-52 | 1499 | 1499 | 919 | 3069 | 1218 | 1017 | 2155 | 1366 | 737 | 1649 | 1223 | 851 | 1763 | 1329 |
| N-53 | 878 | 896 | 1378 | 2586 | 1439 | 1354 | 1717 | 1717 | 1046 | 2192 | 1689 | 1288 | 2434 | 1882 |
| N-54 | 1148 | 1239 | 1181 | 7360 | 1803 | 1308 | 4801 | 1865 | 833 | 2897 | 1589 | 1001 | 3066 | 1757 |
| N-55 | 1425 | 1456 | 742 | 4264 | 1127 | 702 | 2894 | 1017 | 555 | 1752 | 944 | 553 | 1750 | 942 |
| N-56 | 3619 | 3619 | 1722 | 2069 | 2069 | 3179 | 3526 | 3526 | 2263 | 2610 | 2610 | 2625 | 2972 | 2972 |
| N-57 | 1300 | 1300 | 1175 | 2635 | 1499 | 852 | 1997 | 951 | 489 | 1030 | 597 | 444 | 986 | 553 |
| N-58 | 1350 | 1350 | 5211 | 6950 | 6141 | 3087 | 4903 | 4229 | 1619 | 2724 | 2724 | 1888 | 2992 | 2992 |
| N-59 | 1545 | 1545 | 1950 | 2173 | 1989 | 1408 | 1447 | 1447 | 1285 | 1324 | 1324 | 1209 | 1248 | 1248 |
| N-62 | 1431 | 1560 | 2166 | 2987 | 2723 | 2449 | 3868 | 3151 | 1400 | 2270 | 2190 | 1409 | 2279 | 2199 |
| N-65 | 219 | 219 | 123 | 254 | 135 | 149 | 214 | 171 | 251 | 279 | 279 | 143 | 219 | 171 |
| N-66 | 341 | 398 | 115 | 304 | 155 | 117 | 138 | 138 | 166 | 229 | 229 | 182 | 245 | 245 |
| N-67 | 355 | 390 | 498 | 1935 | 577 | 499 | 575 | 575 | 1045 | 1167 | 1167 | 914 | 1037 | 1037 |
| N-68 | 489 | 550 | 470 | 1812 | 550 | 481 | 557 | 557 | 985 | 1107 | 1107 | 874 | 997 | 997 |
| N-69 | 88 | 180 | 19 | 116 | 34 | 62 | 110 | 92 | 54 | 84 | 84 | 54 | 84 | 84 |
| N-70 | 163 | 180 | 19 | 181 | 31 | 38 | 88 | 56 | 41 | 71 | 71 | 43 | 88 | 73 |
| N-71 | 876 | 933 | 161 | 911 | 232 | 238 | 440 | 333 | 228 | 346 | 346 | 250 | 475 | 369 |
| N-72 | 600 | 627 | 161 | 911 | 232 | 238 | 440 | 333 | 228 | 346 | 346 | 250 | 475 | 369 |
| N-73 | 484 | 487 | 608 | 2165 | 872 | 1015 | 1641 | 1289 | 775 | 1181 | 1181 | 821 | 1439 | 1225 |
| N-74 | 800 | 800 | 345 | 2223 | 532 | 562 | 1262 | 784 | 415 | 776 | 776 | 462 | 1019 | 823 |
| N-75 | 208 | 213 | 109 | 124 | 118 | 122 | 138 | 132 | 194 | 204 | 204 | 111 | 126 | 120 |
| N-76 | 180 | 180 | 104 | 119 | 112 | 117 | 132 | 125 | 189 | 197 | 197 | 105 | 120 | 113 |
| N-81 | 564 | 766 | 602 | 1163 | 712 | 591 | 737 | 694 | 529 | 672 | 672 | 648 | 963 | 782 |
| N-82 | 161 | 184 | 18 | 66 | 31 | 50 | 73 | 72 | 74 | 100 | 100 | 65 | 92 | 92 |
| N-84 | 440 | 440 | 540 | 540 | 540 | 462 | 462 | 462 | 537 | 537 | 537 | 508 | 508 | 508 |
| N-85 | 594 | 594 | 990 | 990 | 990 | 795 | 795 | 795 | 927 | 927 | 927 | 1070 | 1070 | 1070 |
| N-86 | 315 | 322 | 419 | 957 | 461 | 297 | 527 | 330 | 342 | 386 | 386 | 277 | 496 | 321 |
| N-87 | 180 | 211 | 195 | 218 | 218 | 190 | 213 | 213 | 225 | 248 | 248 | 161 | 183 | 183 |
| N-88 | 225 | 225 | 185 | 191 | 191 | 142 | 148 | 148 | 174 | 180 | 180 | 126 | 131 | 131 |
| N-89 | 439 | 439 | 272 | 277 | 277 | 147 | 152 | 152 | 228 | 233 | 233 | 164 | 169 | 169 |
| N-90 | 481 | 481 | 237 | 248 | 248 | 145 | 156 | 155 | 205 | 216 | 216 | 141 | 152 | 152 |
| N-91 | 537 | 537 | 237 | 246 | 246 | 146 | 154 | 154 | 206 | 214 | 214 | 141 | 150 | 150 |
| N-92 | 383 | 383 | 237 | 246 | 246 | 146 | 154 | 154 | 206 | 214 | 214 | 141 | 150 | 150 |
| N-95 | 353 | 353 | 504 | 2317 | 680 | 536 | 727 | 685 | 954 | 1346 | 1346 | 1149 | 1541 | 1507 |
| N-96 | 1697 | 1872 | 2604 | 2860 | 2652 | 1941 | 1989 | 1989 | 3578 | 3626 | 3626 | 3466 | 3514 | 3514 |
| N-97 | 1542 | 1676 | 2014 | 2270 | 2062 | 1390 | 1439 | 1439 | 2195 | 2243 | 2243 | 2365 | 2413 | 2413 |
Appendix D. Calculated Capacities for the CPT Design Methods
| Load Test Information | Calculated Capacities (kips) | |||||||||||||
| Case ID | Nominal Resistance (kips) | Max. Applied Load (kips) | NGI-04 | ICP-05 | FUGRO-04 | UWA-05 | ||||||||
| U | P | I | U | P | I | U | P | I | U | P | I | |||
| N-8 | 1350 | 1597 | 972 | 1050 | 1050 | 671 | 687 | 687 | 658 | 840 | 766 | 668 | 707 | 697 |
| N-9 | 5089 | 7194 | 6111 | 8667 | 8667 | 7452 | 9305 | 9305 | 7442 | 10,033 | 10,033 | 6306 | 11,783 | 8990 |
| N-10 | 6417 | 8093 | 7815 | 10,588 | 10,588 | 8791 | 9709 | 9709 | 6348 | 8541 | 8541 | 6701 | 9411 | 8050 |
| N-12 | 1245 | 1245 | 905 | 1089 | 1089 | 748 | 958 | 925 | 715 | 933 | 900 | 742 | 954 | 920 |
| N-17 | 1046 | 1057 | 229 | 307 | 307 | 187 | 299 | 264 | 187 | 299 | 264 | 187 | 299 | 264 |
| N-18 | 832 | 835 | 229 | 307 | 307 | 185 | 298 | 263 | 185 | 298 | 263 | 185 | 298 | 263 |
| N-23 | 2717 | 3698 | 2289 | 3247 | 3247 | 2768 | 2926 | 2926 | 1467 | 2138 | 2138 | 2224 | 2751 | 2581 |
| N-24 | 2952 | 4073 | 2287 | 3245 | 3245 | 2759 | 2918 | 2918 | 1443 | 2114 | 2114 | 2217 | 2744 | 2574 |
| N-27 | 1660 | 2653 | 1880 | 1722 | 1722 | 2157 | 2157 | 2157 | 2101 | 2426 | 2426 | 2126 | 2789 | 2655 |
| N-34 | 1477 | 1797 | 2974 | 3134 | 3134 | 6975 | 7348 | 7135 | 6770 | 7142 | 6929 | 6909 | 7281 | 7068 |
| N-36 | 1171 | 1215 | 1360 | 1436 | 1436 | 912 | 1012 | 989 | 912 | 1012 | 989 | 912 | 1012 | 989 |
| N-50 | 7324 | 7592 | 6349 | 8816 | 8816 | 7442 | 8974 | 8779 | 6656 | 9769 | 9574 | 6028 | 10,157 | 7886 |
| N-60 | 1953 | 2109 | 1855 | 1193 | 1193 | 2014 | 1668 | 1668 | 2219 | 2629 | 2594 | 2088 | 1429 | 1429 |
| N-61 | 746 | 932 | 897 | 679 | 679 | 1337 | 1343 | 1337 | 1289 | 1296 | 1071 | 1410 | 1417 | 1191 |
| N-63 | 2844 | 2762 | 1891 | 1526 | 1526 | 2036 | 2186 | 2124 | 2401 | 3241 | 3018 | 2131 | 1897 | 1897 |
| N-64 | 986 | 1214 | 956 | 898 | 898 | 1172 | 1172 | 1172 | 1277 | 1481 | 1481 | 1142 | 1009 | 1009 |
| N-77 | 900 | 900 | 517 | 698 | 698 | 593 | 673 | 673 | 478 | 775 | 772 | 605 | 805 | 776 |
| N-78 | 321 | 380 | 491 | 668 | 668 | 566 | 646 | 646 | 451 | 748 | 718 | 580 | 780 | 751 |
| N-79 | 680 | 719 | 610 | 365 | 365 | 669 | 669 | 669 | 686 | 690 | 690 | 719 | 631 | 631 |
| N-80 | 731 | 742 | 528 | 260 | 260 | 562 | 559 | 559 | 598 | 594 | 594 | 609 | 510 | 510 |
| N-83 | 687 | 811 | 893 | 964 | 964 | 623 | 650 | 649 | 592 | 682 | 672 | 617 | 655 | 650 |
| N-93 | 1096 | 1096 | 1175 | 1283 | 1283 | 1290 | 1347 | 1397 | 1290 | 1347 | 1397 | 1290 | 1347 | 1397 |
| N-94 | 767 | 767 | 835 | 905 | 905 | 932 | 987 | 1002 | 932 | 987 | 1002 | 932 | 987 | 1002 |
References
- Paikowsky, S. The Mechanism of Pile Plugging in Sand. In Proceedings of the All Days, OTC, Houston, TX, USA, 2–5 May 1990. [Google Scholar]
- Paik, K.; Salgado, R. Determination of Bearing Capacity of Open-Ended Piles in Sand. J. Geotech. Geoenvironmental Eng. 2003, 129, 46–57. [Google Scholar] [CrossRef]
- Raines, R.D.; Ugaz, O.G.; O’Neill, M.W. Driving Characteristics of Open-Toe Piles in Dense Sand. J. Geotech. Eng. 1992, 118, 72–88. [Google Scholar] [CrossRef]
- Iskander, M. Behavior of Pipe Piles in Sand: Plugging and Pore-Water Pressure Generation during Installation and Loading, Springer Series in Geomechanics and Geoengineering; Springer: Berlin/Heidelberg, Germany, 2011. [Google Scholar]
- Paik, K.; Lee, S. Behavior of soil plugs in open-ended model piles driven into sands. Mar. Georesour. Geotechnol. 1993, 11, 353–373. [Google Scholar] [CrossRef]
- Smith, I.M.; Chow, Y.K. Three-dimensional analysis of pile drivability. In Proceedings of the 2nd International Conference on Numerical Methods in Offshore Piling, Austin, TX, USA, 18–22 May 1982; pp. 1–19. [Google Scholar]
- Smith, I.M.; To, P.; Wilson, S.M. Plugging of pipe piles. In Proceedings of the 3rd International Conference on Numerical Method in Offshore Piling, Nantes, France, 21–22 May 1986; pp. 53–73. [Google Scholar]
- Paikowsky, S.G.; Whitman, R.V.; Baligh, M.M. A new look at the phenomenon of offshore pile plugging. Mar. Geotechnol. 1989, 8, 213–230. [Google Scholar] [CrossRef]
- Randolph, M.F.; Leong, E.C.; Houlsby, G.T. One-dimensional analysis of soil plugs in pipe piles. Géotechnique 1991, 41, 587–598. [Google Scholar] [CrossRef]
- Randolph, M.; May, M.; Leong, E.; Hyden, A.M.; Murff, J.D. Soil Plug Response in Open-Ended Pipe Piles. J. Geotech. Eng. 1992, 118, 743–759. [Google Scholar] [CrossRef]
- Choi, Y.; O’Neill, M.W. Soil Plugging and Relaxation in Pipe Pile during Earthquake Motion. J. Geotech. Geoenvironmental Eng. 1997, 123, 975–982. [Google Scholar] [CrossRef]
- Murff, J.; Raines, R.; Randolph, M. Soil Plug Behavior of Piles in Sand. In Proceedings of the Offshore Technology Conference, Houston, TX, USA, 2–5 May 1990. [Google Scholar]
- Miller, G.A.; Lutenegger, A.J. Influence of Pile Plugging on Skin Friction in Overconsolidated Clay. J. Geotech. Geoenvironmental Eng. 1997, 123, 525–533. [Google Scholar] [CrossRef]
- Henke, S.; Grabe, J. Numerical investigation of soil plugging inside open-ended piles with respect to the installation method. Acta Geotech. 2008, 3, 215–223. [Google Scholar] [CrossRef]
- Henke, S.; Grabe, J. Field measurements regarding the influence of the installation method on soil plugging in tubular piles. Acta Geotech. 2013, 8, 335–352. [Google Scholar] [CrossRef]
- Randolph, M.F. Science and empiricism in pile foundation design. Géotechnique 2003, 53, 847–875. [Google Scholar] [CrossRef]
- Brucy, F.; Meunier, J.; Nauroy, J.-F. Behavior of Pile Plug in Sandy Soils During and After Driving. In Proceedings of the Offshore Technology Conference, Houston, TX, USA, 6–9 May 1991. [Google Scholar]
- Focht, J.A.; McClelland, B. Analysis of Laterally Loaded Piles by Difference Equation Solution. Tex. Eng. 1955, 25, 7–9. [Google Scholar]
- Fattah, M.Y.; Al-Soudani, W.H. Bearing capacity of open-ended pipe piles with restricted soil plug. Ships Offshore Struct. 2015, 11, 1–16. [Google Scholar] [CrossRef]
- Paikowsky, S.G.; Whitman, R.V. The effects of plugging on pile performance and design. Can. Geotech. J. 1990, 27, 429–440. [Google Scholar] [CrossRef]
- Lehane, B.M.; Gavin, K.G. Discussion of “Determination of Bearing Capacity of Open-Ended Piles in Sand” by Kyuho Paik and Rodrigo Salgado. J. Geotech. Geoenvironmental Eng. 2004, 130, 656–658. [Google Scholar] [CrossRef]
- Yu, F.; Yang, J. Base Capacity of Open-Ended Steel Pipe Piles in Sand. J. Geotech. Geoenvironmental Eng. 2012, 138, 1116–1128. [Google Scholar] [CrossRef] [Green Version]
- Jeong, S.; Ko, J.; Won, J.; Lee, K. Bearing capacity analysis of open-ended piles considering the degree of soil plugging. Soils Found. 2015, 55, 1001–1014. [Google Scholar] [CrossRef] [Green Version]
- De Nicola, A.; Randolph, M.F. The plugging behaviour of driven and jacked piles in sand. Géotechnique 1997, 47, 841–856. [Google Scholar] [CrossRef]
- Lehane, B.; Randolph, M.F. Evaluation of a Minimum Base Resistance for Driven Pipe Piles in Siliceous Sand. J. Geotech. Geoenvironmental Eng. 2002, 128, 198–205. [Google Scholar] [CrossRef]
- Petek, K.; Mitchell, R.; Ellis, H. FHWA Deep Foundation Load Test Database Version 2.0 User Manual; Report No. FHWA-HRT-17-034; U.S. Department of Transportation Federal Highway Administration: McLean, VA, USA, 2016. [Google Scholar]
- Dennis, D.N.; Olson, R.E. Axial Capacity of Steel Pipe Piles in Clay. In Proceedings of the Conference on Geotechnical Practice on Offshore Engineering, Austin, TX, USA, 27–29 April 1983; pp. 370–388. [Google Scholar]
- Dennis, N.D.; Olson, R.E. April. Axial capacity of steel pipe piles in sand. In Proceedings of the Geotechnical Practice in Offshore Engineering, Austin, TX, USA, 27–29 April 1983; pp. 389–402. [Google Scholar]
- Olson, R.E.; Shantz, T.J. Axial Load Capacity of Piles in California in Cohesionless Soils. In Current Practices and Future Trends in Deep Foundations; American Society of Civil Engineers: Reston, VI, USA, 2004; pp. 1–15. [Google Scholar]
- Iskander, M.; Garlanger, J.E.; Hussein, M.H. From Soil Behavior Fundamentals to Innovations in Geotechnical Engineering. In Geo-Congress 2014 Technical Papers; American Society of Civil Engineers: Reston, VI, USA, 2014; pp. 209–220. [Google Scholar]
- Machairas, N.; Highley, G.A.; Iskander, M.G. Evaluation of FHWA Pile Design Method against the FHWA Deep Foundation Load Test Database Version 2.0. Transp. Res. Rec. J. Transp. Res. Board 2018, 2672, 268–277. [Google Scholar] [CrossRef]
- ASTM International. D18 Committee Test Methods for Deep Foundations under Static Axial Compressive Load; D1143; ASTM International: West Conshohocken, PA, USA, 2018. [Google Scholar]
- Naval Facilities Engineering Command. Design Manual 7.01 (DM-7.01) Soil Mechanics; NAVFAC: Alexandria, VA, USA, 1986. [Google Scholar]
- Peck, R.B.; Hanson, W.E.; Thornburn, T.H. Foundation Engineering, 2nd ed.; John Wiley and Sons: New York, NY, USA, 1974. [Google Scholar]
- Rizk, A.; Machairas, N.; Iskander, M. Evaluation of Several Design Methods for Calculating Axial Compression Capacity of Large Diameter Open-Ended Piles. In Proceedings of the IFCEE 2021, Dallas, TX, USA, 12–14 May 2021; pp. 98–107. [Google Scholar]
- Hannigan, P.J.; Rausche, F.; Likins, G.E.; Robinson, B.; Becker, M.; Berg, R.R. Design and Construction of Driven Pile Foundations–Volume I (No. FHWA-NHI-16-009); National Highway Institute (US): Washington, DC, USA, 2016. [Google Scholar]
- U.S. Army Corps of Engineers (USACE). Design of Pile Foundations; Engineer Manual 1110-2-2906; U.S. Army Corps of Engineers (USACE): Washington, DC, USA, 1991. [Google Scholar]
- Focht, J.A.; Vijayvergiya, V. A New Way to Predict Capacity of Piles in Clay. In Proceedings of the Offshore Technology Conference, Houston, TX, USA, 1–3 May 1972. [Google Scholar]
- Kraft, L.M., Jr.; Focht, A., Jr.; Amerasinghe, S.F. Friction Capacity of Piles Driven into Clay. J. Geotech. Eng. Div. 1981, 107, 1521–1541. [Google Scholar] [CrossRef]
- American Petroleum Institute. API Recommended Practice for Planning, Designing, and Constructing Fixed Offshore Platforms, Report RP-2A; American Petroleum Institute, Production Department: Washington, DC, USA, 1993. [Google Scholar]
- Reese, L.C.; Isenhower, W.M.; Wang, S. Analysis and Design of Shallow and Deep Foundations; Wiley: Hoboken, NJ, USA, 2005; Volume 10. [Google Scholar]
- Wang, S.T.; Arrellaga, J.A.; Vasquez, L. APILE v2019—Technical Manual: A Program for the Study of Driven Piles under Axial Loads; ENSOFT: Austin, TX, USA, 2019. [Google Scholar]
- Tomlinson, M.J. Foundation Design and Construction, 4th ed.; Pitman Advanced Publishing Program: Boston, MA, USA, 1980; p. 793. [Google Scholar]
- Nordlund, R.L. Bearing Capacity of Piles in Cohesionless Soils. J. Soil Mech. Found. Div. 1963, 89, 1–35. [Google Scholar] [CrossRef]
- Pelletier, J.; Murff, J.; Young, A. Historical Development and Assessment of the Current Api Design Methods For Axially Loaded Pipes. In Proceedings of the Offshore Technology Conference, Houston, TX, USA, 3–7 May 1993. [Google Scholar]
- Murff, J.D. Pile capacity in a softening soil. Int. J. Numer. Anal. Methods Géoméch. 1980, 4, 185–189. [Google Scholar] [CrossRef]
- Kodsy, A.; Machairas, N.; Iskander, M.G. Assessment of Several Interpreted Pile Capacity Criteria for Large-Diameter Open-Ended Piles. Geotech. Test. J. 2021, 44. [Google Scholar] [CrossRef]
- Kodsy, A.; Iskander, M.; Machairas, N. Assessment of Several Nominal Resistance Interpretation Criteria for Drilled Foundations. J. Geotech. Geoenvironmental Eng. 2022, 148, 04021181. [Google Scholar] [CrossRef]
- Rizk, A.; Kodsy, A.; Machairas, N.; Iskander, M. Efficacy of Design Methods for Predicting the Capacity of Large Diameter Open-Ended Piles. J. Geotech. Geoenviron. Eng. 2022. inPress. [Google Scholar]
- Ko, J.; Jeong, S. Plugging effect of open-ended piles in sandy soil. Can. Geotech. J. 2015, 52, 535–547. [Google Scholar] [CrossRef]
- Suits, L.D.; Sheahan, T.C.; Iskander, M. On the Design of Instrumented Double-Wall Model Piles Used to Investigate Plugging of Open-Ended Pipe Piles. Geotech. Test. J. 2011, 34, 147–154. [Google Scholar] [CrossRef]
- Aas, P.; Karlsrud, K.; Clausen, C. Bearing capacity of driven piles in sand, the NGI approach. In Proceedings of the Frontiers in Offshore Geotechnics, Perth, Australia, 19–21 September 2005. [Google Scholar]
- Aas, P.; Karlsrud, K.; Clausen, C. Bearing capacity of driven piles in clay, the NGI approach. In Proceedings of the Frontiers in Offshore Geotechnics, Perth, Australia, 19–21 September 2005; Volume 1, pp. 775–782. [Google Scholar]
- Jardine, R.; Chow, F.; Standing, J.; Overy, R. ICP Design Methods for Driven Piles in Sands and Clays; Thomas Telford Ltd.: London, UK, 2005. [Google Scholar]
- Kolk, H.J.; Baaijens, A.E.; Senders, M. Design criteria for pipe piles in silica sands. In Proceedings of the International Symposium on Frontiers in Offshore Geomechanics (ISFOG 2005), Perth, Australia, 19–21 September 2005. [Google Scholar]
- Schneider, J.; Lehane, B.; Xu, X. The UWA-05 method for prediction of axial capacity of driven piles in sand. In Proceedings of the International Symposium on Frontiers in Offshore Geomechanics (ISFOG 2005), Perth, Australia, 19–21 September 2005; pp. 683–689. [Google Scholar]
- Kikuchi, Y.; Mizutani, M.; Yamashita, H. Vertical bearing capacity of large diameter steel pipe piles. In Advances in Deep Foundations; CRC Press: Boca Raton, FL, USA, 2007; pp. 189–194. [Google Scholar]
- Han, F.; Ganju, E.; Prezzi, M.; Salgado, R.; Zaheer, M. Axial resistance of open-ended pipe pile driven in gravelly sand. Géotechnique 2020, 70, 138–152. [Google Scholar] [CrossRef]
- Liu, J.-W.; Zhang, Z.-M.; Yu, F.; Xie, Z.-Z. Case History of Installing Instrumented Jacked Open-Ended Piles. J. Geotech. Geoenvironmental Eng. 2012, 138, 810–820. [Google Scholar] [CrossRef]
- Tveldt, G.; Fredriksen, F. E18 Ny motorvegbru i Drammen. Prøvebelastning av peler. In Proceedings of the Conference on Rock Blasting and Geotechnics, Sandton, South Africa, 10–13 September 2003. [Google Scholar]
- Jardine, R.J.; Standing, J.R. Pile Load Testing Performed for HSE Cyclic Loading Study at Dunkirk, France. V. 1. Technical Report; Health and Safety Executive: Bootle, UK, July 2000. [Google Scholar]
- Williams, R.E.; Chow, F.C.; Jardine, R.J. Unexpected behaviour of large diameter tubular steel piles. In Proceedings of the International Conference on Foundation Failures, Singapore, 12–13 May 1997; pp. 363–378. [Google Scholar]
- Yang, Z.X.; Guo, W.B.; Zha, F.S.; Jardine, R.J.; Xu, C.J.; Cai, Y.Q. Field Behavior of Driven Prestressed High-Strength Concrete Piles in Sandy Soils. J. Geotech. Geoenvironmental Eng. 2015, 141, 04015020. [Google Scholar] [CrossRef] [Green Version]
- Mayne, P.W.; (Georgia Institute of Technology, Atlanta, GA USA) FHWA Deep Foundation Load Test Database (DFLTD). Personal communication, 2013.
- Petek, K.A.; Mitchell, R.A.; Buechel, G.J.; Goodyear, D. Full Scale Instrumented Pile Load Test for the Port Mann Bridge, Surrey, British Columbia, Canada. In Full-Scale Testing and Foundation Design; American Society of Civil Engineers: Reston, VI, USA, 2012; pp. 362–375. [Google Scholar]
- Gilchrist, J.M. Load Tests on Tubular Piles in Coralline Strata. J. Geotech. Eng. 1985, 111, 641–655. [Google Scholar] [CrossRef]
- Wilbur Smith Associates. Report on Pile Load Test PROGRAM (LA-1 Improvements); Final Report to Louisiana Department of Transportation; Louisiana Department of Transportation: Baton Rouge, LA, USA, 2004. [Google Scholar]
- McVay, M.C.; Badri, D.; Hu, Z.Y. Determination of Axial Pile Capacity of Prestressed Concrete Cylinder Piles; No. UF Proj 4910-4504-877-12; University of Florida: Tallahassee, FL, USA, 2004. [Google Scholar]
- Matsumoto, T.; Michi, Y.; Hirano, T. Performance of Axially Loaded Steel Pipe Piles Driven in Soft Rock. J. Geotech. Eng. 1995, 121, 305–315. [Google Scholar] [CrossRef]
- Cox, W.R.; Solomon, I.J.; Cameron, K. Instrumentation and calibration of two 762 mm diameter pipe piles for axial load tests in clays. In Large-Scale Pile Tests in Clay; Thomas Telford: Telford, UK, 1993; pp. 217–236. [Google Scholar]
- Pump, W.; Korista, S.; Scott, J. Installation and load tests of deep piles in Shanghai alluvium. In Proceedings of the 7th International Conference on Piling and Deep Foundations, Vienna, Austria, 15–17 June 1998; pp. 31–36. [Google Scholar]
- Kusakabe, O.; Mitsumoto, T.; Sandanbata, I.; Kosuge, S.; Nishimura, S. Predictions of bearing capacity and drivea-bility of piles. In Proceedings of the International Conference Soil Mechanics and Foundation Engineering, ISSMFE, Rio de Janeiro, Brazil, 13–18 October 1989; Volume 5, p. 2957. [Google Scholar]
- Bradshaw, A.S.; Haffke, S.; Baxter, C.D.P. Load Transfer Curves from a Large-Diameter Pipe Pile in Silty Soil. In Full-Scale Testing and Foundation Design; American Society of Civil Engineers: Reston, VI, USA, 2012; pp. 590–601. [Google Scholar]
- Robertson, P.K.; Campanella, R.G.; Brown, P.T.; Grof, I.; Hughes, J.M.O. Design of axially and laterally loaded piles using in situ tests: A case history. Can. Geotech. J. 1985, 22, 518–527. [Google Scholar] [CrossRef]
- Richard, L. Spiral Welded Pipe Piles for Structures in Southeastern Louisiana. Unpublished. Doctoral Dissertation, University of New Orleans, Louisiana, OR, USA, 2010. [Google Scholar]
- Caltrans. I-880 5th St. Overhead Bent 16, Br. No:133-01, CT-ID:133-01; California Department of Transportation: Sacramento, CA, USA, 2014. [Google Scholar]
- Liebich, B.A. High-Capacity Piles at the Stony Creek Bridge Project. Transp. Res. Rec. J. Transp. Res. Board 2009, 2116, 41–46. [Google Scholar] [CrossRef]
- Ta, J.L.; Liebich, B.A. Pile Dynamic Analysis and Pile Load Test Results: Test Pile at Pier 12, Feather River Bridge 18-0026R; Foundation Testing Branch, California Department of Transportation: Sacramento, CA, USA, 2011. [Google Scholar]
- Caltrans. Route 101 Hum Pier 2L, Br. No: 04-0025L, CT-ID:136-01; California Department of Transportation: Sacramento, CA, USA, 2009. [Google Scholar]
- Caltrans. Russian River Route 120 Abutment 11, Br. No: 10-0301, CT-ID: 138-01; California Department of Transpor-Tation: Sacramento, CA, USA, 2015. [Google Scholar]
- Caltrans. Russian River Route 222, Br. No:10-0301, CT-ID:137-01; California Department of Transportation: Sacramento, CA, USA, 2015. [Google Scholar]
- Mercea, C.; Awad, Y.M. Pile Field Acceptance Criteria, Pile Dynamic Analysis, and Pile Load Test Results: Test-Pile at Bent 3, Santa Clara River Bridge 53-2925; Foundation Testing Branch, California Department of Transportation: Sacramento, CA, USA, 2002. [Google Scholar]
- Caltrans. Port of Oakland conn. Via. No. 33-0612E Bents: 10NCI, 17NCI, 27NC.; Br. No.: 33-612; CT-IDs: 012-05/06, 012–03/04, 012-05/06; California Department of Transportation: Sacramento, CA, USA, 2002. [Google Scholar]
- Brzezinski, L.S.; Baba, H.U. Offshore Open End Steel Tubular Piles-A Case History. In Full-Scale Testing and Foundation Design; American Society of Civil Engineers: Reston, VI, USA, 2012; pp. 568–589. [Google Scholar]
- Shioi, Y.; Yoshida, O.; Meta, T.; Homma, M. Estimation of bearing capacity of steel pipe pile by static loading test and stress-wave theory (Trans-Tokyo Bay Highway). In Proceedings of the International Conference on the Application of Stress-Wave Theory to Piles, The Hague, The Netherlands, 21–24 September 1992; pp. 325–330. [Google Scholar]
- Greiner Engineering Sciences. Load Tests Report: L.R. 795 Section B-6; Commonwealth of Pennsylvania, Department of Transportation: Philadelphia, PA, USA, 1982. [Google Scholar]
- Ishihara, K.; Saito, A.; Shimmi, Y.; Miura, Y.; Tominaga, M. Blast Furnace Foundation in Japan. In Proceedings of the Ninth International Conference on Soil Mechanics and Foundation Engineering, Tokyo, Japan, 1977; pp. 157–236. Available online: https://www.issmge.org/uploads/publications/1/35/1981_04_0008.pdf (accessed on 1 March 2022).
- Load Testing of 14, in. Square and 54 in. dia. Cylindrical Prestressed Concrete Piles at Crossbay Blvd. over North Channel; Queens County. New York Department of Transportation (NYDOT): Albany, NY, USA, 1996. [Google Scholar]
- McCammon, N.R.; Golder, H.Q. Some Loading Tests on Long Pipe Piles. Géotechnique 1970, 20, 171–184. [Google Scholar] [CrossRef]
- Toğrol, E. Bearing capacity by load tests. Int. J. Rock Mech. Min. Sci. Géoméch. Abstr. 1975, 12, 101. [Google Scholar] [CrossRef]
- Cox., W.; Kraft, L.M.; Verner, E. Axial Load Tests on 14-inch Pipe Piles in Clay. In Proceedings of the Offshore Technology Conference, Houston, TX, USA, 30 April–30 May 1979; pp. 1147–1158. [Google Scholar]
- Heerema, E. Pile Driving And Static Load Tests On Piles In Stiff Clay. In Proceedings of the Offshore Technology Conference, Houston, TX, USA, 30 April–30 May 1979. [Google Scholar]


| Method | Average Qc/Qm | Std. Dev. Qc/Qm |
|---|---|---|
| FHWA | 1.54 | 1.01 |
| USACE | 1.28 | 0.82 |
| Revised Lambda | 1.15 | 0.53 |
| API | 1.2 | 0.62 |
| NGI-04 | 0.99 | 0.35 |
| ICP-05 | 1.18 | 0.84 |
| FUGRO-04 | 1.13 | 0.80 |
| UWA-05 | 1.15 | 0.82 |
Publisher’s Note: MDPI stays neutral with regard to jurisdictional claims in published maps and institutional affiliations. |
© 2022 by the authors. Licensee MDPI, Basel, Switzerland. This article is an open access article distributed under the terms and conditions of the Creative Commons Attribution (CC BY) license (https://creativecommons.org/licenses/by/4.0/).
Share and Cite
Kodsy, A.; Iskander, M. Insights into Plugging of Pipe Piles Based on Pile Dimensions. Appl. Sci. 2022, 12, 2711. https://doi.org/10.3390/app12052711
Kodsy A, Iskander M. Insights into Plugging of Pipe Piles Based on Pile Dimensions. Applied Sciences. 2022; 12(5):2711. https://doi.org/10.3390/app12052711
Chicago/Turabian StyleKodsy, Antonio, and Magued Iskander. 2022. "Insights into Plugging of Pipe Piles Based on Pile Dimensions" Applied Sciences 12, no. 5: 2711. https://doi.org/10.3390/app12052711
APA StyleKodsy, A., & Iskander, M. (2022). Insights into Plugging of Pipe Piles Based on Pile Dimensions. Applied Sciences, 12(5), 2711. https://doi.org/10.3390/app12052711