Abstract
The presence of CO2, sand, and water in oil and gas reservoirs causes erosion–corrosion leading to material degradation in pipelines and fluid handling equipment that results in increasing maintenance and repair costs and a decrease in production. While the weight loss caused by erosion–corrosion is known to depend on flow velocity, angle of impact, sand loading and size and target material properties, field operators often limit the flow rate based on a critical corrosion velocity to protect the equipment. This study investigates the effects of sand loading and flow velocity on weight loss associated with erosion–corrosion in a mild steel sample using a submerged impingement jet. The weight loss by erosion, corrosion and their interaction for a flow velocity range of 10 m/s to 20 m/s and sand loading range of 300 mg/L to 600 mg/L, in a seawater environment, are presented. The results showed that the weight loss by pure erosion and erosion–corrosion interaction increases linearly with jet velocity and sand loading, and that erosion is dominant in all cases except at low velocity and sand loading. The scanning electron microscope (SEM) images after impingement tests were analyzed. In addition, correlations for the velocity and sand loading were derived using the design of experiment method (DOE).
1. Introduction
Erosion–corrosion caused by the impingement of the corrosive slurries against metallic materials is one of the significant contributing factors to the degradation phenomenon in oil and gas industries. Erosion–corrosion is a form of tribo-corrosion which damages both the surface layers and base of the metallic materials [1]. The erosion–corrosion process involves pure erosion, loss of materials from the surface caused by the impact of solid particles, static corrosion, deterioration of materials caused by an electrochemical reaction under zero-flow conditions, and the erosion–corrosion interaction, referred to as synergy. Generally, the total weight loss due to erosion–corrosion () can be represented as shown in Equation (1). In Equation (1), is pure erosion, is static corrosion and is erosion–corrosion interaction (E–C interaction). The E–C interaction can be represented as the summation of erosion due to corrosion () and corrosion due to erosion () as shown in Equation (2).
Some researchers have shown that the erosion is more significant than other components in the erosion–corrosion process [2,3,4,5,6,7], while others have shown that the weight loss due to the synergism is higher than the sum of material removal obtained when pure erosion and static corrosion act separately [8,9,10,11,12,13,14,15]. There are several parameters that influence the erosion–corrosion process. Clark [16] listed the major factors that influence the erosion–corrosion process. The impingement system has been extensively used [17,18,19,20,21,22,23,24,25,26,27] to study the influence of the different parameters on erosion–corrosion. The erosion–corrosion resistance of carbon steel in CO2 containing environments has also been widely investigated [28,29,30,31]. This paper focuses on the impact of sand loading and velocity on the erosion–corrosion of mild steel by the impingement test in an aqueous slurry.
Elemuren et al. [8] investigated the impact of sand loading and flow velocity on erosion–corrosion of 1018 steel 90° elbows in a slurry containing silica sand and potash brine. Their study revealed that the mechanical effect of particles increased with increasing flow velocity and sand loading. Moreover, they observed that the contribution of the synergy decreased from 56% to 11% as the velocity increased from 2.5 m/s to 4 m/s. They concluded that the synergy is the dominant factor at lower velocity and erosion, becoming a dominant factor at the higher velocity. The erosion–corrosion investigation by Hu and Neville [32] on a pipeline steel (API X65) revealed that material damage was predominantly caused by the synergy as the resistance to corrosion decreases from surface property degradation caused by erosion. The investigation also revealed that the increases linearly with jet velocity for velocities ranging from 5 m/s to 20 m/s. Yang and YF. Cheng [4] investigated the effects of flow velocity, impact angle and sand concentration on erosion–corrosion of X65 steel. Their findings indicate that pure erosion and erosion enhanced by corrosion are the dominant factors and that the total weight loss decreased with the increasing impact angle. Experiments conducted by Burstein and Sasaki [15] on the erosion–corrosion of stainless steel showed that minimum material loss took place at low velocities at an impact angle of 90°, while severe material loss occurred at lower impact angles and high flow velocities. Experiments conducted by Meng et al. [33] on two stainless steels with different flow velocities, sand loadings and fluid temperatures showed that the highest correlation occurred between the flow velocity and sand loading. They also investigated the contribution of each parameter to using a full two-level factorial design method and found that the erosion–corrosion interaction had the greatest effect on .
Shehadeh et al. [34] measured the erosion–corrosion rate on carbon steel pipe elbows phenomena caused by seawater with a sand loading ranging from 0 to 9 g/L. Their experimental results clearly indicated that the erosion–corrosion rate varies linearly with the flow velocity and sand loading for both laminar and turbulent flows. They also proposed a linear equation that could help to predict the erosion–corrosion rate. Harvey et al. [35] developed a semi-empirical model for corrosion dominated synergy of non-passivating erosion–corrosion of carbon steel using a slurry pot. The aim of this study was to yield an expression for erosion-enhanced corrosion which reveals the oxide-free surface. The developed model also accommodates the enhanced corrosion due to surface deformation caused by erodent particles. A number of studies [36,37,38,39,40] have aimed to develop empirical and mechanistic models and equations for different environmental conditions which could help in material loss prediction or material selection. However, a model which can predict the weight loss due to pure erosion () and caused by impingement of aqueous slurries has yet to be developed.
The main thrust of this study is to propose an empirical regression model that relates the and with the flow velocity and sand loading along with the fundamental investigation of the erosion–corrosion of mild steel in salty slurry (containing silica sand) using a submerged impingement jet apparatus. The influence of sand loading and flow velocity on weight loss caused by erosion–corrosion, pure erosion, and erosion–corrosion interaction has been investigated. Although the empirical model was not developed under field conditions, it will provide the means for a better understanding of the effects of sand loading and velocity on the erosion–corrosion of mild steel. The pure erosion study was carried out by chemically inhibiting the corrosion by the removal of dissolved oxygen. The surface profile of the specimen after the test was analyzed using Scanning Electron Microscopy (SEM).
2. Materials and Methods
2.1. Sand Particles
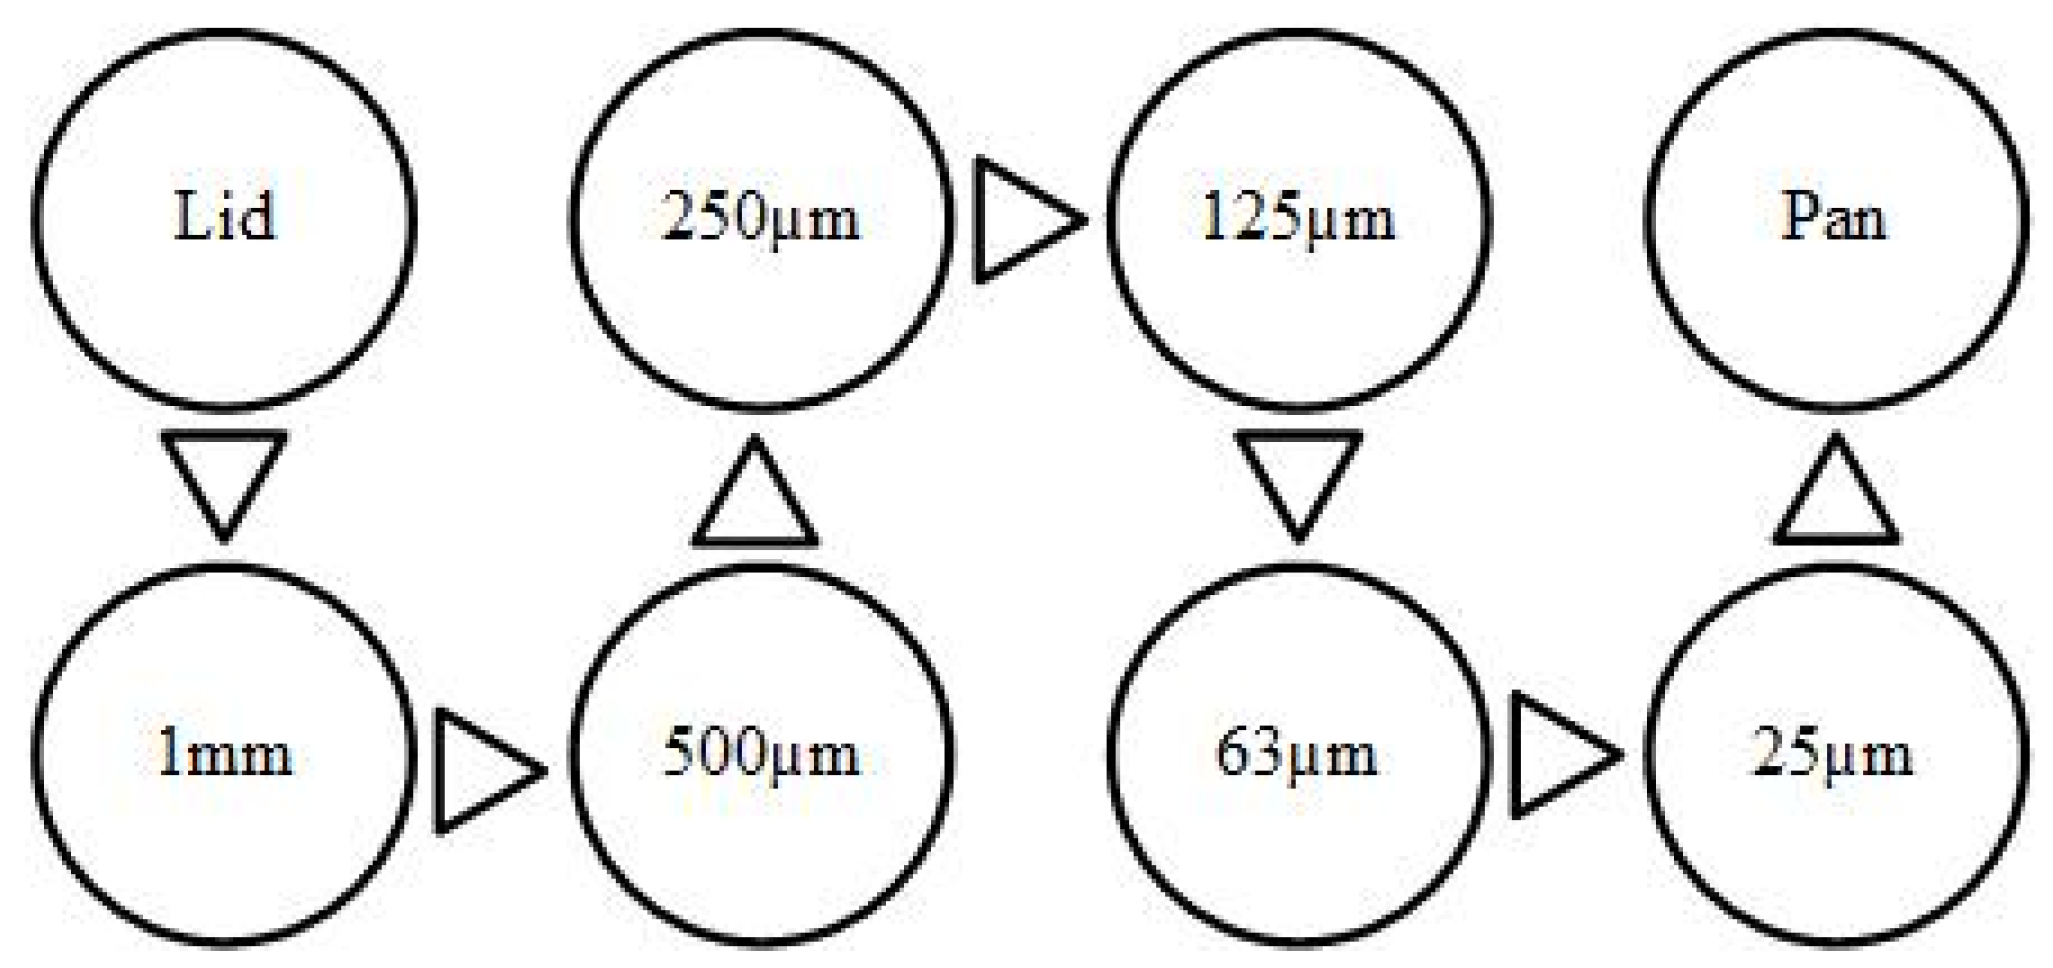
Sand used in this study was primarily composed of silicon and oxygen with small traces of magnesium, aluminum, and calcium, which was collected from the desert in UAE. A dry sand sieving method was used to prepare the sand of size 125–250 µm. The collected silica sand was washed, dried, and then sieved using a set of sieves with a gradually decreasing mesh, as shown in Figure 1, where only sand with the required mesh size was collected for the tests. The SEM image of silica sand particles used shows that the particles are fairly rounded with few sharp edges, as shown in Figure 2.
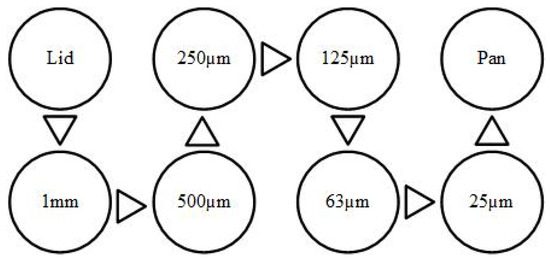
Figure 1.
Schematic arrangements of sieves for sand sieving.
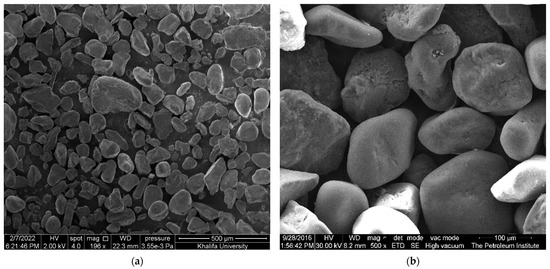
Figure 2.
SEM image of silica sand: (a) un-sieved and; (b) sieved (125–250 µm).
2.2. Sample
The specimens were parted from a mild steel rod of 25 mm diameter. The rod was turned to a diameter of 22.5 mm using a lathe machine and samples of 9 mm thickness were cut. The parted specimens were mounted in a mold containing epoxy resin using a ProntoPress-10 mounting machine leaving a working surface area of 4 cm2. In order to obtain a mirror-like finish (oxide polishing), the specimens were polished with a micro-cloth containing a suspension of oil-soluble aluminum oxide using a Tegrapol-21 polishing machine. The specimens were cleaned with soapy water, degreased with acetone, and rinsed with distilled water.
2.3. Solutions
A saltwater solution containing 3.5 wt% of NaCl was prepared for corrosion and erosion–corrosion tests. For the erosion test, tap water was used. The dissolved oxygen in tap water was removed by adding sodium sulfite (Na2SO3), which acts as a corrosion inhibitor. The concentration of dissolved oxygen was below 20 ppb and the pH of the water changed from 8.36 to 8.96 after adding the Na2SO3. Both concentration and pH were continuously monitored using Milwaukee D.O meter and Orion pH meter, respectively, throughout the impingement tests.
2.4. Experimental Setup and Test Conditions
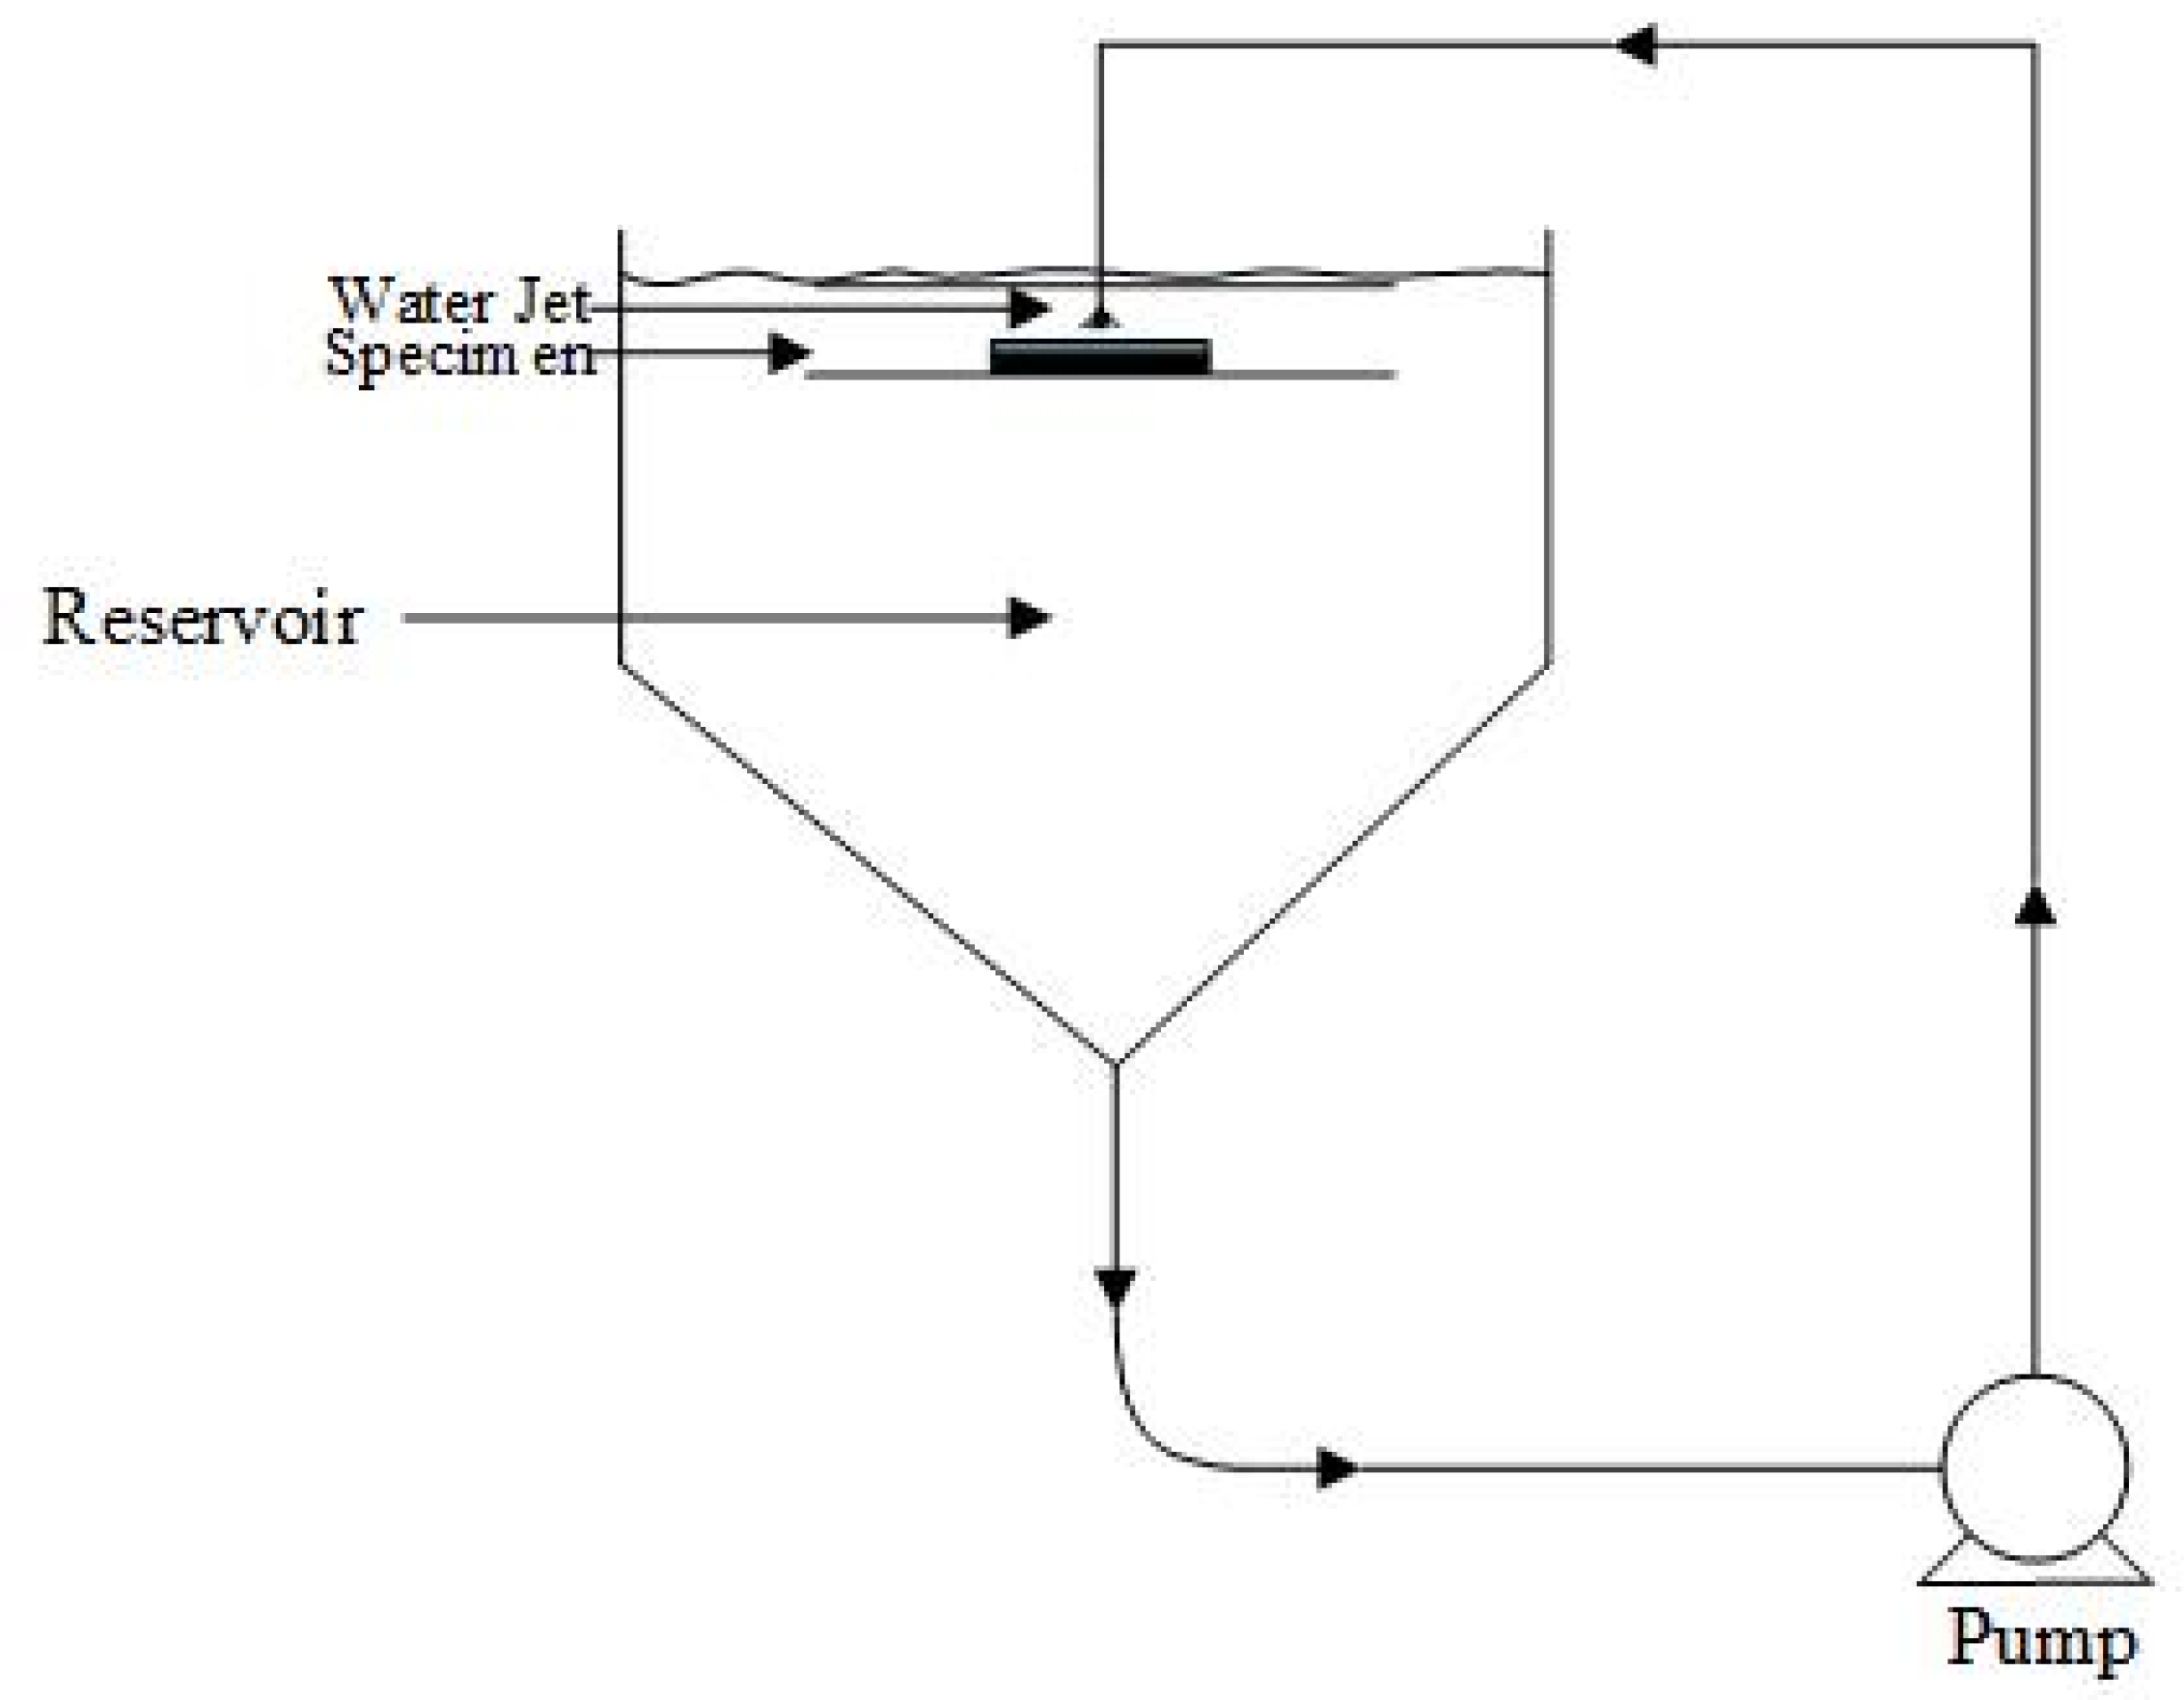
Erosion–corrosion tests were performed using a recirculating submerged impingement jet apparatus (SIJ), as shown in Figure 3. The recirculating system enables the sand to mix with the water which flows through the nozzle, with a diameter of 4 mm, and impinges on the specimen at an angle of 90°. This specific angle of attack was chosen to determine material degradation of elbows and tees. The specimen was positioned at a distance of 5 mm from the nozzle. A cooling coil was immersed in the reservoir which compensates for temperature increases due to pump friction. All the experiments were conducted at a temperature of 29–33 °C. The impingement tests were carried out at different slurry velocities (10, 13, 16, and 20 m/s) and different sand loadings (300, 400, 500 and 600 mg/L). The flow loop was rinsed with clean water after each experiment, and the slurry solution was refilled. Therefore, the interaction between silica particles and steel particles left in the solution was ignored as it is beyond scope of this study. The specimens were weighed before and after jet impingement tests using a digital balance (Precisa XB 220A) with a sensitivity of ±0.1 mg.
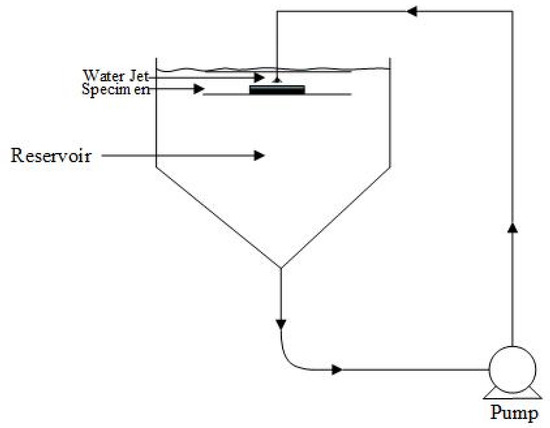
Figure 3.
Experimental setup (SIJ) used in this study.
The static corrosion tests were conducted using the linear polarization method. A potentiostat (Gamry Ref 600) consisting of three electrodes was used for the static corrosion measurements. The linear polarization resistance () was measured using a three-electrode potensiostat in which an Ag/AgCl electrode was used as the reference electrode, with platinum as the reference electrode and the specimen as the working/test electrode. The test was conducted at 0.25 mV/s scan-rate over a potential range from −20 mV to +20 mV. The corrosion current-density () was calculated from the polarization resistance using Equation (3), where and are Tafel constants.
The calculated was then converted to the weight loss using Faraday’s law. All the experiments were repeated three times to check the validity and repeatability.
3. Results and Discussions
3.1. Effect of Time on
The was studied to understand the effect of time on erosion–corrosion. The experiment was conducted at a jet velocity of 20 m/s and sand loading of 600 mg/L. It was found that the increased linearly with time for an impingement period of four hours as shown in Figure 4 and Table 1. This is consistent with the results obtained by Xu and Neville [32] for API-X65 under CO2 saturated conditions. It can be seen from Figure 4 that after a 4-h test, a large amount (71 mg) of material was removed from the surface. Therefore, the time for conducting the experiments to investigate the velocity and sand loading effects was set to 4 h.
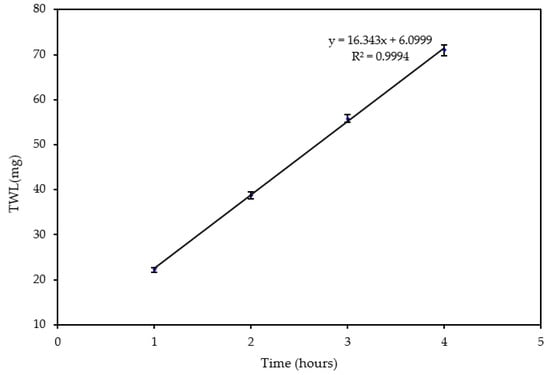
Figure 4.
Change of with respect to time at 20 m/s and 600 mg/L.

Table 1.
with respect to time at 20 m/s and 600 mg/L.
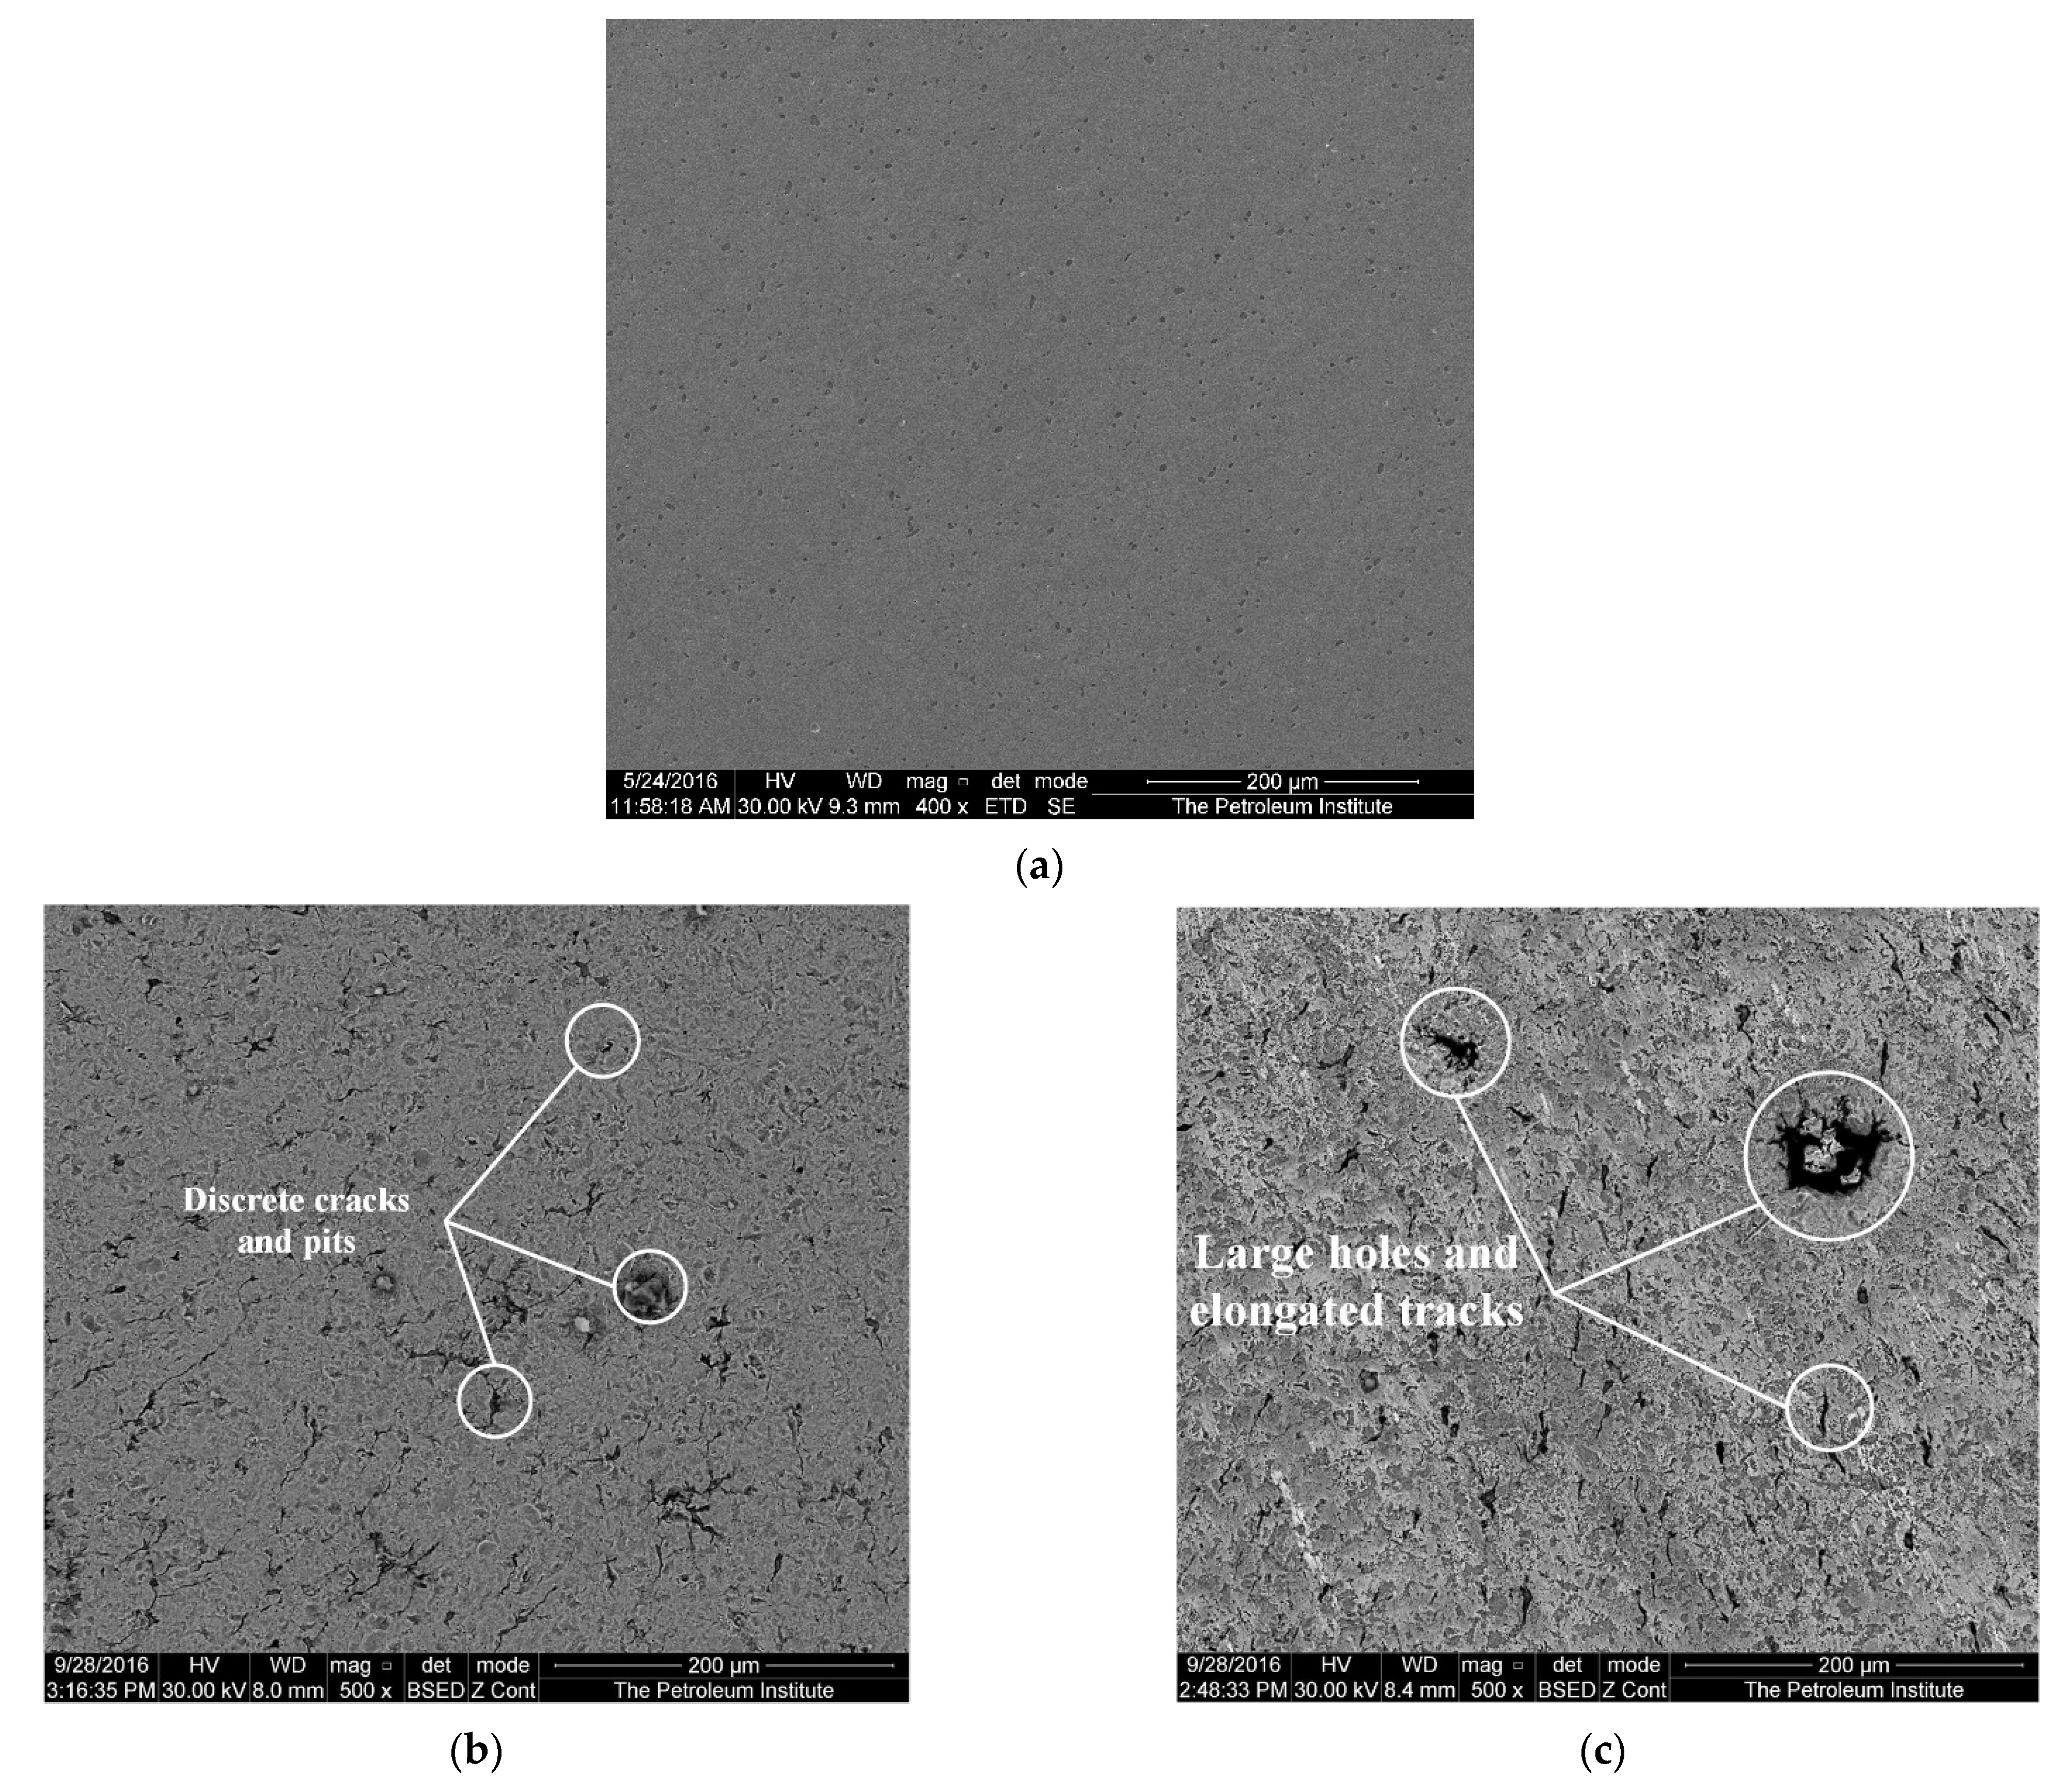
The SEM image in Figure 5 shows the center of the specimen with a diameter <1 mm from the center before impingement, after 1-h impingement and after 4-h impingement. The image reveals plastic deformation after impingement tests on the surface along with the formation of pits and ploughing tracks. Figure 5b shows discrete cracks and isolated pits after one-hour impingement. These cracks and pits on the surface of the specimen are evidence of material loss as a result of impingement. Figure 5c shows thick elongated tracks and large holes caused after a 4-h impingement. It is believed that the formation of these large holes is due to the drilling action of impinging slurry at the surface [41].
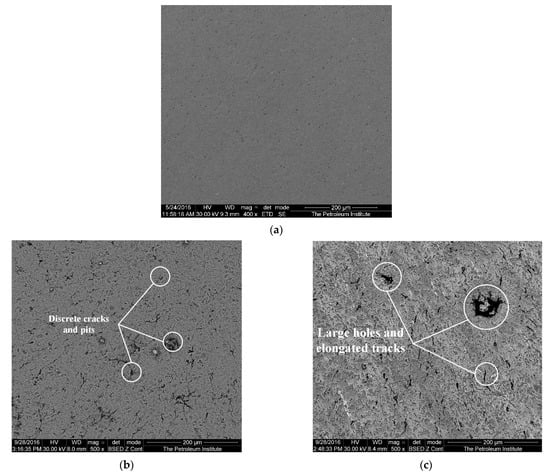
Figure 5.
Surface of the specimen central zone: (a) parent metal, after impingement test at 20 m/s and 600 mg/L; (b) after 1 h; and (c) after 4 h.
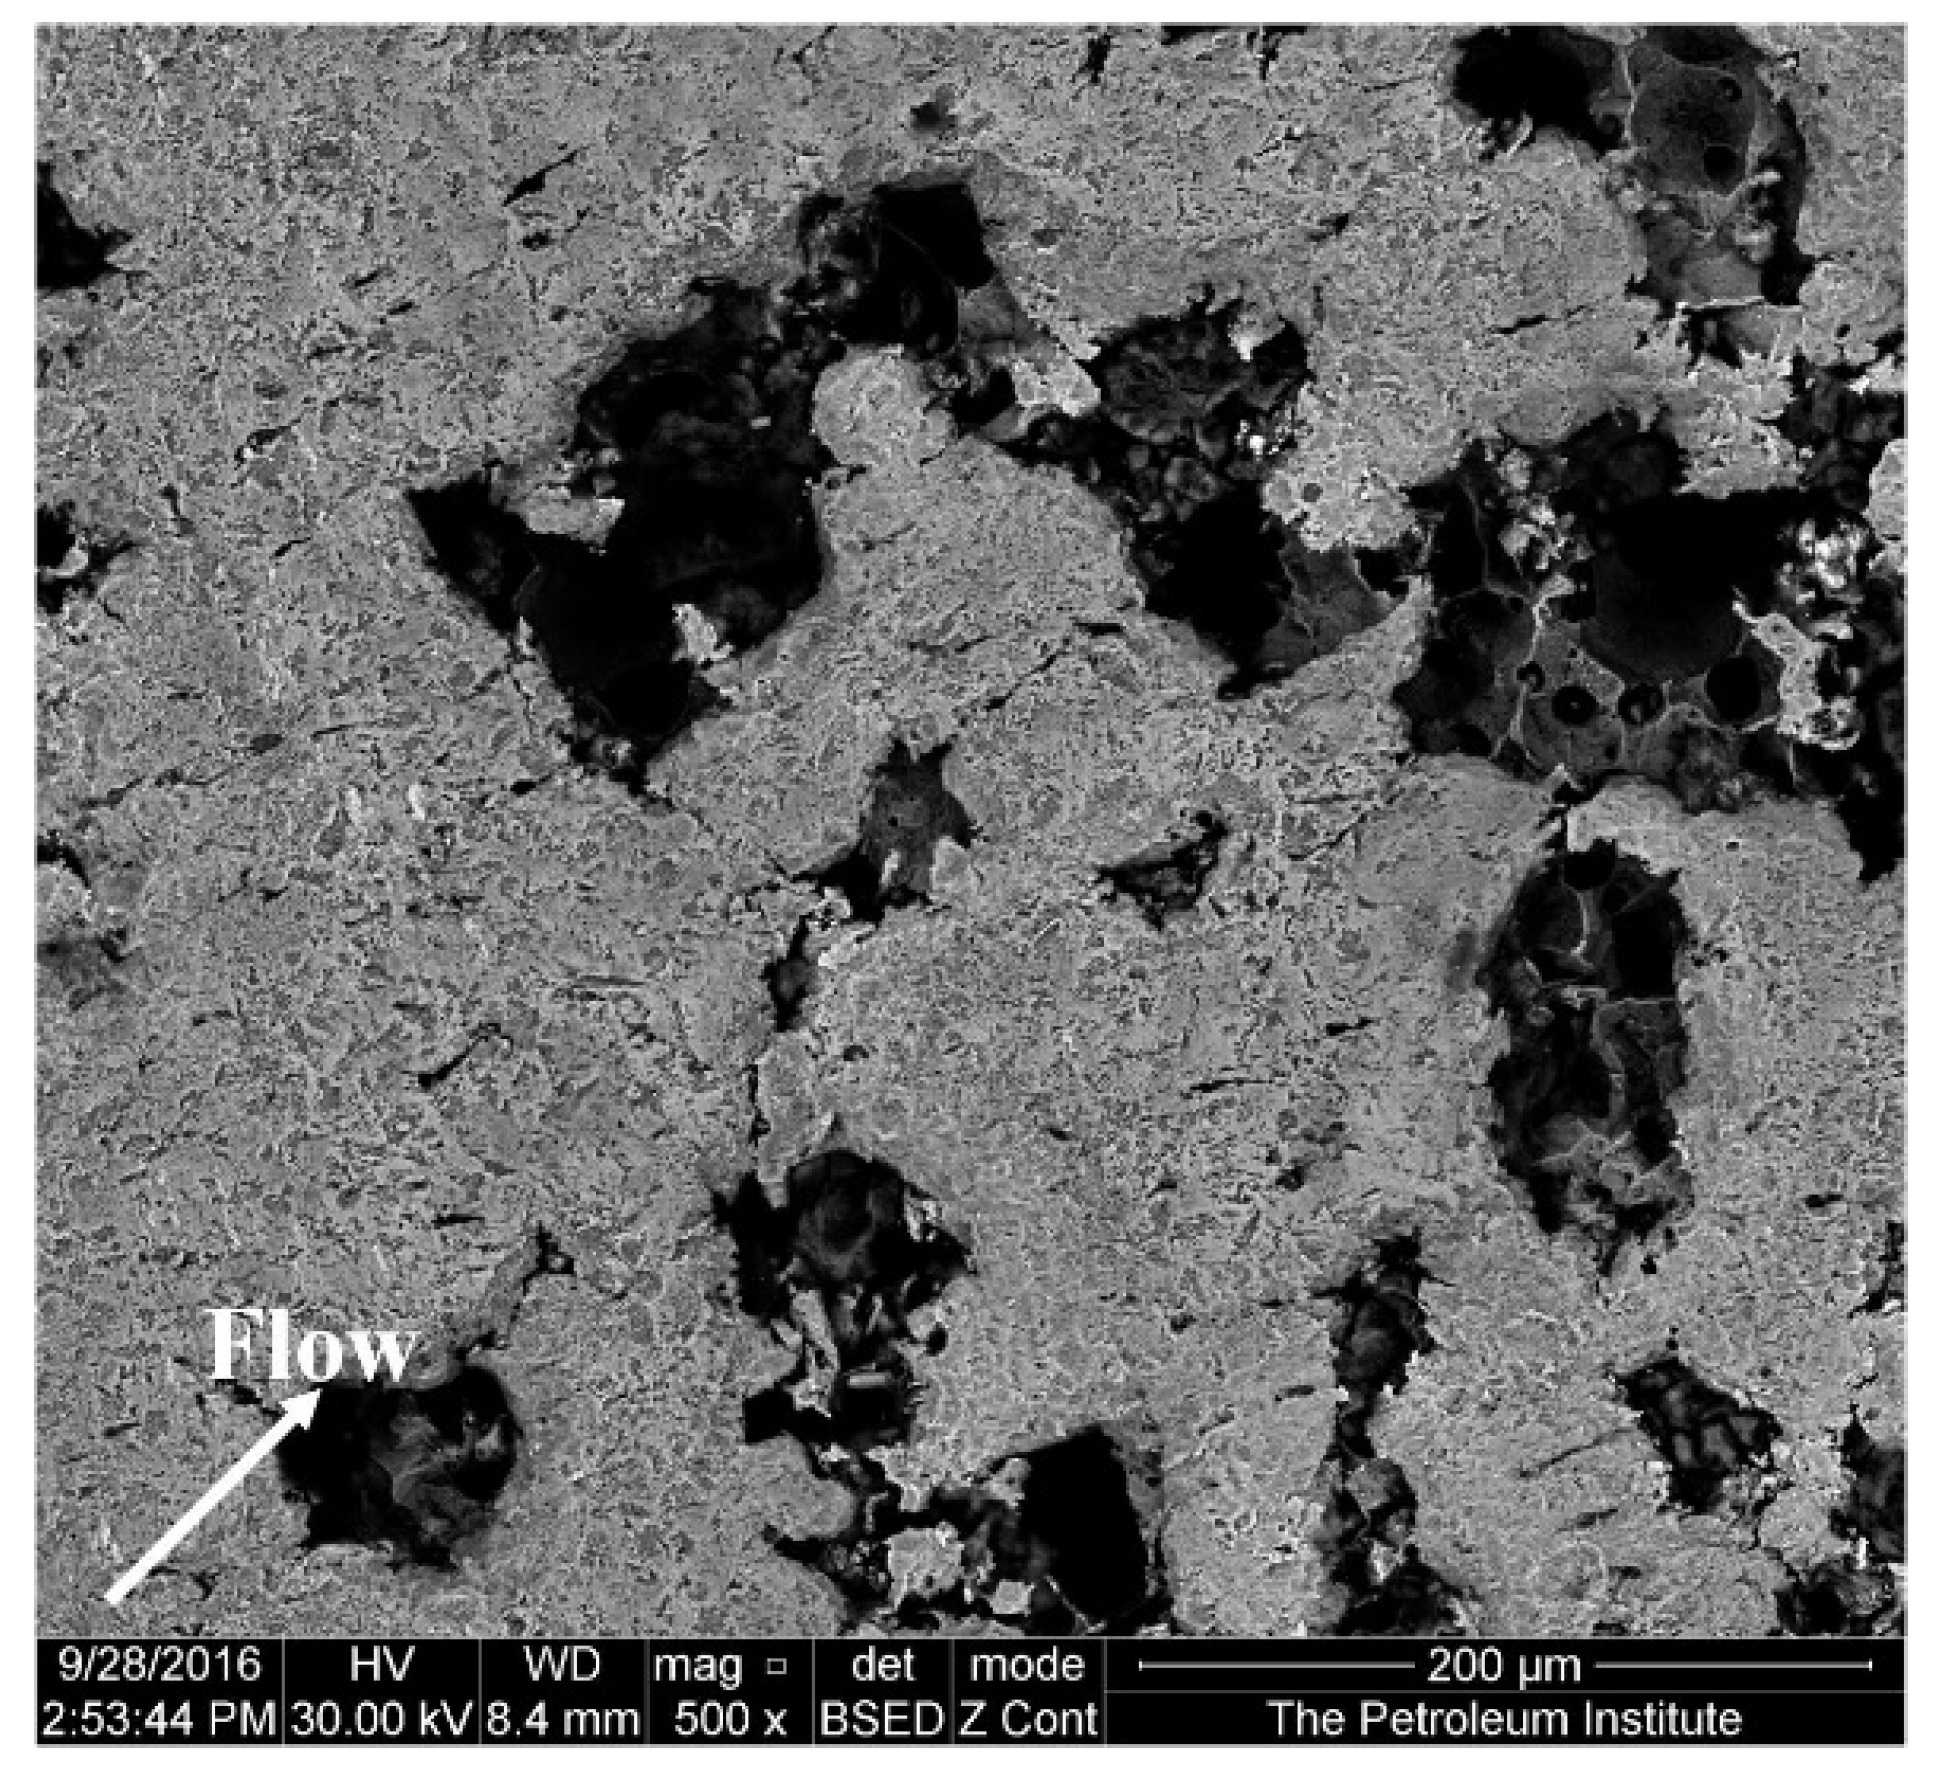
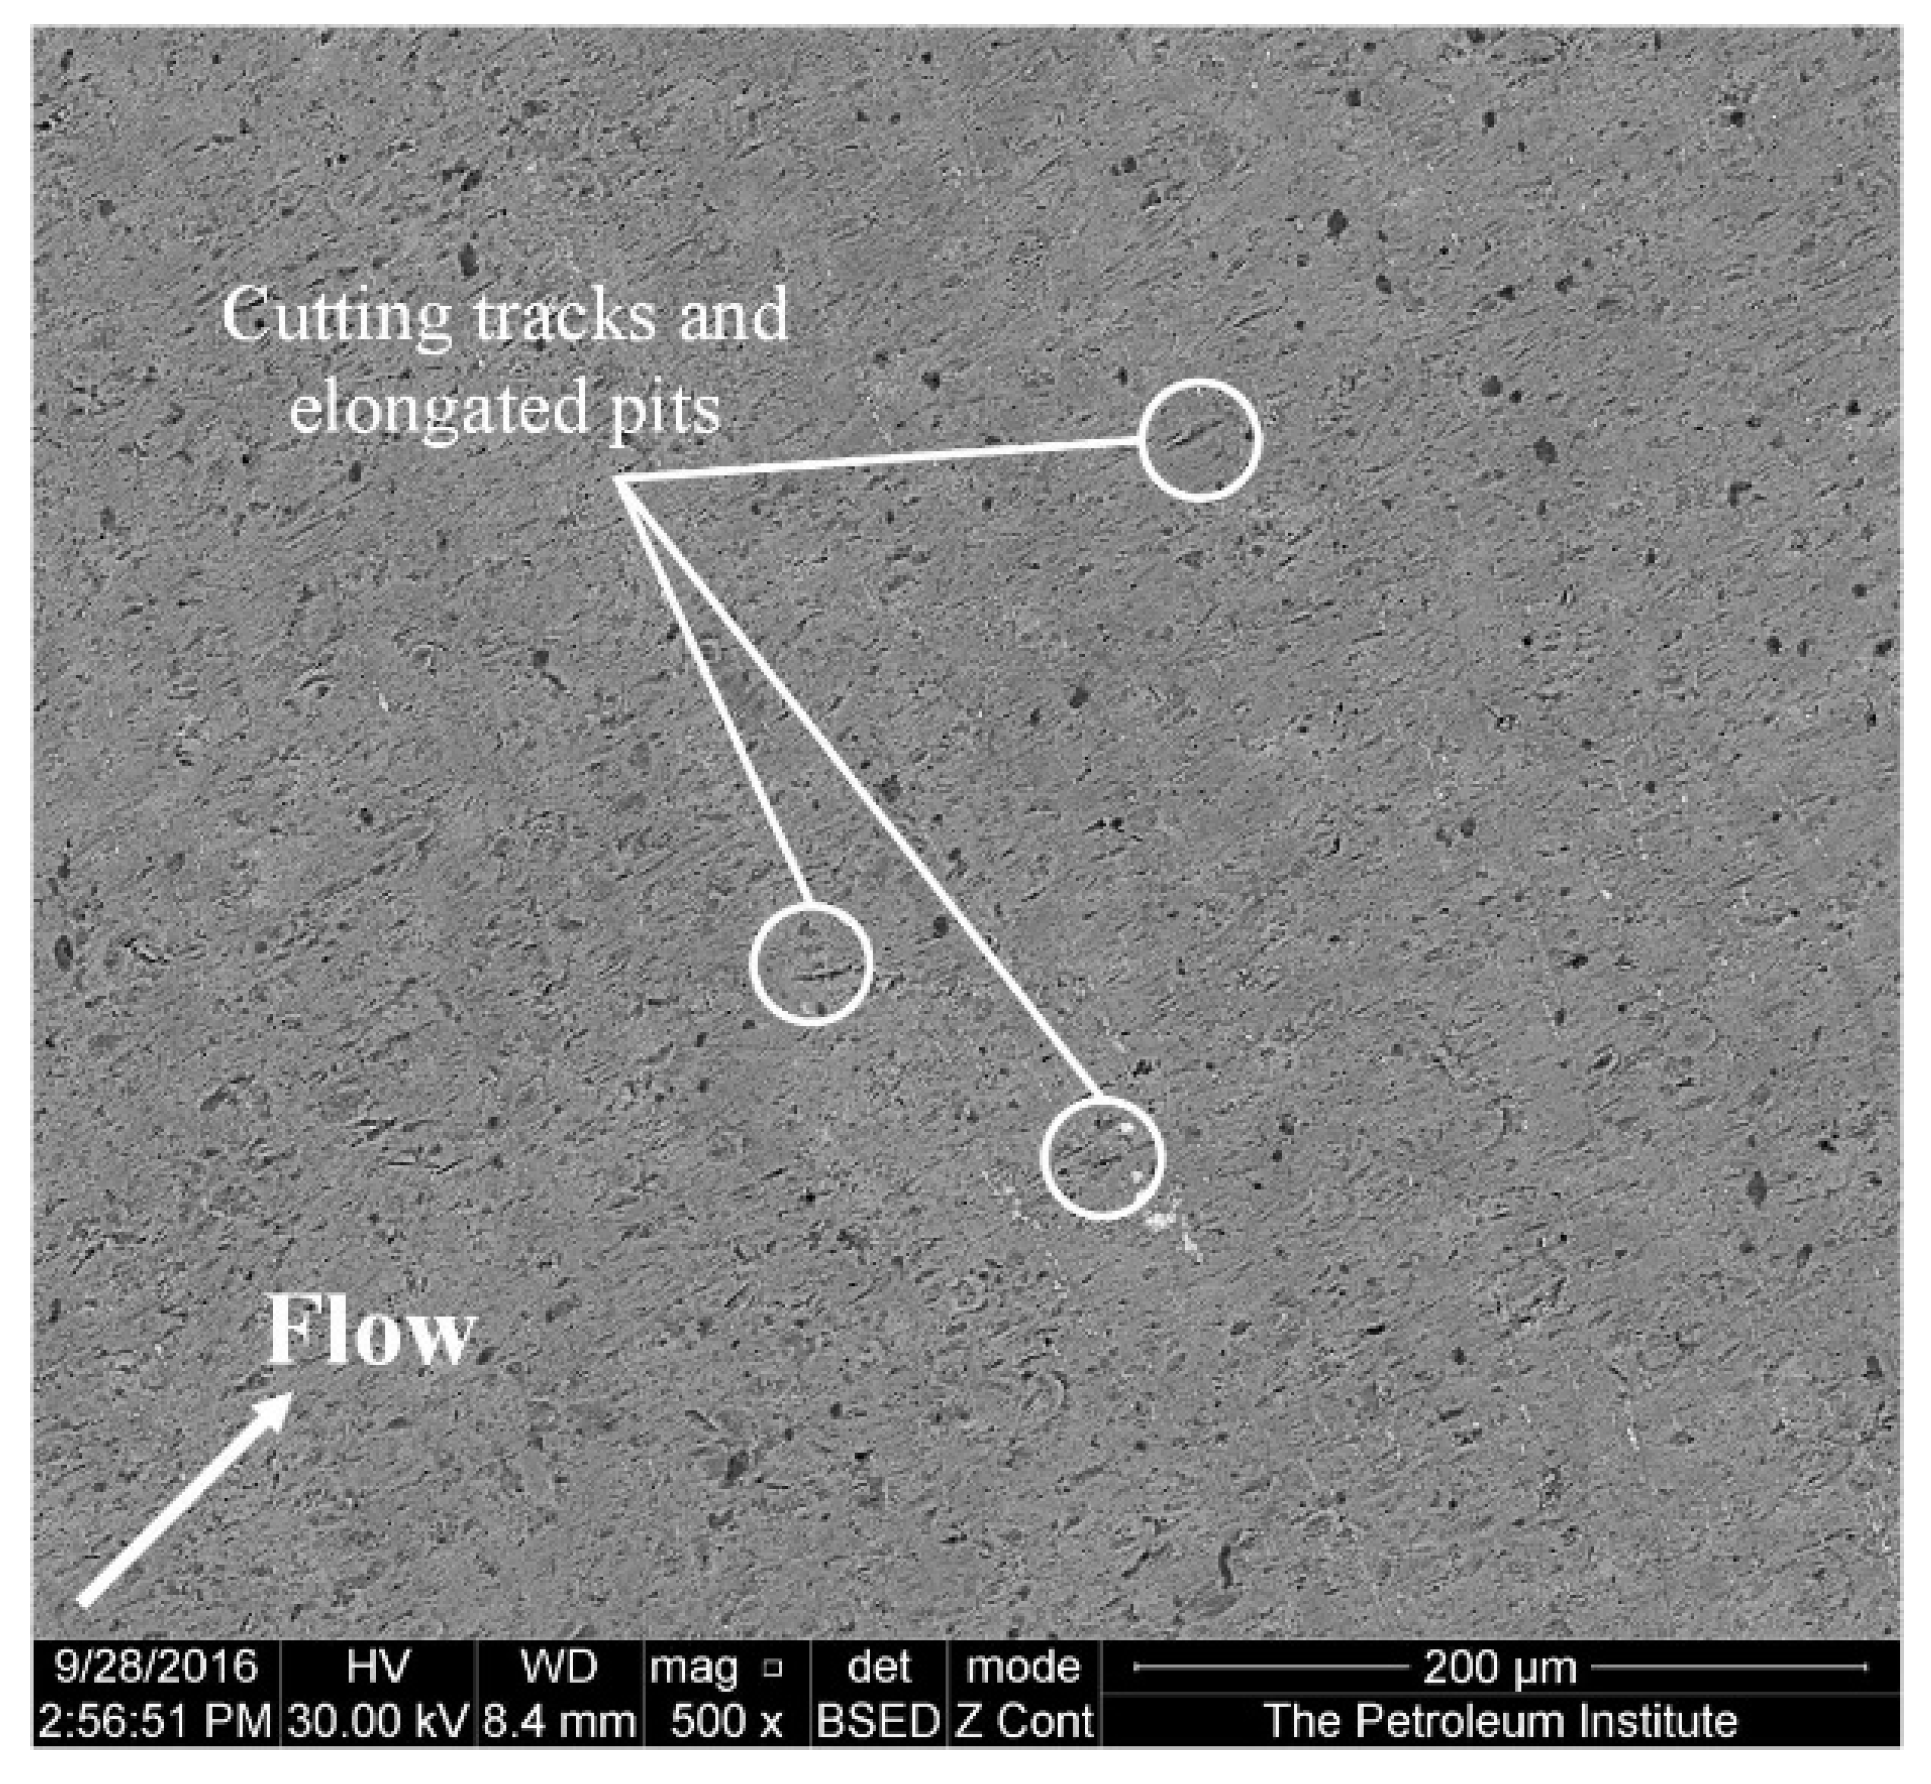
Figure 6 shows an SEM image of the specimen at a diameter of 2 mm away from the center after 4 h of impingement. The material loss in this region, where the impingement angle is less than 90°, is significant. According to the observations of Parsi et al. [42], higher material losses occur at lower impact angles. This is due to the formation and cutting of platelets by particles at lower impact angles. The SEM image (Figure 7) of the specimen at a diameter of 3 mm away from the center shows elongated pits and discrete cutting tracks aligned in the flow direction from the center. It is evident from Figure 6 and Figure 7 that the material damage at an area of 3 mm from the center was less than the damage at 2 mm away from the center. This is because the area 3 mm away from the center was less impacted by the solid particles compared with the area which was 2 mm away from the center, though the particle impinges at a lower (<90°) angle.

Figure 6.
Surface of the specimen 2 mm away from the center after 4 h test at 20 m/s and 600 mg/L.

Figure 7.
Surface of the specimen 3 mm away from the center after 4 h of testing at 20 m/s and 600 mg/L.
3.2. Effect of Static Corrosion on Weight Loss
To determine the weight loss due to static corrosion after 4 h of immersing in salt solution at 31 ± 2 °C, Linear Polarization Resistance (LPR) measurements were performed. However, LPR technique requires the corresponding Tafel constants to be obtained from the anodic and cathodic curve. Hence to determine these constants, a dynamic polarization test was performed for the mild steel sample by sweeping voltage between −1.2 V to 0.8 V with respect to the open circuit potential. The curve as shown in Figure 8 was obtained after the dynamic polarization test. Analyzing the curve using Gamry Echem analyst software, the values for anodic constant and cathodic constant were found as 0.2016 V/decade and 0.3256 V/decade, respectively.
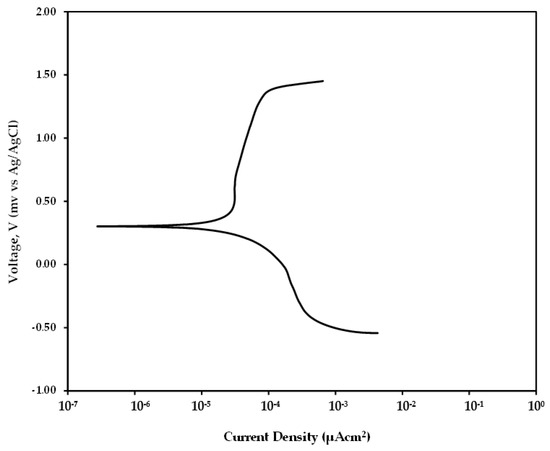
Figure 8.
Tafel curve obtained for mild steel sample after 4 h immersion.
After performing the LPR test and using Gamry Echem analyst software the value obtained for samples after 4 h was 33.76 kΩ. This value, along with the Tafel constants when used in Equation (3), gives the value as 1.602 µAcm−2. By converting this icorr value using the Faraday’s law, the weight loss is calculated as 0.03 mg which is relatively very low compared to and .
3.3. Effect of Velocity and Sand Loading
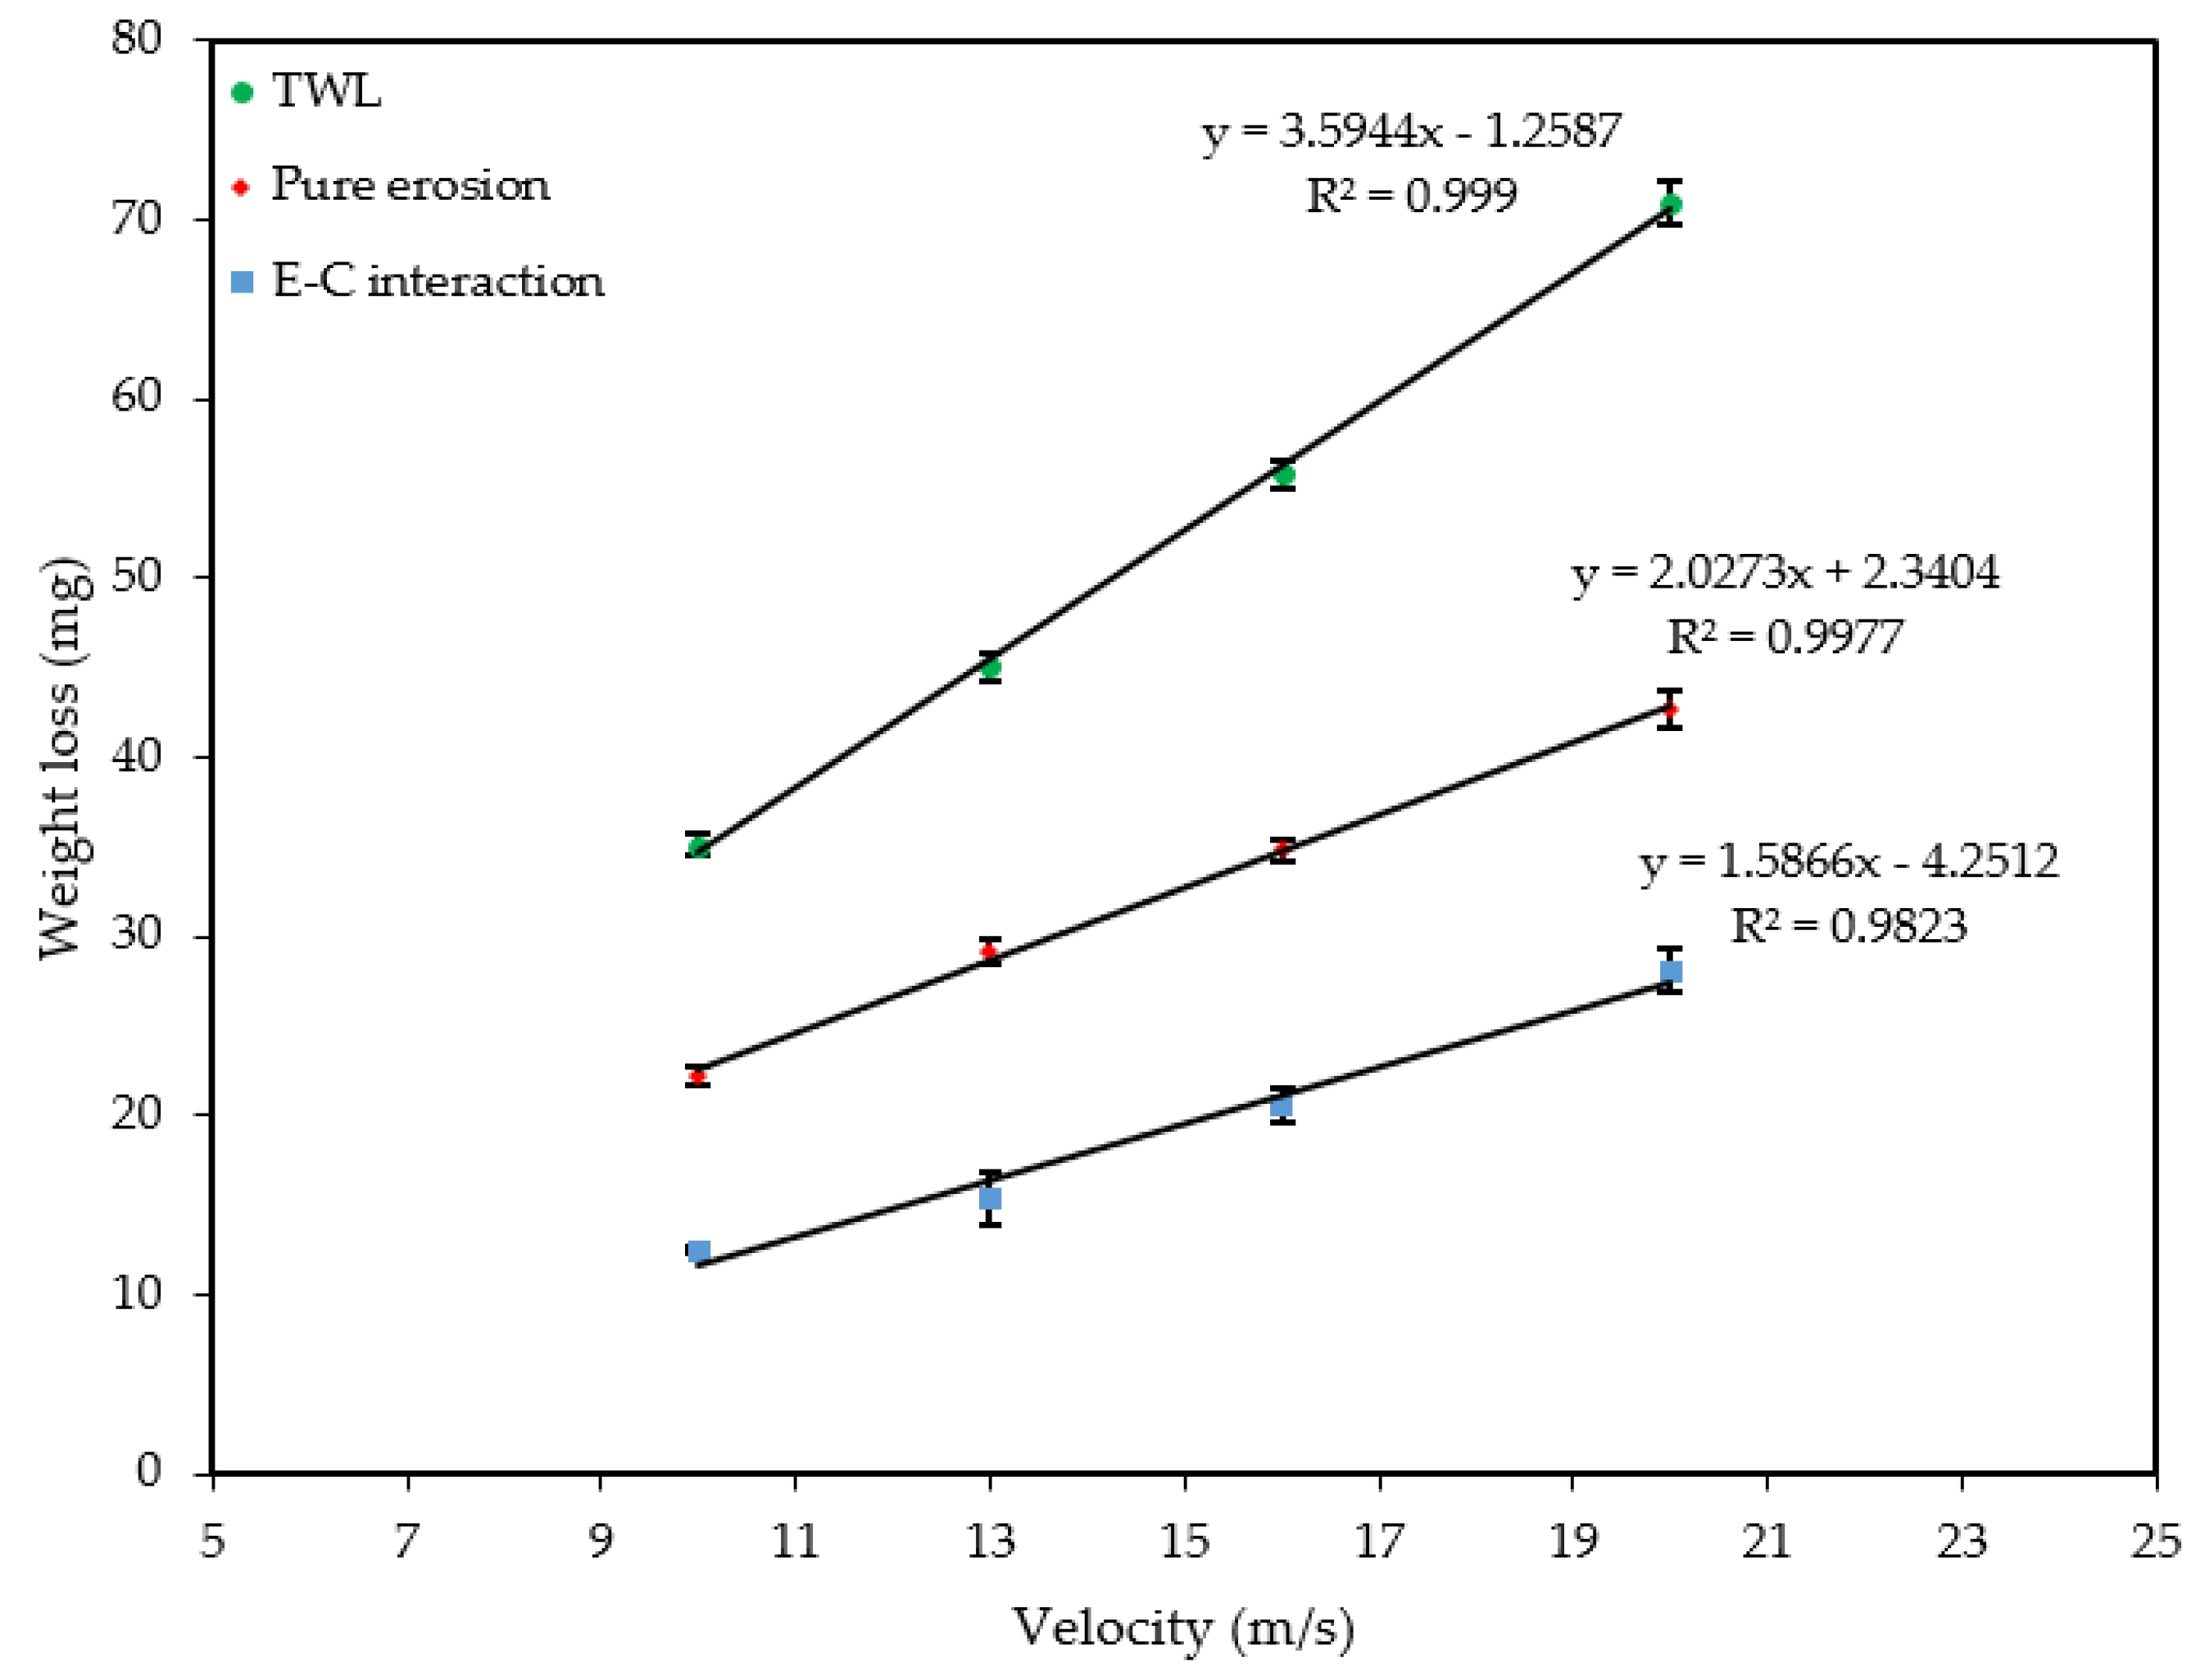
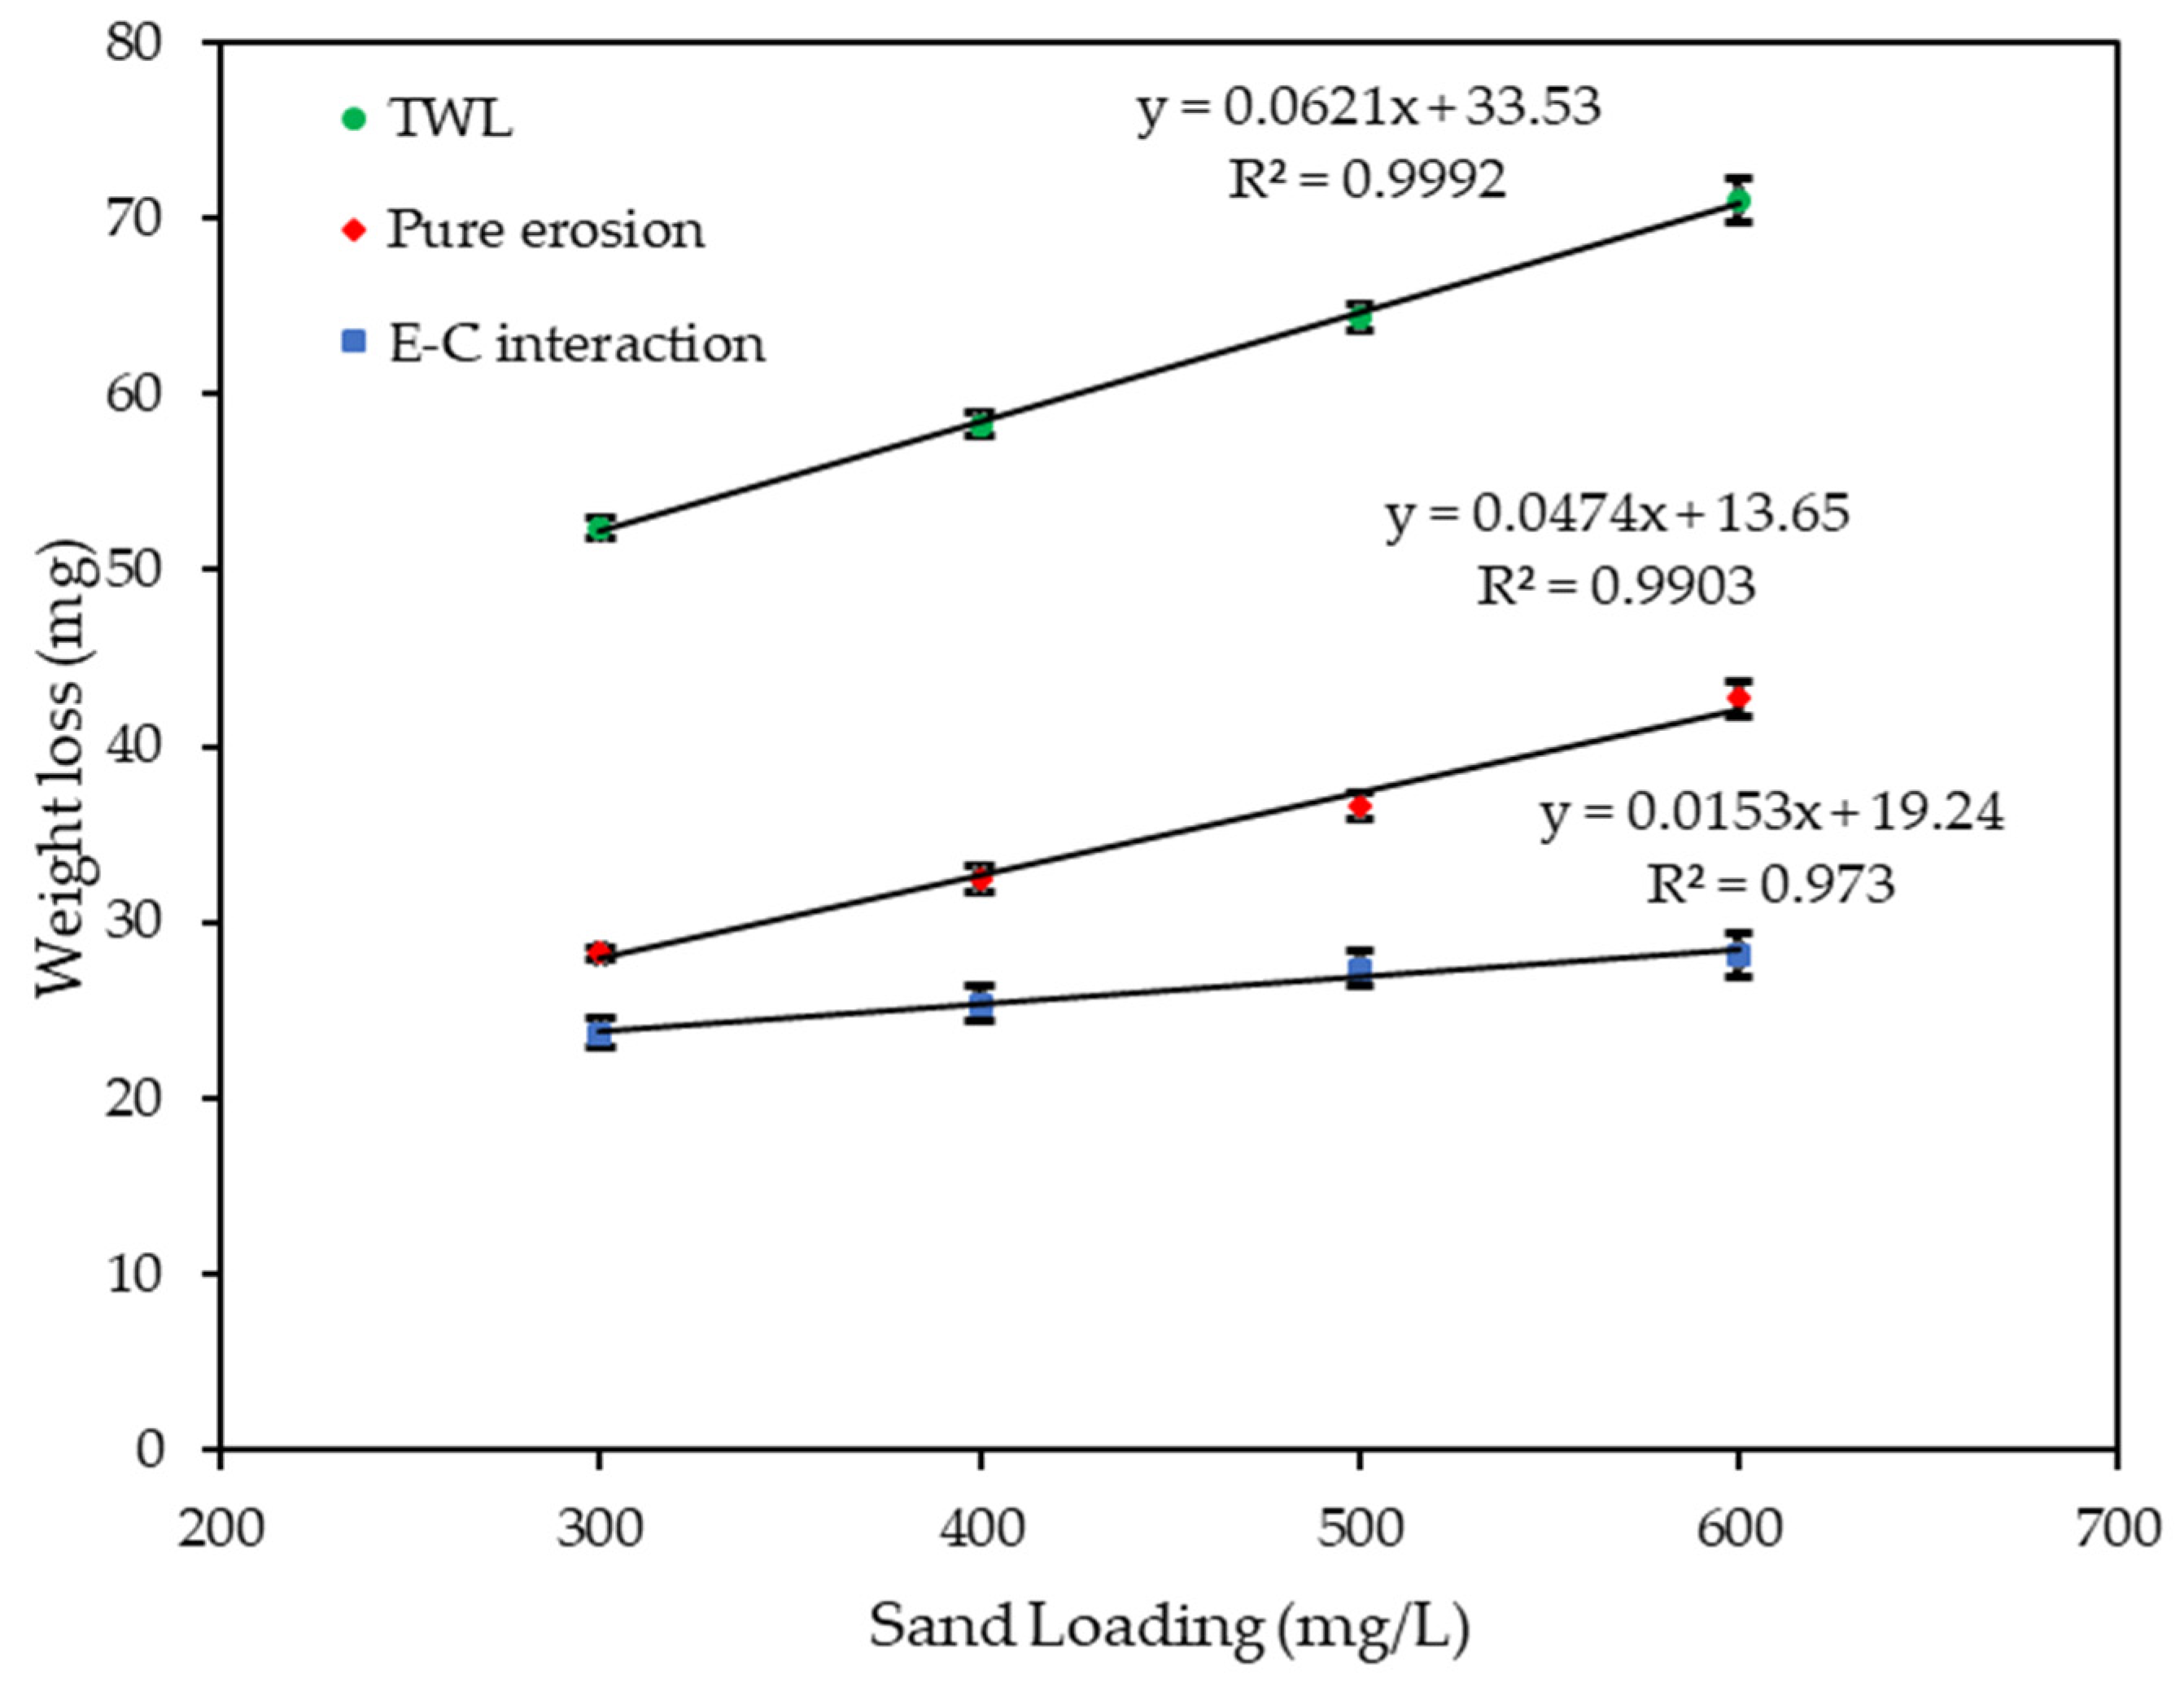
Figure 9 and Figure 10 show the velocity and sand loading effect on the , and after 4 h of exposure. Table 2 and Table 3, and the figures show how the weight loss increases linearly with both the velocity and sand loading at an increased rate of the velocity than for sand loading alone. In both cases pure erosion is dominant. The was calculated by subtracting the and from .
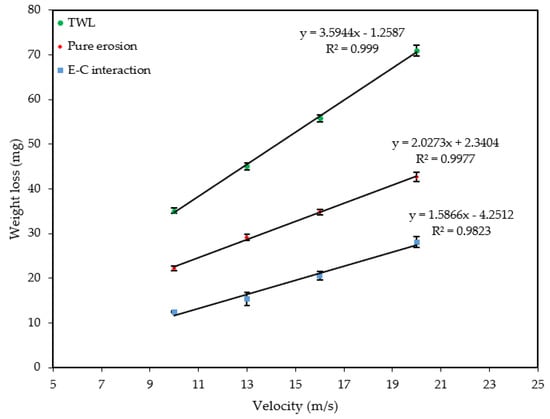
Figure 9.
Effect of velocity on weight loss at 600 mg/L.
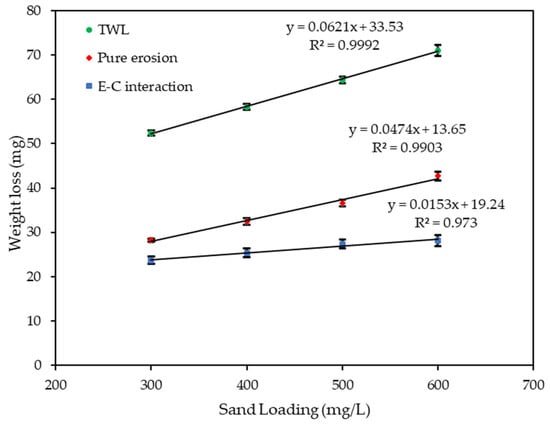
Figure 10.
Effect of sand loading on weight loss at 20 m/s.
Table 2.
Weight loss due to velocity effect at 600 mg/L.
Table 3.
Weight loss due to sand loading effect at 20 m/s.
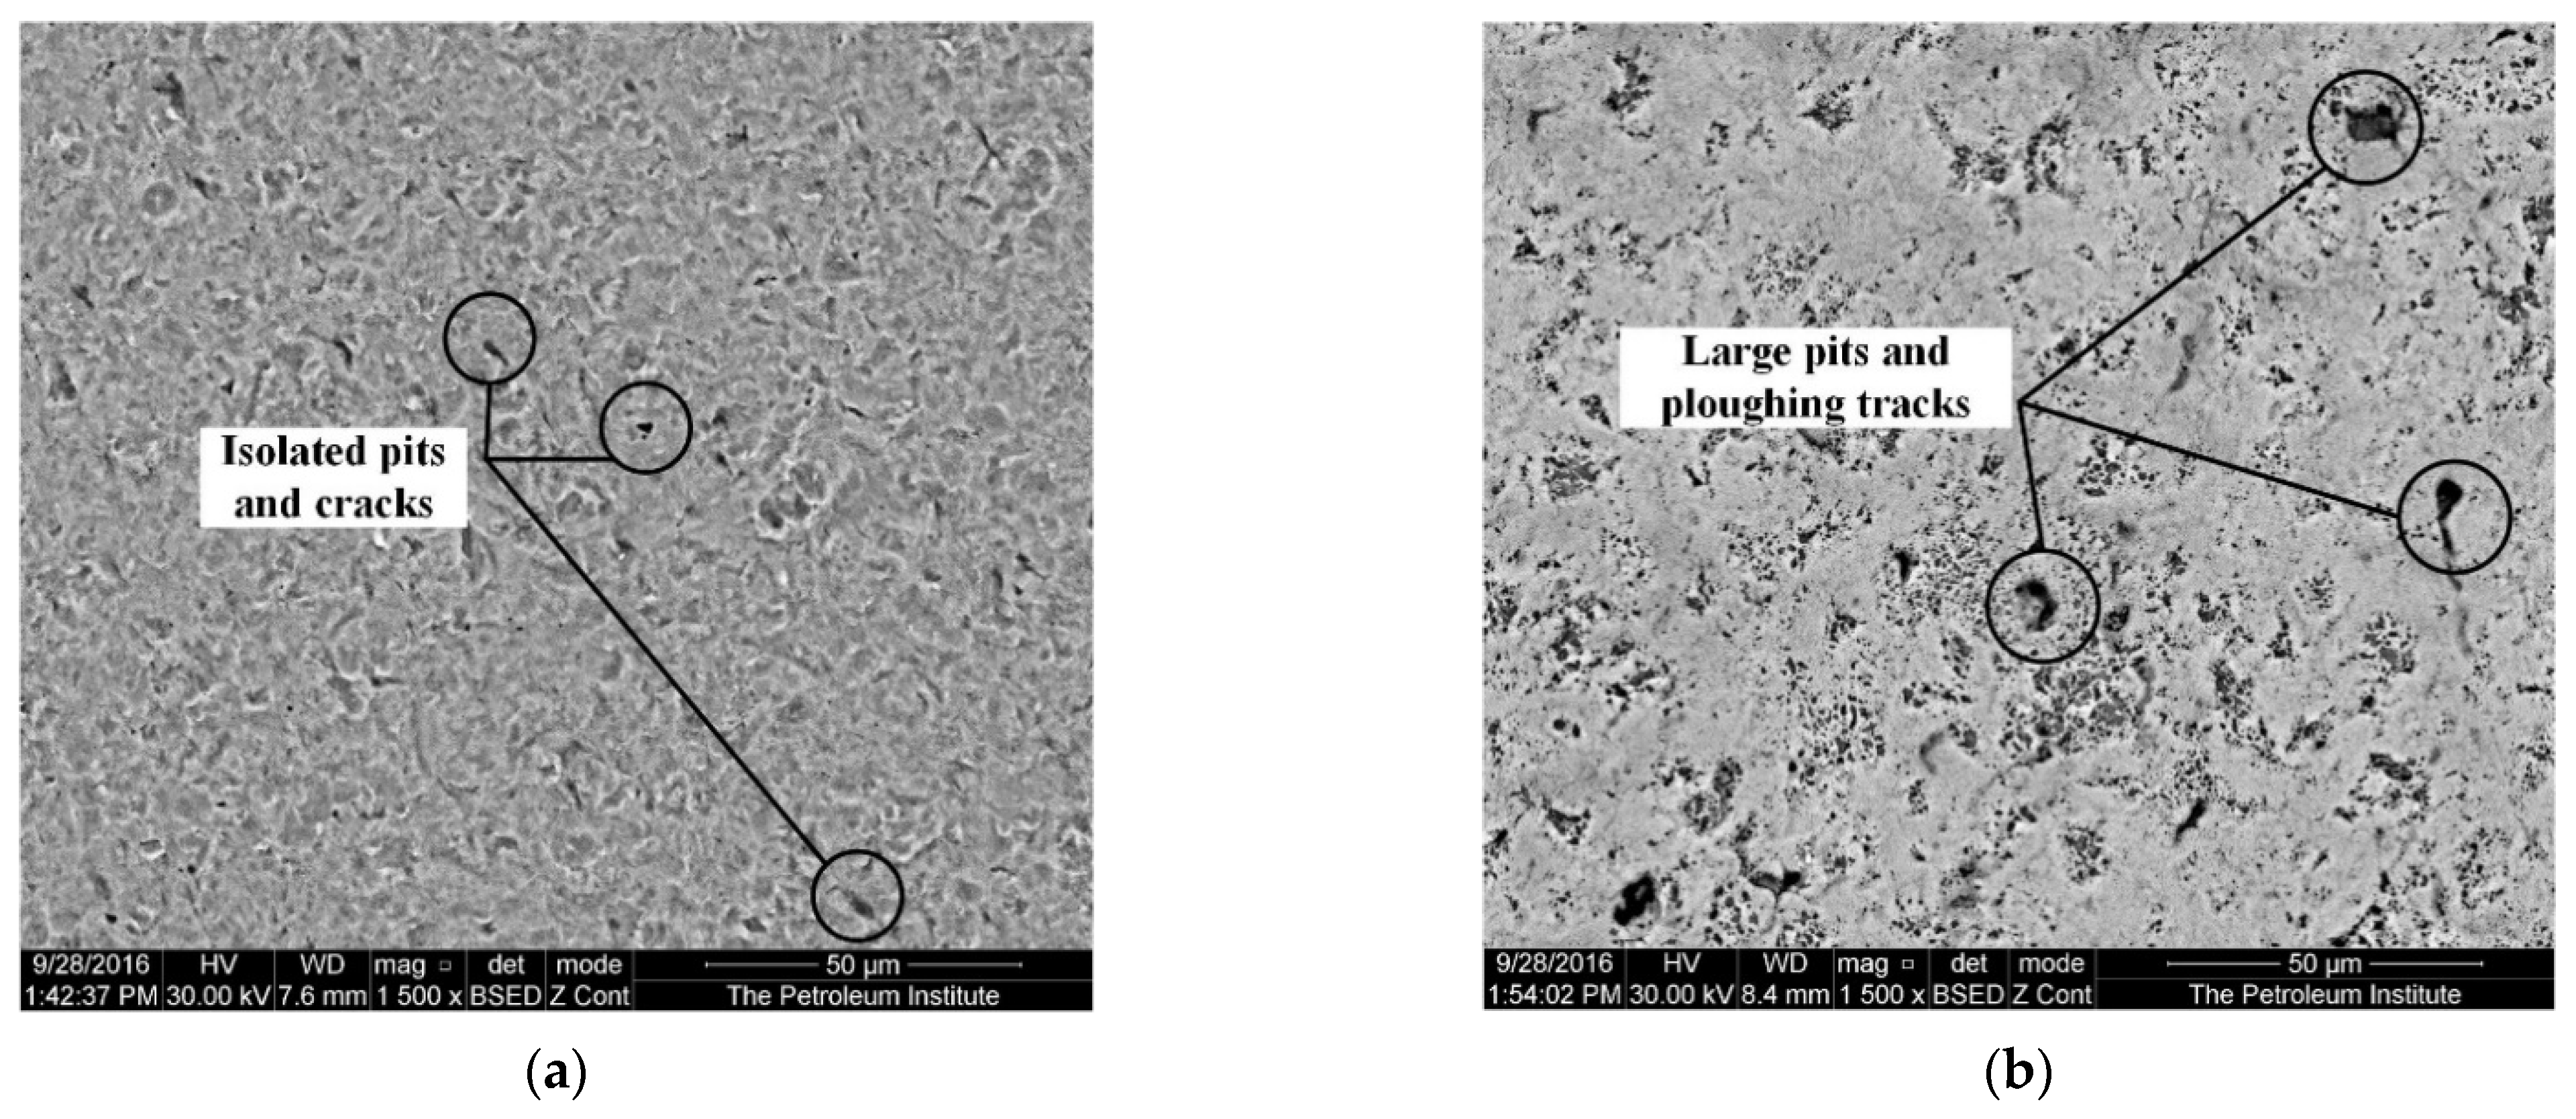
Figure 11 shows SEM images of the specimen after erosion–corrosion impingement tests under two different conditions with a 1500x magnification. Figure 11a shows the formation of metal shards along with discrete isolated pits and cracks after the impingement test at the minimum velocity of 10 m/s and maximum sand loading of 600 mg/L. Figure 11b shows the SEM image at the minimum sand loading of 300 mg/L and maximum velocity of 20 m/s. The SEM (in Figure 11b) shows discrete pits and ploughing tracks larger in size than those seen in Figure 11a. These larger pits and ploughing tracks are a result of the large impact energy of the higher velocity sand having the potential to cause more damage. The image also shows areas on the surface which are free from the impact of sand particles.

Figure 11.
SEM of specimen after erosion–corrosion impingement test (a) at 10 m/s and 600 mg/L; and (b) at 20 m/s and 300 mg/L.
Figure 12 shows the SEM image of the surface 2 mm away from the center after the pure erosion test under the same conditions, as in Figure 6 which is the SEM image after the erosion–corrosion test. At this region (2 mm away from the center) the impact angle is expected to be at an angle of less than 90°. In erosive wear, the angular impingement of particles experiences deformation based on its orientation when it contacts the surface whether it is rolling forward or backward while in contact. The image shows that metal flakes are formed on the surface due to the multiple impacts of particles. According to Levi’s platelet mechanism [43] these flakes are the signs of plastic deformation of the surface. This deformation in the direction of flow indicates the removal mechanism [44,45,46,47]. As the angle was less than 90°, it is believed that the particle impact would form a crater, and subsequent impingement would enlarge the crater and also pile up the material around it, eventually removing it from the surface. Figure 6 shows the craters and larger holes as a sign of significant removal of materials due to the combined effect of corrosion and erosion. This is due to corrosion-enhanced erosion, resulting in the removal of flakes formed by multiple impacts of sand particles [48].
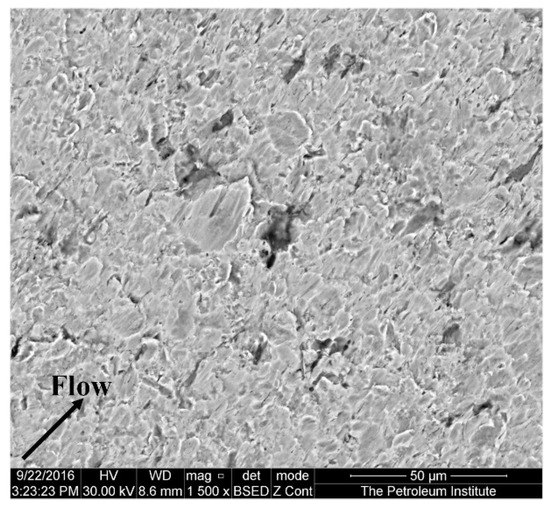
Figure 12.
Surface of the specimen 2 mm away from the center after pure erosion test at 20 m/s and 600 mg/L.
3.4. Empirical Regression Model That Relates the and with the Velocity and Sand Loading
A two-level factorial experimental method in the design of the experiments (DOE) was used to develop an empirical regression model that represents the and as a function of velocity and sand loading. Each variable was assigned two levels, low and high, also designated as −1 and +1, resulting in four different combinations. All the experiments were repeated three times for validity. Table 4 shows the four different combinations of velocity and sand loading used to conduct the experiments. Table 5 shows the values of velocity and sand loading at low and high levels used to develop a mathematical model. The model was developed using MINITAB in a form as shown in Equation (4).
Table 4.
Runs for 22 experiment design.
Table 5.
Variables and experimental design levels for conducting experiments.
In Equation (4), is the response variable, , , , are constant regression coefficients of the model, , are independent variables and is the interaction between and , the product of and .
Figure 13 shows the results of experiments conducted with the four different combinations. The results show that erosion is the dominant factor for all combinations except for the combination of low velocity and low sand loading, where the E–C interaction contributed more to the weight loss. Equations (5) and (6) are the developed models for and , respectively. These equations were derived under laboratory conditions for a velocity of 10 m/s to 20 m/s, sand loading of 300 mg/L to 600 mg/L, a temperature of 29–33 °C, an impingement angle of 90° in a 4-h time period.
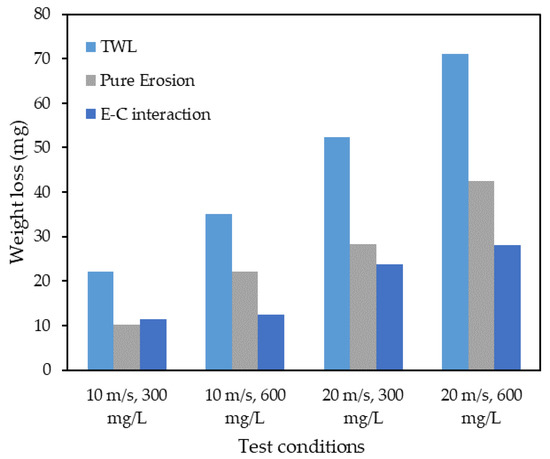
Figure 13.
The result of experiments conducted at four different combinations.
The models given in Equations (5) and (6) where is velocity and is sand loading for both and show that the velocity has more influence on the weight loss than the sand loading, as the velocity has a larger coefficient than the sand loading . However, both velocity and sand loading have a significant influence on and .
Table 6 and Table 7 show the regression analysis results for the and , respectively. The p-value determines the significance of each term in the model. If the p-value of each term in the model is less than the significant level, then the model is statistically significant. It can be seen that the p-value for all the coefficients in Table 6 and Table 7 are less than 0.05 (significant level), indicating that the model is highly significant. The R-Sq value for Equation (5) is 99.95% and for Equation (6) is 99.91%.
Table 6.
Regression analysis for .
Table 7.
Regression analysis for .
4. Conclusions
In this study, the effects of velocity and sand loading on the weight loss of mild steel under impingement conditions were investigated. It was found that both and the increased linearly with velocity and sand loading, and that more weight loss occurred away from the center of the specimen. Except at low velocity and low sand loading, pure erosion was the dominant factor. SEM images revealed the formation of metal flakes and discrete isolated pits and cracks which grew larger with higher velocity and sand loading. Design of the experiment was used to develop an empirical regression model which could predict the and as a function of velocity and sand loading for specific conditions. Translating the results of this model for the prediction of material loss in field conditions requires additional work which includes using the types of steel used in the field. In addition, future work should include the effect of field operational temperature, velocity, and the impingement angle on the pure erosion and erosion–corrosion.
Author Contributions
Conceptualization, M.S.P., S.P., S.A., Y.F.Y. and P.R.; methodology, M.S.P. and S.P.; software, M.S.P. and S.P.; validation, M.S.P.; investigation, M.S.P.; resources, S.A. and Y.F.Y.; writing—original draft preparation, M.S.P. and S.P.; writing—review and editing, S.A., Y.F.Y. and P.R.; supervision, S.A., Y.F.Y. and P.R.; All authors have read and agreed to the published version of the manuscript.
Funding
This research received no external funding.
Institutional Review Board Statement
Not applicable.
Informed Consent Statement
Not applicable.
Data Availability Statement
The data presented in this study are available on request from the corresponding author.
Conflicts of Interest
The authors declare no conflict of interest.
References
- Heitz, E. Mechanistically based prevention strategies of flow-induced corrosion. Electrochim. Acta 1996, 41, 503–509. [Google Scholar] [CrossRef]
- Neville, A.; Hu, X. Mechanical and electrochemical interactions during liquid–solid impingement on high-alloy stainless steels. Wear 2001, 251, 1284–1294. [Google Scholar] [CrossRef]
- Neville, A.; Hodgkiess, T. Characterisation of high-grade alloy behaviour in severe erosion–corrosion conditions. Wear 1999, 233–235, 596–607. [Google Scholar] [CrossRef]
- Yang, Y.; Cheng, Y. Parametric effects on the erosion–corrosion rate and mechanism of carbon steel pipes in oil sands slurry. Wear 2012, 276–277, 141–148. [Google Scholar] [CrossRef]
- Owen, J.; Ramsey, C.; Barker, R.; Neville, A. Erosion-corrosion interactions of X65 carbon steel in aqueous CO2 environments. Wear 2018, 414–415, 376–389. [Google Scholar] [CrossRef]
- Neville, A.; Hodgkiess, T.; Dallas, J. A study of the erosion-corrosion behaviour of engineering steels for marine pumping applications. Wear 1995, 186–187, 497–507. [Google Scholar] [CrossRef]
- Souza, V.; Neville, A. Corrosion and synergy in a WCCoCr HVOF thermal spray coating—Understanding their role in erosion–corrosion degradation. Wear 2005, 259, 171–180. [Google Scholar] [CrossRef]
- Elemuren, R.; Evitts, R.; Oguocha, I.; Kennell, G.; Gerspacher, R.; Odeshi, A. Slurry erosion-corrosion of 90° AISI 1018 steel elbow in saturated potash brine containing abrasive silica particles. Wear 2018, 410–411, 149–155. [Google Scholar] [CrossRef]
- Lu, B.T.; Luo, J.L. Synergism of Electrochemical and Mechanical Factors in Erosion−Corrosion. J. Phys. Chem. B 2006, 110, 4217–4231. [Google Scholar] [CrossRef]
- Bateni, M.R.; Szpunar, J.; Wang, X.; Li, D. Wear and corrosion wear of medium carbon steel and 304 stainless steel. Wear 2006, 260, 116–122. [Google Scholar] [CrossRef]
- Guo, H.; Lu, B.; Luo, J. Interaction of mechanical and electrochemical factors in erosion–corrosion of carbon steel. Electrochimica Acta 2005, 51, 315–323. [Google Scholar] [CrossRef]
- Postlethwaite, J.; Dobbin, M.H.; Bergevin, K. The Role of Oxygen Mass Transfer in the Erosion-Corrosion of Slurry Pipelines. Corrosion 1986, 42, 514–521. [Google Scholar] [CrossRef]
- Neville, A.; Reyes, M.; Xu, H. Examining corrosion effects and corrosion/erosion interactions on metallic materials in aqueous slurries. Tribol. Int. 2002, 35, 643–650. [Google Scholar] [CrossRef]
- Abedini, M.; Ghasemi, H. Synergistic erosion–corrosion behavior of Al–brass alloy at various impingement angles. Wear 2014, 319, 49–55. [Google Scholar] [CrossRef]
- Burstein, G.T.; Sasaki, K. Effect of impact angle on the slurry erosion-corrosion of 304L stainless steel. Wear 2000, 240, 80–94. [Google Scholar] [CrossRef]
- Clark, H.M. Particle velocity and size effects in laboratory slurry erosion measurements OR… do you know what your particles are doing? Tribol. Int. 2002, 35, 617–624. [Google Scholar] [CrossRef]
- Karafyllias, G.; Galloway, A.; Humphries, E. The effect of low pH in erosion-corrosion resistance of high chromium cast irons and stainless steels. Wear 2019, 420–421, 79–86. [Google Scholar] [CrossRef]
- Jellesen, M.S.; Christiansen, T.L.; Hilbert, L.R.; Møller, P. Erosion–corrosion and corrosion properties of DLC coated low temperature gas-nitrided austenitic stainless steel. Wear 2009, 267, 1709–1714. [Google Scholar] [CrossRef]
- Hussain, E.; Robinson, M. Erosion–corrosion of 2205 duplex stainless steel in flowing seawater containing sand particles. Corros. Sci. 2007, 49, 1737–1754. [Google Scholar] [CrossRef]
- Mohammadi, F.; Luo, J. Effects of particle angular velocity and friction force on erosion enhanced corrosion of 304 stainless steel. Corros. Sci. 2010, 52, 2994–3001. [Google Scholar] [CrossRef]
- Zhou, G.; Ding, H.; Zhang, Y.; Li, N. Corrosion–erosion wear behaviors of 13Cr24Mn0. 44N stainless steel in saline–sand slurry. Tribol. Int. 2010, 43, 891–896. [Google Scholar]
- Lu, B.; Mao, L.; Luo, J. Hydrodynamic effects on erosion-enhanced corrosion of stainless steel in aqueous slurries. Electrochim. Acta 2010, 56, 85–92. [Google Scholar] [CrossRef]
- López, D.; Falleiros, N.A.; Tschiptschin, A.P. Corrosion–erosion behaviour of austenitic and martensitic high nitrogen stainless steels. Wear 2007, 263, 347–354. [Google Scholar] [CrossRef]
- Aribo, S.; Barker, R.; Hu, X.; Neville, A. Erosion–corrosion behaviour of lean duplex stainless steels in 3.5% NaCl solution. Wear 2012, 302, 1602–1608. [Google Scholar] [CrossRef]
- Zhang, G.; Xu, L.; Cheng, Y. Investigation of erosion–corrosion of 3003 aluminum alloy in ethylene glycol–water solution by impingement jet system. Corros. Sci. 2009, 51, 283–290. [Google Scholar] [CrossRef]
- He, D.; Jiang, X.; Li, S.; Guan, H. Erosion and Erosion-Corrosion Behaviors of Several Stainless Steels in Dual-Phase Fluid. Corrosion 2002, 58, 276–282. [Google Scholar] [CrossRef]
- Vreeland, D.C. Corrosion-Erosion of Sensitized AISI Type 304 Stainless Steel in a Thorium Dioxide-Uranium Trioxide Slurry. Corrosion 1961, 17, 21t–24t. [Google Scholar] [CrossRef]
- Senatore, E.; Taleb, W.; Owen, J.; Hua, Y.; Gomes, J.A.P.; Barker, R.; Neville, A. Evaluation of high shear inhibitor performance in CO2-containing flow-induced corrosion and erosion-corrosion environments in the presence and absence of iron carbonate films. Wear 2018, 404–405, 143–152. [Google Scholar] [CrossRef] [Green Version]
- Barker, R.; Neville, A.; Hu, X.; Cushnaghan, S. Evaluating Inhibitor Performance in CO2-Saturated Erosion-Corrosion Environments. Corrosion 2015, 71, 14–29. [Google Scholar] [CrossRef]
- Hu, X.; Barker, R.; Neville, A.; Gnanavelu, A. Case study on erosion–corrosion degradation of pipework located on an offshore oil and gas facility. Wear 2011, 271, 1295–1301. [Google Scholar] [CrossRef]
- Hassani, S.; Roberts, K.P.; Shirazi, S.A.; Rybicki, E.F.; Shadley, J.R.; Joia, C.-J.B. A New Approach for Predicting Inhibited Erosion-Corrosion in CO2-Saturated Oil/Brine Flow Condition. All Days 2012, 28, 135–144. [Google Scholar] [CrossRef]
- Hu, X.; Neville, A. CO2 erosion–corrosion of pipeline steel (API X65) in oil and gas conditions—A systematic approach. Wear 2009, 267, 2027–2032. [Google Scholar] [CrossRef]
- Meng, H.; Hu, X.; Neville, A. A systematic erosion–corrosion study of two stainless steels in marine conditions via experimental design. Wear 2007, 263, 355–362. [Google Scholar] [CrossRef]
- Shehadeh, M.; Anany, M.; Saqr, K.M.; Hassan, I. Experimental investigation of erosion-corrosion phenomena in a steel fitting due to plain and slurry seawater flow. Int. J. Mech. Mater. Eng. 2014, 9, 1–8. [Google Scholar] [CrossRef] [Green Version]
- Harvey, T.J.; Wharton, J.A.; Wood, R.J.K. Development of synergy model for erosion–corrosion of carbon steel in a slurry pot. Tribol.-Mater. Surfaces Interfaces 2007, 1, 33–47. [Google Scholar] [CrossRef]
- De Waard, C.; Milliams, D.E. Carbonic Acid Corrosion of Steel. Corrosion 1975, 31, 177–181. [Google Scholar] [CrossRef]
- De Waard, C.; Lotz, U.; Milliams, D.E. Predictive Model for CO2 Corrosion Engineering in Wet Natural Gas Pipelines. Corrosion 1991, 47, 976–985. [Google Scholar] [CrossRef]
- De Waard, C.; Lotz, U. Corrosion 93; NACE: Huston, TX, USA, 1993. [Google Scholar]
- De Waard, C.; Lotz, U.; Dugstad, A. Corrosion’95; Paper No. 128; NACE International: Houston, TX, USA, 1995. [Google Scholar]
- Nesic, S.; Nordsveen, M.; Nyborg, R.; Stangeland, A. Corrosion’2001; Paper No. 40; NACE: Houston, TX, USA, 2001. [Google Scholar]
- Hodgkiess, T.; Neville, A.; Shrestha, S. Electrochemical and mechanical interactions during erosion–corrosion of a high-velocity oxy-fuel coating and a stainless steel. Wear 1999, 233–235, 623–634. [Google Scholar] [CrossRef]
- Parsi, M.; Najmi, K.; Najafifard, F.; Hassani, S.; McLaury, B.S.; Shirazi, S.A. A comprehensive review of solid particle erosion modeling for oil and gas wells and pipelines applications. J. Nat. Gas Sci. Eng. 2014, 21, 850–873. [Google Scholar] [CrossRef]
- Levy, A.V. Solid Particle Erosion and Erosion-Corrosion of Materials; ASM International: Phoenix, AZ, USA, 1995. [Google Scholar]
- Finnie, I. Erosion of surfaces by solid particles. Wear 1960, 3, 87–103. [Google Scholar] [CrossRef]
- Hutchings, I. Prediction of the resistance of metals to erosion by solid particles. Wear 1975, 35, 371–374. [Google Scholar] [CrossRef]
- Dhar, S.; Krajac, T.; Ciampini, D.; Papini, M. Erosion mechanisms due to impact of single angular particles. Wear 2005, 258, 567–579. [Google Scholar] [CrossRef]
- Desale, G.R.; Gandhi, B.K.; Jain, S. Slurry erosion of ductile materials under normal impact condition. Wear 2008, 264, 322–330. [Google Scholar] [CrossRef]
- Malka, R.; Nešić, S.; Gulino, D.A. Erosion–corrosion and synergistic effects in disturbed liquid-particle flow. Wear 2007, 262, 791–799. [Google Scholar] [CrossRef] [Green Version]


Publisher’s Note: MDPI stays neutral with regard to jurisdictional claims in published maps and institutional affiliations. |
© 2022 by the authors. Licensee MDPI, Basel, Switzerland. This article is an open access article distributed under the terms and conditions of the Creative Commons Attribution (CC BY) license (https://creativecommons.org/licenses/by/4.0/).