1. Introduction
Cultural Heritage (CH) sites and monuments are highly impacted by Climate Change (CC) and related hazards, such as landslides. The deterioration of these monuments may cause significant adverse impacts on the economies, politics and societies of the historical areas around them [
1,
2]. The deterioration of CH sites is one of the biggest challenges in conservation. Aspects such as building technologies and materials, structural responses, preventive measures and restoration strategies, resilience and adaptation methodologies should be included in analysis. Currently, there is no specific process towards understanding and quantifying CC effects on historic areas or assessing quantitatively and qualitatively the impact of various climatic parameters on the CH sites. In order to better study the phenomenon of the deterioration patterns of building materials there is a need to identify the various building materials at study areas and study their physical and mechanical characterisation [
3]. Next, recession models should be enriched with critical factors, which have not been studied so far, related to the micro-climate of the area.
HYPERION [
4] aims to support the development of such models by utilizing IoT network devices, called smart tags, which will be installed within four historic study areas. The IoT sensor network is based on small, autonomous, unattended, reliable and long-life wireless devices that are deployed in certain selected parts of the CH site that will continuously monitor for environmental changes. The collected measurements will be used to improve a number of dynamical and statistical models that will provide climate and environmental change information to extract quantified risk information for the CH areas. In this paper the distributed smart sensor network that is deployed at the Cultural Heritage monuments in the four pilot cities are described. The network includes multiple smart tags that record specific measurement, based on the needed of the models, at the proximity of the Cultural Heritage monuments with different orientations aiming to provide the data needed for the study of the material degradation due to the climate conditions.
The monitoring of historic buildings and monuments is a complex challenge that has attracted a lot of research interest over the years. The majority of the conducted research has been focused on the assessment and the evaluation of the structural and material conditions of a monument, using basically optical methods, such as infrared photography [
5] and laser-induced fluorescence [
6]. Furthermore, accelerometers and vibration sensors have been developed and used to assess the vulnerability of a historical structure to geo-hazards, such as seismic events and landslides, and identify the damage inflicted by them [
7,
8].
In the same manner, climate change is a subject that interests and occupies the scientific and academic communities, especially nowadays that extreme phenomena related to it are occurring often. The rapid technological development and the introduction of the Internet of Things has encouraged scientists and developers to create smart and autonomous systems capable of recording specific environmental measurements. Plenty of the developed systems aim to assist the agriculture by monitoring the micro-climate and water parameters to control the irrigation [
9]. There are a few studies that focused on the development of micro-climate monitoring systems for cultural heritage structures and monuments. Most of these systems were deployed and tested on a specific monument, which was the main subject of study [
8,
10,
11]. In this paper, we introduce a network of multiple smart IoT sensors, customized for multiple cultural heritage monuments, aiming to monitor specific micro-climate parameters in the vicinity of these buildings’ walls.
Within the context of the HYPERION project, four cultural heritage sites across Europe have been selected as the main research areas. The selection of these areas was based on their historic and cultural interest, their exposure to extreme conditions, such as climate-change-related phenomena and geo-hazards, and their impact on the local communities and businesses. Specifically, the cultural heritage sites under investigation are the city of Rhodes in Greece, the city of Venice in Italy, the city of Granada in Spain and the city of Tonsberg in Norway.
Each one of these areas consists of multiple cultural heritage buildings and monuments have been categorized into tiers based on their research interest, their infrastructure and their availability for sensor installations. The Tier 1 buildings are structures of high importance for their area and offer permission of multiple sensor installations. These structures, presented in
Table 1, are the main study objects on the project. The monitoring of the micro-climate conditions and changes in the vicinity of the walls of the Tier 1 building is essential, in order to assist the assessment of potential impacts and their risk management. For that purpose, an IoT network consisted of multiple smart devices, called smart tags, needed to be developed and deployed on the Tier 1 buildings.
The contributions of the presented paper and the proposed developed smart IoT sensors network are the following:
The identification and presentation system requirements of an IoT device resulted by several constraints that can be evident in certain cultural heritage sites;
The description of the design and the development of an autonomous, power-efficient and weather-resistant IoT system capable of monitoring specific and reliable climate conditions and appropriate to be installed on a monument;
Assistance to the assessment of the deterioration of a cultural heritage building and the risks caused by specific weather phenomena on them by providing the gathered data.
2. System Architecture and Design
An essential step of the designing process of the sensors, that preceded the development was the assessment of the system requirements. For that purpose, a close interaction with the end-users and the partners was pursued via multiple bi-weekly and bilateral user and technical teleconferences. These teleconferences served as meeting points for the exchange of information regarding not only the nature and the form of the measurements needed but also the infrastructures that each pilot site provides. As a result, the design and development of the smart tags was proceeded according to the needs of each Tier 1 building. The lack of infrastructure, such as power and/or connectivity, has been taken into consideration in order to provide a reliable, power-efficient and weather-resilient solution. In detail, the identified and concluded system requirements are listed below:
Temperature measurements;
Relative humidity measurements;
Dew point temperature calculation;
Assessment of Dry/Wet state on the building’s walls;
Network autonomy—multiple network capabilities;
Power autonomy—multiple power sources, solar energy;
Long life operation—low power consumption, recharge capability;
Over the Air programming—firmware update;
Weather resistant—outdoor and indoor use;
Easy deployment;
Not intrusive installation;
Data Visualization platform.;
Scalability—custom-made hardware board and casing.
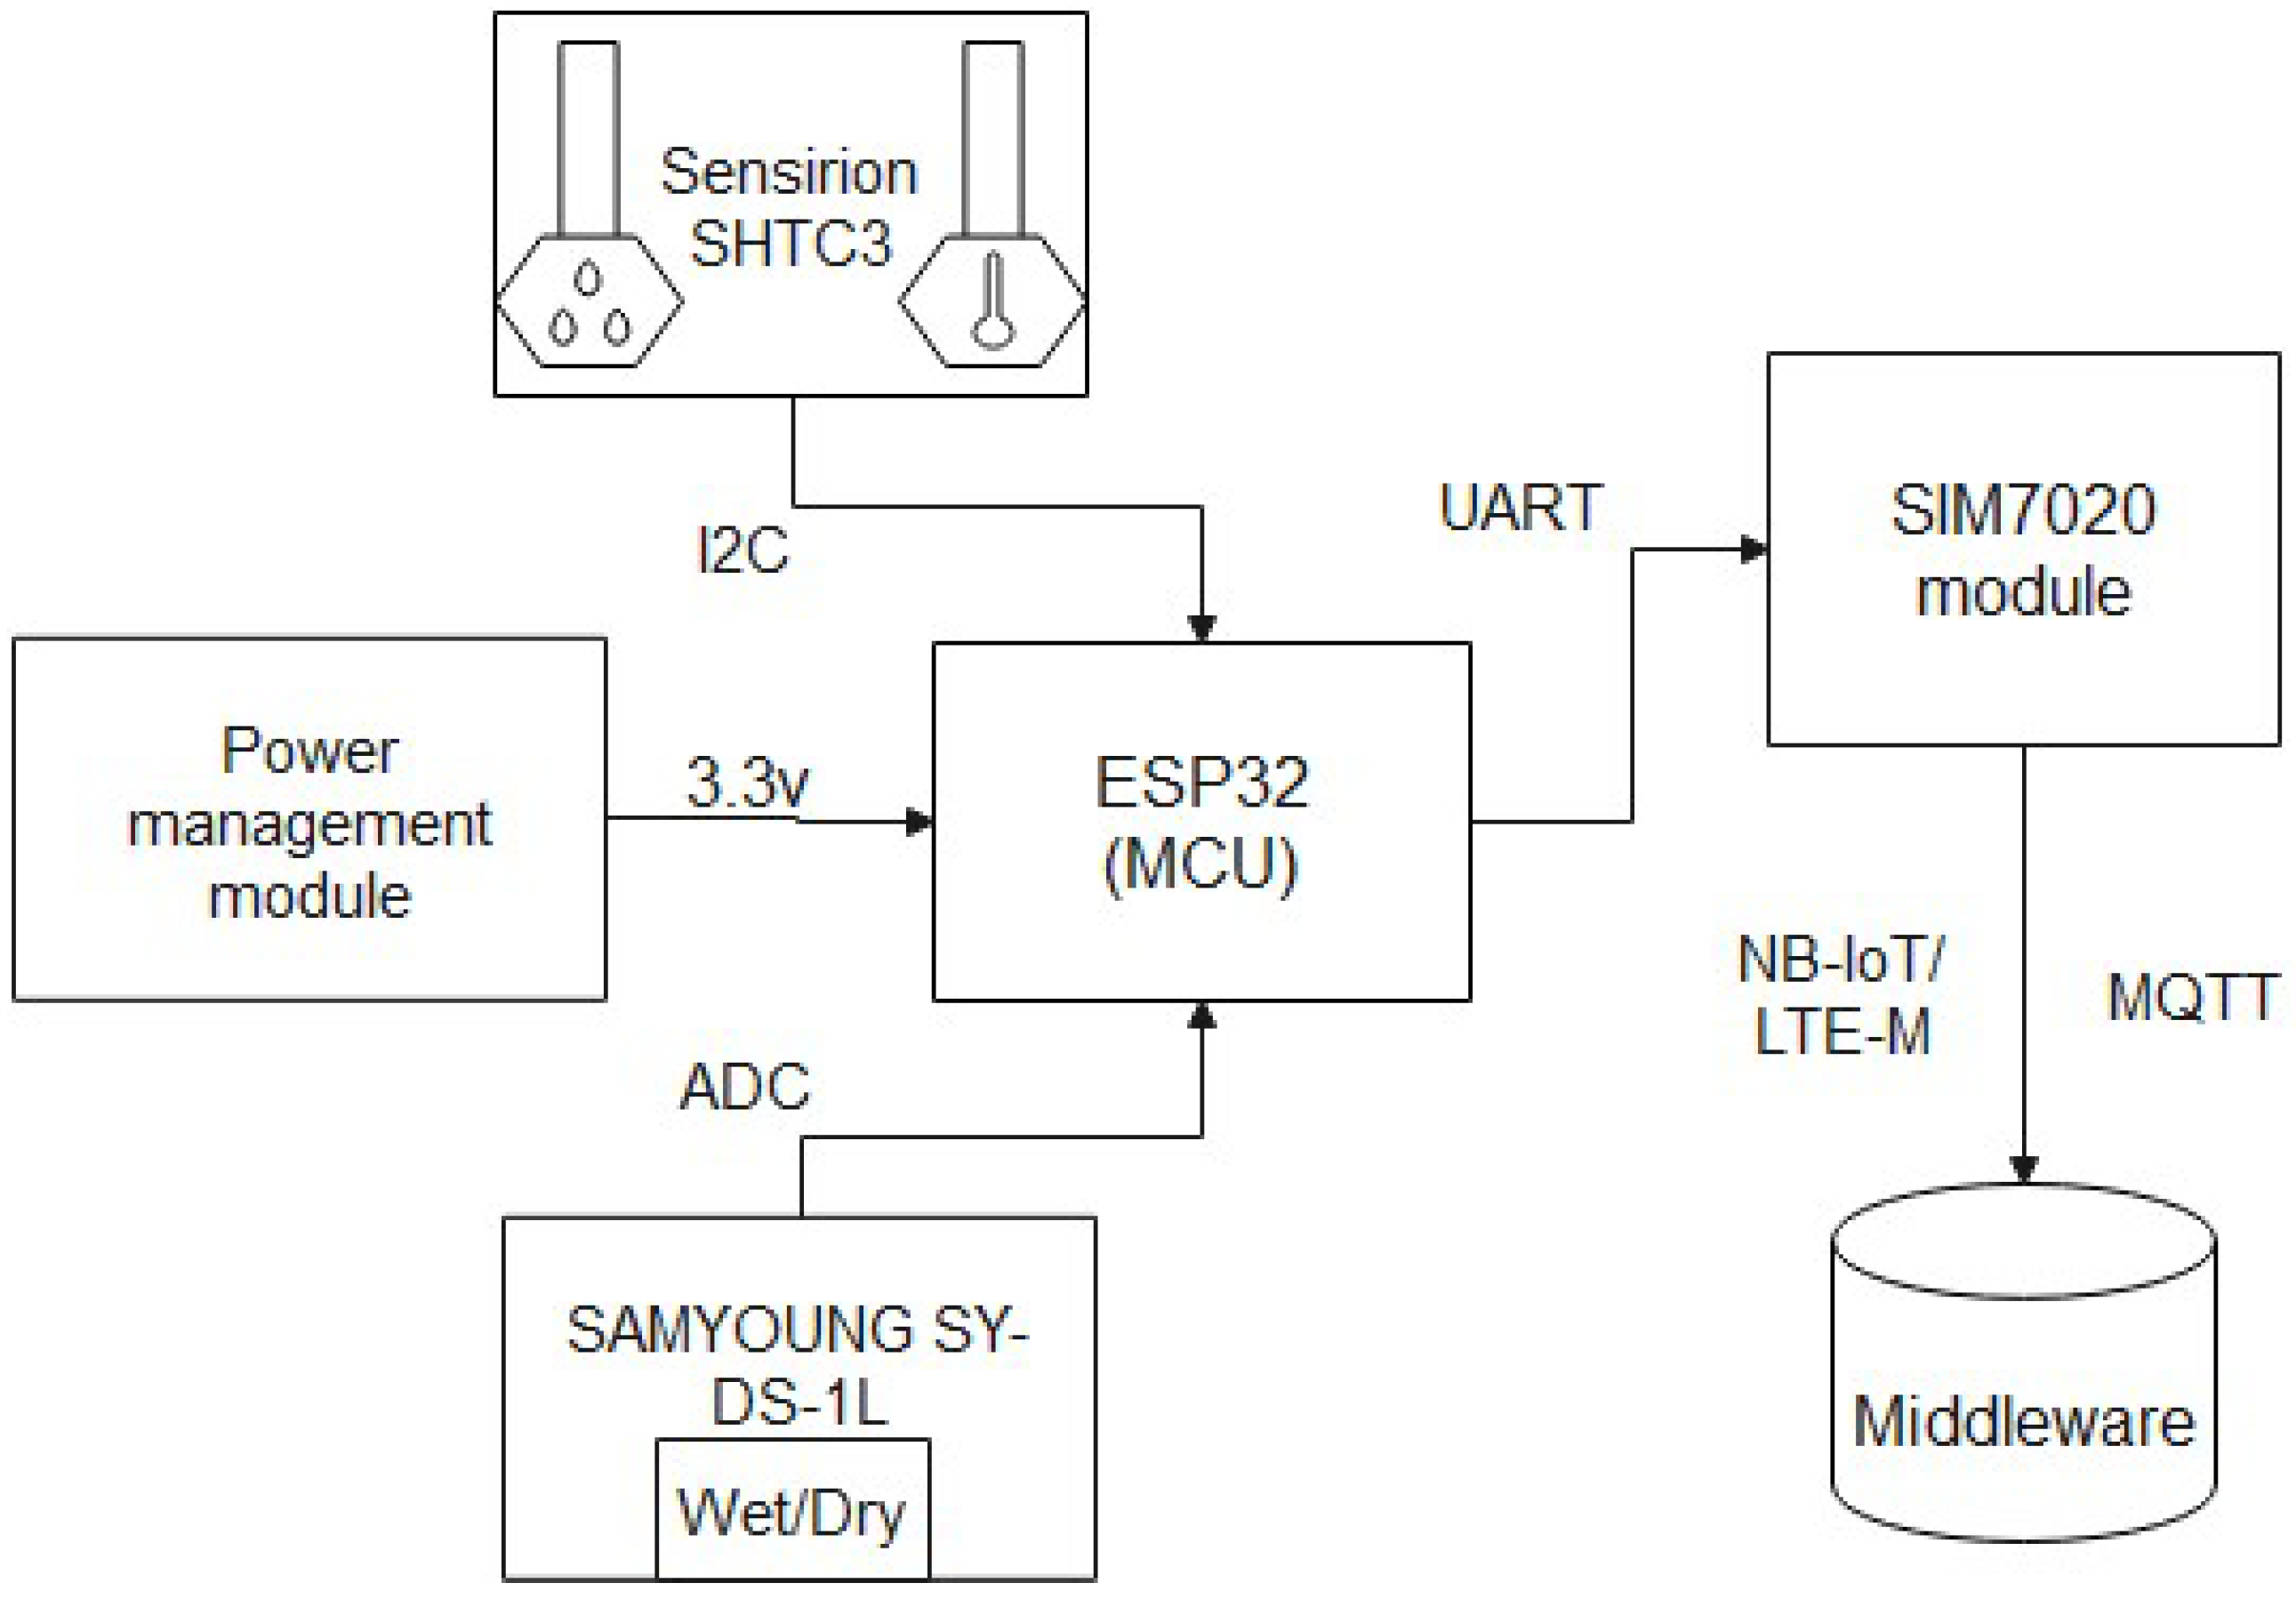
After analysing all the system requirements, the system architecture of the smart tag device was structured. The architecture is presented in
Figure 1 and is composed of the following components:
Main Processing Unit-ESP32: A low-power micro-controller that is the main processing unit of the device and supports multiple communication interfaces with the peripherals;
Environmental sensors: (i) Sensirion SHTC3 sensor measuring temperature and relative humidity and communicates with the main processing unit via I2C interface, (ii) Samyoung SY-DS-1L that is used for the definition of dry/wet state and communicates with the main processing unit via ADC bus;
Power management unit: Composed of a rechargeable battery, a solar panel, a charging module and a voltage regulator that supply the main processing unit with stable 3.3 V for its operation;
Network module: Simcom SIM7020 module offering NB-IoT connectivity over a 4G network and using the UART interface to communicate with the main processing unit;
Middle-ware: Gateway gathering the data transmitted from the SIM7030 module via the NB-IoT network and MQTT protocol. It is also hosting the visualization platform.
More details about the components and the hardware being used on the architecture are presented in
Section 2.2.
2.1. Functionalities and Firmware Integration
In order to satisfy the extracted system requirements, the functionalities of the smart tag was formed and integrated into the firmware of the device. The functionalities provided from the sensors are presented in
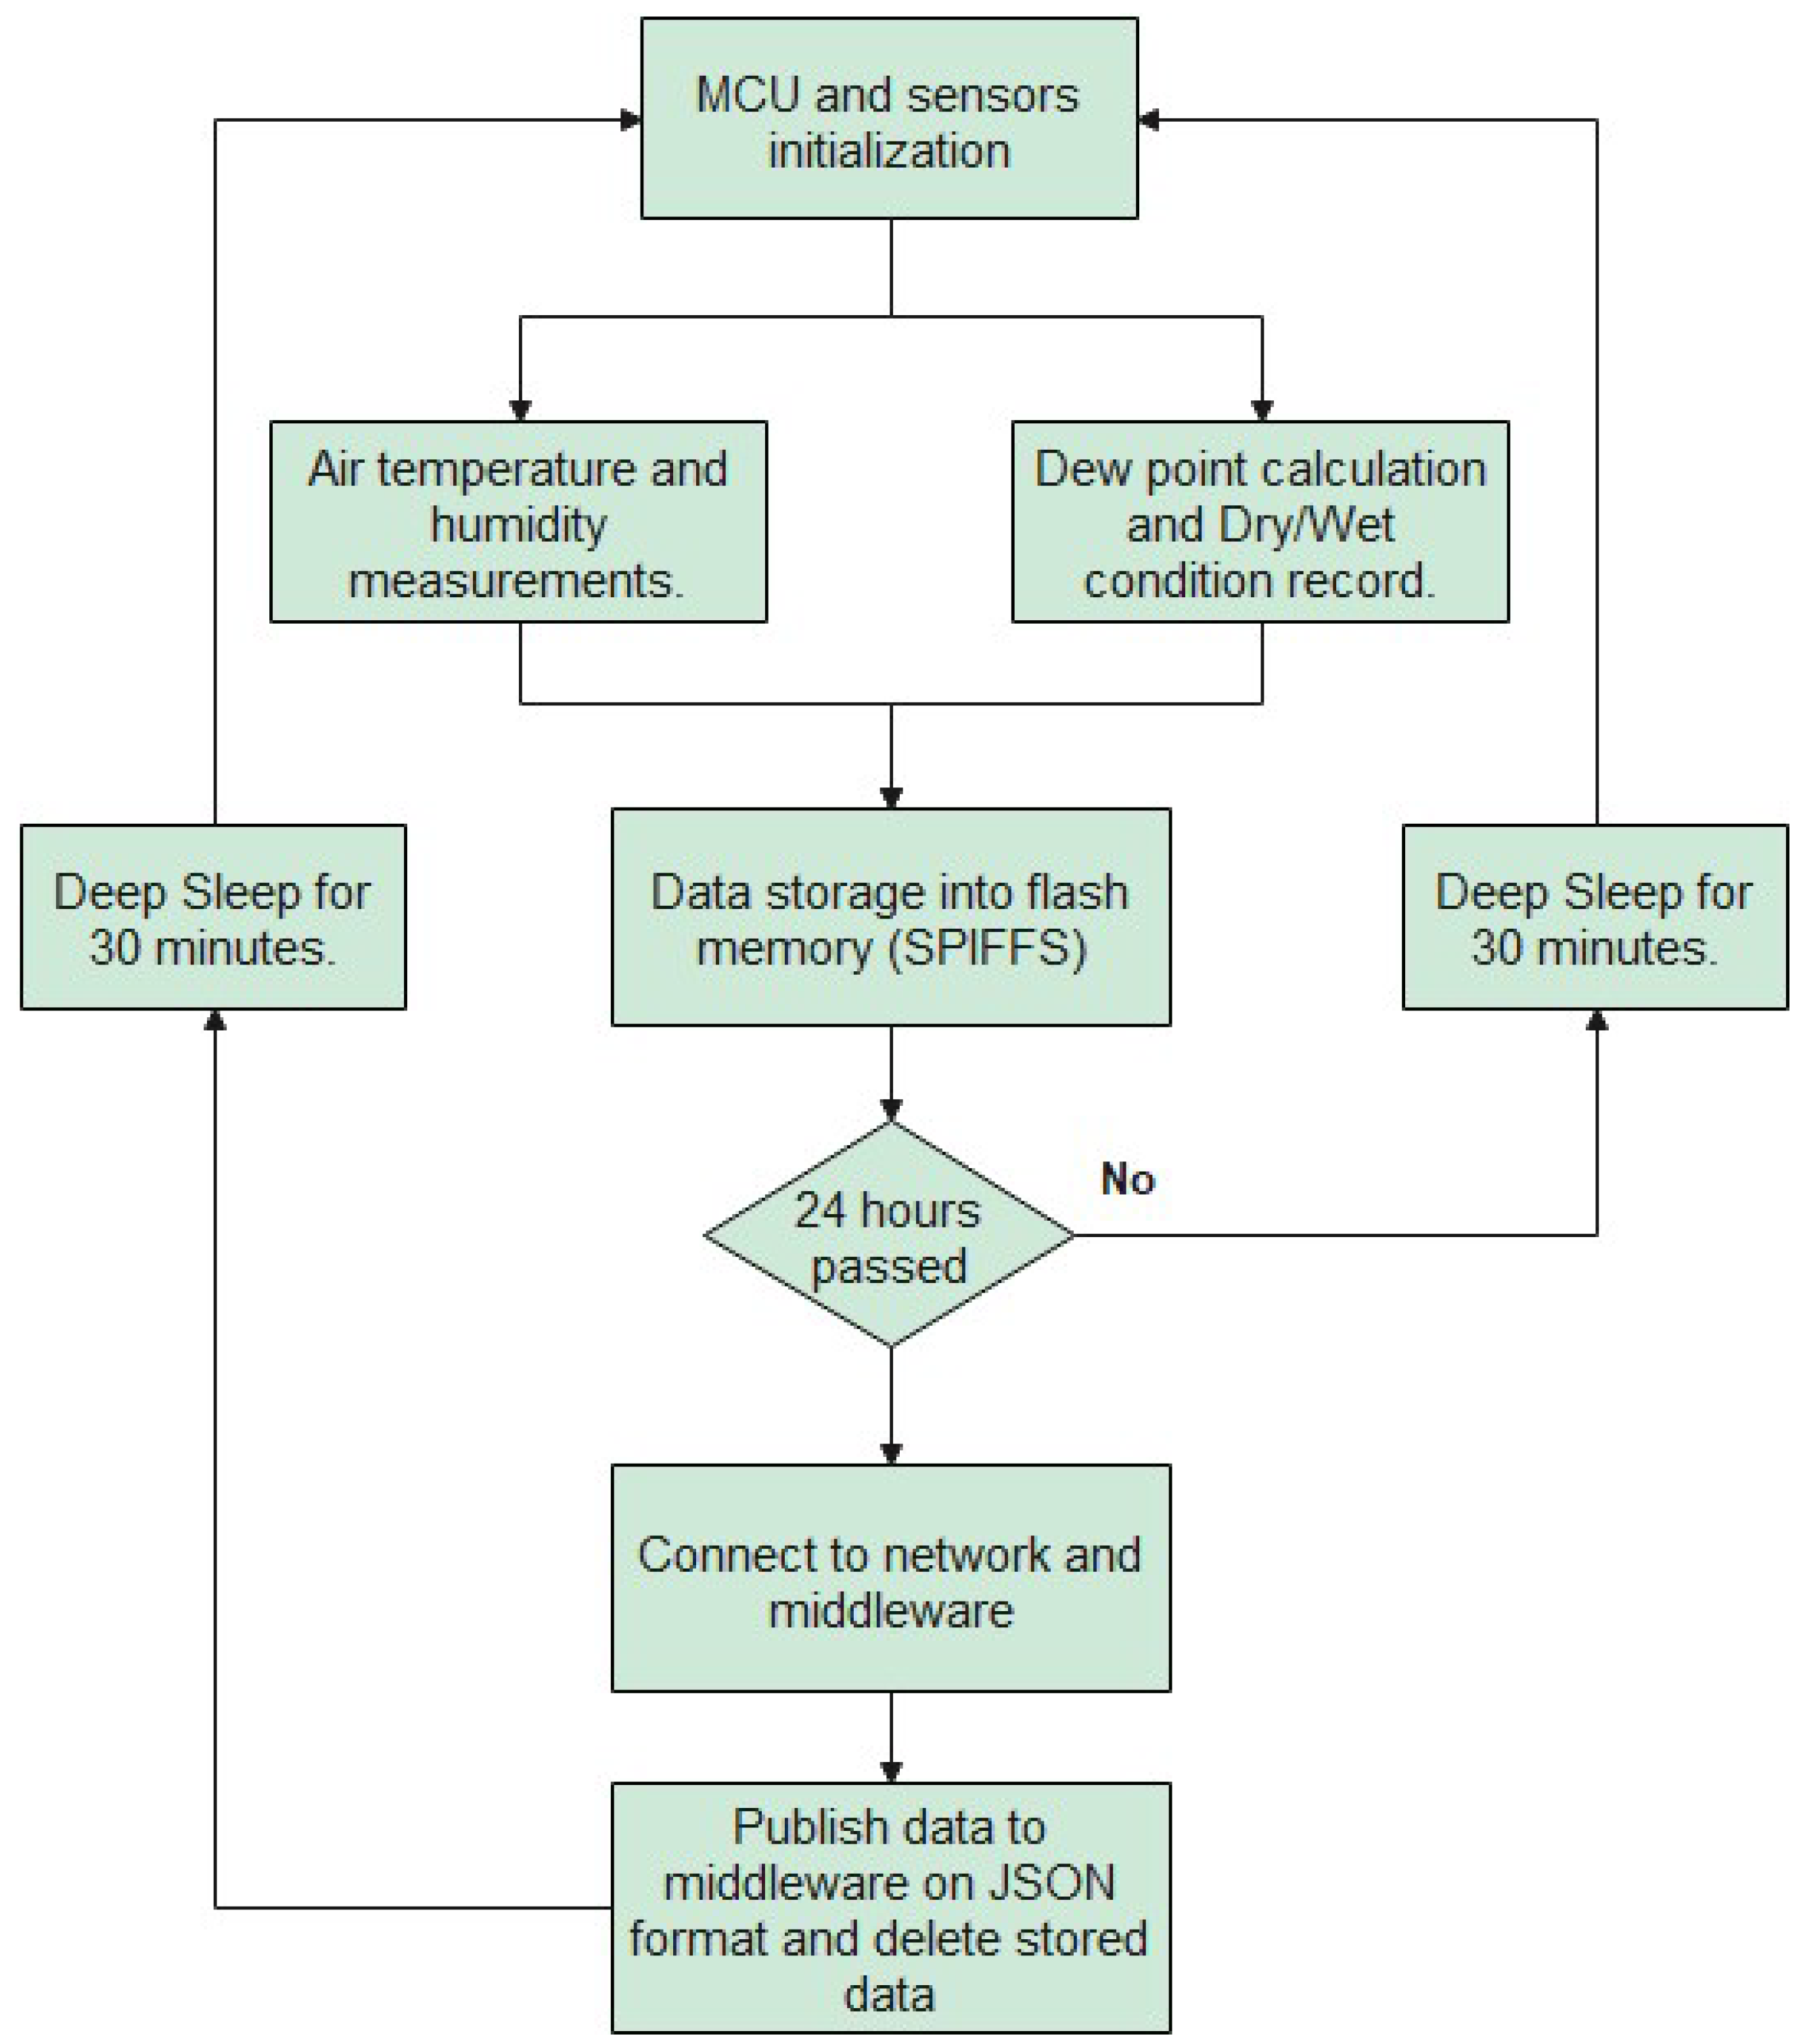
Table 2. Furthermore, the process flow diagram of the smart tags’ operation during a day is outlined in
Figure 2.
As it is presented in the process flow diagram, first, the connected sensors to the micro-controller unit (MCU) are initialized. Then, measurements of the air temperature and humidity are acquired and stored in the flash memory using the SPI Flash Filing System (SPIFFS). The maximum size of the data that can be stored is up to 1.5 MBytes. Next, the dew point is calculated, and the dry/wet condition is determined based on the resistance of the dew point sensor. These data are also stored on the flash memory.
When all the new environmental data have been stored, the MCU goes into deep sleep mode for 30 min to achieve very low power consumption. During the deep sleep mode, the CPU and all the digital peripherals, including the WiFi and Bluetooth module, are shut down, and only the ULP co-processor and RTC memory and peripherals are powered on.
In correspondence with the process flow diagram, after 30 min, the MCU wakes up from deep sleep and repeats the process of taking new measurements and storing them. When 24 h have passed, the stored data are formatted into a JSON file. The IDs of the smart tag and the building that it is deployed are added to the JSON, as well as the battery power level (0–100%) at the current time, provided by the battery monitor circuit. The MCU establishes a network connection and publishes the JSON file to the middle-ware via the MQTT protocol [
12]. Once the data are published successfully, the flash memory with the stored data is cleared, and the chip goes into deep sleep again for the next 30 min.
The smart tags support multiple networks and communication protocols, making them able to surpass some network restrictions that are evident in the pilot sites. More specifically, they support WiFi, Bluetooth and cellular Low-Power Wide-Area Networks (LPWAN), such as NB-IoT. The NB-IoT network is LPWAN radio technology standard developed by 3GPP for cellular devices and services in 2016. Numerous and extensive simulations have already been performed for different scenarios, proving that it is a reliable and flexible LPWAN technology for sensor applications even under challenging radio conditions [
13,
14]. NB-IoT is widely used for IoT applications and wireless sensor networks because they provide low cost, low-power and wide-area coverage [
15]. More specifically, the NB-IoT can offer the following:
Long-range connectivity:The operating range varies from a few kilometers to over 15 km in urban areas. They can also achieve data communications in indoor and underground locations;
Low cost: NB-IoT IS lightweight and demands lower hardware complexity and lower device cost;
Low power: It is optimized for power consumption. Sensors that transmit data using NB-IoT are able to run on small batteries for a long time.
All these characteristics and the fact that most of the pilot sites do not provide a WiFi network makes the NB-IoT network the most suitable network connection choice for our development.
In case that no NB-IoT network is available or the connection to that network is defective, the device can use any available WiFi network after it is configured properly. By pressing the reset button, the device goes into WiFi access point mode and displays an HTML configuration settings page. Then, the user can connect to that access point and select to which WiFi network it will be connected to each time to transmit the gathered data.
The firmware of the smart tags, which executes all the above operations, was implemented using the Arduino IDE. Arduino IDE is a software tool that can be used to program most of the commercial and widely known micro-controllers. It has been widely used by software developers over the years to develop a variety of systems, such as accurate accelerometers for monitoring structural vibrations [
16] and even wearable devices for the observation of the physical activity of COVID-19 patients [
17]. The smart tags can be reprogrammed with updated firmware and extended functionalities by a micro-USB port. The fact that the devices are distributed across Europe and placed on buildings’ walls makes the access to them difficult. For this reason, the smart tags support over-the-air firmware updates. The over-the-air programming can occur automatically every time the device connects to a WiFi network and only if a new version of the firmware is available.
2.2. Hardware Components
The smart tag includes an ESP32 micro-controller [
18], which is the main processing unit and hosts the sensors. The sensors connected to the smart tag are the Sensirion-SHTC3 [
19] and the SAMYOUNG SY-DS-1L [
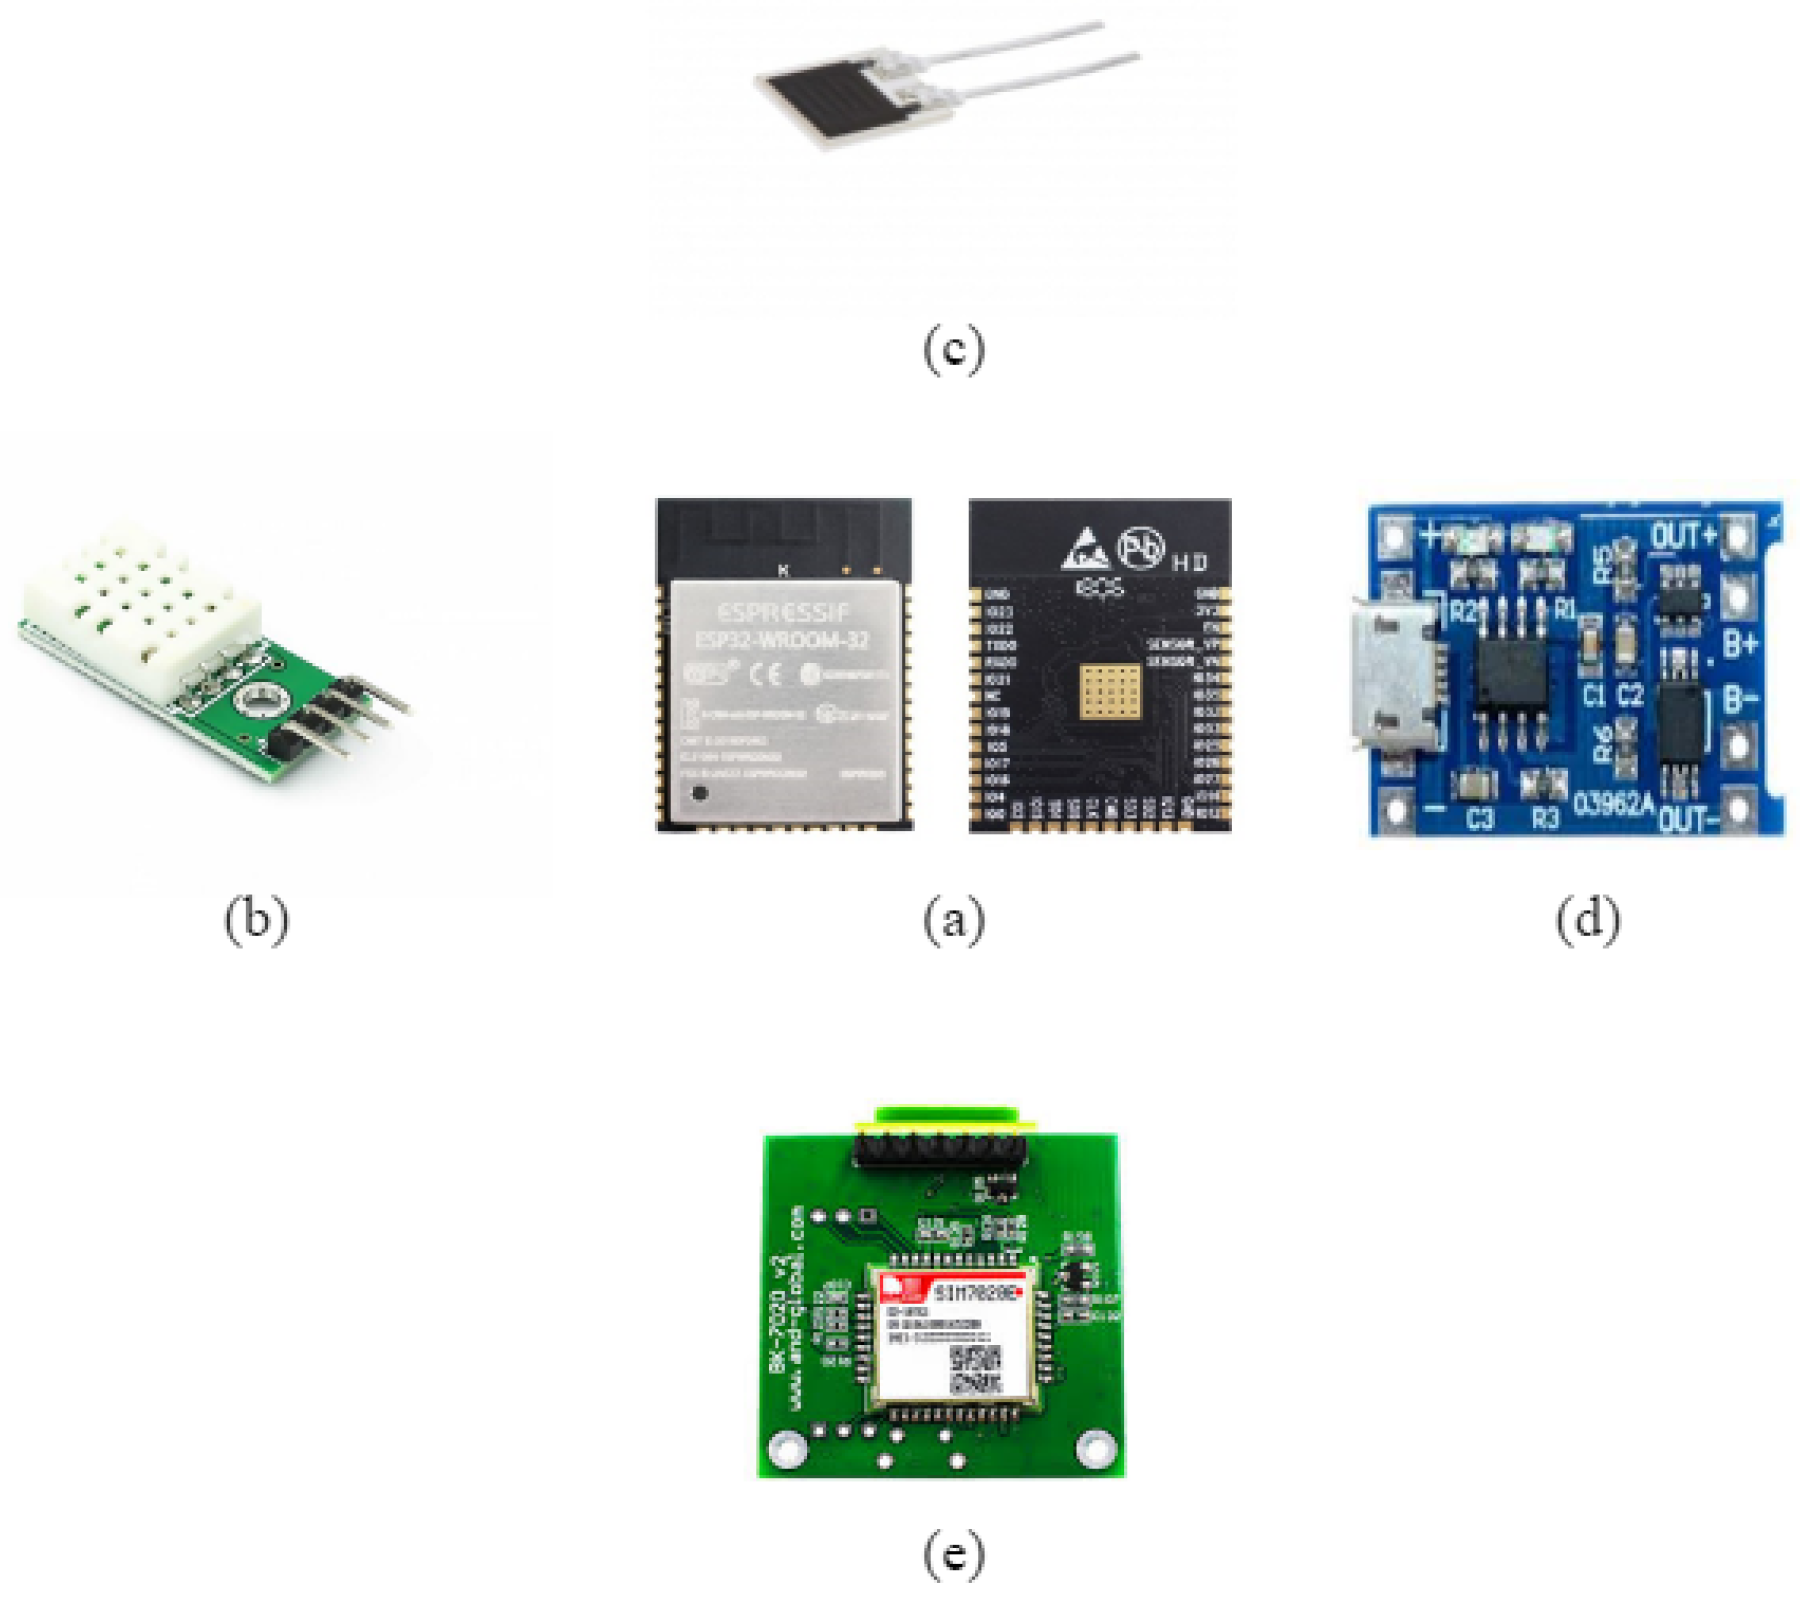
20]. Both sensors have been evaluated, and they record reliable measurements with high sensitivity. The Sensirion-SHTC3 provides air temperature and relative humidity measurements and has low power consumption. The SAMYOUNG SY-DS-1L is used to determine the wet/dry condition on the building walls. The smart tags connect to the middleware, where an MQTT broker is installed, as a client and publish the data via pub/sub MQTT protocol. The connection is established by the SIM7020 module that provides NB-IoT network connectivity. The smart tags are powered based on a power management module, including a rechargeable battery and a solar panel, to ensure that they meet the requirements for autonomy and long operational life. An external power source via micro-USB is also supported to ensure smart tag operation. The ESP32, shown in
Figure 3, is the main processing unit of the smart tags that controls all its functions. It is a low-cost solution that includes a powerful Xtensa 32-bit LX6 Dual-core processor, it has sufficient memory, it supports WiFi and Bluetooth connection and it can be configured to be low powered. The specifications are as follows:
Xtensa 32-bit LX6 Dual-core processor and Ultra low power co-processor;
WiFi (2.4 GHz–2.5 GHz), Bluetooth 4.1—BLE;
448 KB ROM, 520 KB SRAM, 16 KB SRAM in RTC;
Current Consumption: WiFi Tx packet: 160–260 mA, Idle mode: 30 mA, Deep-Sleep: A;
Operating temperature: −40 °C to +85 °C.
Sensirion-SHTC3, shown in
Figure 3, is a low-cost digital sensor that measures the temperature and relative humidity with high accuracy. The chip consists of a capacitive humidity sensor, a bandgap temperature sensor, analog and digital signal processing, an A/D converter and calibration data memory. The communication with the ESP32 is managed with the digital, fast communication interface I2C. SHTC3 has also the capability to be set into a low power mode when it is not used. The specifications are as follows:
Temperature: −40 to +125 °C ± 0.2 °C;
Humidity: 0–100% ± 2.0% RH;
Current Consumption: Measurement (Low power mode): 270–570 A, Sleep mode: 0.3–0.6 A, Average (one measurement per second): A.
SAMYOUNG SY-DS-1L, shown in
Figure 3, is a resistive analog dew sensor with a resistivity that increases exponentially with the relative humidity. The dry/wet condition of the walls can be determined based on the increase in the sensor’s resistivity. If the resistivity is increased exponentially, the condition is wet; otherwise, it is dry. The threshold is determined based on sensor characteristics. The communication with the ESP32 is established via the ADC port to convert the analog value of the sensor into a digital measured value using firmware. The specifications are as follows:
Humidity: 0–100% RH;
Current consumption: A;
Standard characteristics: 10 k Max. at 80% RH, 100 k Max. at 93% RH, 200 k Max. at 88% RH.
The power management unit consists of a rechargeable Li-Ion 18650 3000 mAh battery, a 6 V–1.2 W solar panel, a TP4056, shown in
Figure 3, charging module responsible for the battery protection and the charging of the battery using the solar power and, lastly, a voltage regulator that powers the ESP32 with steady voltage of 3.3 V from the battery. With a 3000 mAh battery, the smart tag can operate for about 6 months without sunlight. Using the solar energy to recharge the battery, the operational life of the smart tag can be further extended. The specifications are as follows:
Voltage Supply: 4.5 to 5.5 V;
Battery protection;
Output charging current: 1 A adjustable;
Output voltage: 3.7–4.2 V;
Charge precision: 2%.
The SIM7020 module, shown in
Figure 3, provides LPWAN and specifically NB-IoT connectivity to the smart tag. Using this module, the smart tags are capable of transmitting the recorded data to the middle-ware in all four pilot sites. The SIM7020 is designed for applications that need low latency and low throughput data communication. In addition, it is low-powered and low-cost, which makes it very suitable for our case. The communication with the main MCU is established through a UART interface and AT commands. The module provides the following:
Frequency bands: B1/B3/B5/B8/B20/B28;
Voltage Supply: 2.1–3.6 V;
UART interface;
Current Consumption: (i) Idle Mode: 5.6 mA, (ii) Power Save Mode: 3.4 A, (iii) Sleep Mode: 0.4 mA;
Supported communication protocols: TCP, UDP, HTTP, HTTPS, NTP, COAP, MQTT etc.;
Embedded AT commands;
Micro SIM card.
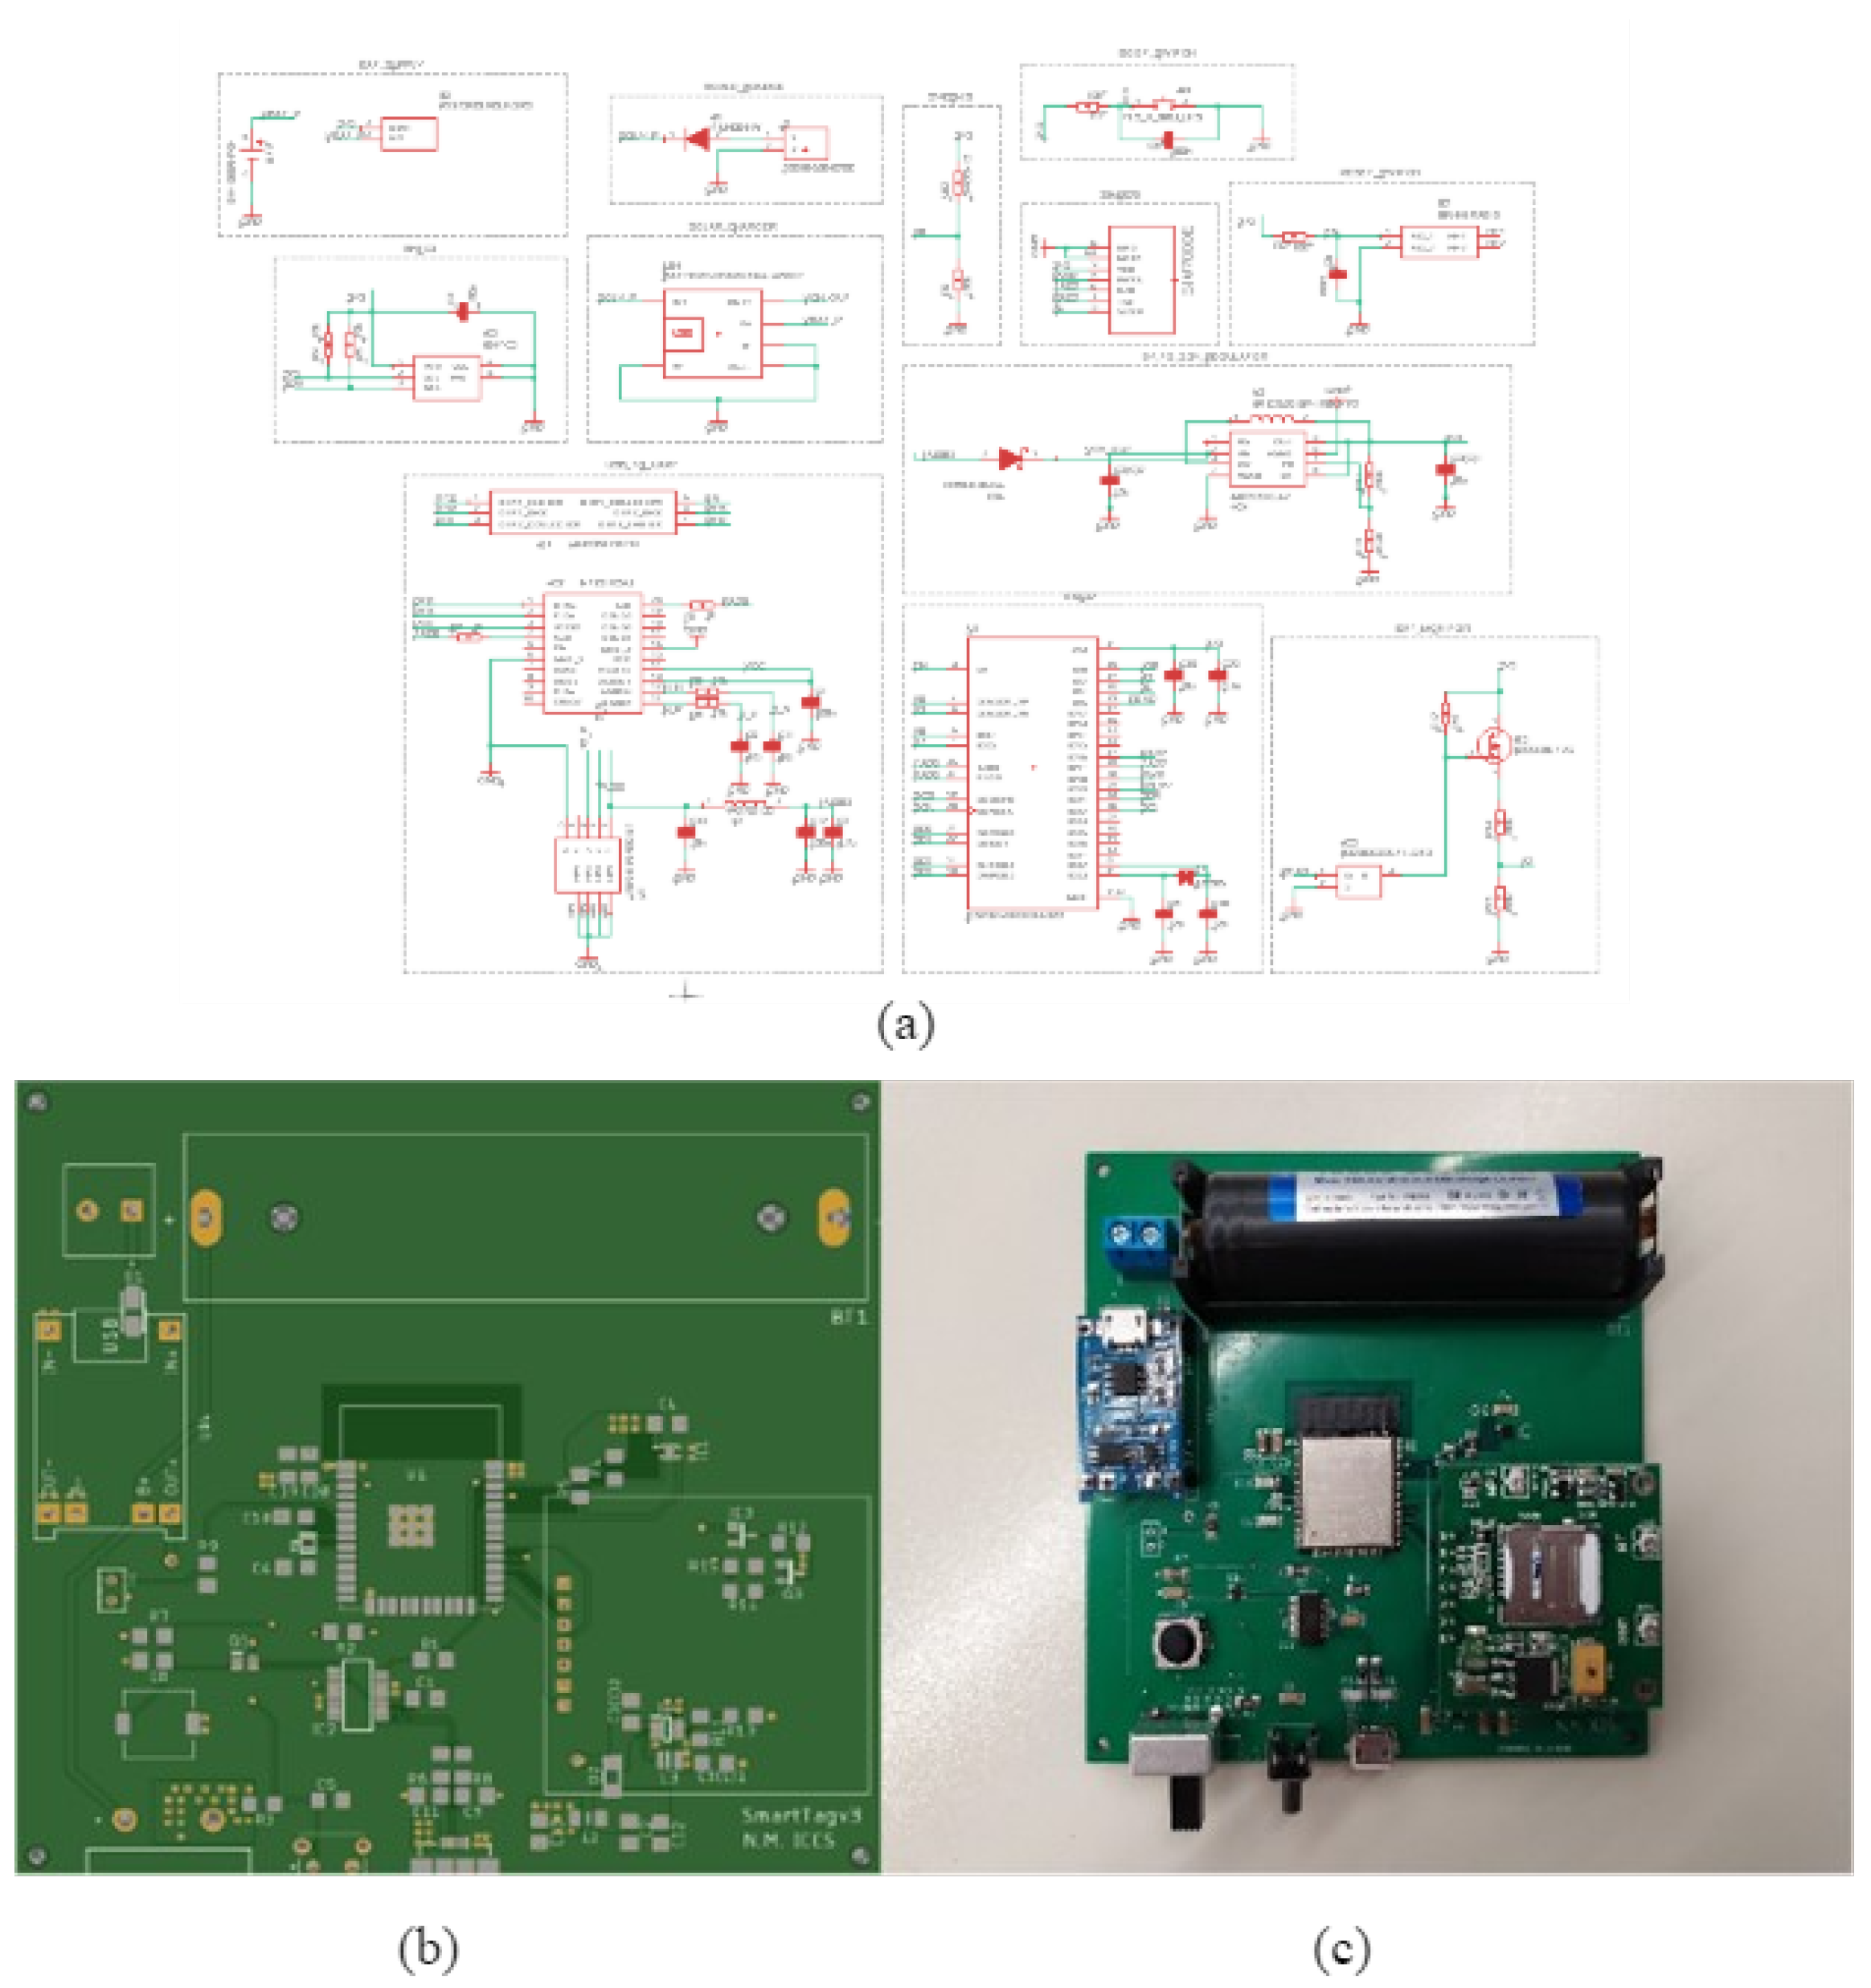
2.3. Printed Circuit Board Design
For the reliable mass production of smart tag devices, a Printed Circuit Board (PCB) has been designed with the purpose to:
Reduce the time cost by automating the production process;
Reduce the total cost of the device. A cost reduction of about EUR 15 has been achieved;
Increase the reliability and sustainability of the board.
The PCB includes all the necessary components, including the SIM2070 module, and was implemented using the Autocad Eagle design tool. The schematic of the PCB is presented in
Figure 4.
In detail, the developed PCB of the smart tags is composed of the below main components (group blocks in the schematic):
The ESP32 microcontroller which is the main processing unit of the device, along with decoupling capacitors and a 32.768 kHz ABS05 crystal;
The USB to UART module, which consists of a FT231X chip, a micro-USB port, a UMH3N dual digital transistor and decoupling capacitors and resistors. The USB to UART module enables the MCU to be programmed via USB and can provide power the device when the battery is not available;
The voltage regulator, which includes an MP2161 chip, a diode and decoupling capacitors. The voltage regulator provides steady voltage supply of 3.2–3.3 V to the ESP32 from the battery or the USB;
The SIM7020 module that provides cellular LPWAN connection to the device and communicates with the ESP32 via the UART interface;
The SHTC3 module, which consists of the SHTC3 sensor and pull up resistors. The sensor measures temperature, relative humidity and dew point;
The SY-DS-1L sensor with a resistor that is used to define the Dry/Wet state of the walls;
The battery monitor circuit that includes P-MOS and N-MOS transistors and a voltage divider. It is used to monitor the battery power level;
The TP4056 solar charger module that charges the battery using solar energy by the solar panel;
The battery and the power switch that turn on/off the device;
The reset and boot buttons that restart the ESP32.
The printing of the PCB was implemented by a PCB manufacturer. The PCB includes surface mount technology (SMT) components and through hole components. The SMT assembly was implemented by a re-flow oven and the through hole components were soldered to the PCB by hand. The finalized PCB board before and after the placement and soldering of SMT and through hole components is presented in
Figure 4.
2.4. 3D-Printed ABS Enclosure
The smart tag case is designed using the AUTODESK Fusion 360 software tool and printed by an Original Prusa i3 MK3S 3D printer. It is constructed using ABS filament and it has an IP56 rating, which means that it is waterproof and suitable for the required environmental conditions. The case is designed to be a compact element that contains the smart tag board and the battery in the interior space and the solar panel and cellular network antenna in the exterior. The color is white in order to absorb as little heat as possible. There are also small openings on the front and on the sides of the case to enable air circulation through the sensors and allow for reliable measurements. These openings are covered on the top and on the side to protect the electronics in the interior from weather phenomena such as rain and snow. As a result, the smart tag is a compact, relatively small and weather-resistant device. The design of the case along with its dimensions are depicted in
Figure 5.
2.5. Visualization Platform
The main purpose of the Smart Tag is to inform the end-users about the micro- climate in the vicinity of the installation points and provide them the ability to monitor live weather conditions and changes. In order to achieve that, a user- friendly visualization platform has been implemented that provides all the data measured by the Smart Tag Communication Protocol. As already discussed, the acquired measurements are stored in the Smart Tag’s flash memory and then published to the server on a daily basis. The communication protocol used for the data transmission is the MQTT messaging protocol. MQTT is a publish/subscribe network protocol that provides bi-directional connections between devices. The MQTT protocol has been chosen over other protocols, e.g., HTTP, because it is a lightweight solution that requires minimal network bandwidth and achieve faster throughput. Furthermore, it offers lower complexity with basic functionalities such as connect, publish, subscribe, disconnect and transfers data as a byte array, which is perfect for resource-constrained devices such as a Smart Tag. A RabbitMQ MQTT broker is installed on the gateway, where the data are gathered and processed. The RabbitMQ broker was chosen because it is open source, lightweight and easily deployed.
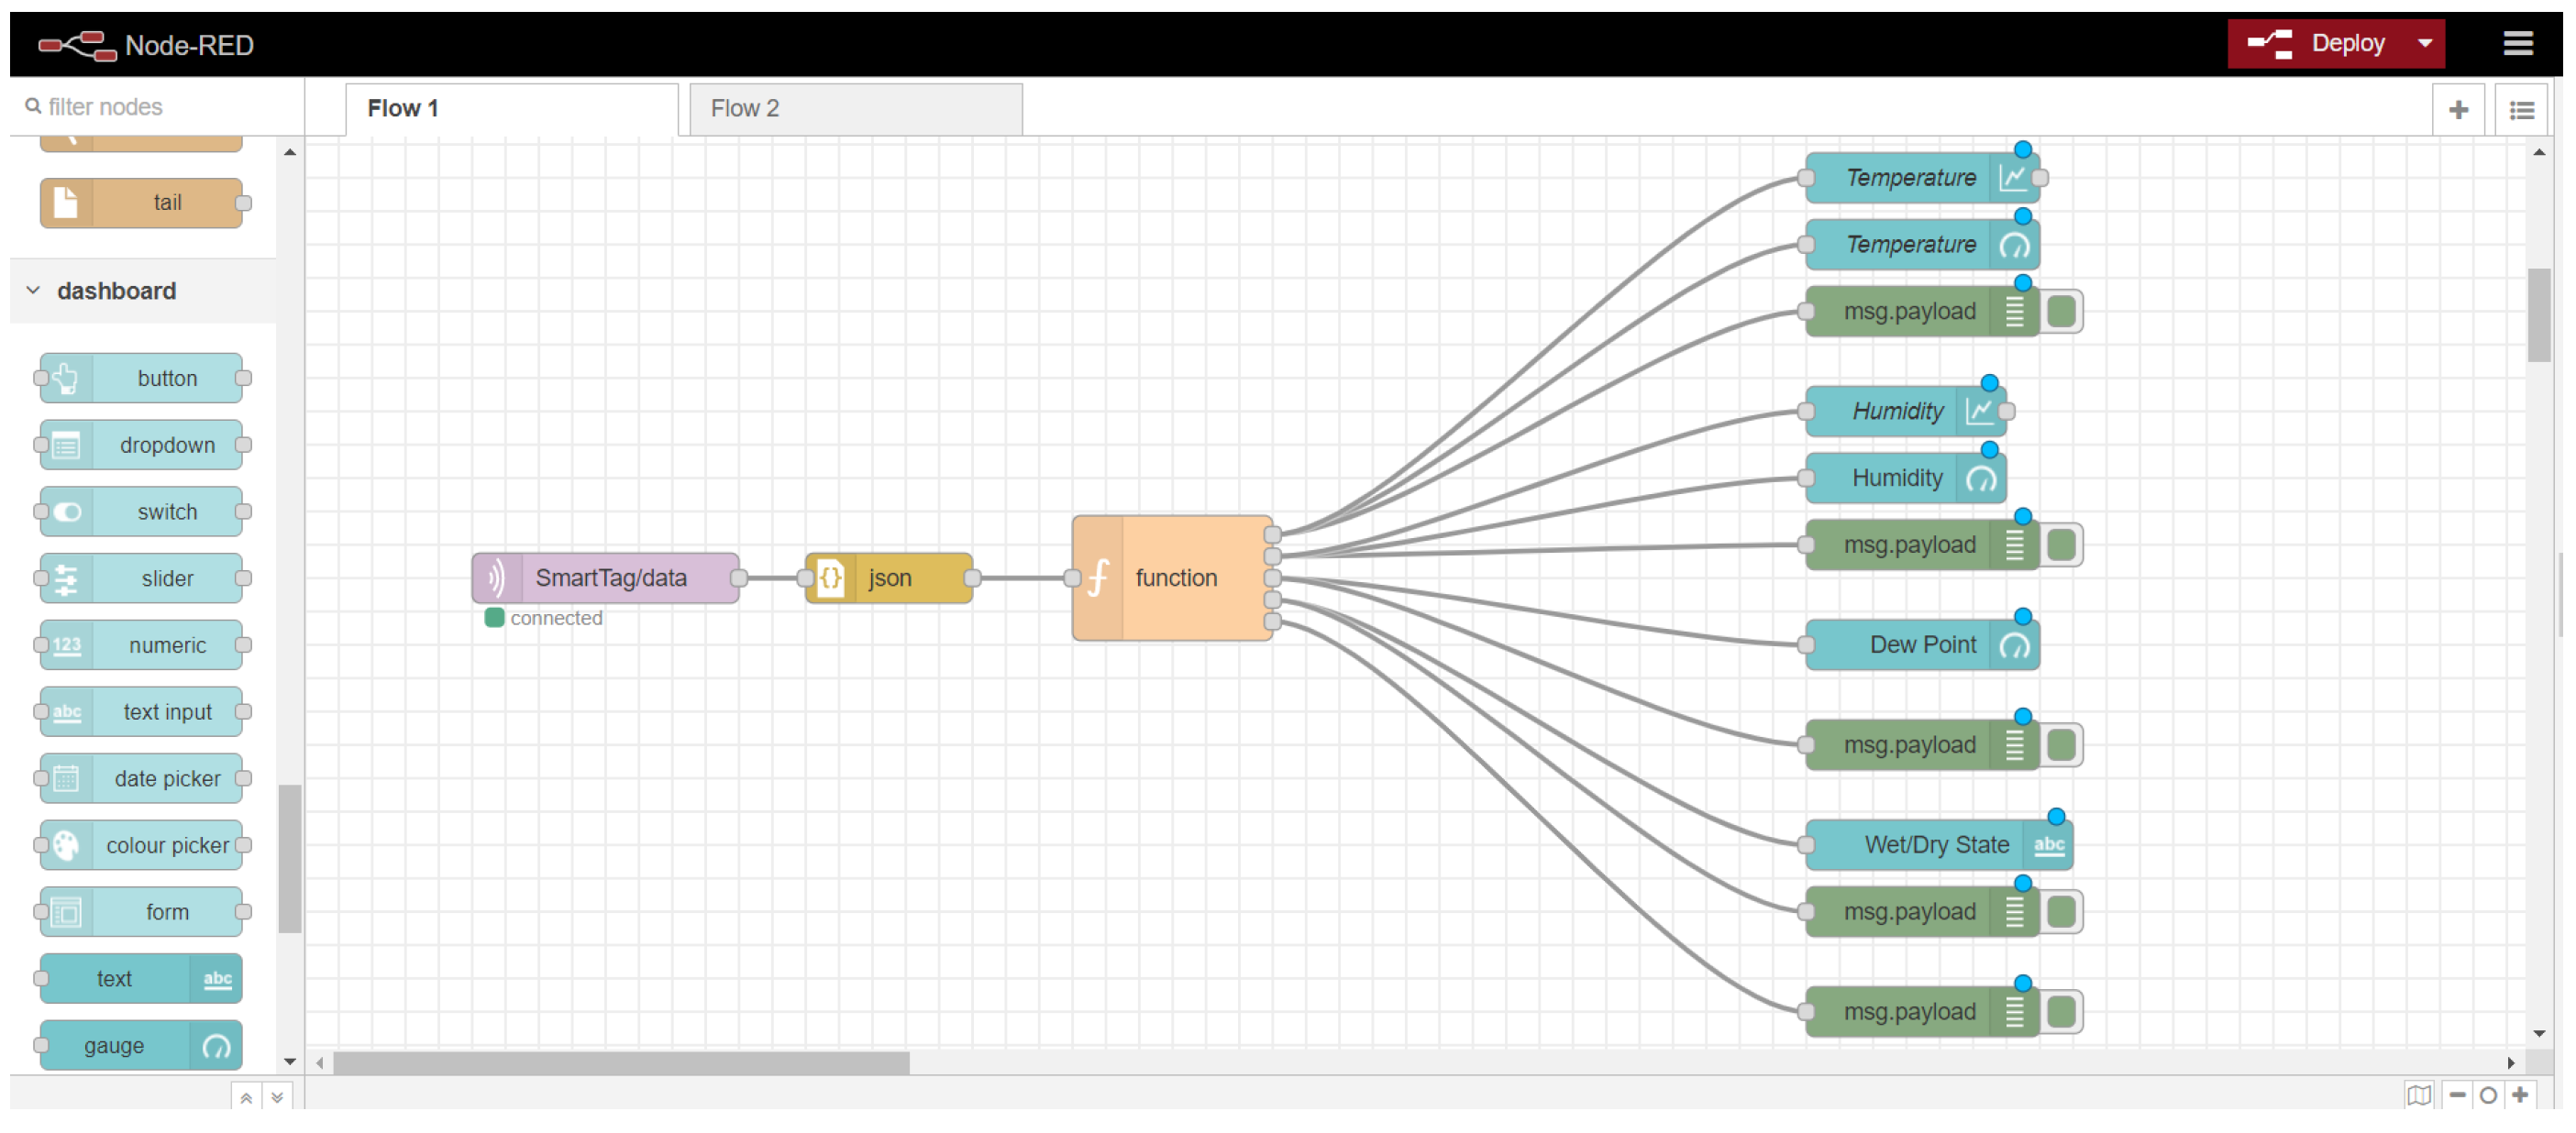
The user interface is designed to present all measured data in a precise, user-friendly and simply developed way. For that purpose, the Node-RED framework is installed and used on the gateway. Node-RED is an open source programming tool for developing application interfaces and online services [
21]. It provides a browser-based visual programming interface that allows the developer to use and connect nodes, instead of writing code, and as a result, it reduces the complexity of the development. Each node execute a process and all the nodes wired together form a flow, which is the whole program. The flow of the Smart Tag’s UI is composed of an MQTT input node that receives the measurements from the Smart Tag, a JSON parser, a node that process the data and the output nodes that visualize each measurement. The designed flow is outlined in
Figure 6.
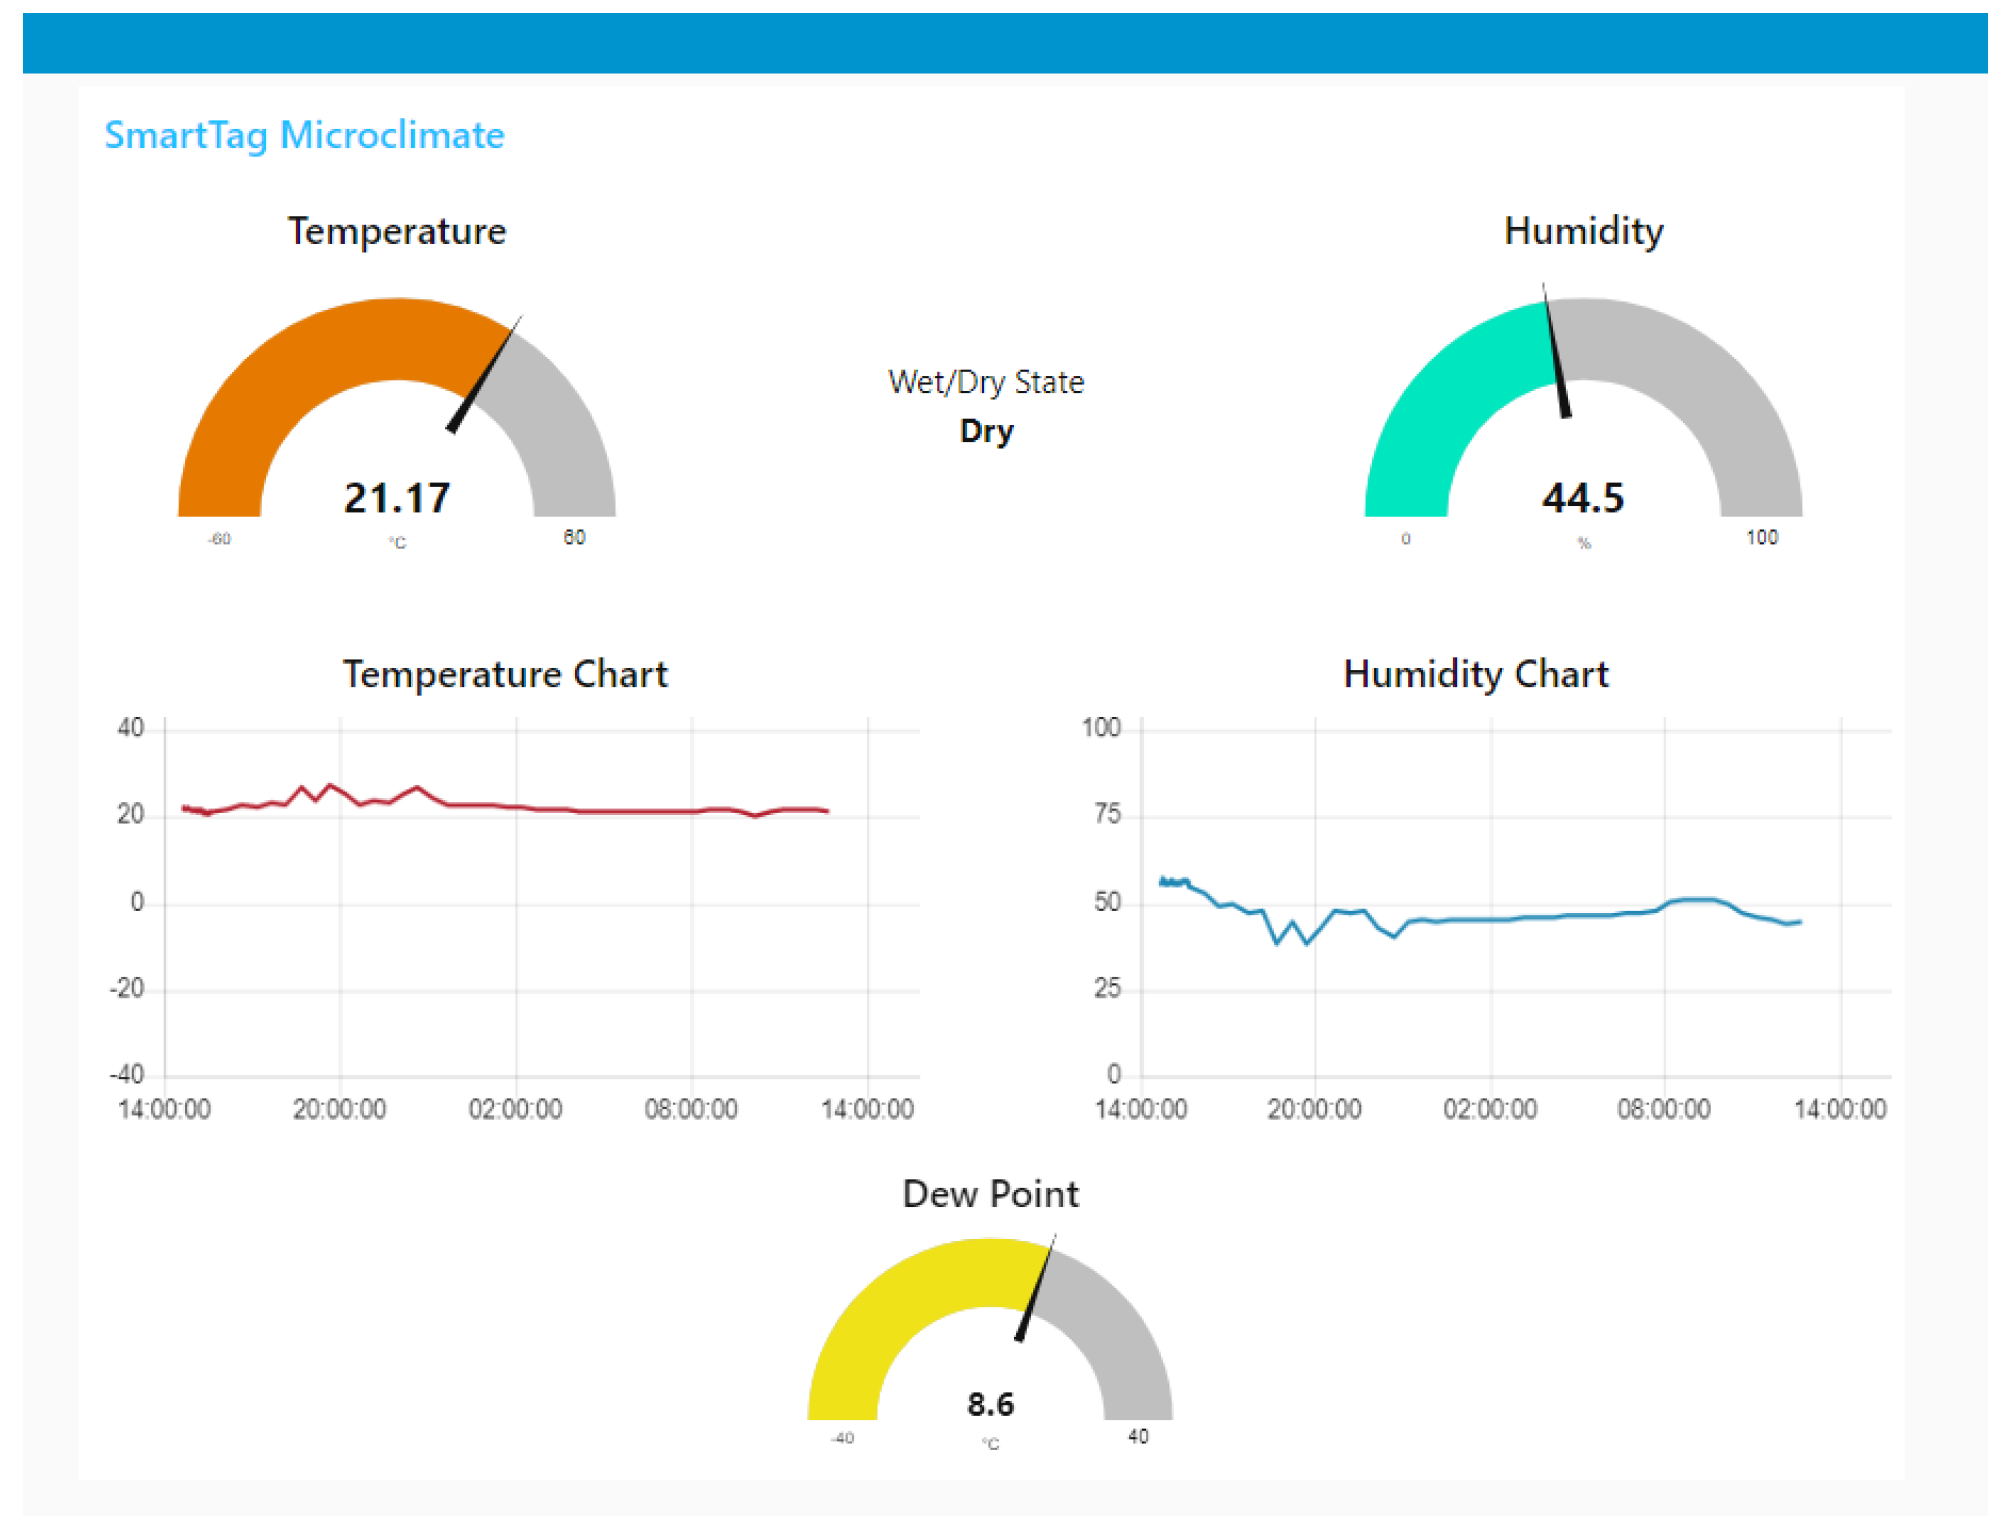
The Node-RED dashboard is a module that provide specific nodes for the live visualization of the data. The designed dashboard is composed of temperature, humidity and dew point gauges with the live measurements, temperature and humidity charts that visualize all measured data during a day and the Dry/Wet state of the walls. The UI is presented in
Figure 7.
3. System Testing
Some of the basic functionalities and system requirements of the developed monitoring system is the connectivity and the power efficiency. Regarding the connectivity, the main restriction on the CH sites is the fact that no WiFi networks were provided on most of the Tier 1 buildings. Furthermore, the need of a low power network suitable for IoT applications was evident due to the fact that the installed sensor must operate for more than 6 months. Regarding the power efficiency, many of the Tier 1 buildings are lacking a power source capability, so other power sources should be used. In order to conclude the most appropriate solutions for the two described problems and reassure the correct operation of the developed system through time, specific tests were performed and presented in this section.
3.1. NB-IoT Network
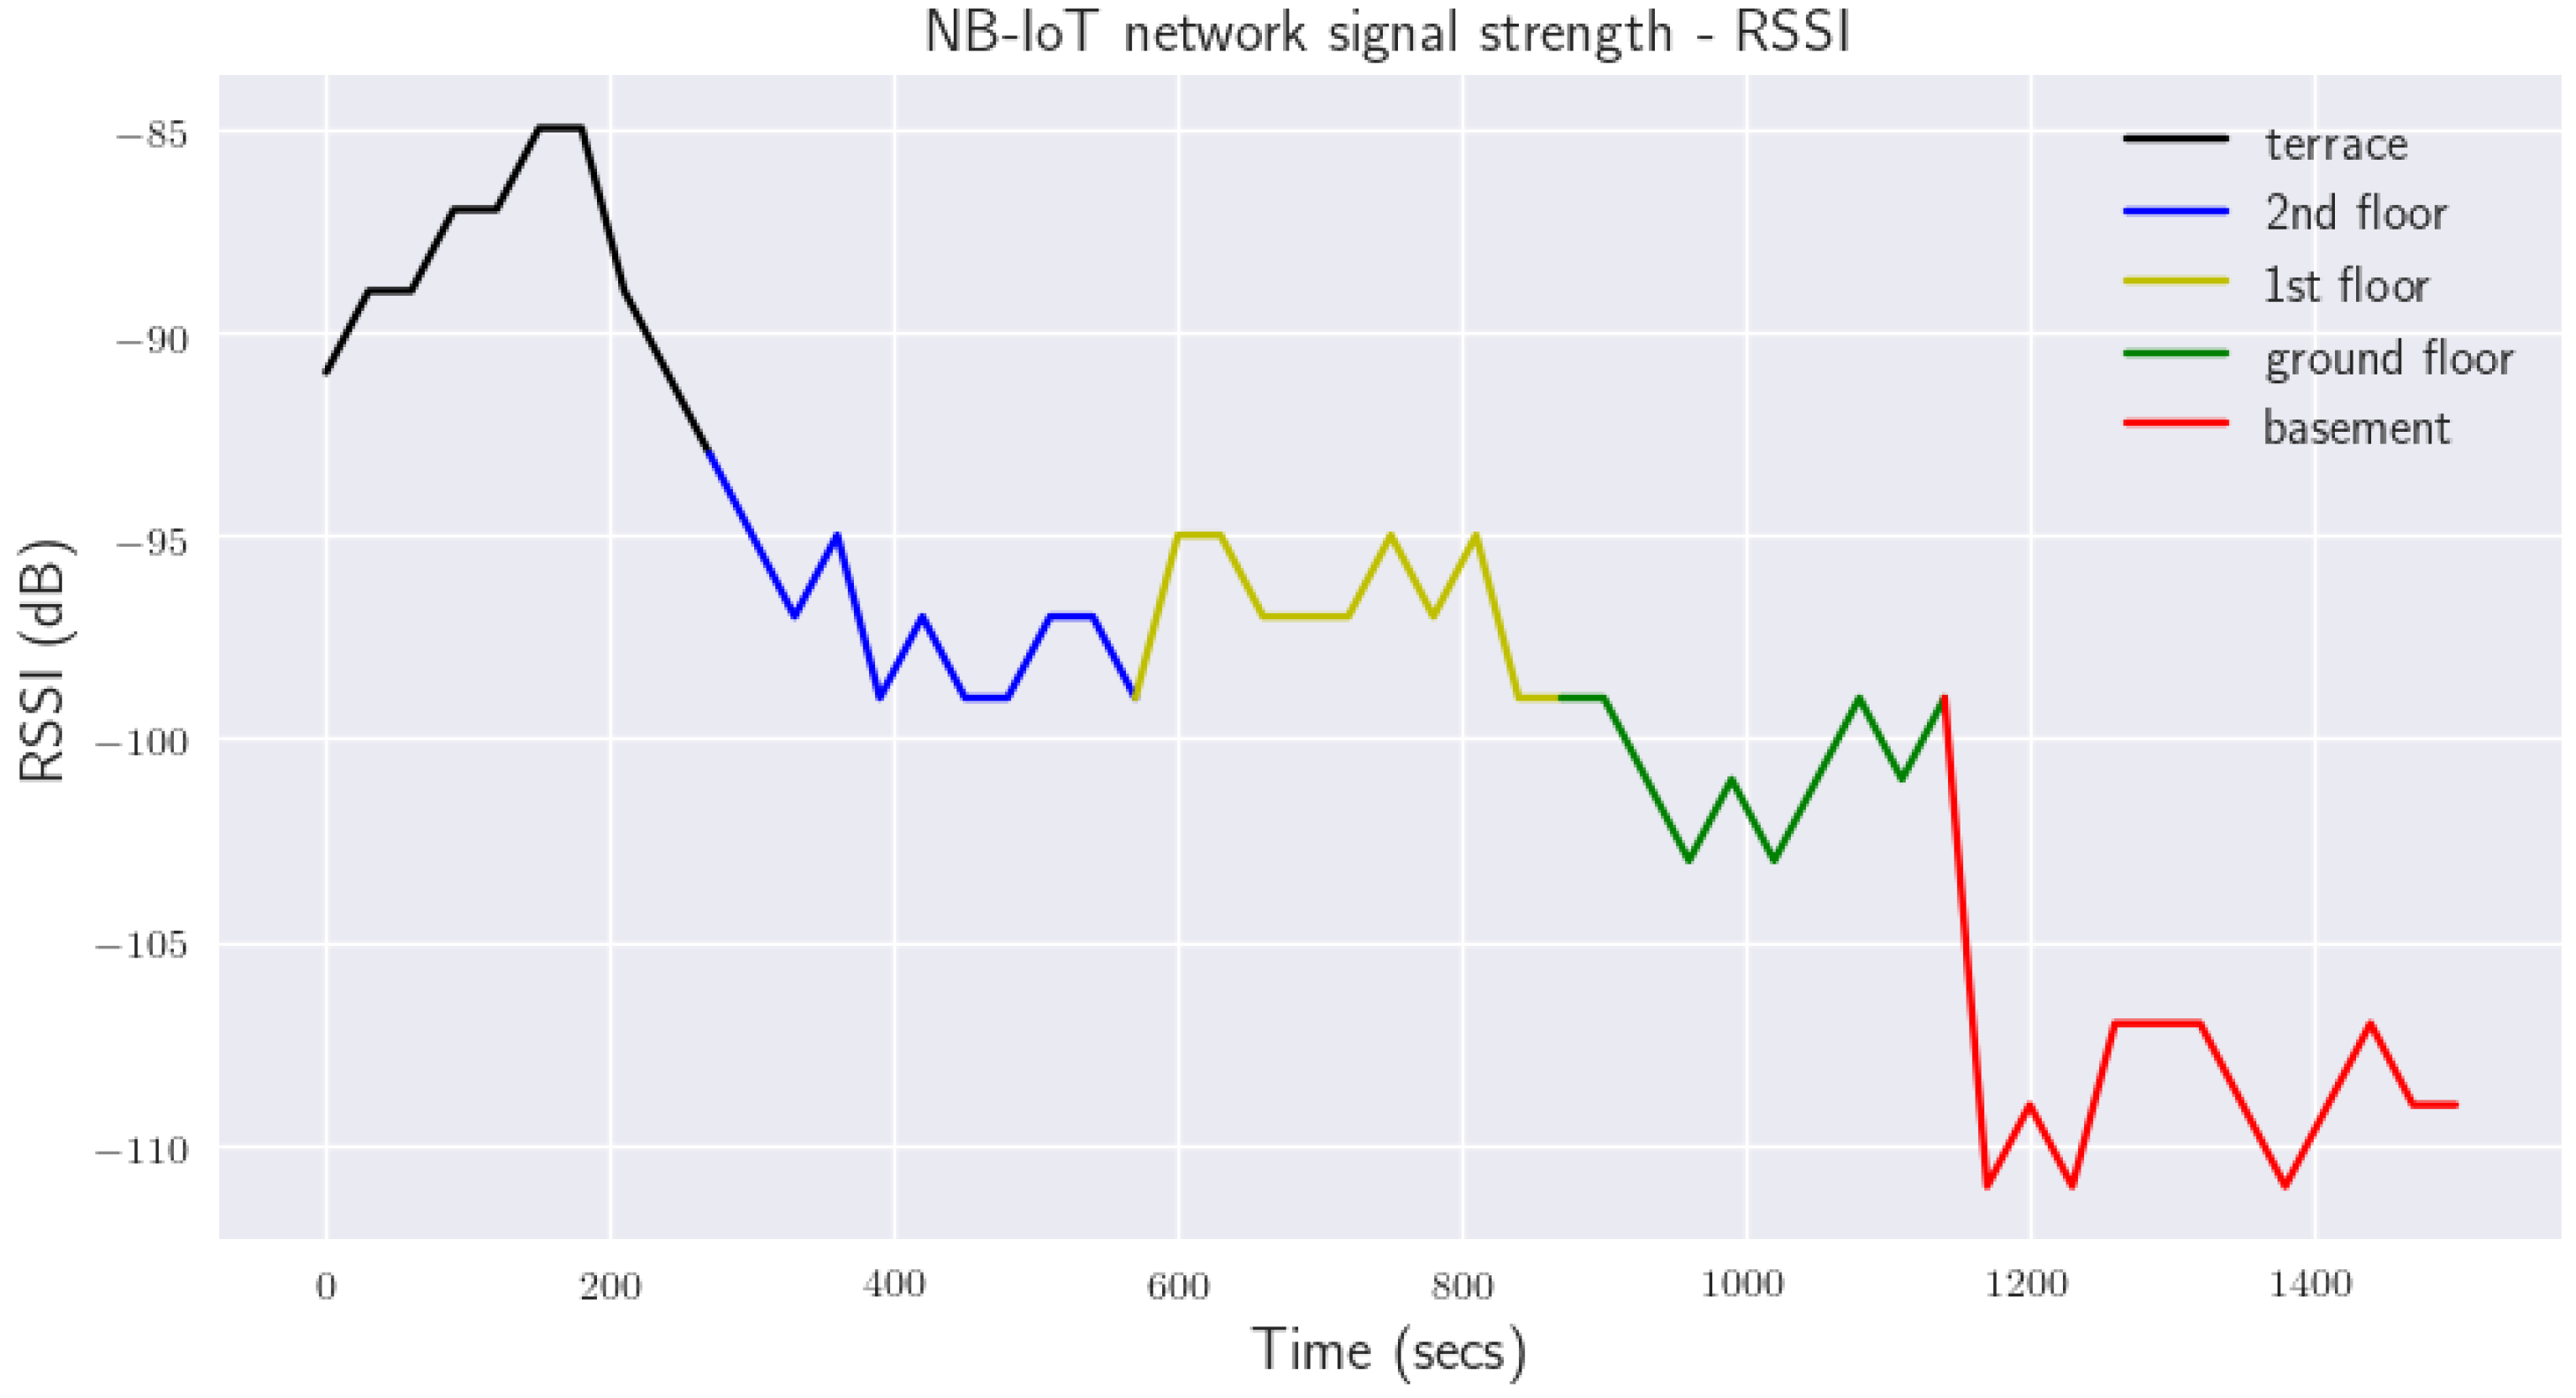
The NB-Iot network is chosen as the main network option, due to the fact that it is designed specifically for IoT applications and it is lightweight, low-powered and performs better on low data rates. It is observed that the NB-IoT network is able to provide connectivity to devices with a received signal strength indicator (RSSI) value as low as −105 dBm as compared to −95 dBm of long-term evolution (LTE) [
22]. In order to test the range of the connectivity of the NB-IoT SIM7020 module that is used on the smart tag, measurements of the signal’s strength, known as the RSSI, are acquired. The connection was tested at a building of the National and Technical University of Athens, which consists of three floors, a terrace and a basement. Measurements were taken every 30 s for 5 min on each one of the floors, the terrace, the second floor, the first floor, the ground floor and the basement. As a result, we acquired 10 measurements of RSSI on each floor that are graphed on
Figure 8.
As we expected, the signal strength is higher on the terrace, where the device is not surrounded by walls and it reaches −85 dB. The RSSI values on the first and second floors do not appear to have substantial differences. The signal starts to become low on the ground floor and reaches its minimum strength in the basement, where it reaches −110 dB. Despite the fact that the signal is not strong, it is sufficient, and the device manages to connect to the NB-IoT network and transmit the gathered data. This proves that the NB-IoT network indeed offers long-range connectivity and can normally operate at places where common cellular networks, such as 4G/3G networks, struggle to do so.
3.2. Power Consumption
In order to achieve power efficiency and long operational life, as described in
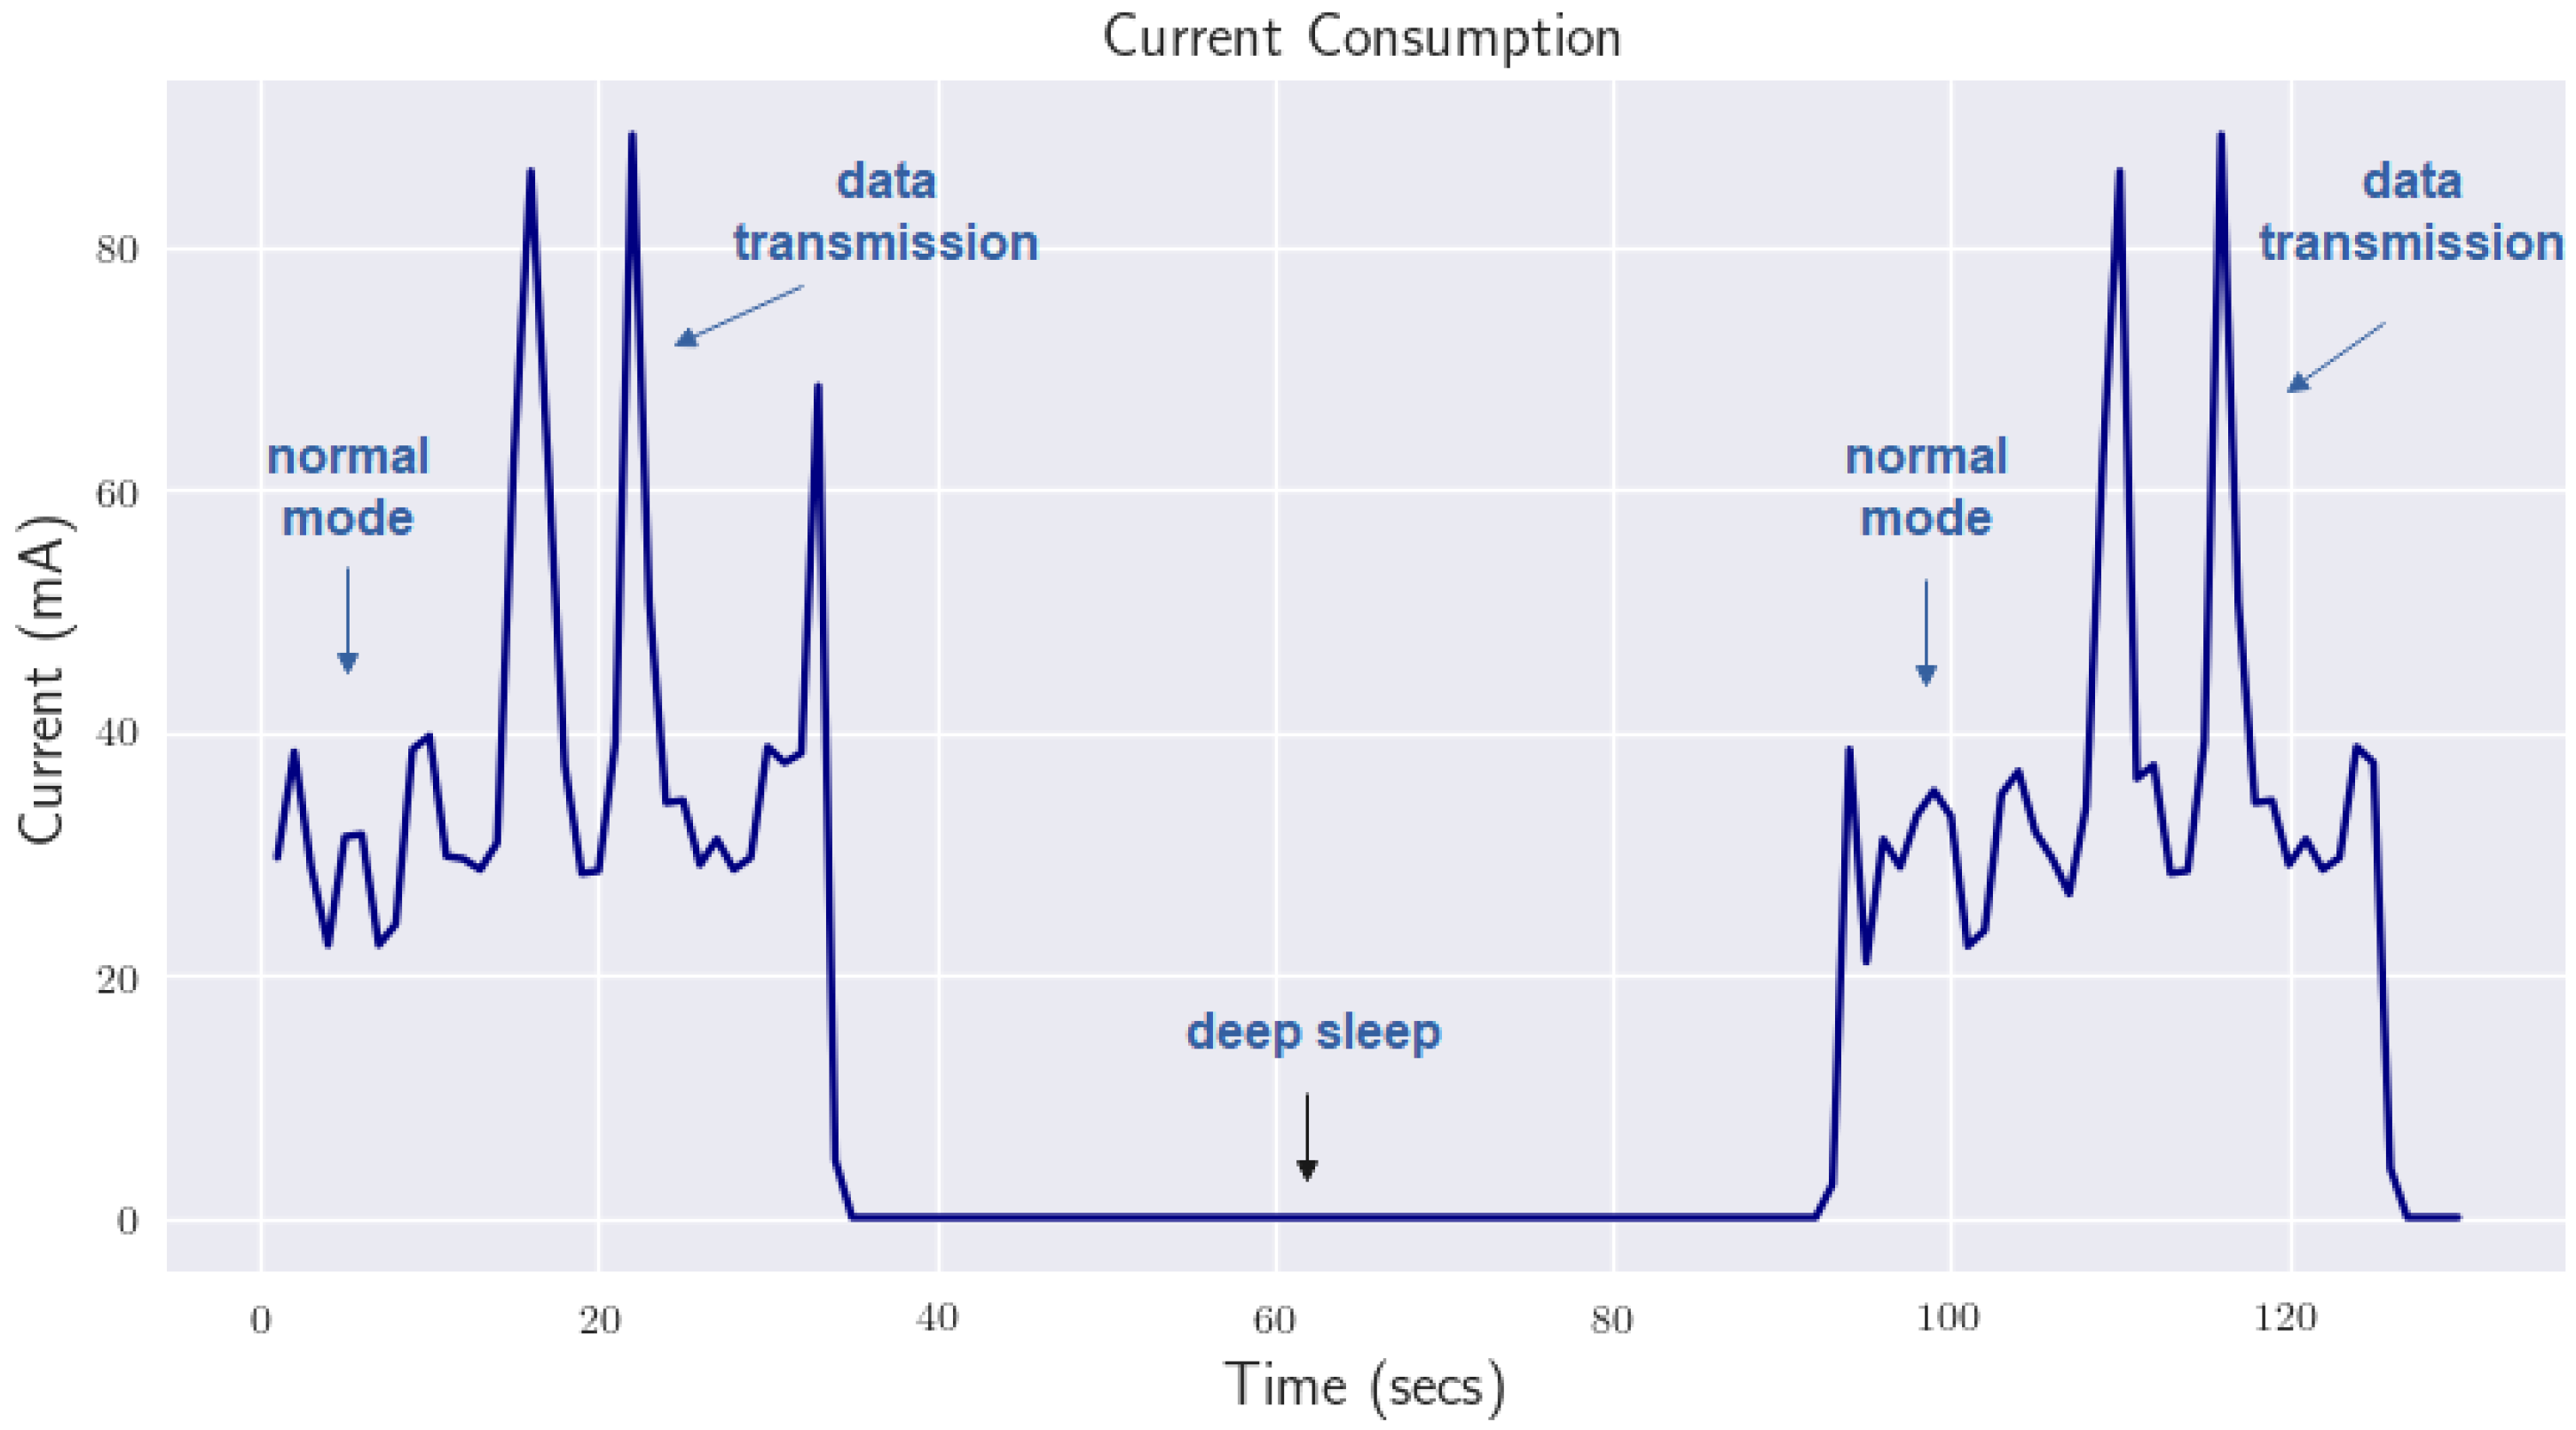
Section 2, some designing decisions, on the hardware and software levels, had to be investigated. On the hardware level, the smart tag includes a rechargeable battery, a solar panel, a charging and power level monitoring module and a USB port. As a result, it is capable of being powered by multiple power sources, and use the solar energy can continue its operation endlessly. On the software level, the smart tag is programmed to switch between different power modes, depending on its required functionality at the specific time frame. Every power mode that the devices uses is listed below in sequential order:
Normal mode: The device initialize the sensors, acquires and stores the measurements;
Deep sleep mode: Most parts of the device are powered off in order to minimize the power consumption;
Data transmission: The device connects to the network and transmit the stored data.
In order to have an estimated power profile, current consumption measurements of the smart tag have been acquired using Pro’s Kit MT-1705 digital multi-meter. The measurements was recorded every second. For this test, the smart tag was programmed to acquire the climate measurements and transmit them every 1 min. During the time frame of the 1 min, it goes into deep sleep mode. The power profile of the device for 2 min is presented in
Figure 9. From the measurements, it is concluded that the mean current consumption of the device during normal mode is approximately 36 mA and during the deep sleep is 0.06 mA. The data transmission is the most demanding process, as it reaches a peak of 86 mA.
The power profile of the smart tag can be expressed by the Equation (
1), which calculates the operational hours of the device based on the time frame of each power mode and the current that they demand:
with
BCap being the capacity of the battery in mAh and
NMcur,
DPcur and
DTcur being the current consummations on normal mode, deep sleep and data transmission, respectively. In the same way,
NMt,
DPt and
DTt express the time frame in seconds of each power mode.
Taking into consideration that smart tags acquires measurements every 30 min and transmit the data every 12 h, we have approximately every hour: NMcur = 36 mAh, DPcur = 0.06 mAh, DTcur = 86 mAh, NMt = 60 s, DPt = 3539.58 s and DTt = 0.42 s. Using a fully charged battery with 3000 mAh capacity, we can calculate that the smart tag can operate, with no solar energy, for approximately 4484.72 h, which is 6.23 months. If sunlight is present, the device can use the solar energy to recharge the battery at the same time and continue its operation endlessly. The estimated time that a 3000 mAh battery needs to be fully recharged is 5 h on a day with normal to high sunlight.
4. Deployment and Results
4.1. Deployment
After investigating the needs of each pilot site and discussing the subject with the partners, we concluded that the total amount of 34 smart tag devices needed to be developed and installed in order to form an IoT network. A unique sensor ID has been assigned to each Smart Tag for their identification and their unique matching to the building that they are installed. In the sites of Venice and Granada there is only one Tier 1 building under study on each site, Torre d’Orologio and the San Jeronimo monastery, respectively. Both of these buildings are quite large, so multiple sensors were required for their better monitoring. On the other hand, the sites of Rhodes and Tonsberg there are multiple Tier 1 buildings but with smaller size, so fewer sensors have been installed on them. The distribution of these 34 smart tags across the 4 study areas and their Tier 1 buildings is listed on
Table 3.
The sensors have been in different orientations, heights and facades of each building, with the purpose to cover a wide area, depending on the investigated monument. The majority of the devices are installed in the exterior of each building, mounted on its walls, and a few of them in the interior basically for comparison reasons. The exact placement of each sensor including their orientation and height on the building’s walls surface are described in
Table 4.
The process of installation of each smart tag in the Tier 1 buildings’ walls is straightforward and is established in a non-intrusive way in order to not damage the monuments surfaces, using waterproof and UV-resistant adhesive tapes and tire ups. The devices just need to be placed carefully on the corresponding spots and turned on by a switch at the bottom of the case. Except for the power switch, there is a reset button that can be used in order to restart the smart tag. In
Figure 10, examples of the smart tags’ installations across the four CH sites under study are depicted.
4.2. Results
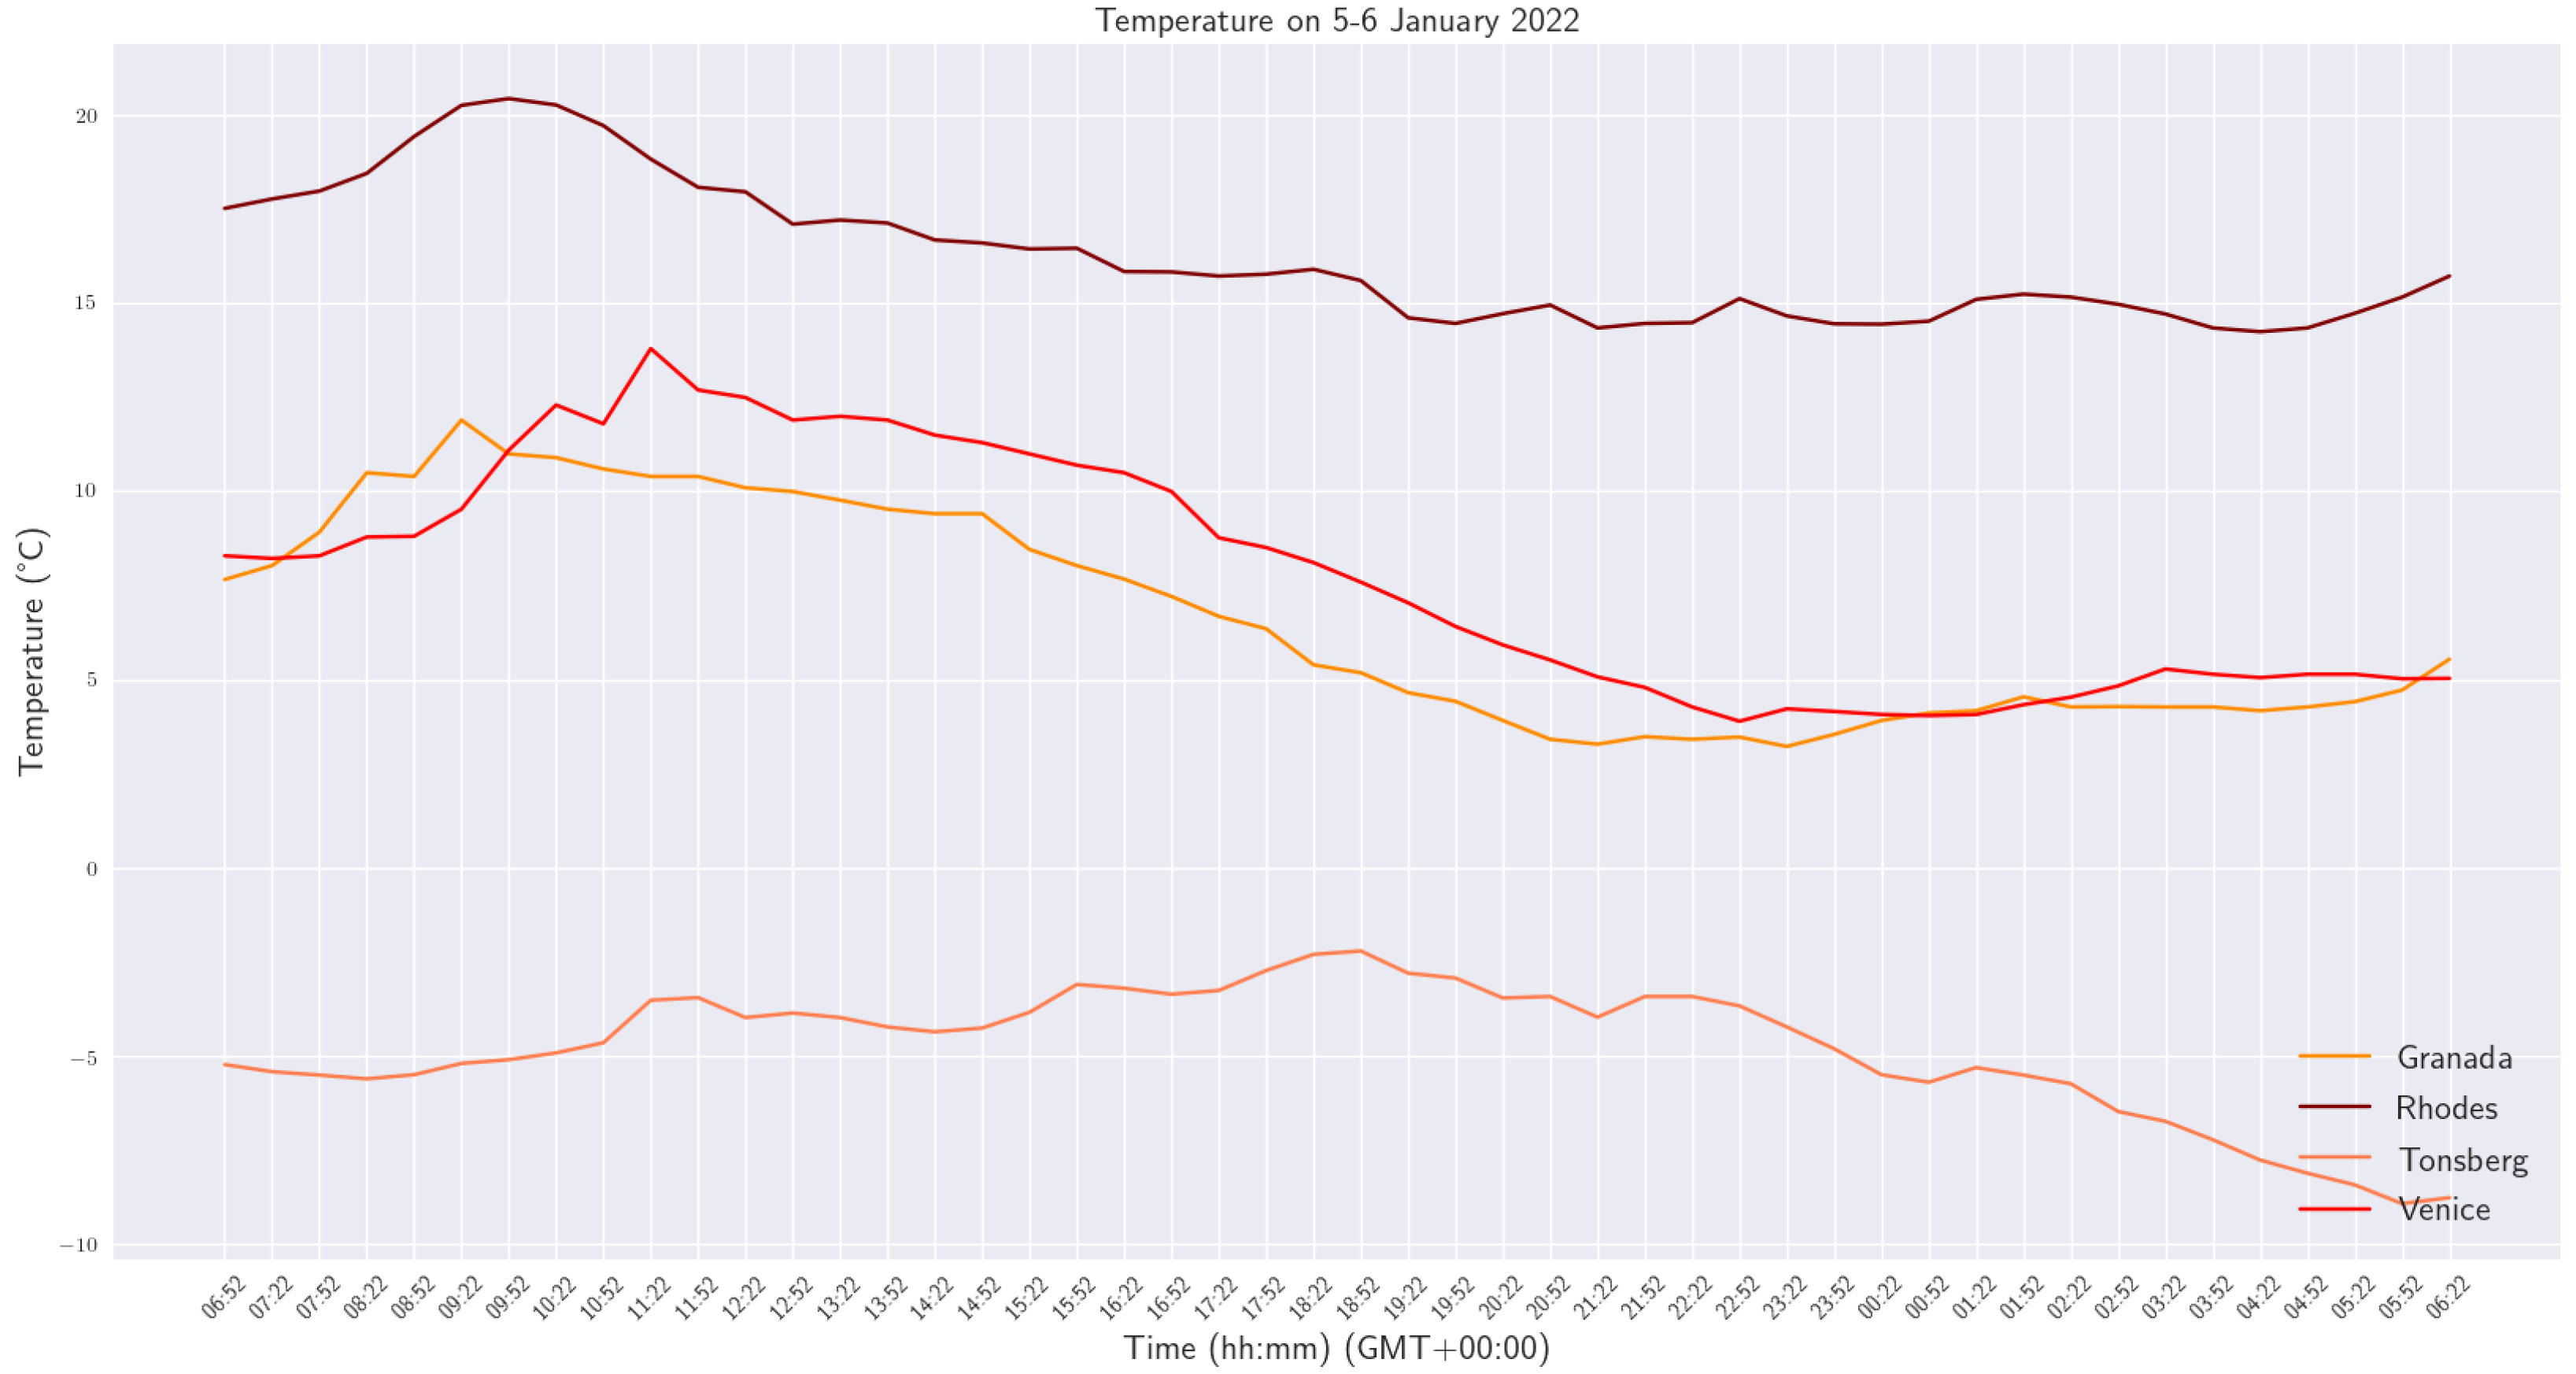
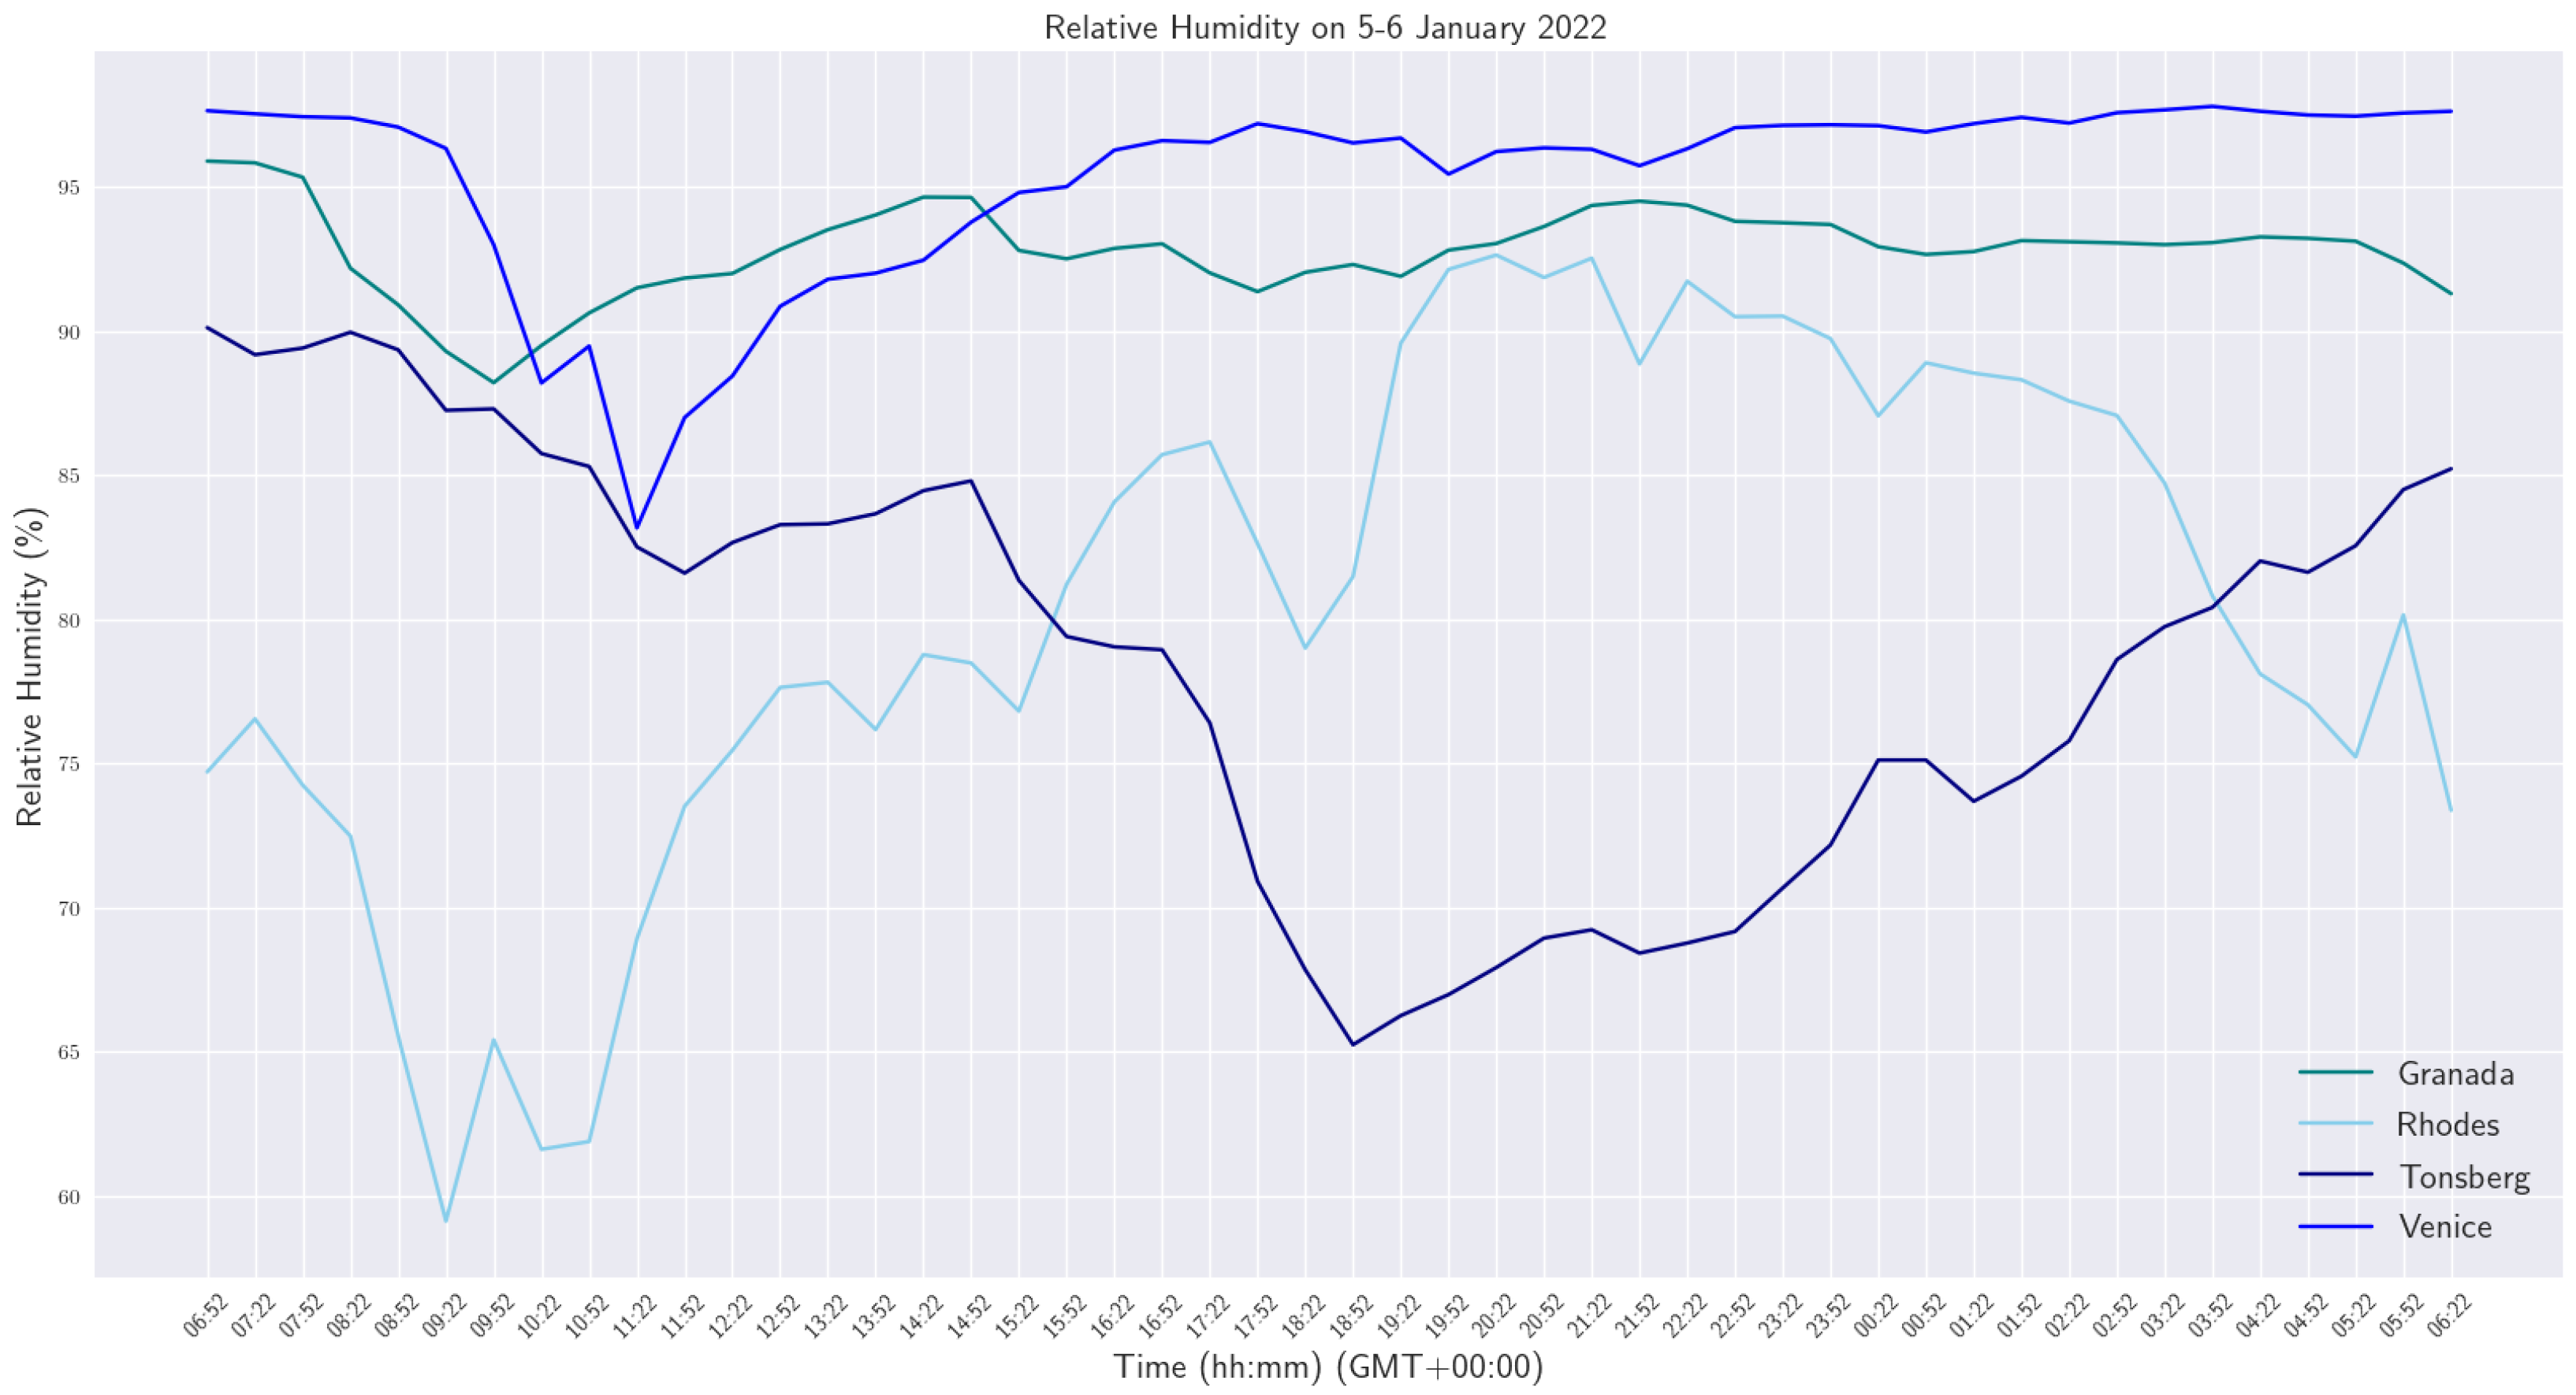
The acquired measurements by the installed smart tags have been gathered and transmitted to the middle-ware. Two graphs of the temperature and the relative humidity measured on each of the four sites, during 5 and 6 January 2022, are outlined in
Figure 11 and
Figure 12 respectively. The measurements were recorded from 6:52 a.m. of 5 January until 6:22 a.m. of 6 January, every 30 min.
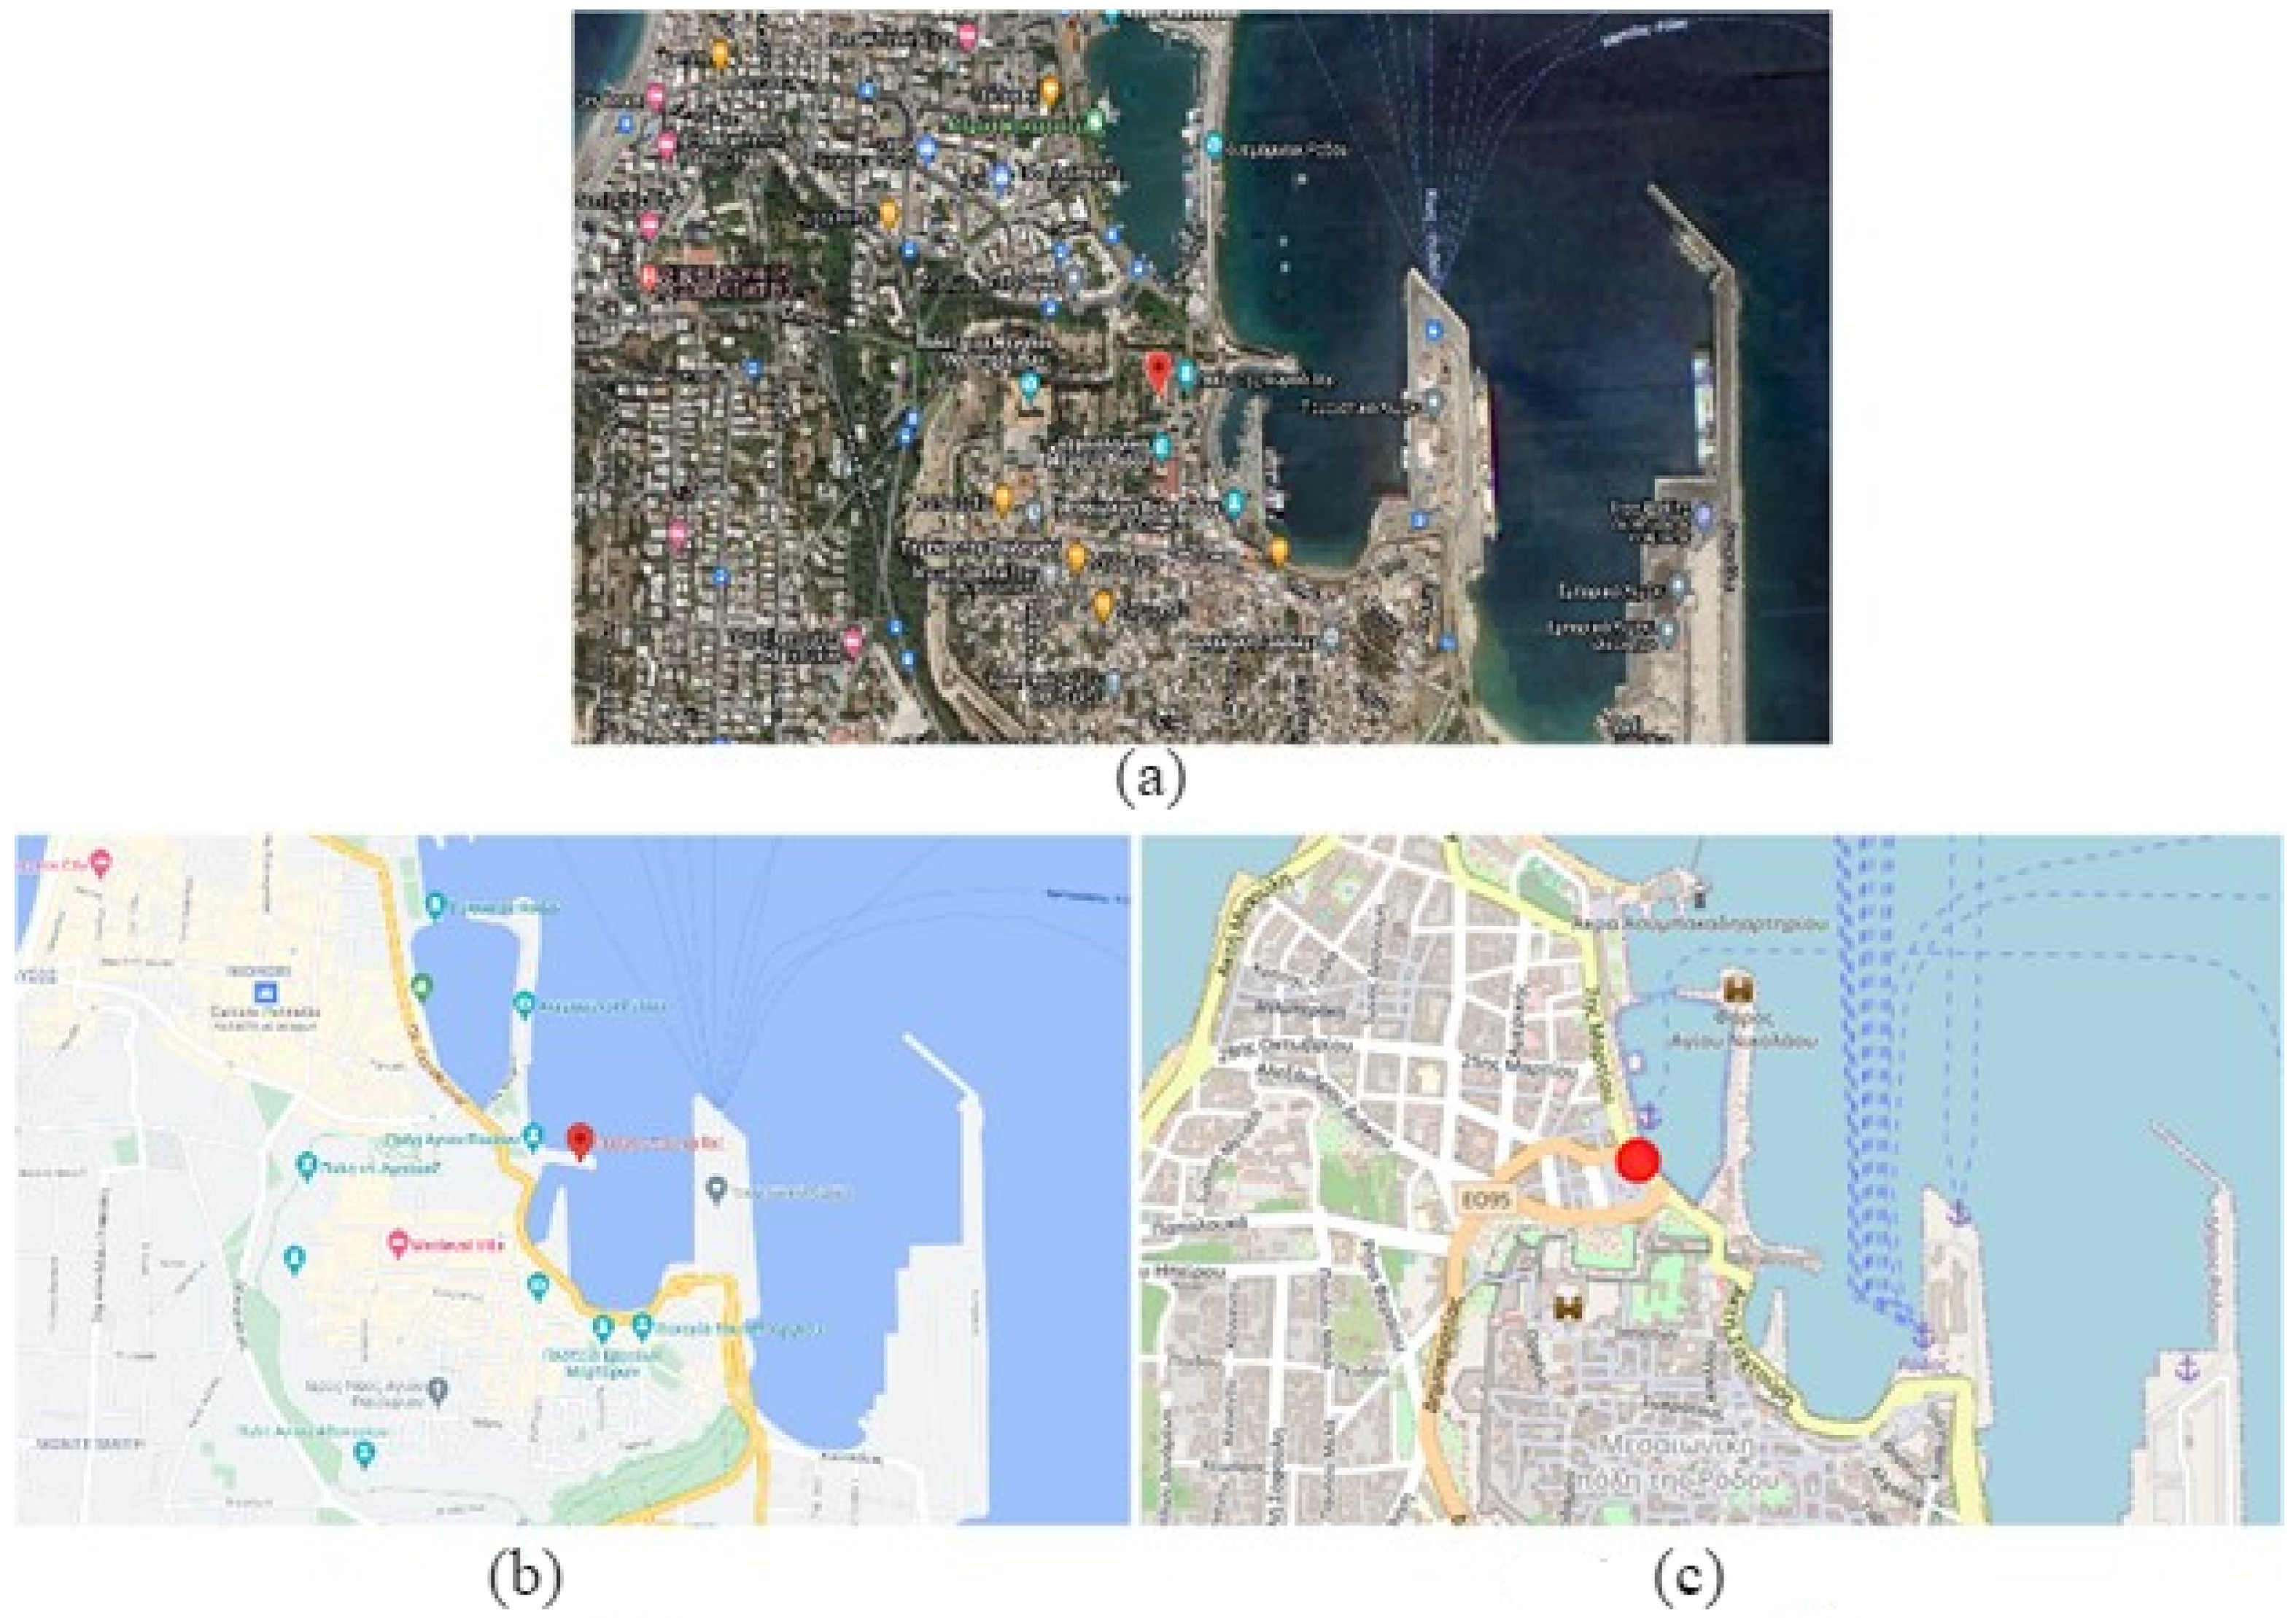
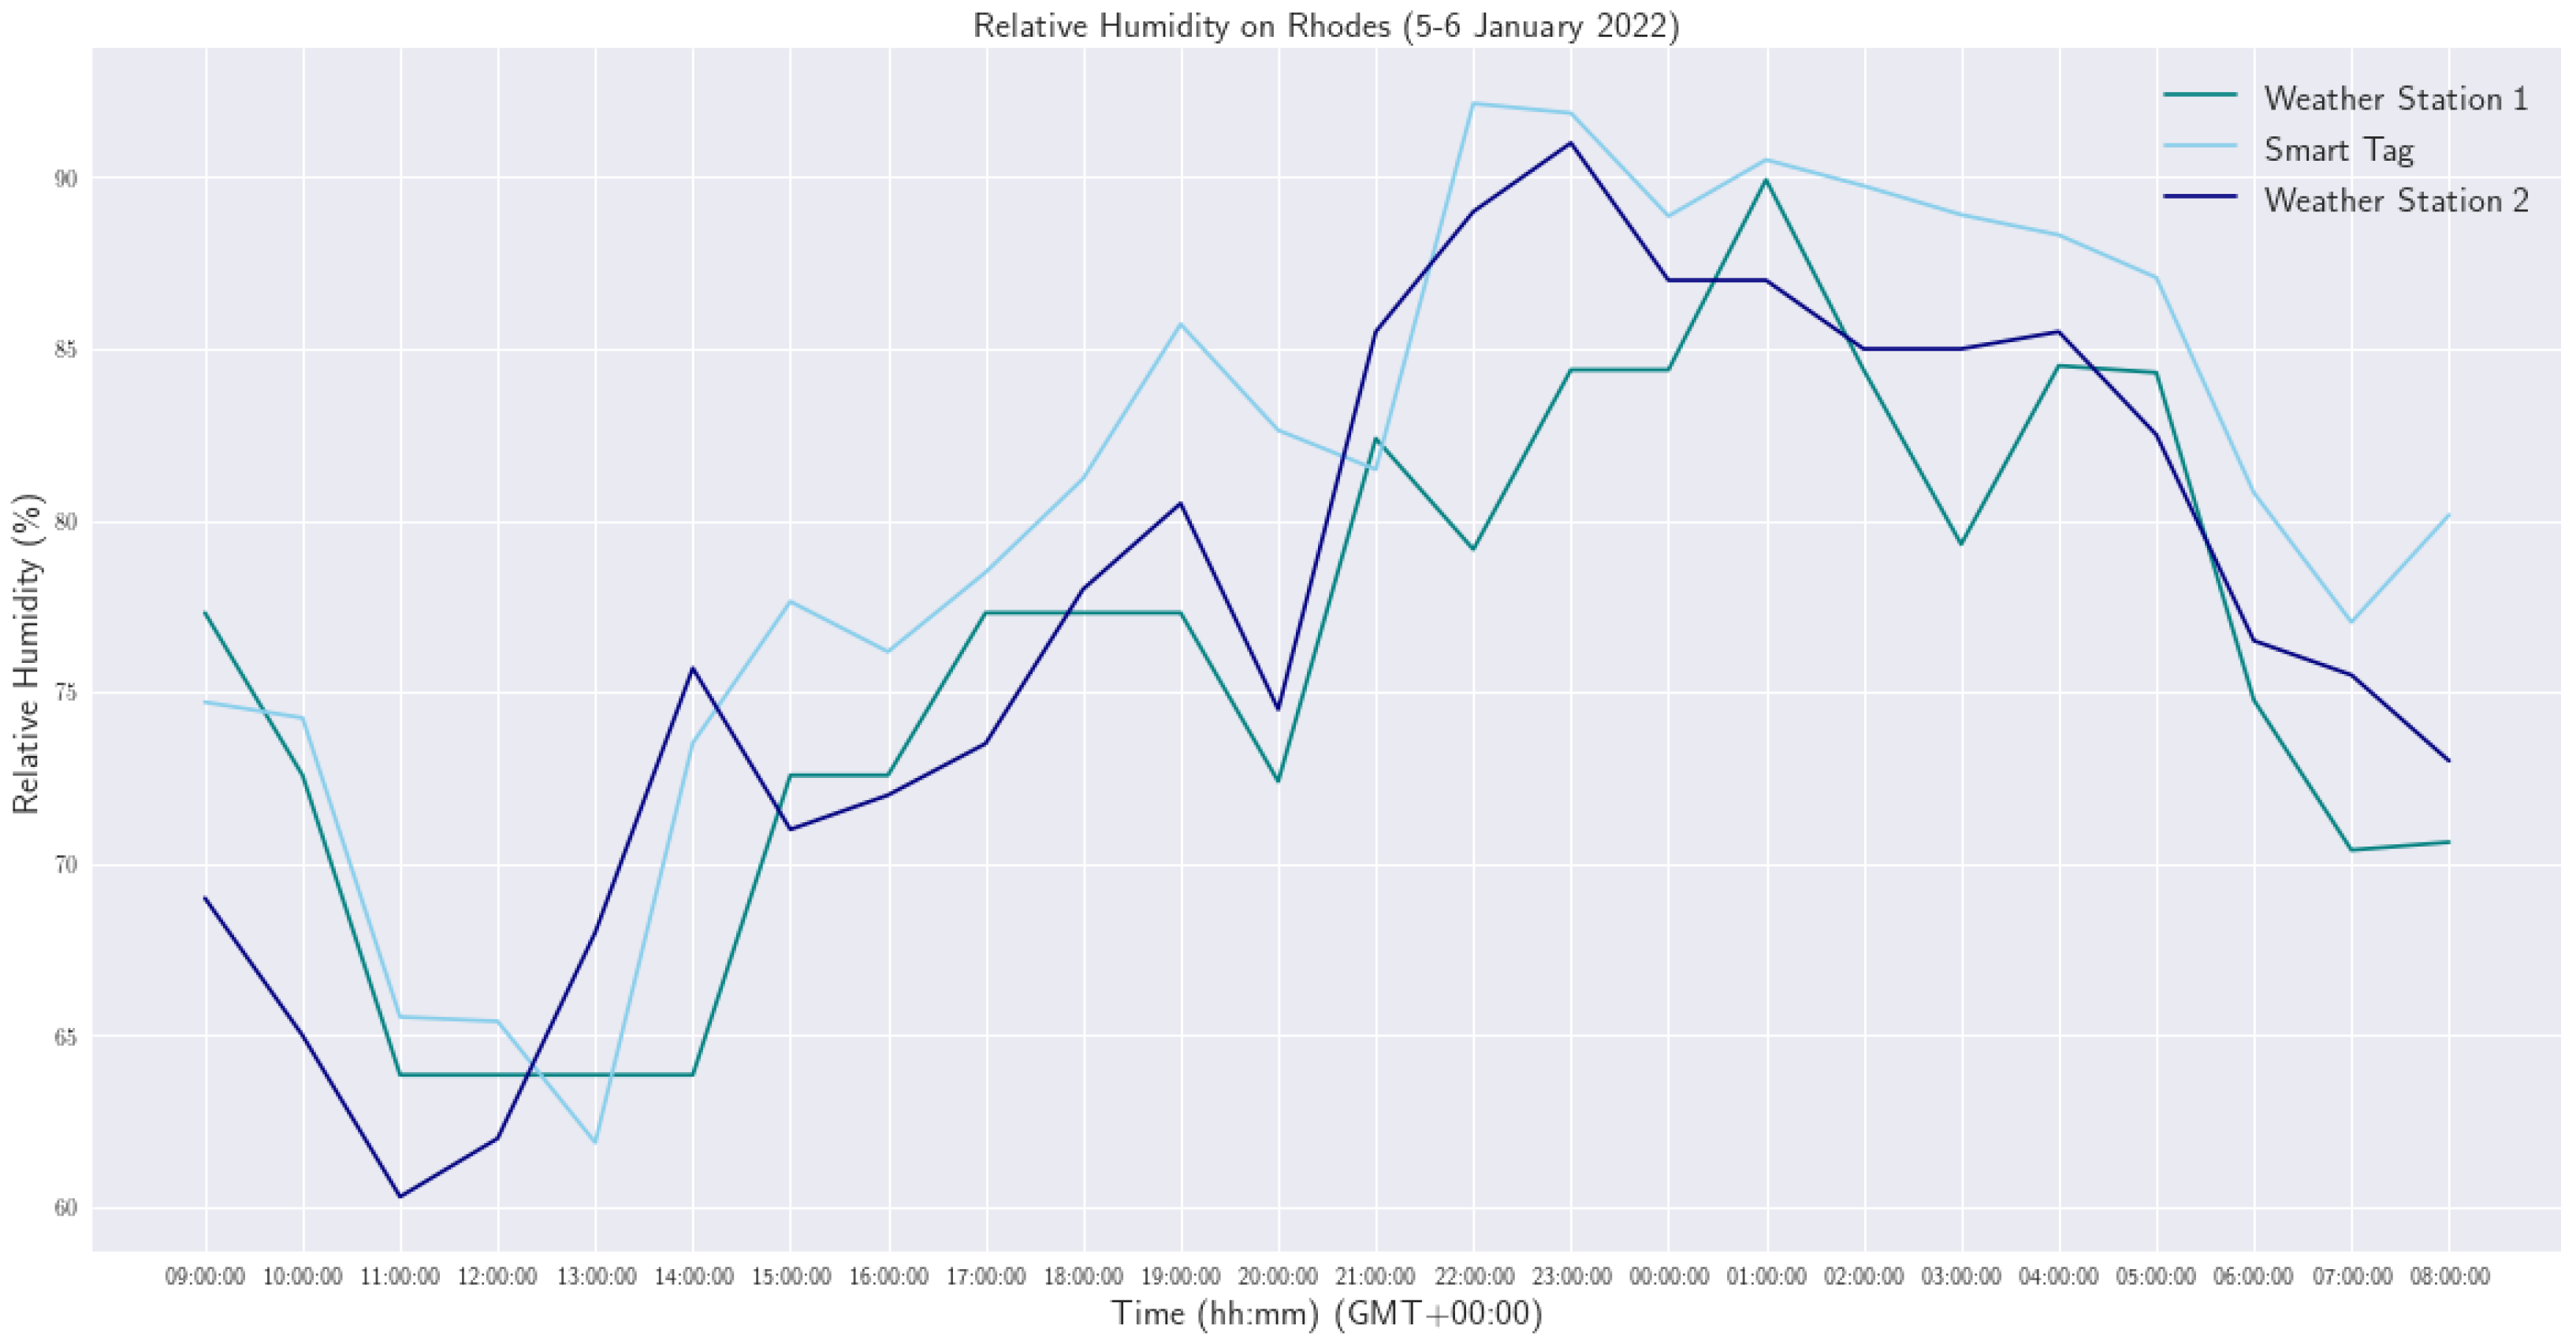
In order to evaluate the Smart Tags’ reliability, temperature and humidity measurements acquired by the Smart Tags are compared with those gathered by two commercial weather stations installed in the vicinity of the study area in Rhodes. Specifically, the data from the weather station 1 have been taken by a commercial online source for historical and forecast weather
https://www.visualcrossing.com (accessed on 28 December 2021), which includes a weather API that gathers meteorological data by various weather stations installed all over world. The second weather station is a commercial weather station installed on the CH site of Rhodes within the context of the HYPERION project for the evaluation of the Smart Tags. The positions of each weather station and the Smart Tag used for the evaluation are depicted in
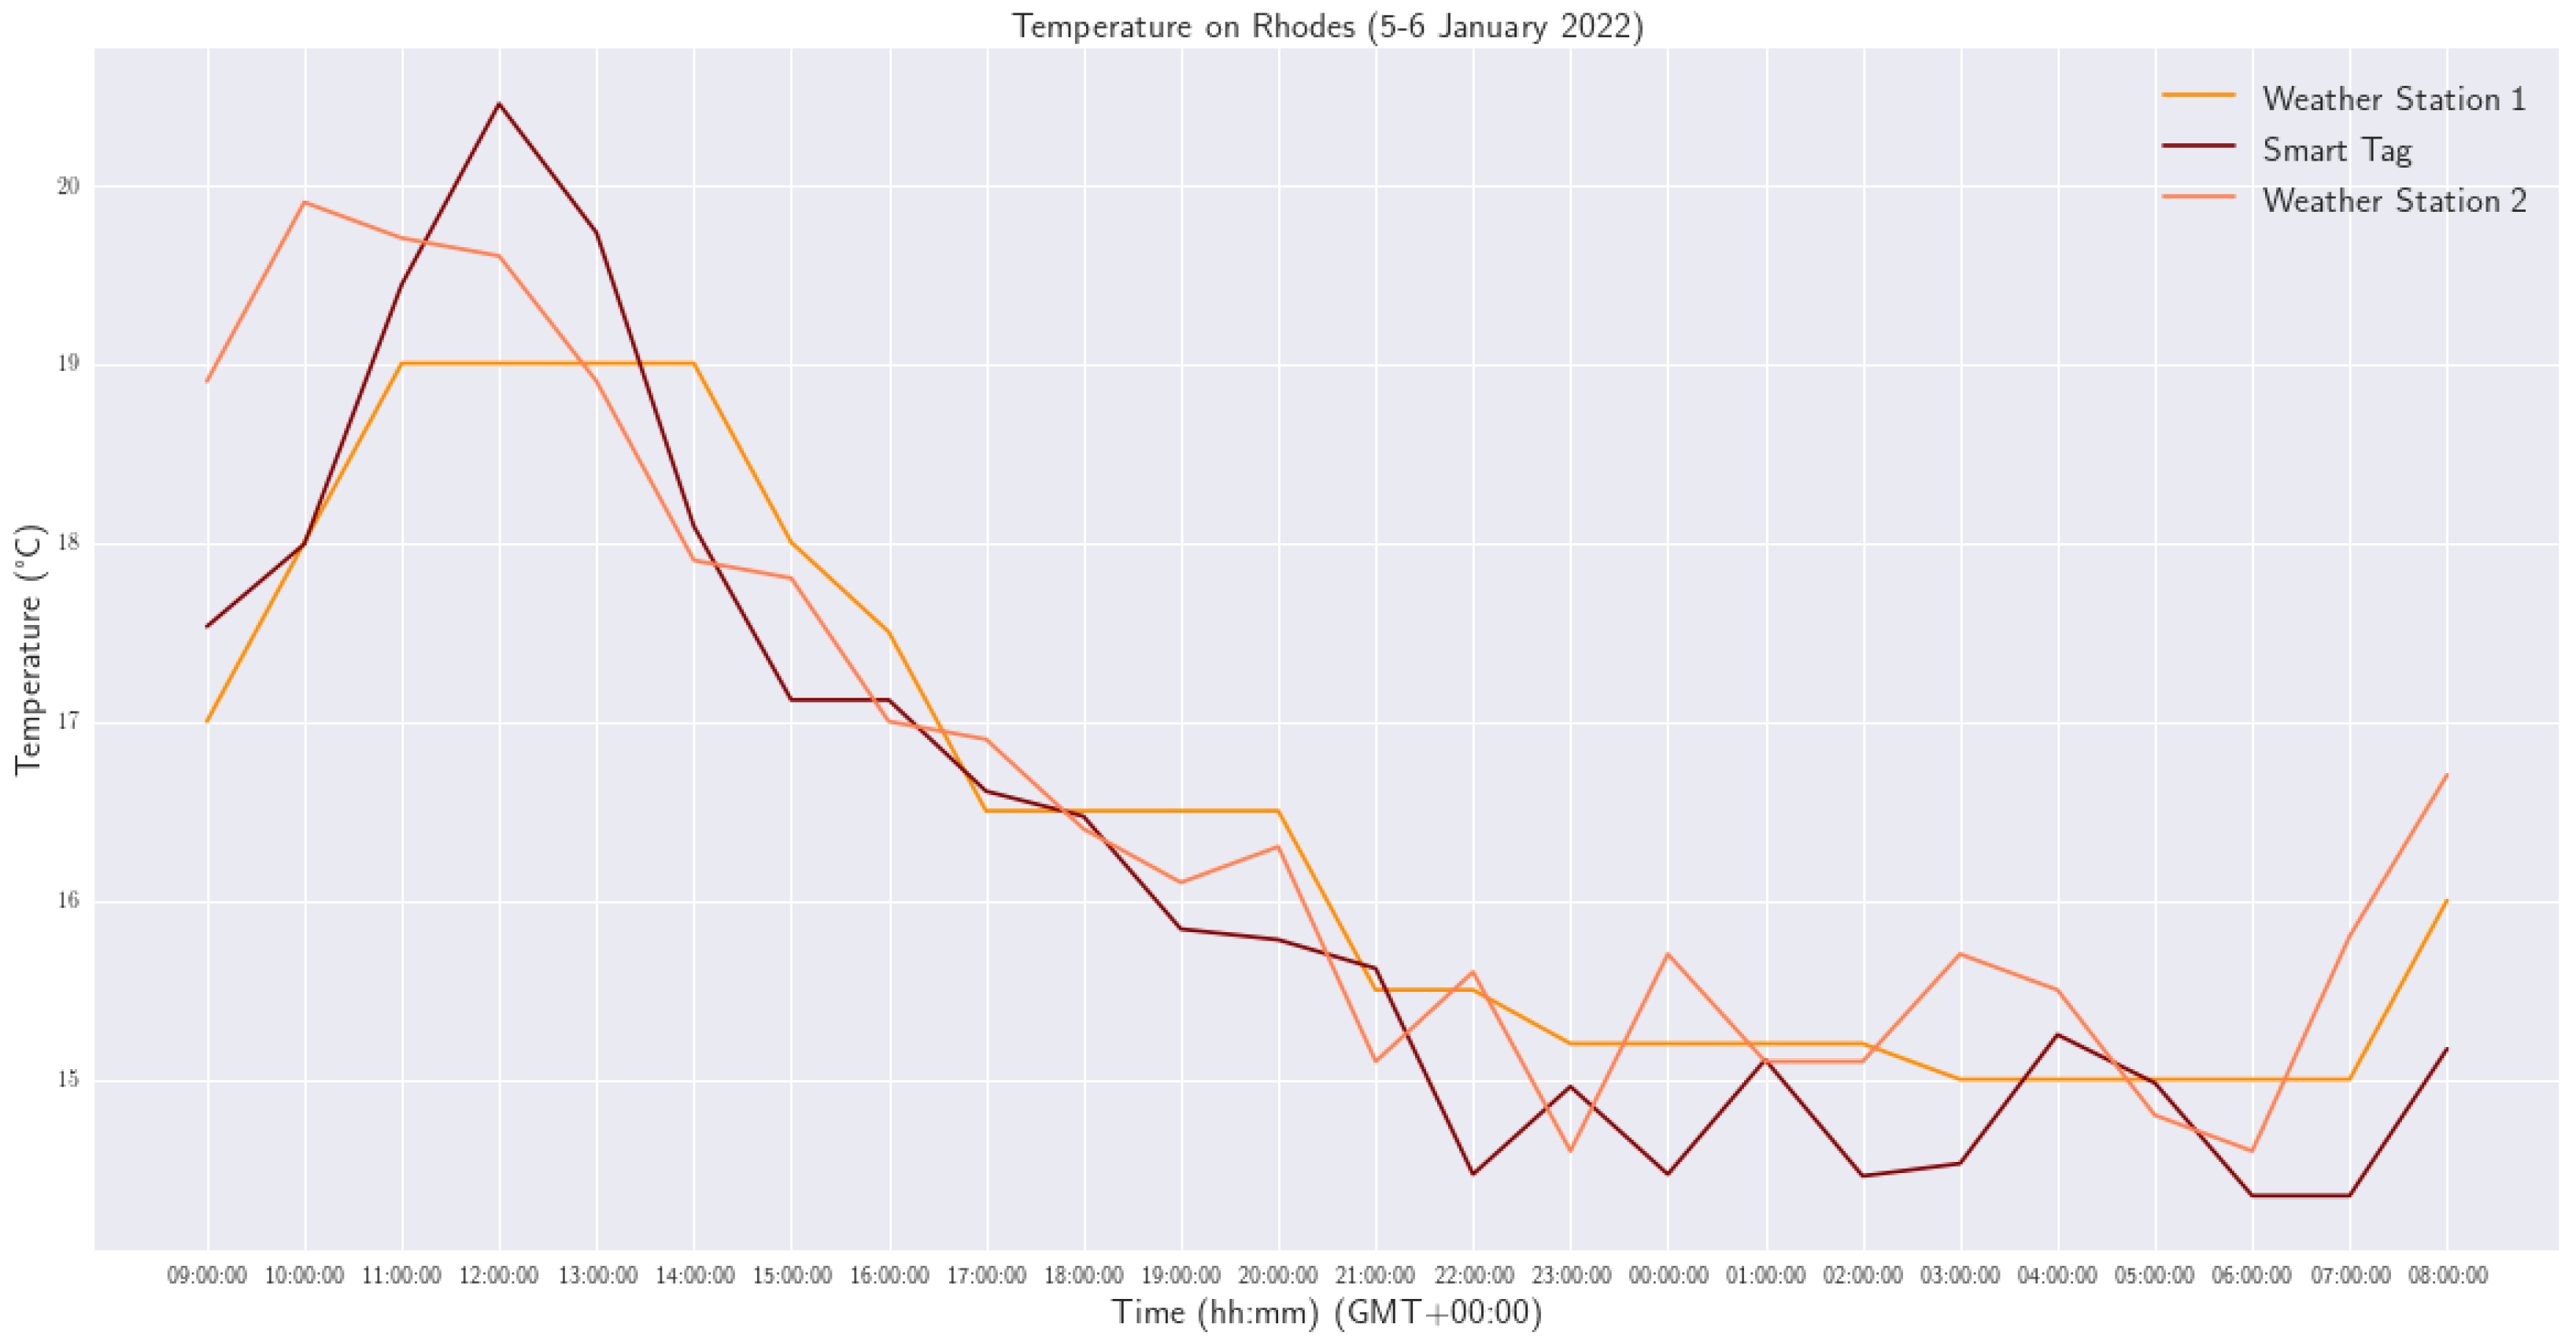
Figure 13 and the distance between them are less than 500 m to ensure credibility. The measurements that are being compared have been taken hourly by the three devices during 5 and 6 of January 2022 and for the timeframe of 9:00 a.m. until 8:00 a.m. The graph of all temperature measurements is presented in
Figure 14 and the one for the humidity in
Figure 15.
From the results, we can observe that the measurements acquired by our device are very close to the ones gathered by the two weather stations, with slight deviations during the day of the study. Specifically, the maximum and minimum differences observed on the temperature measurements between the Smart Tag and the two stations are close to 1.7 °C and 0.1 °C, respectively. Regarding the humidity data, a maximum deviation of 10% appears from weather station 1 in some time-frames of the day and a minimum deviation of 0.2%. At this point, it is worth mentioning that the same deviations also appear between the weather stations. These deviations can be caused to some extent by the geographical distances of the three devices and the fact that the provided data of the weather stations, especially the weather station 1, do not have decimal accuracy.
5. Conclusions
In this work, we present the development of smart IoT devices that monitor specific environmental conditions in the vicinity of cultural heritage buildings. These IoT devices are designed according to the needs of multiple cultural heritage areas across the Europe, and they manage to be autonomous, power efficient and deployable in a nonintrusive way on the buildings’ walls. Furthermore, a visualization platform is designed to present the measurements in a user-friendly way.
Measurements acquired by multiple smart tags, installed on specific buildings across the study areas, are presented. Form these measurements, we can observe that the proposed developed system is operational and can be used as a monitor device on different climate conditions. The gathered results are compared with real data acquired by professional weather stations installed in each area. The Smart Tag’s data appear to be really close to those of the weather stations with small deviations. As a result, the proposed system can be a reliable solution for monitoring specific climate conditions and a useful tool that can contribute to the assessment of the deterioration of CH buildings and the risks generated by weather phenomena. Last but not least, the NB-IoT connectivity and the power efficiency of the developed device are tested. From the results, we can conclude that the NB-IoT network offers sufficient signal even on underground locations, and the smart tag device can achieve very low power consumption and achieve long operational life.
It is mentioned that the Smart Tags’ functionality is limited on a sensor-monitor level, and it is not suitable to operate as a data processing device that executes computations with high complexity, because of its constrained resources (e.g., memory, power consumption). The data acquired by the Smart Tags can be further processed on the server’s back-end side and can be used for modeling or simulation purposes.
The solution is intensively evaluated at the time being, within the context of the HYPERION project, and we will continue to do so for over a year, until the end of the project.
Author Contributions
Conceptualization, N.M. and M.K.; methodology, N.M. and M.K.; sensor design, N.M.; software, N.M.; writing—original draft preparation, N.M. and M.K.; supervision, A.A.; funding acquisition, A.A. All authors have read and agreed to the published version of the manuscript.
Funding
This work is a part of the HYPERION project, funded by the European Union’s Horizon 2020 Research and Innovation Programme and the Korean Government under Grant Agreement No. 821054. Content reflects only the authors’ view.
Institutional Review Board Statement
Not applicable.
Informed Consent Statement
Not applicable.
Conflicts of Interest
The authors declare no conflict of interest.
Abbreviations
The following abbreviations are used in this manuscript:
| IoT | Internet of Things |
| CH | Cultural Heritage |
| CC | Climate Change |
| MCU | Microcontroller Unit |
| SPIFFS | Serial Peripheral Interface Flash Filing System |
| LPWAN | Low Power Wide Area Networks |
| NB-IoT | NarrowBand Internet of Things |
| ULP | Ultra Low Power |
| RTC | Real Time Clock |
| I2C | Inter-Integrated Circuit |
| GPIO | General-Purpose Input/Output |
| UART | Universal asynchronous receiver-transmitter |
| SPI | Serial Peripheral Interface |
| ADC | Analog to Digital Converter |
| PCB | Printed Circuit Board |
| SMT | Surface Mount Technology |
| ABS | Acrylonitrile Butadiene Styrene |
| MQTT | Message Queuing Telemetry Transport |
References
- Cassar, M.; Pender, R. The impact of climate change on cultural heritage: Evidence and response. In Proceedings of the ICOM Committee for Conservation: 14th Triennial Meeting, The Hague, The Netherlands, 12–16 September 2005; pp. 610–616, ISBN 9781844072538. [Google Scholar]
- Hambrecht, G.; Rockman, M. International approaches to climate change and cultural heritage. Am. Antiq. 2017, 82, 627–641. [Google Scholar] [CrossRef] [Green Version]
- Shabani, A.; Kioumarsi, M.; Plevris, V.; Stamatopoulos, H. Structural Vulnerability Assessment of Heritage Timber Buildings: A Methodological Proposal. Forests 2020, 11, 881. [Google Scholar] [CrossRef]
- HYPERION. HYPERION EU Projet. 2020. Available online: https://www.hyperion-project.eu/ (accessed on 1 February 2022).
- Valery, G.; Shigorets, S.; Vlasov, D.; Miklashevich, E.; Zhabko, A.; Kovshov, A.; Vlasov, A. Development of Stone Monuments Monitoring System Using Computer Technology. In Biogenic—Abiogenic Interactions in Natural and Anthropogenic Systems; Springer: Cham, Switzerland, 2016; pp. 415–421. [Google Scholar] [CrossRef]
- Pantani, L.; Ballerini, G.; Cecchi, G.; Edner, H.; Lognoli, D.; Johansson, T.; Raimondi, V.; Svanberg, S.; Tiano, P.; Tomaselli, L.; et al. Experiments on stony monument monitoring by laser-induced fluorescence. J. Cult. Herit. 2000, 1, S345–S348. [Google Scholar] [CrossRef]
- Kita, A.; Venanzi, I.; Cavalagli, N.; García-Macías, E.; Ubertini, F. Enhanced continuous dynamic monitoring of a complex monumental palace through a larger sensor network. In Proceedings of the XI International Conference on Structural Dynamics, Athens, Greece, 23 November 2020; pp. 2275–2284. [Google Scholar] [CrossRef]
- Gentile, C.; Canali, F. Continuous Monitoring the Cathedral of Milan: Design, Installation and Preliminary Results. Proceedings 2018, 2, 467. [Google Scholar] [CrossRef] [Green Version]
- Lloret, J.; Sendra, S.; García-Fernández, J.; García, L.; Jimenez, J.M. A WiFi-Based Sensor Network for Flood Irrigation Control in Agriculture. Electronics 2021, 10, 2454. [Google Scholar] [CrossRef]
- Marcu, F.; Hodor, N.; Indrie, L.; Dejeu, P.; Ilieș, M.; Albu, A.; Sandor, M.; Sicora, C.; Costea, M.; Ilieș, D.C.; et al. Microbiological, Health and Comfort Aspects of Indoor Air Quality in a Romanian Historical Wooden Church. Int. J. Environ. Res. Public Health 2021, 18, 9908. [Google Scholar] [CrossRef] [PubMed]
- Kain, G.; Idam, F.; Huber, A.; Mudri, M.; Petutschnigg, A.; Goldsteiner, M. Mitigating Harmful Effects of Climate Warming on Ceiling Paintings by Ceiling Insulation: An Evaluation Using Timed IR Imaging and Numeric Modelling. Sustainability 2022, 14, 308. [Google Scholar] [CrossRef]
- Singh, M.; Rajan, M.; Shivraj, V.; Balamuralidhar, P. Secure MQTT for Internet of Things (IoT). In Proceedings of the 2015 Fifth International Conference on Communication Systems and Network Technologies, Gwalior, India, 4–6 April 2015; pp. 746–751. [Google Scholar] [CrossRef]
- Liberg, O.; Bergman, J.; Höglund, A.; Khan, T.; Medina-Acosta, G.A.; Rydén, H.; Ratilainen, A.; Sandberg, D.; Sui, Y.; Tirronen, T.; et al. Narrowband Internet of Things 5G Performance. In Proceedings of the 2019 IEEE 90th Vehicular Technology Conference (VTC2019-Fall), Honolulu, HI, USA, 22–25 September 2019; pp. 1–5. [Google Scholar] [CrossRef]
- Matz, A.P.; Fernandez-Prieto, J.A.; Cañada-Bago, J.; Birkel, U. A Systematic Analysis of Narrowband IoT Quality of Service. Sensors 2020, 20, 1636. [Google Scholar] [CrossRef] [PubMed] [Green Version]
- U-Blox. Narrowband IoT (NB-IoT). 2019. Available online: https://www.u-blox.com/en/narrowband-iot-nb-iot (accessed on 1 February 2022).
- Komarizadehasl, S.; Mobaraki, B.; Ma, H.; Lozano-Galant, J.A.; Turmo, J. Development of a Low-Cost System for the Accurate Measurement of Structural Vibrations. Sensors 2021, 21, 6191. [Google Scholar] [CrossRef] [PubMed]
- Daskalos, A.C.; Theodoropoulos, P.; Spandonidis, C.; Vordos, N. Wearable Device for Observation of Physical Activity with the Purpose of Patient Monitoring Due to COVID-19. Signals 2022, 3, 11–28. [Google Scholar] [CrossRef]
- Maier, A.; Sharp, A.; Vagapov, Y. Comparative analysis and practical implementation of the ESP32 microcontroller module for the internet of things. In Proceedings of the 2017 Internet Technologies and Applications (ITA), Wrexham, UK, 12–15 September 2017; pp. 143–148. [Google Scholar] [CrossRef]
- Sensirion. Sensirion-SHTC3. 2020. Available online: https://www.sensirion.com/fileadmin/user_upload/customers/sensirion/Dokumente/2_Humidity_Sensors/Datasheets/Sensirion_Humidity_Sensors_SHTC3_Datasheet.pdf (accessed on 1 February 2022).
- SAMYOUNG. SAMYOUNG-SY-DS-1L. 2020. Available online: http://samyoungsnc.com/wp-content/uploads/2019/03/Datasheet-_-SY-DS-1-Series-Ver.1.8-Standard.pdf (accessed on 1 February 2022).
- Node-RED. Node-RED: Low-Code Programming for Event-Driven Applications. Available online: https://nodered.org/ (accessed on 1 February 2022).
- Malik, H.; Khan, S.Z.; Leonel Redondo Sarmiento, J.; Kuusik, A.; Alam, M.M.; Le Moullec, Y.; Pärand, S. NB-IoT Network Field Trial: Indoor, Outdoor and Underground Coverage Campaign. In Proceedings of the 2019 15th International Wireless Communications Mobile Computing Conference (IWCMC), Tangier, Morocco, 24–28 June 2019; pp. 537–542. [Google Scholar] [CrossRef]
Figure 1.
System Architecture.
Figure 1.
System Architecture.
Figure 2.
Process flow diagram.
Figure 2.
Process flow diagram.
Figure 3.
Smart Tag components: (a) ESP32-WROOM32 SoC, (b) Sensirion SHTC3, (c) SAMYOUNG SY-DS-1L, (d) TP4056 and (e) Simcom SIM7020.
Figure 3.
Smart Tag components: (a) ESP32-WROOM32 SoC, (b) Sensirion SHTC3, (c) SAMYOUNG SY-DS-1L, (d) TP4056 and (e) Simcom SIM7020.
Figure 4.
Smart Tag PCB: (a) Electronic schematic, (b) PCB design and (c) PCB assembly.
Figure 4.
Smart Tag PCB: (a) Electronic schematic, (b) PCB design and (c) PCB assembly.
Figure 5.
Smart Tag’s case: (a) Design and (b) Dimensions.
Figure 5.
Smart Tag’s case: (a) Design and (b) Dimensions.
Figure 6.
Node-RED flow for the user interface.
Figure 6.
Node-RED flow for the user interface.
Figure 7.
User’s interface.
Figure 7.
User’s interface.
Figure 8.
NB-IoT signal strength—RSSI.
Figure 8.
NB-IoT signal strength—RSSI.
Figure 9.
Current consumption of the smart tag.
Figure 9.
Current consumption of the smart tag.
Figure 10.
Smart Tags deployment on each CH site: (a) Saint Nicola Lighthouse—Rhodes, (b) Torred’Orologio—Venice, (c) San Jeronimo Monastery—Granada and (d) Heierstad Loft—Tonsberg.
Figure 10.
Smart Tags deployment on each CH site: (a) Saint Nicola Lighthouse—Rhodes, (b) Torred’Orologio—Venice, (c) San Jeronimo Monastery—Granada and (d) Heierstad Loft—Tonsberg.
Figure 11.
Temperature graph on the four CH sites at 5 and 6 January 2022.
Figure 11.
Temperature graph on the four CH sites at 5 and 6 January 2022.
Figure 12.
Relative Humidity graph on the four CH sites at 5 and 6 January 2022.
Figure 12.
Relative Humidity graph on the four CH sites at 5 and 6 January 2022.
Figure 13.
Smart tag and weather stations positions on map: (a) Weather Station 1, (b) Smart Tag and (c) Weather Station 2.
Figure 13.
Smart tag and weather stations positions on map: (a) Weather Station 1, (b) Smart Tag and (c) Weather Station 2.
Figure 14.
Temperature on Rhodes measured by a Smart Tag and two commercial weather stations.
Figure 14.
Temperature on Rhodes measured by a Smart Tag and two commercial weather stations.
Figure 15.
Relative Humidity on Rhodes at 5 January 2022 measured by a Smart Tag and two commercial weather stations.
Figure 15.
Relative Humidity on Rhodes at 5 January 2022 measured by a Smart Tag and two commercial weather stations.
Table 1.
Cultural heritage sites and Tier 1 building under study.
Table 1.
Cultural heritage sites and Tier 1 building under study.
| Cultural Heritage Sites | Tier 1 Buildings |
|---|
|
Rhodes, Greece | Saint Nicolas lighthouse and fort
Nailac Pier
Roman Bridge
Tomb of Ptolemies
Corinthian Tomb |
| Venice, Italy | Torre d’Orologio |
|
Tonsberg, Norway | Heierstad Loft
Fadum Storehouse
Western Tower
Bentegarden |
| Granada, Spain | San Jeronimo Monastery |
Table 2.
The functionalities provided by the smart tags.
Table 2.
The functionalities provided by the smart tags.
| Functionality | Description |
|---|
|
Temperature and humidity measurements and dew point calculation | Record on a frequent basis (every 30 min) the air temperature and humidity and calculate the dew point temperature in the vicinity of the building walls. |
| Dry/Wet condition | Record on a frequent basis (every 30 min) the dry/wet condition of wall surfaces. |
|
Data storage formatting and forwarding | Forward the measured data to the middle-ware on a daily basis, providing a daily time series of the data in JSON format. |
| Edge processing capabilities | Provide edge processing capabilities to push notifications to the middle-ware when the collected measurements are outside pre-defined, pilot-specific thresholds. |
|
Multiple network options | Smart Tag support multiple networks and communication protocols: WiFi, Bluetooth and LPWAN networks, such as NB-IoT. |
| Low-power mode | Micro-controller operates on a low-power mode (deep sleep) most of the time to reduce power consumption to some A and wake up only to measure or publish data. |
|
Power management capability | The smart tag is powered by a rechargeable battery and a solar panel to ensure that they will meet the requirements for autonomy and long operational life. External power source via micro-USB is also possible. |
| Power monitoring capability | The device monitors the battery power level in percent (0–100%) and set up an alert when it is low. |
|
WiFi access point capability for configuration | The smart tag can enter into a WiFi access point for the configuration of its WiFi connection. |
| Over the Air Programming | Automatic and contact less programming and firmware updating via WiFi connection. |
Table 3.
The Smart Tags’ distribution in the Tier 1 buildings of CH sites.
Table 3.
The Smart Tags’ distribution in the Tier 1 buildings of CH sites.
| Tier 1 Building | Quantity | Smart Tags’ IDs |
|---|
| Saint Nikolas lighthouse and fort | 4 | Rho01, Rho02, Rho03, Rho04 |
| Nailac Pier Tower | 2 | Rho05, Rho06 |
|
Roman Bridge | 2 | Rho07, Rho08 |
| Tomb of Ptolemies in Rhodini | 1 | Rho09 |
|
Corinthian Tomb in Rhodini | 1 | Rho10 |
| Bentegården | 4 | Ton01, Ton02, Ton03, Ton04 |
|
The Heierstad Loft | 3 | Ton05, Ton06, Ton07 |
| Fadum storehouse | 3 | Ton08, Ton09, Ton10 |
|
The Western Tower | 2 | Ton11, Ton12 |
| San Jeronimo Monastery | 6 | Ven01, Ven02, Ven03, Ven04, Ven05, Ven06 |
|
Torre dell’Orologio | 6 | Gra01, Gra02, Gra03, Gra04, Gra05, Gra06 |
Table 4.
The Smart Tags’ place of installation.
Table 4.
The Smart Tags’ place of installation.
| Smart Tag ID | Place of Installation | Orientation | Height (m) |
|---|
|
Rho01 | Lighthouse’s exterior walls | South | 5.5 |
| Rho02 | Lighthouse’s exterior walls | North | 5.5 |
|
Rho03 | Fort’s exterior walls | West | 3.3 |
| Rho04 | Fort’s exterior walls | East | 3.3 |
|
Rho05 | Tower’s exterior walls | East | 12 |
| Rho06 | Tower’s interior walls | West | 35 |
|
Rho07 | Roman Bridge’s supports | South | 3.2 |
| Rho08 | Roman Bridge’s supports | North | 3.4 |
|
Rho09 | Ptolemies Tomb’s stone | South | 2.5 |
| Rho10 | Corinthian Tomb’s stone | South | 3 |
|
Tons01 | Bentegardens’s exterior side | South | 3.5 |
| Tons02 | Bentegardens’s exterior side | West | 3.3 |
|
Tons03 | Bentegardens’s exterior side | East | 3.5 |
| Tons04 | Inside the Bentegarden building | North | 2.2 |
|
Tons05 | Heierestad Loft ’s exterior side | North | 5.4 |
| Tons06 | Heierestad Loft ’s exterior side | South | 5.4 |
|
Tons07 | Inside the Heierestad Loft | East | 4.2 |
| Tons08 | Fadum storehouse’s exterior side | South | 3.8 |
|
Tons09 | Fadum storehouse’s exterior side | North | 3.6 |
| Tons10 | Inside the Fadum storehouse | East | 4 |
|
Tons11 | Western Tower’s exterior side | North | 2.5 |
| Tons12 | Western Tower’s exterior side | West | 2.7 |
|
Gra01 | San Jeronimos’s exterior side | East | 15 |
| Gra02 | San Jeronimos’s exterior side | West | 25 |
|
Gra03 | San Jeronimos’s exterior side | West | 10 |
| Gra04 | San Jeronimos’s exterior side | South | 16 |
|
Gra05 | San Jeronimos’s exterior side | North | 18 |
| Gra06 | Inside the San Jeronimo monastery | East | 20 |
|
Ven01 | Torre d’Orologio ’s Exterior side | South | 21 |
| Ven02 | Torre d’Orologio ’s Exterior side | North | 12 |
|
Ven03 | Torre d’Orologio ’s Exterior side | North | 6 |
| Ven04 | Torre d’Orologio ’s Exterior side | East | 15 |
|
Ven05 | Torre d’Orologio ’s Exterior side | West | 13 |
| Ven06 | Inside the Toree d’Orologio building | South | 3 |
| Publisher’s Note: MDPI stays neutral with regard to jurisdictional claims in published maps and institutional affiliations. |
© 2022 by the authors. Licensee MDPI, Basel, Switzerland. This article is an open access article distributed under the terms and conditions of the Creative Commons Attribution (CC BY) license (https://creativecommons.org/licenses/by/4.0/).


