Article

Insights into the Potential of Buckwheat Flour Fractions in Wheat Bread Dough

by
Ionica Coţovanu
1,*,
Costel Mironeasa
2 and
Silvia Mironeasa
1,*
1
Faculty of Food Engineering, Ștefan cel Mare University of Suceava, 13 Universitatii Street, 720229 Suceava, Romania
2
Faculty of Mechanical Engineering, Automotive and Robotics, Ștefan cel Mare University of Suceava, 13 Universitatii Street, 720229 Suceava, Romania
*
Authors to whom correspondence should be addressed.
Appl. Sci. 2022, 12(5), 2302; https://doi.org/10.3390/app12052302
Submission received: 23 January 2022 / Revised: 17 February 2022 / Accepted: 18 February 2022 / Published: 22 February 2022
(This article belongs to the Special Issue Trends in Grain Processing for Food Industry)

Abstract

:
Buckwheat flour fractions with different particle sizes (PS), comprising various concentrations of valuable nutritional components, represent an opportunity to enhance refined wheat bakery products. The aim of this research was to assess the potential of buckwheat flour (BF) fractions (large, L > 300 μm, medium, 180 μm < M < 300 μm and small, S < 180 μm) to substitute refined wheat flour at 0, 5, 10, 15, and 20% in wheat bread dough and to establish the optimal amount for each fraction. The results revealed significant changes during different bread-making stages and on the finished product. A decrease in falling number index, water absorption, starch gelatinization, elastic modulus, and bread hardness with increasing PS was observed. The increase of BF amount led to an increase in dough development time, speed of protein weakening, gel starch stability, alveograph ratio, rheofermentation properties, maximum creep-recovery compliance, and bread hardness. The optimal values for falling number, mixing–heating–cooling dough parameters, dough biaxial extension, rheofermentation, storage and loss moduli, creep-recovery compliance, loaf volume, and bread hardness were obtained depending on PS based on the generation of predictive models. It was established that the best formulations, with respect to dough rheology and bread characteristics, included BF at 9.13% for large, 10.57% for medium, and 10.25% for small PS.

1. Introduction

Baking is a component of the market surrounding the demand for conventional food, in which the element of innovation is gradually taking over. Bread is generally obtained from wheat flour, but over the course of the refining process, wheat flour loses valuable nutritional substances such as minerals, vitamins, and fibers, which are found mainly in the outer layers of the grain shell [1,2]. Many manufacturers are concentrating their efforts on improving the commercial quality of baking products, often to the detriment of their nutritional value.
In recent years, various scientific research and innovation efforts have been directed towards the nutritional enrichment of refined wheat flour, especially by adding vegetables and pseudocereals [1]. One solution has been presented in the form of the use of different milling fractions of protein-rich flour, such as buckwheat flour.
Buckwheat is a pseudocereal from the genus Fagopyrum containing three species (F. esculentum, F. tataricum, and F. cymosum), but F. esculentum Moench is the most widely cultivated for human food [3]. It contains proteins with high nutritional value, due to its well-balanced amino acid composition, especially lysine, arginine, methionine, and tryptophan [4,5], which are only present in limited quantities in most grains. Buckwheat proteins are rich in albumin and globulin, but very poor in prolamin and glutein, and are characterized by the absence of structure-forming gluten, resulting in buckwheat dough having poor resistance [6]. Buckwheat is considered a valuable ingredient for obtaining bakery products with high nutritional value, because it represents a valuable source of fiber, minerals, and other bioactive compounds with health benefits [7,8].
The chemical composition of buckwheat flour depends on the particle size (PS) following the milling and sieving process, which is correlated with the relative abundance of the seed tissues [9]. Buckwheat seed particles contains various proportions of central endosperm, which is rich in starch (81.2–75%), protein (5.4–6%), lipid (0.7–1%), and dietary fibers (3%), while the embryo contains high amounts of protein (12–27.7%), lipid (4–5.2%), dietary fibers (3.8–7%), and minerals (K, P, Mg, Ca) [8,9,10,11]. In a previous study, significant differences between the chemical composition of different sizes of buckwheat particle were found. The medium-sized particles were richest in protein (26.61%), lipid (5.61%), and ash (4.23%), while large and small particles contained high values of carbohydrate content (74.02% and 73.96%, respectively) [12]. Yu and collaborators (2018) [8] stated that buckwheat flour obtained from the central endosperm is rich in starch, and is used mainly in pancakes, breads, and soba noodles. The variation in the particle size distribution of cereal flours, fluctuating with respect to their chemical and physical properties, plays an essential role in the quality characteristics of their resulting products [13]. Various studies have evaluated the particle size of cereals and pseudocereals and highlighted its crucial effect on proximate composition, dough rheology, and the final baked products [14,15]. Song et al. (2016) [16] stated that particle size is one of the important factors, and can exert a remarkable effect on the characteristics of wheat flour and its baked products. In a previous study [17], it was shown that the flour fractions with a medium particle size separated by sieving offered better baking quality. On the other hand, another study [18] showed that flour fractions with a fine particle size separated by air classification offered better baking quality due to the higher protein content found in these fractions. Different baking results were found when flours with different particle sizes, but the same content of proteins were used [19]. Milling and sieving technologies can be used to obtain specific particle sizes with different structural characteristics and chemical compositions that impact dough rheology and final product quality [20,21]. Knowledge is needed regarding the simultaneous influence of PS and the amount of added BF on functional and structural properties in order to confirm the suitability of their use in the development of baked products, given that PS influences dough rheology and the quality of baked products [22,23]. Empirical dough testing methods such as falling number, Mixolab, alveograph, rheofermentometer, and, recently, the dynamic rheometer have been used in various studies to assess the rheological properties of dough, elucidating the interaction among dough components [24,25] that influence the technological process, and consequently the characteristics of the bread. Understanding the rheological properties of the dough in the formula when developing future products is important in predicting dough behavior during processing, with its quality affecting the finished loaf of bread. A dough for producing high-quality loaves must have a sufficiently high viscosity in order to prevent the ascent of gas cells, and it must remain extensible long enough during baking to avoid premature rupture of the membranes between gas cells [26]. To ensure the stability of gas cells, the dough needs to be sufficiently extensible to respond to gas pressure, but also strong enough to resist collapse [27]. The rheological properties are largely determined by the wheat gluten proteins, interactions between the gluten protein matrix and non-gluten proteins, and other flour components (e.g., flour lipids, fibers, non-gluten proteins) that may affect the rheological properties [28]. Loaf volume and texture profile analysis are used to evaluate the characteristics of the final baked products, and these are essential parameters influencing consumer purchase decisions.
In our previous research [15,29], we investigated the chemical composition, functional properties, microstructure, and molecular characteristics of buckwheat flour fractions, and the effect of their addition on the empirical rheology of wheat flour dough. Considering the factors mentioned above and the lack of studies regarding the influence of the incorporation of buckwheat flour with different particle sizes in wheat bread, this research aims to investigate how buckwheat flour at specific particle sizes and different addition levels affects the wheat flour amylase activity, dough behavior during mixing, heating–cooling stages, biaxial extension, rheofermentation, oscillatory and creep-recovery tests, and bread quality parameters in order to establish an optimal wheat–buckwheat composite flour for each particle size. The scientific research on buckwheat flour fractions addition in wheat flour is sparse; therefore, the present investigation focuses on complex rheological characterization and impact on bread characteristics.

2. Materials and Methods

2.1. Material Used

In this study, wheat flour with an extraction rate of 65% (harvest 2020) acquired from a local mill (Mopan S.R.L., Suceava County, România) was used. The samples were analyzed as described in the Romanian standard method (SR 90: 2007) [30]: gluten deformation (6.00 mm) and wet gluten (30.00%), and using the International Association for Cereal Chemistry (ICC) method [31]: moisture content (110/1), fat content (ICC 136), protein content (ICC 105/2), ash content (ICC 104/1), and falling number (ICC 107/1). The determination of total carbohydrate content was performed based on the difference of mean values: 100—(the amount of the protein, moisture content, fat, and ash) [12]. Milling fractions at three different particle sizes (large, L > 300 μm; medium, 180 μm < M < 300 μm; and small, S < 180 μm fractions) were obtained by subjecting buckwheat seeds (Sanovita, România) to a milling and sieving process, according to the methods reported in our previous research [15,29]. The approximate composition of the buckwheat grain, including moisture (13.28%), protein (13.26%), ash (2.00%), and fat (3.40%), along with the analytical characteristics of buckwheat flour (BF) fractions, was determined and reported in a previous work [29].

2.2. Composite Flour Formulations and Bread Processing

Each buckwheat milling fraction with three particle sizes (L, M, and S) was incorporated into refined wheat flour at five levels (0, 5, 10, 15, and 20%), and then mixed for 30 min (Yucebas Y21 mixer, Izmir, Turkey). Using a full factorial design, a set of 15 samples was obtained (Table 1). The experimental breads contained 300 g wheat–buckwheat flour, commercial fresh yeast of the type Saccharomyces cerevisiae (3% flour basis), salt (1.8% flour basis), and water up to the optimum wheat–buckwheat composite flour hydration capacity. The amount of water required to form the desired dough consistency was calculated based on the water absorption capacity of the flour, tested at Mixolab (Chopin, Tripetteet Renaud, Paris, France), ranging from 57.60 to 58.70%, depending on the level of addition and the particle size of the buckwheat flour.
The bread recipe was based on a biphasic procedure according to the method of Coțovanu et al. (2021) [12]. Half of the quantity of flour was mixed with water and yeast, and left to sit for leaven development (2 h, 30 ± 2 °C, and 85% relative humidity) inside a leavening room PL2008 (Piron, Cadoneghe, Padova, Italy). When the process was finished, the obtained leaven was mixed with the rest of the flour and salt in a laboratory mixer (Kitchen Aid, Benton Harbor, MI, USA) at 200 rpm for 10 min, and left for fermentation under the same conditions (1 h). Then, the dough samples were manually molded, placed into aluminum trays for final fermentation (1 h), and baked in an oven (Caboto PF8004D, Cadoneghe, Padova, Italy) for 25 min at 220 °C. The cooled experimental breads (2 h) were investigated with respect to their physical and textural characteristics.

2.3. Empirical Dough Rheology

The falling number index (FN) of the formulated flour samples was determined using a Falling Number device (Perten Instruments AB, Stockholm, Sweden) in order to evaluate the α-amylase activity.
Dough characterization during the mixing and heating–cooling stages was performed using Mixolab equipment (Chopin Technologies, Paris, France) according to ICC standard method 173. The instrumental settings defined in the Mixolab were as follows: total analysis time: 45 min; heating rate: 4 °C/min; and mixing tank temperature of 30 °C. All the samples were made at the optimum hydration level for achieving the optimum dough consistency with respect to a target torque (C1) of 1.10 N∙m. The following parameters were evaluated on the basis of the Mixolab curve: water absorption (WA), dough development time (DT), dough stability (ST), the speed of protein weakening due to heat (C1-2), starch gelatinization (C3-2), cooking stability (C3-4), and starch retrogradation during the cooling stage (C5-4).
The biaxial extension of the dough was analyzed using an alveograph (Chopin Technologies, Cedex, France) according to American Association of Cereal Chemists (AACC) International approved method 54–30.02 at constant hydration with a 14% moisture basis and 2.50% salt. The alveograph test was performed to determine the following parameters: dough tenacity (P), dough extensibility (L), deformation energy (W), and alveograph ratio (P/L).
Rheofermentation parameters were analyzed using a Rheofermentometer F4 device (Chopin Technologies, France) according to AACC method 89–01.01. The following characteristics were determined: the maximum height of the gas release curve (H’m), the total volume of gas produced (TV), the volume of the gas retained in the dough (VR), and retention coefficient (CR).

2.4. Dynamic Dough Rheology

The dynamic oscillatory measurements of the dough made with the composite flours were obtained by performing a preliminary stress sweep test to identify the limits of the linear viscoelastic region (LVR), increasing the strain from 0.01 to 1%, at a constant oscillation frequency of 1 Hz, according to Mironeasa and Mironeasa (2019) [32]. The dough samples were prepared without yeast and salt, and were placed at optimum water absorption (determined using Mixolab, until optimum consistency had been achieved) in a Mars 40 rheometer (Thermo-Haake, Karlsruhe, Germany) coupled with a Peltier temperature control unit, using a parallel plate–plate geometry (40 mm diameter) and a gap of 4 mm, chosen based on the viscosity range of dough. The samples were left to rest for 5 min before testing to allow relaxation and to stabilize the temperature, according to settings from other studies; all measurements were performed at 20.0 ± 0.1 °C [25,32,33]. The excess dough was trimmed, and a layer of Vaseline was applied to the exposed edge of the sample to avoid the evaporation of moisture during testing. Frequency sweep tests were performed in an oscillation frequency range from 0.01 to 20 Hz, with a constant stress of 10 Pa, which was previously established in the LVR test. In the oscillatory test, the elastic or storage modulus, G′, viscous or loss modulus, G″, and loss tangent, tan δ (G″/G′), were acquired as a function of frequency using the Rheowin Job software (v.4.86, Haake). For the temperature sweep test, the dough samples were heated from 20 to 100 °C at a rate of 4.0 ± 0.1 °C/min, at a constant strain of 0.10%, and a frequency of 1 Hz, to determine the maximum gelatinization temperature (Tmax) [34,35] corresponding to the maximum value of loss modulus.
To simulate different stresses during the breadmaking process, a creep-recovery test with small forces was applied. The dough was kept under a constant stress of 25 Pa for 60 s, and after removing the shear stress, there was a relaxation time of 180 s [25,35]. The maximum compliance (Jcmax) value reached in the creep phase after 60 s, corresponding to the maximum deformation, was reported, as well as the maximum compliance value at the end of the recovery phase (Jrmax), related to partial reformation after stress removal.

2.5. Physical and Textural Characteristics of Bread

Two hours after baking, when the samples were cooled, bread volume (BV) was analyzed in accordance with the Romanian standard procedure SR 90:2007 [30]. Loaf volume (cm3) was obtained by employing the rapeseed displacement method. The bread hardness (BH) was determined using a TVT-6700 texture analyzer (Perten Instruments, Hägersten, Sweden). Bread slices were compressed twice with a 2.5-cm stainless-steel cylinder, with a penetration depth of 20%, a speed of 1.0 mm/s, an auto-trigger force of 5.0 g, and a time between compressions of 15 s.

2.6. Statistical Analysis

Data modeling was carried out using a trial version of the Design-Expert 12.0 software (Stat-Ease, Inc., Minneapolis, MN, USA). The values of the determined parameters for all formulations are shown in Table 1a–c.
The influence of the factors PS (L, M, and S) and BF addition level (0, 5, 10, 15, and 20%) on empirical and dynamic rheological properties of the dough, as well as on some of the technical characteristics of the bread, were evaluated using a full factorial design () and Response Surface Methodology. Analysis of variance (ANOVA) was applied in order to evaluate the influence of factors and their interactions (at a confidence level of 95%) on the following responses: FN, WA, DT, ST, C1-2, C3-2, C3-4, C5-4, P, L, W, P/L, H’m, TV, VR, CR, G′, G″, tan δ, Tmax, Jcmax, Jrmax, BV, and BH. The most adequate model for predicting experimental data variation for each response was chosen by taking into account F-test values, coefficient of determination (R2), and adjusted coefficients of determination (Adj.-R2).
Optimization of the BF addition level for each PS was performed by applying multiple response analysis to the predictive models generated, in conjunction with the desirability function approach. In this process, each predicted response is transformed into an individual desirability function, dn, which includes the researcher’s desired priorities when building the optimization procedure for each of the factors. The individual desirability functions are then combined into an objective function, named the overall desirability function, D, computed as the geometric mean of values of the individual desirability function, dn, which varies from 0 to 1 [36,37]. For this purpose, for each response, the desired goals were: BF addition level, ST, C3-4, H’m, TV, VR, CR, W, Jrmax, and BV set at maximum value; minimization of C1-2, C5-4, P/L; and the level of all remaining responses maintained within range.

3. Results

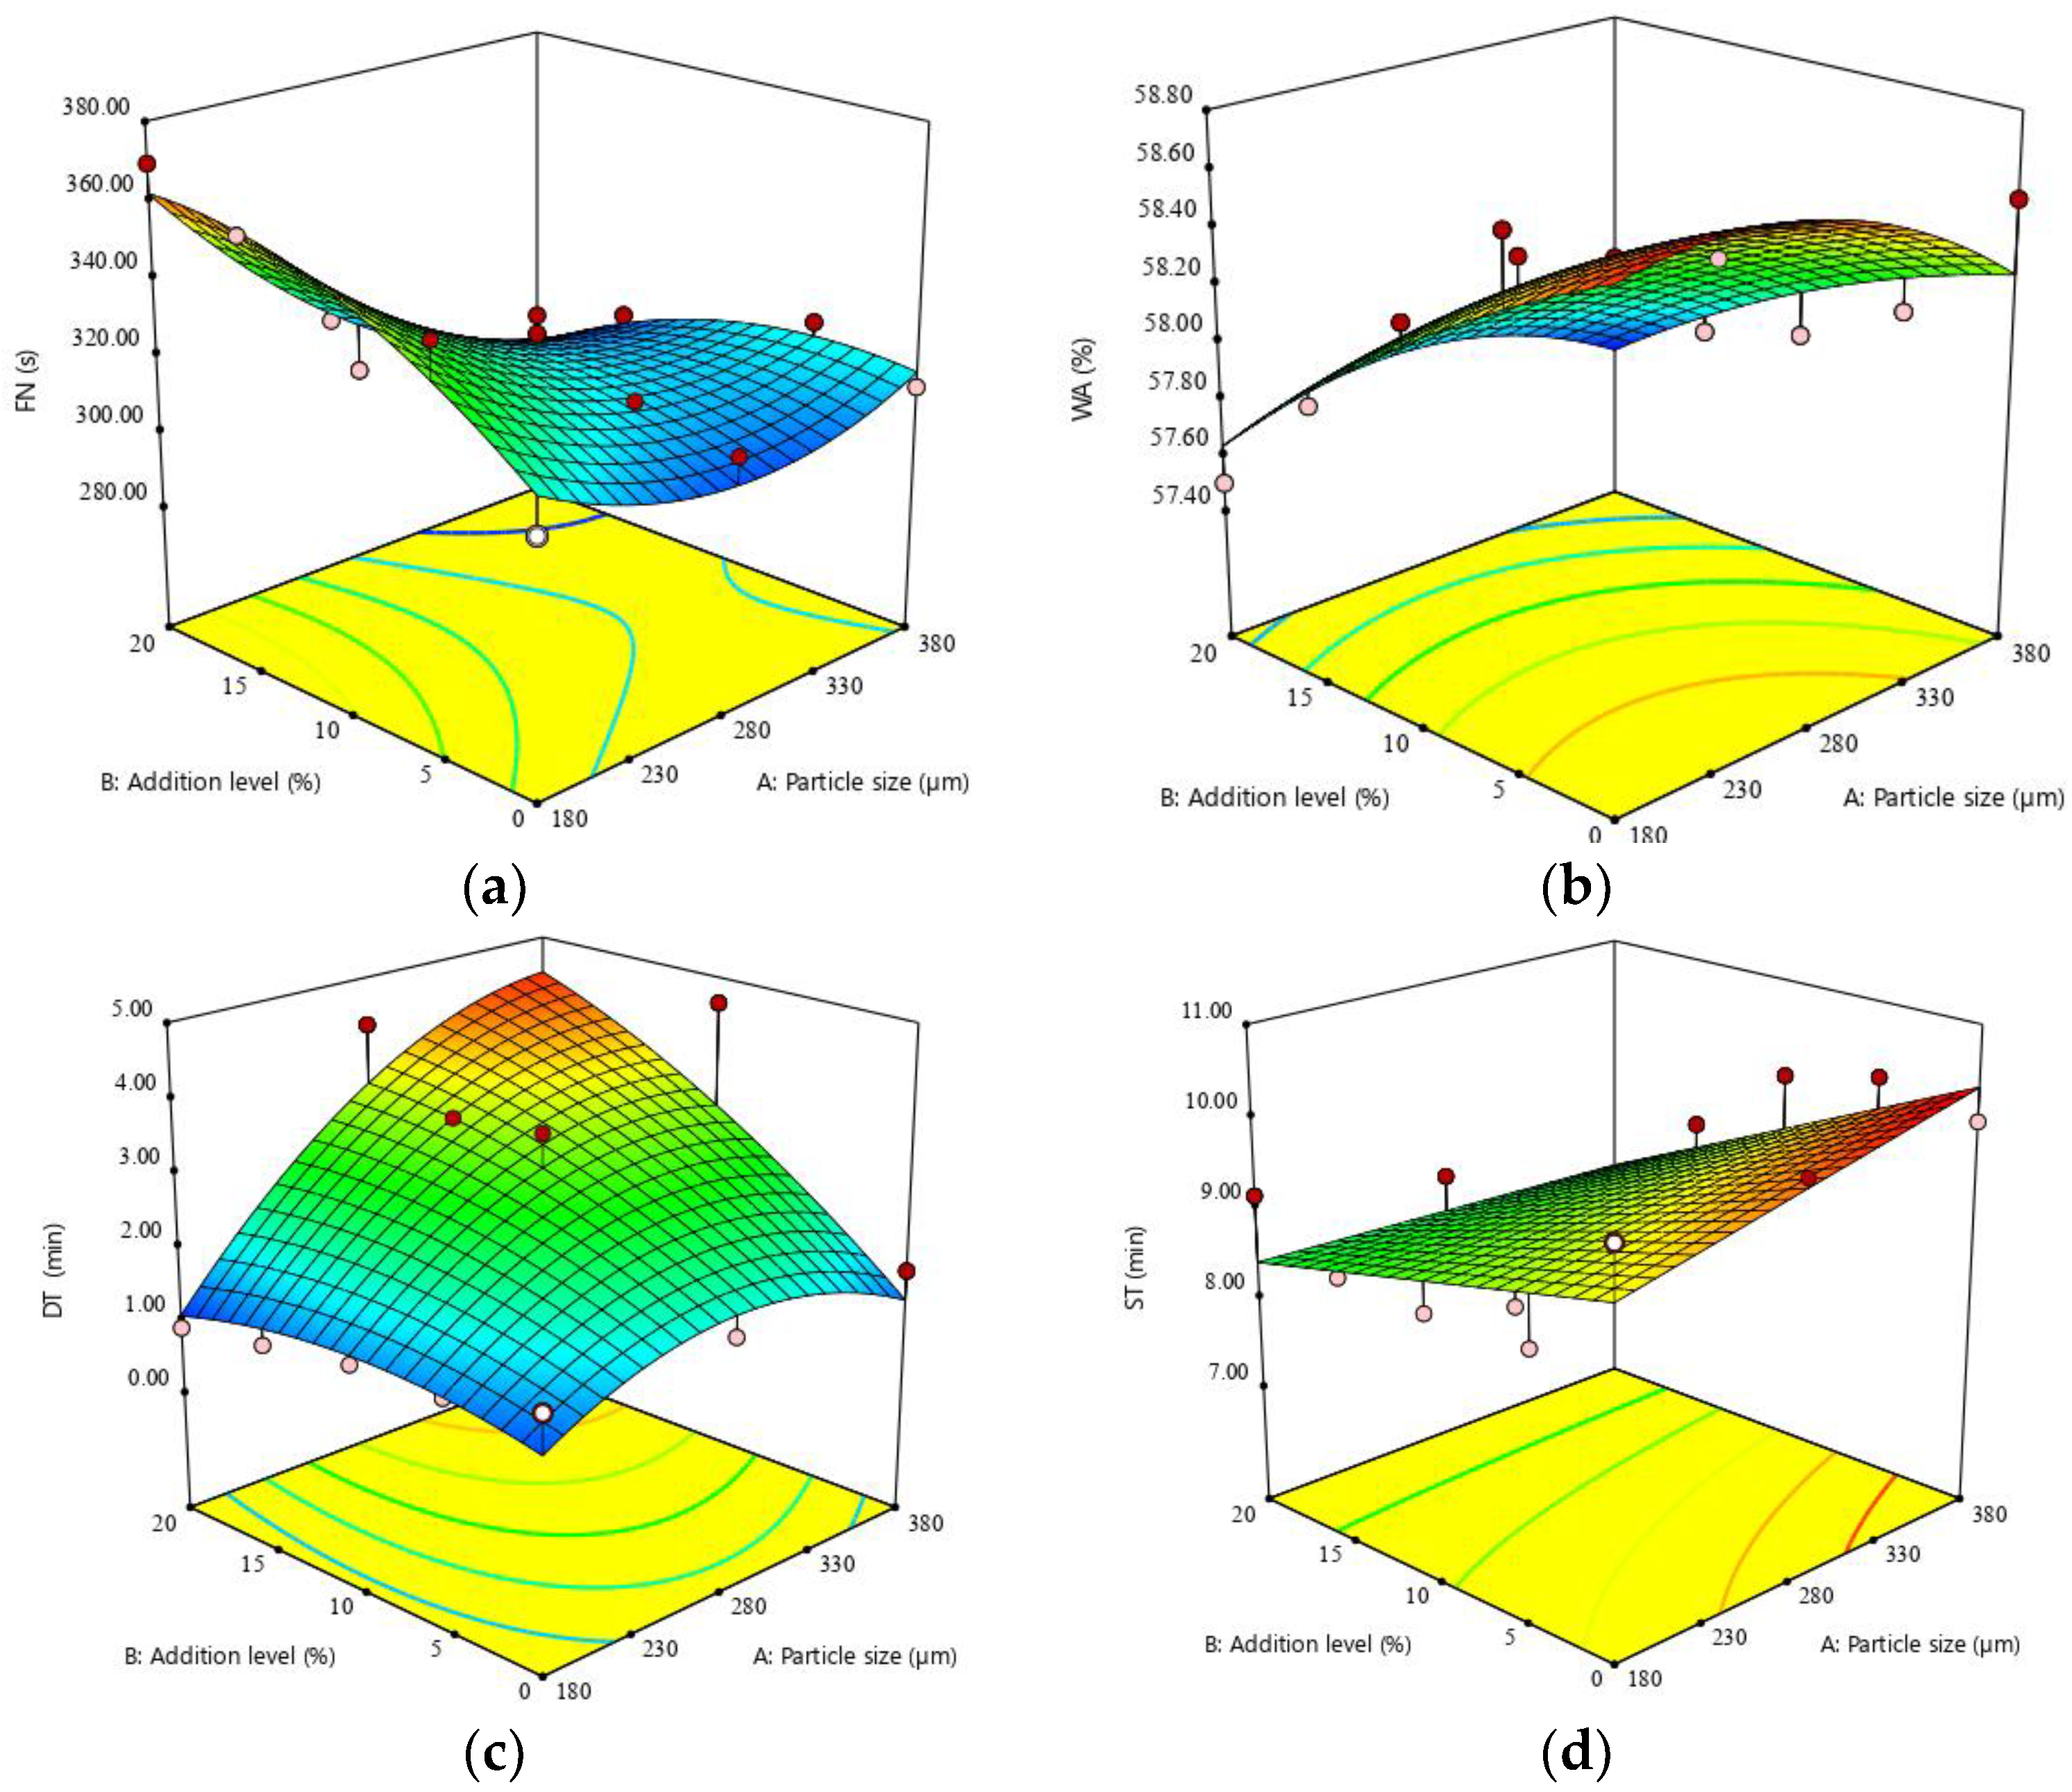
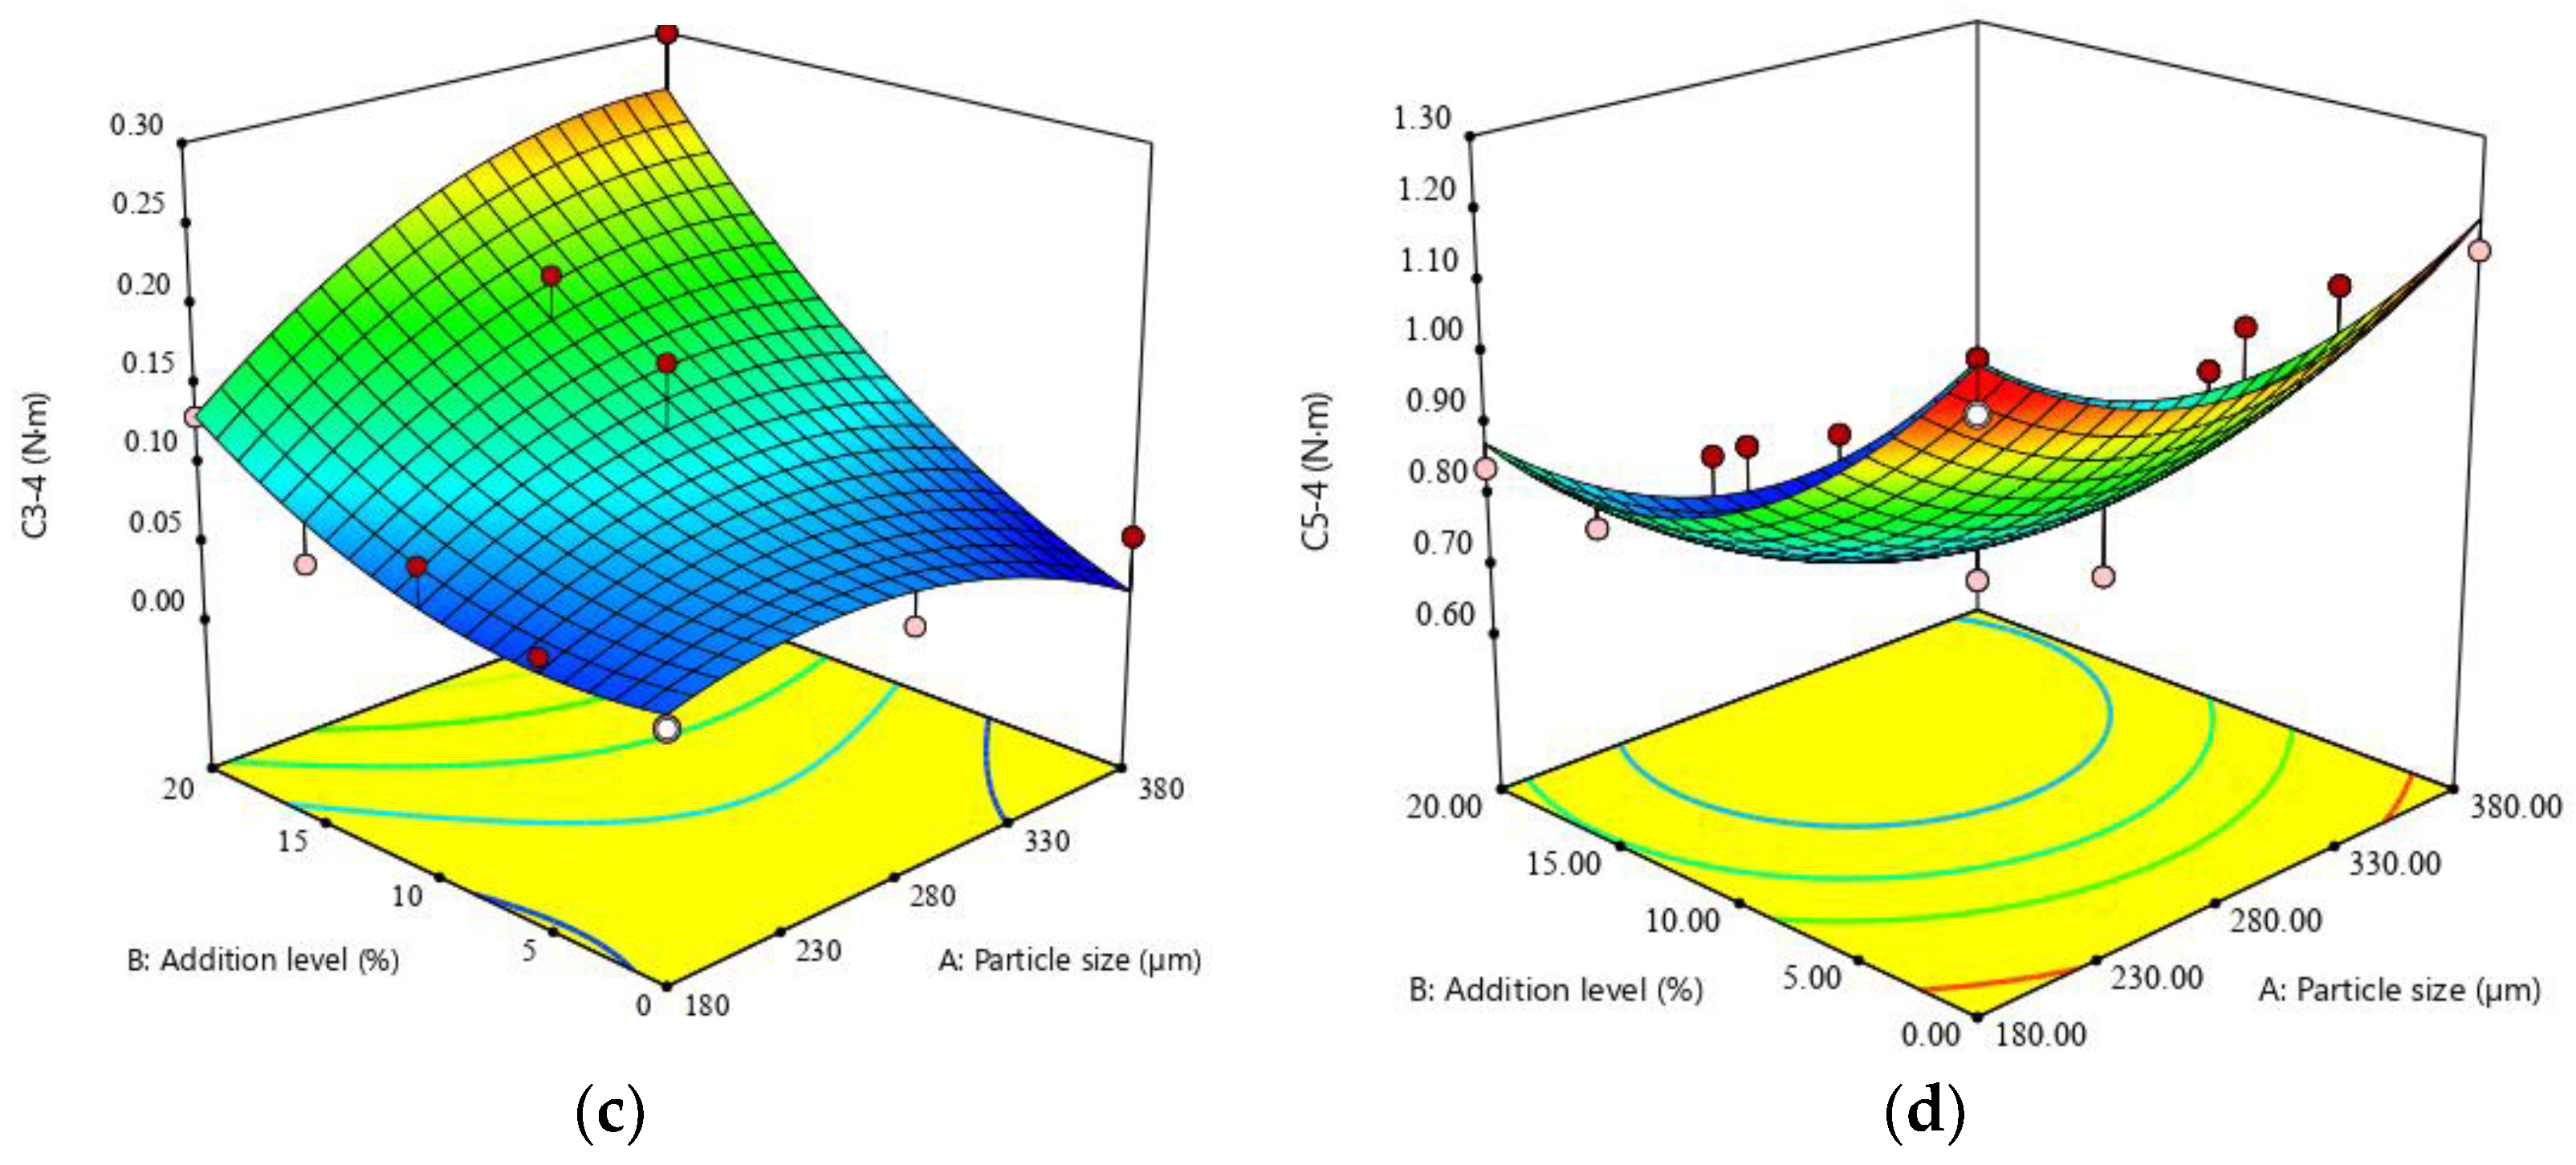
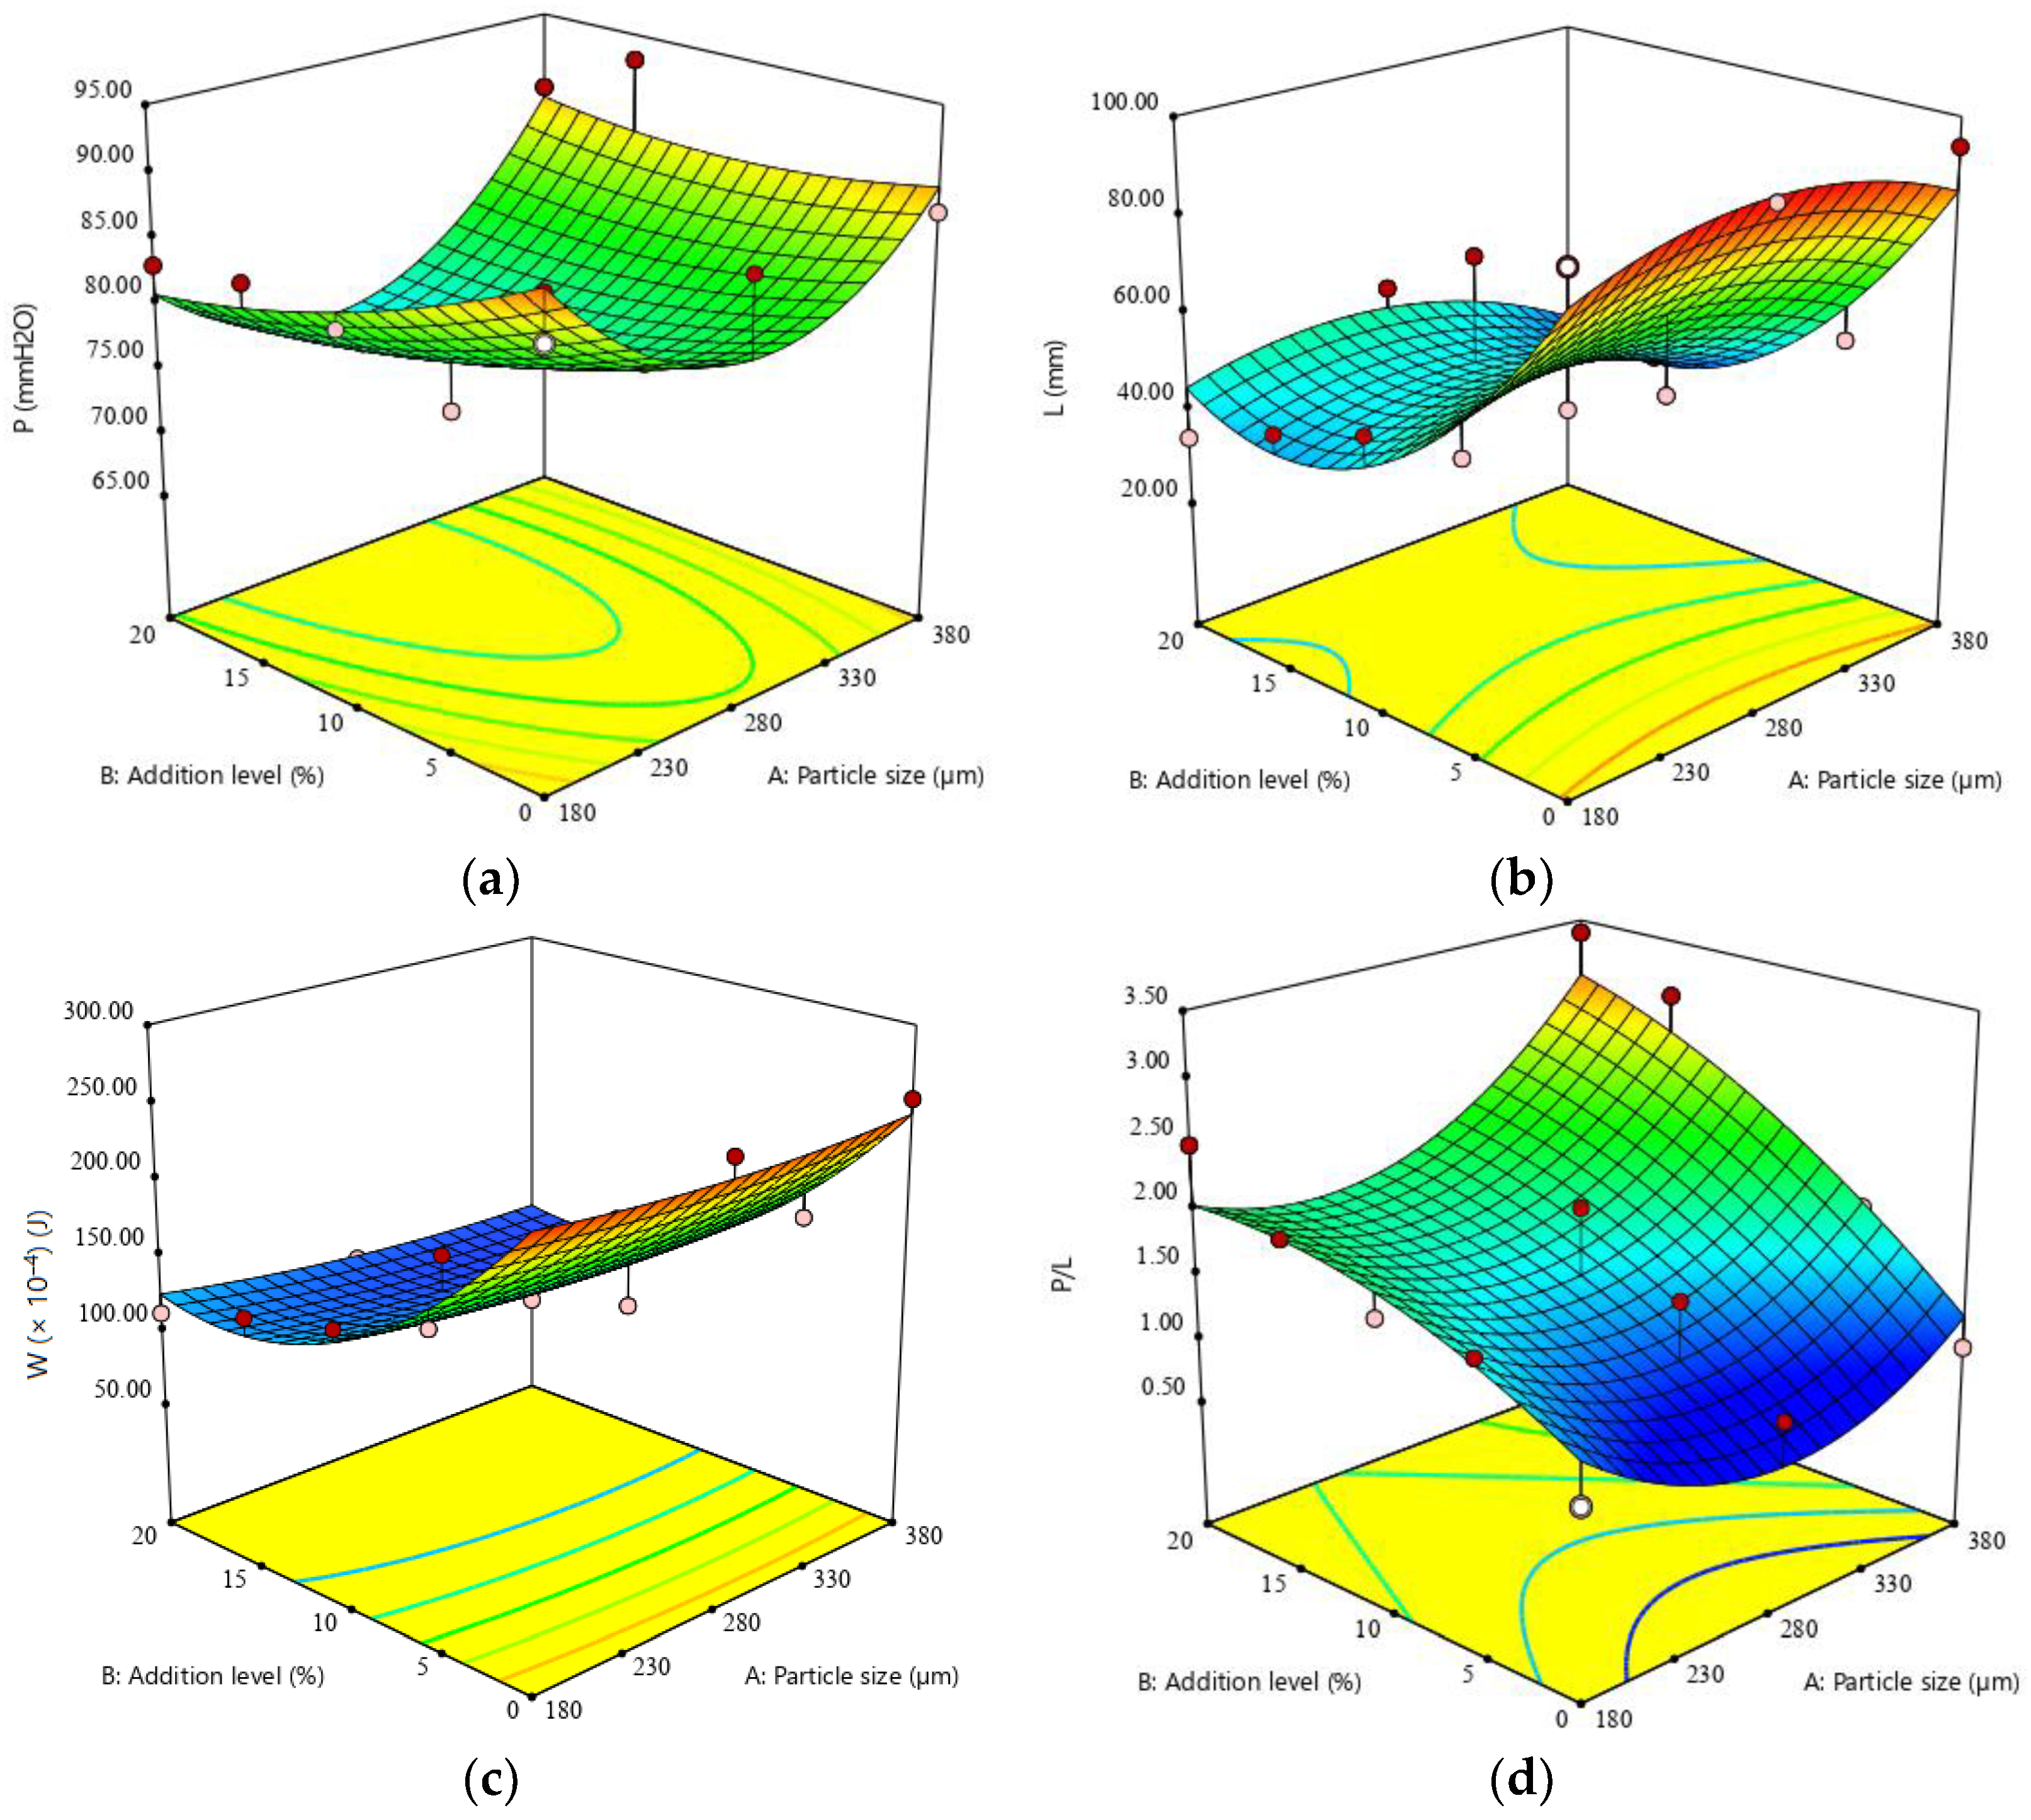
3.1. Effects of Formulated Factors on FN, Mixolab, and Alveographic Parameters

The quadratic model adequately represents the data for falling number, water absorption, development time, speed protein weakening, starch gelatinization, hot starch stability, starch retrogradation, dough tenacity, dough extensibility, deformation energy, and alveograph ratio, explaining between 66 and 93% of the variation, whereas the two-factor interaction (2FI) model obtained for dough stability explained 51% of the variation (Table 2).
The falling number was negatively influenced by particle size, and a decrease in this parameter was observed with increasing PS (Figure 1). The linear and quadratic effect of the level of buckwheat addition in wheat flour had no significant (p ˃ 0.05) effect on FN, while the interaction between factors led to a considerably lower FN with increasing interaction between the factors.
During Mixolab measurements the mixing and baking processes were simulated, because the protein and starch behavior are key factors in predicting technical properties in baking. As can be seen from Table 2, the PS and addition level influenced were remarkably negatively correlated with water absorption (WA).
When BF particle size and addition level decreased, WA increased (Figure 1). Particle size and the addition level of buckwheat flour, as well as the interaction between these factors, exerted a considerable influence on dough development time (DT) (Table 2). The variations of DT with buckwheat flour PS and addition levels presented an increase in DT with an increase of both factors (Figure 1). Buckwheat flour addition level showed a positive significant (p ˂ 0.05) influence on dough stability (ST), while PS had no significant effect (Table 2), with DT decreasing proportionally with increasing BF addition level (Figure 1). The rate of protein thermal weakening (C1-2) was significantly influenced by the BF addition level, while the PS did not influence this parameter (p ˃ 0.05) (Table 2).
The response surface plot (Figure 2) reveals an increase of C1-2 with increasing BF addition level. The degree of starch gelatinization (C3-2) is substantially affected by the linear terms of both factors, PS and addition level, as well as by the interaction between them, and by the quadratic term of PS (Table 2). Increases in PS and addition level were correlated with a decrease in C3-2 (Figure 2). The hot-starch gel stability (C3-4) was found to be significantly (p ˂ 0.05) influenced by BF addition level and by the interaction between PS and BF addition level, while the linear term of PS did not affect gel stability (Table 2). Hot-gel stability (or cooking stability) increases with increasing BF addition level, as can be observed from the surface response graph (Figure 2). Starch retrogradation (C5-4) of composite flour dough was significantly influenced by the amount of BF added (Table 2) and quadratic term of PS. Figure 2 shows a decrease in C5-4 values with increasing BF addition level, revealing a low starch retrogradation.
Regarding the alveograph characteristics, the linear term of PS and the BF addition level did not significantly affect dough tenacity (p > 0.05), while the quadratic term of PS was correlated with an increase in this parameter with increasing PS. BF addition level showed a considerable influence on the dough extensibility, deformation energy, and alveograph ratio parameters (Table 2). The response surface plots shown in Figure 3 for dough tenacity, extensibility and deformation energy are characteristic for the quadratic model, and show a decrease in these parameters with increasing addition level. On the other hand, the alveograph ratio exhibits an increasing trend with increasing BF addition level and PS.

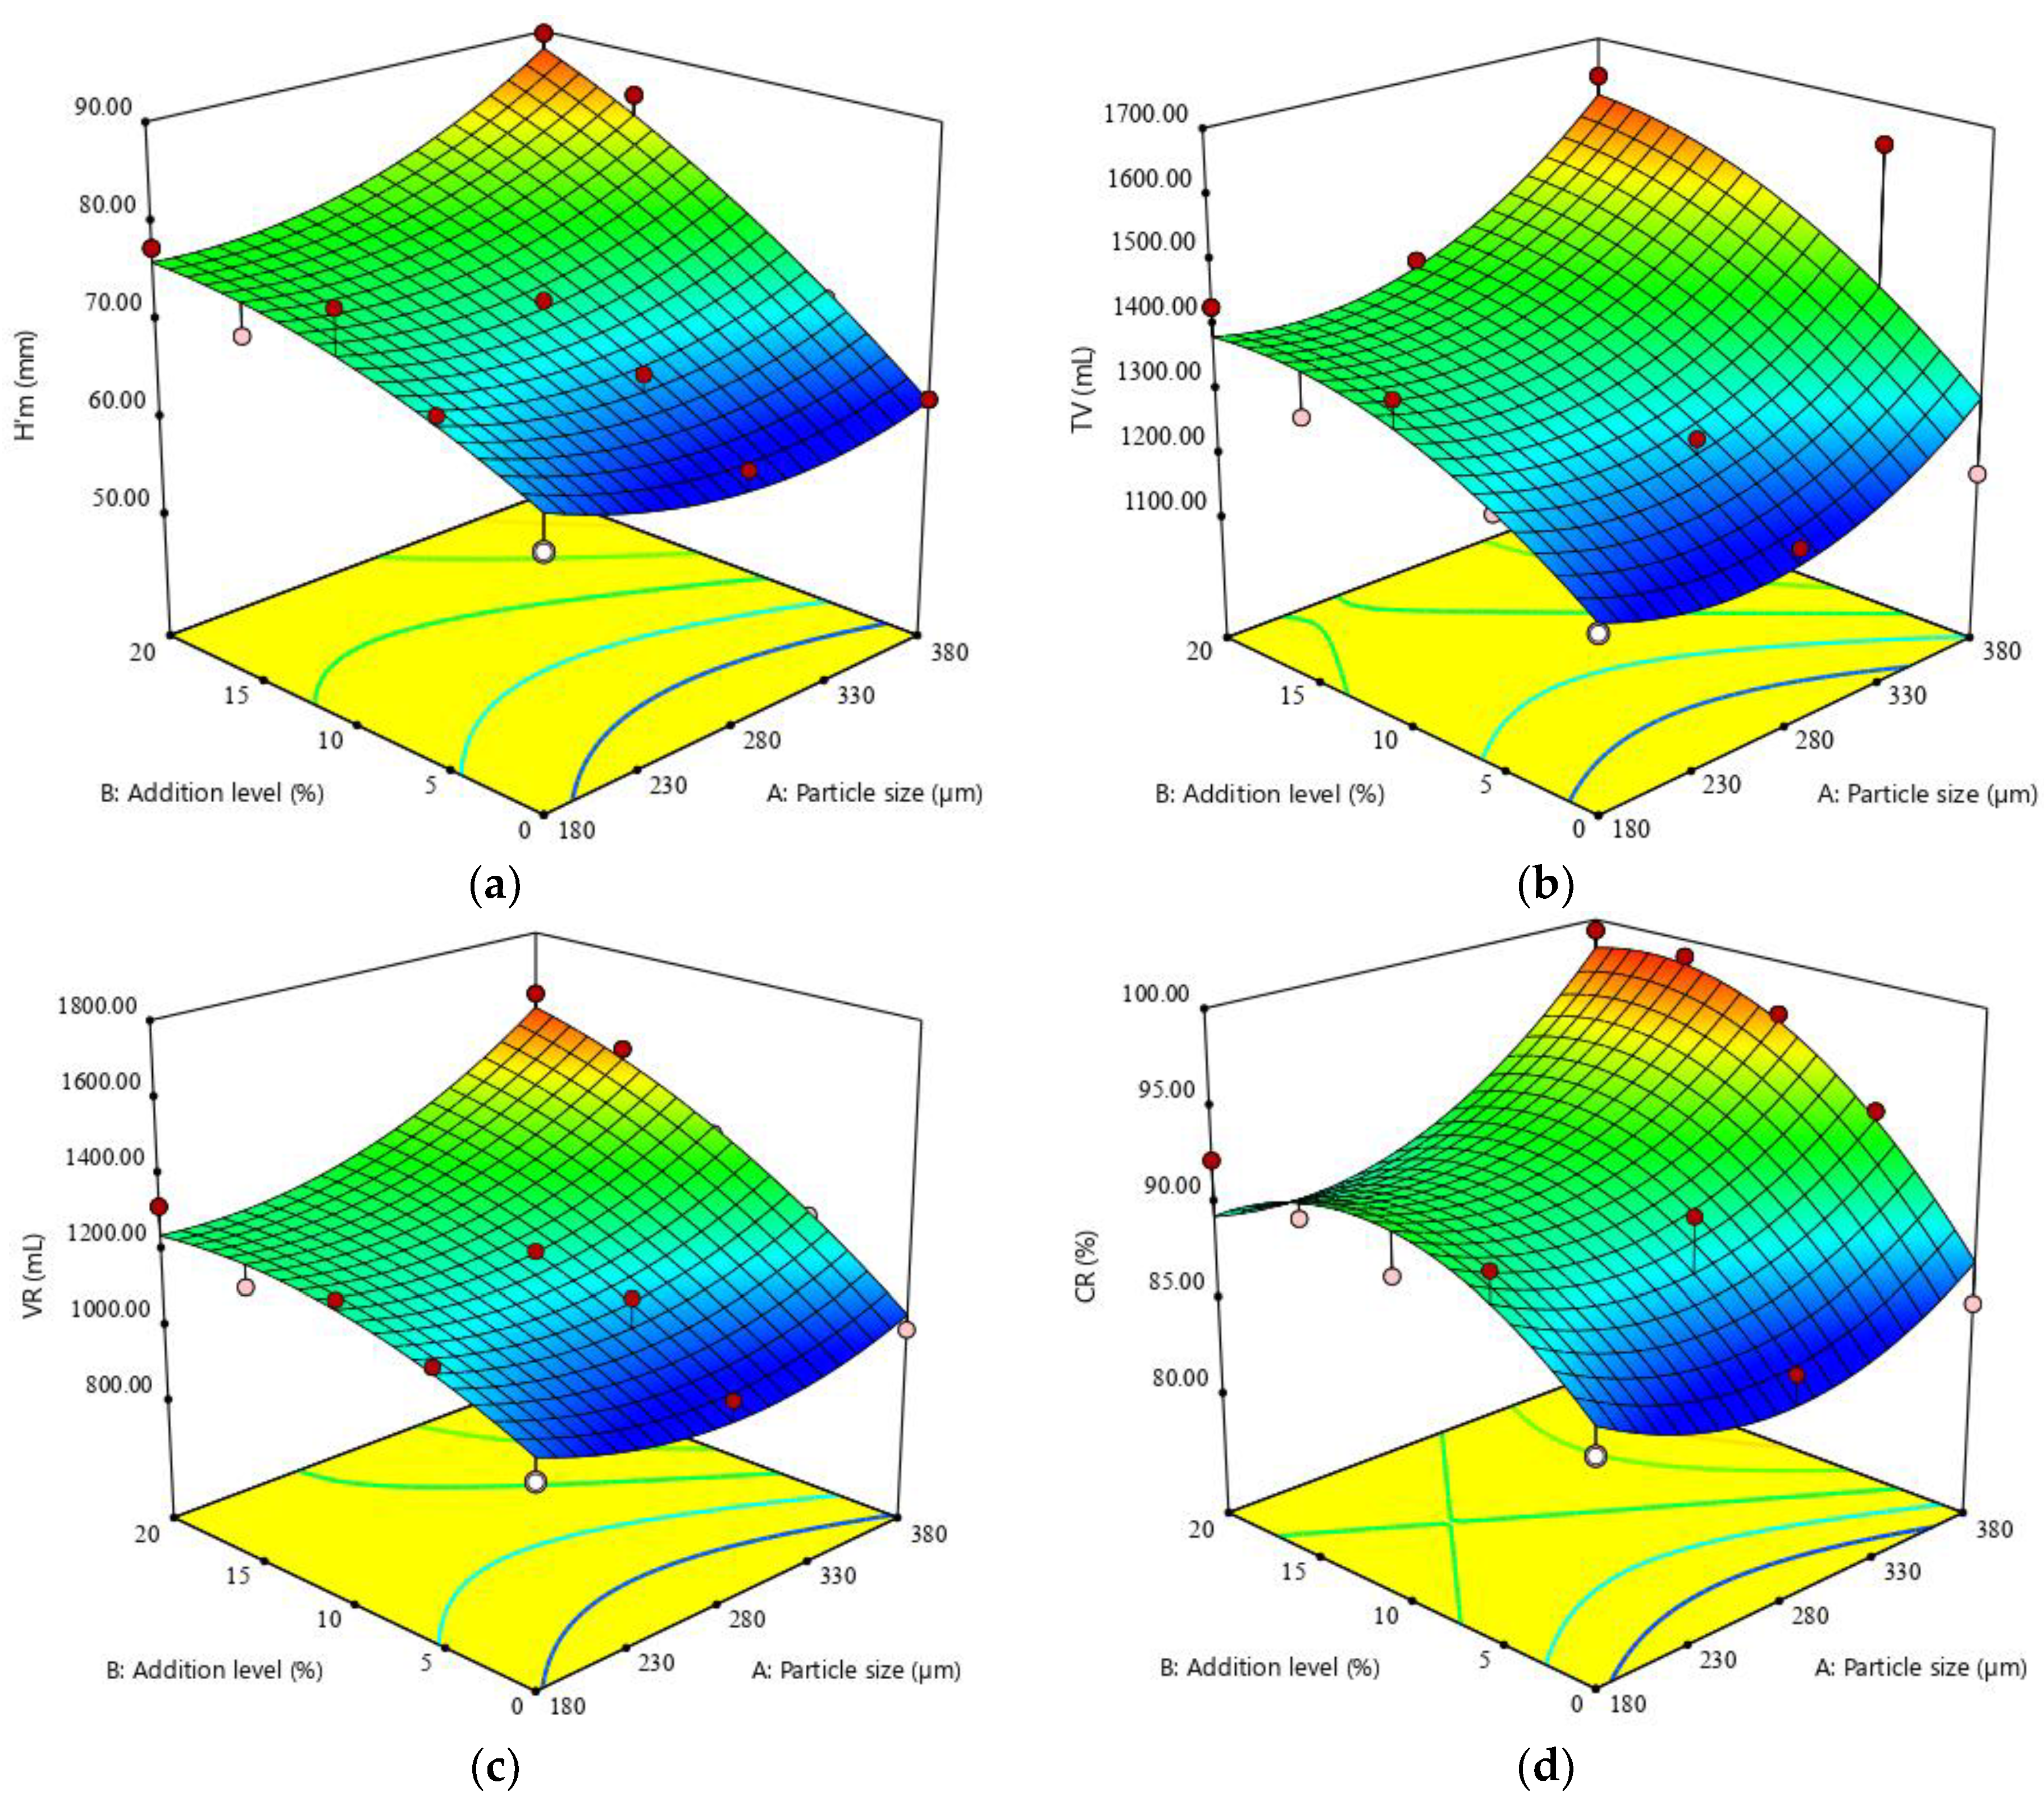
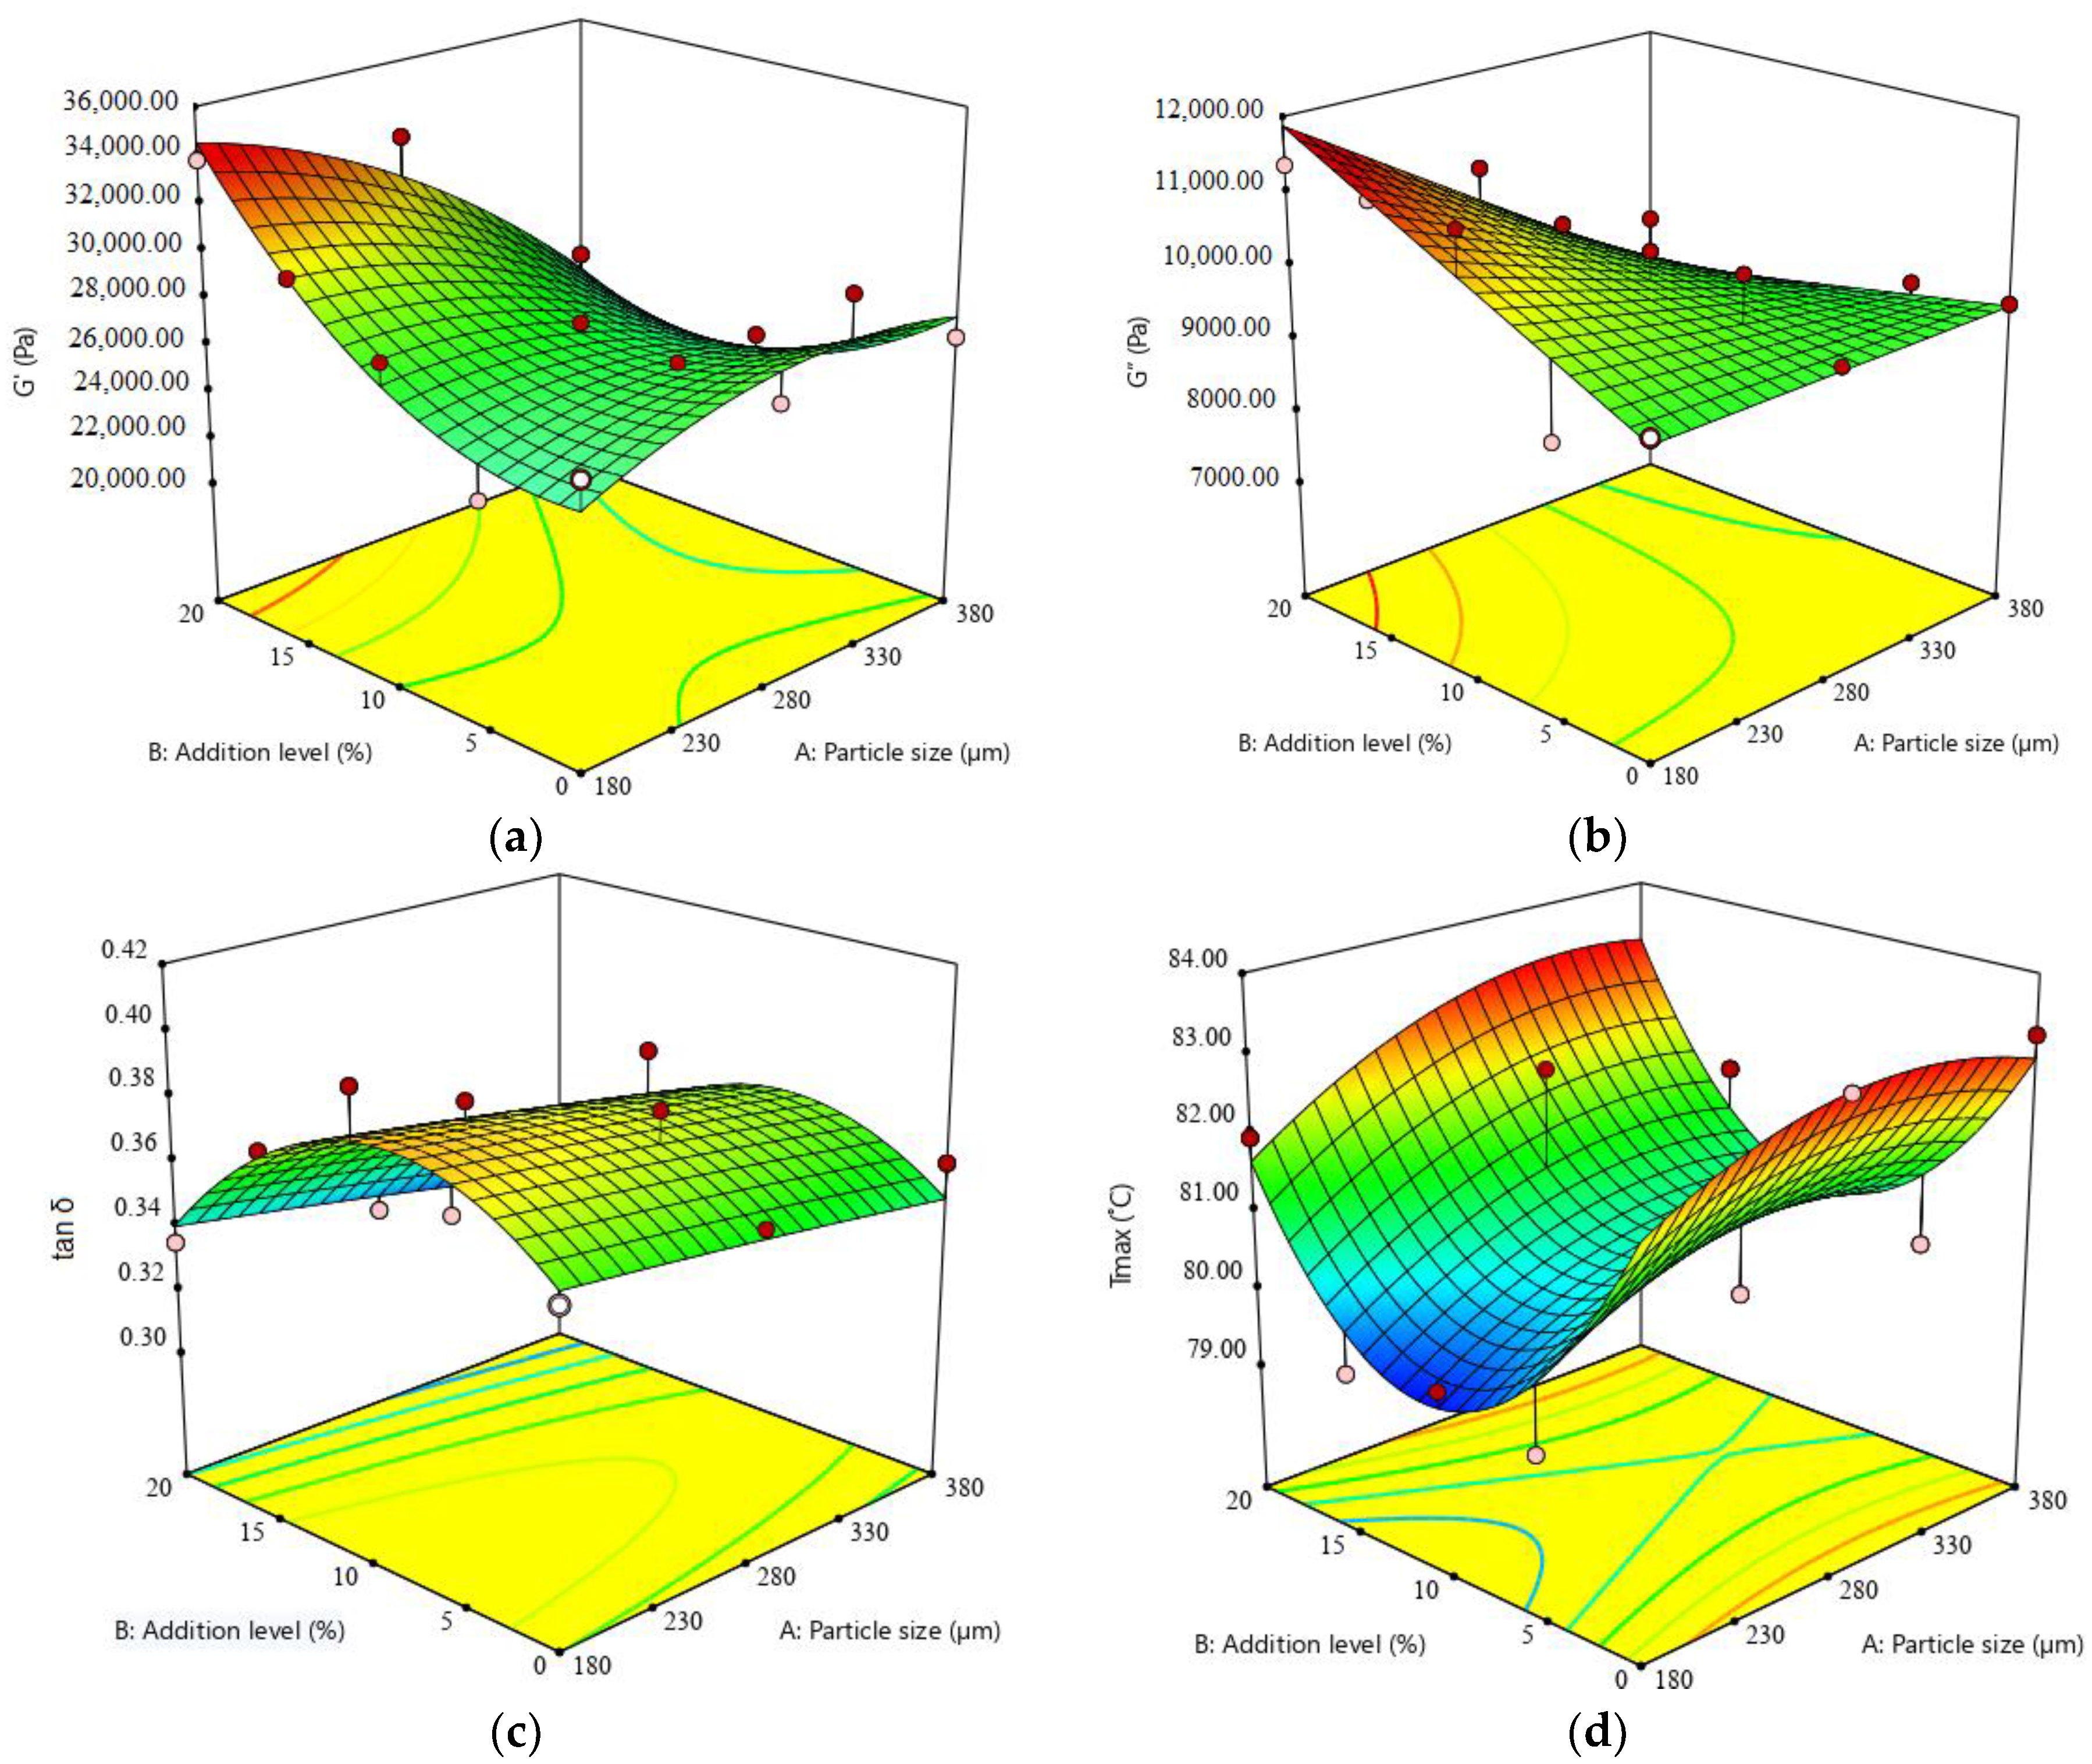
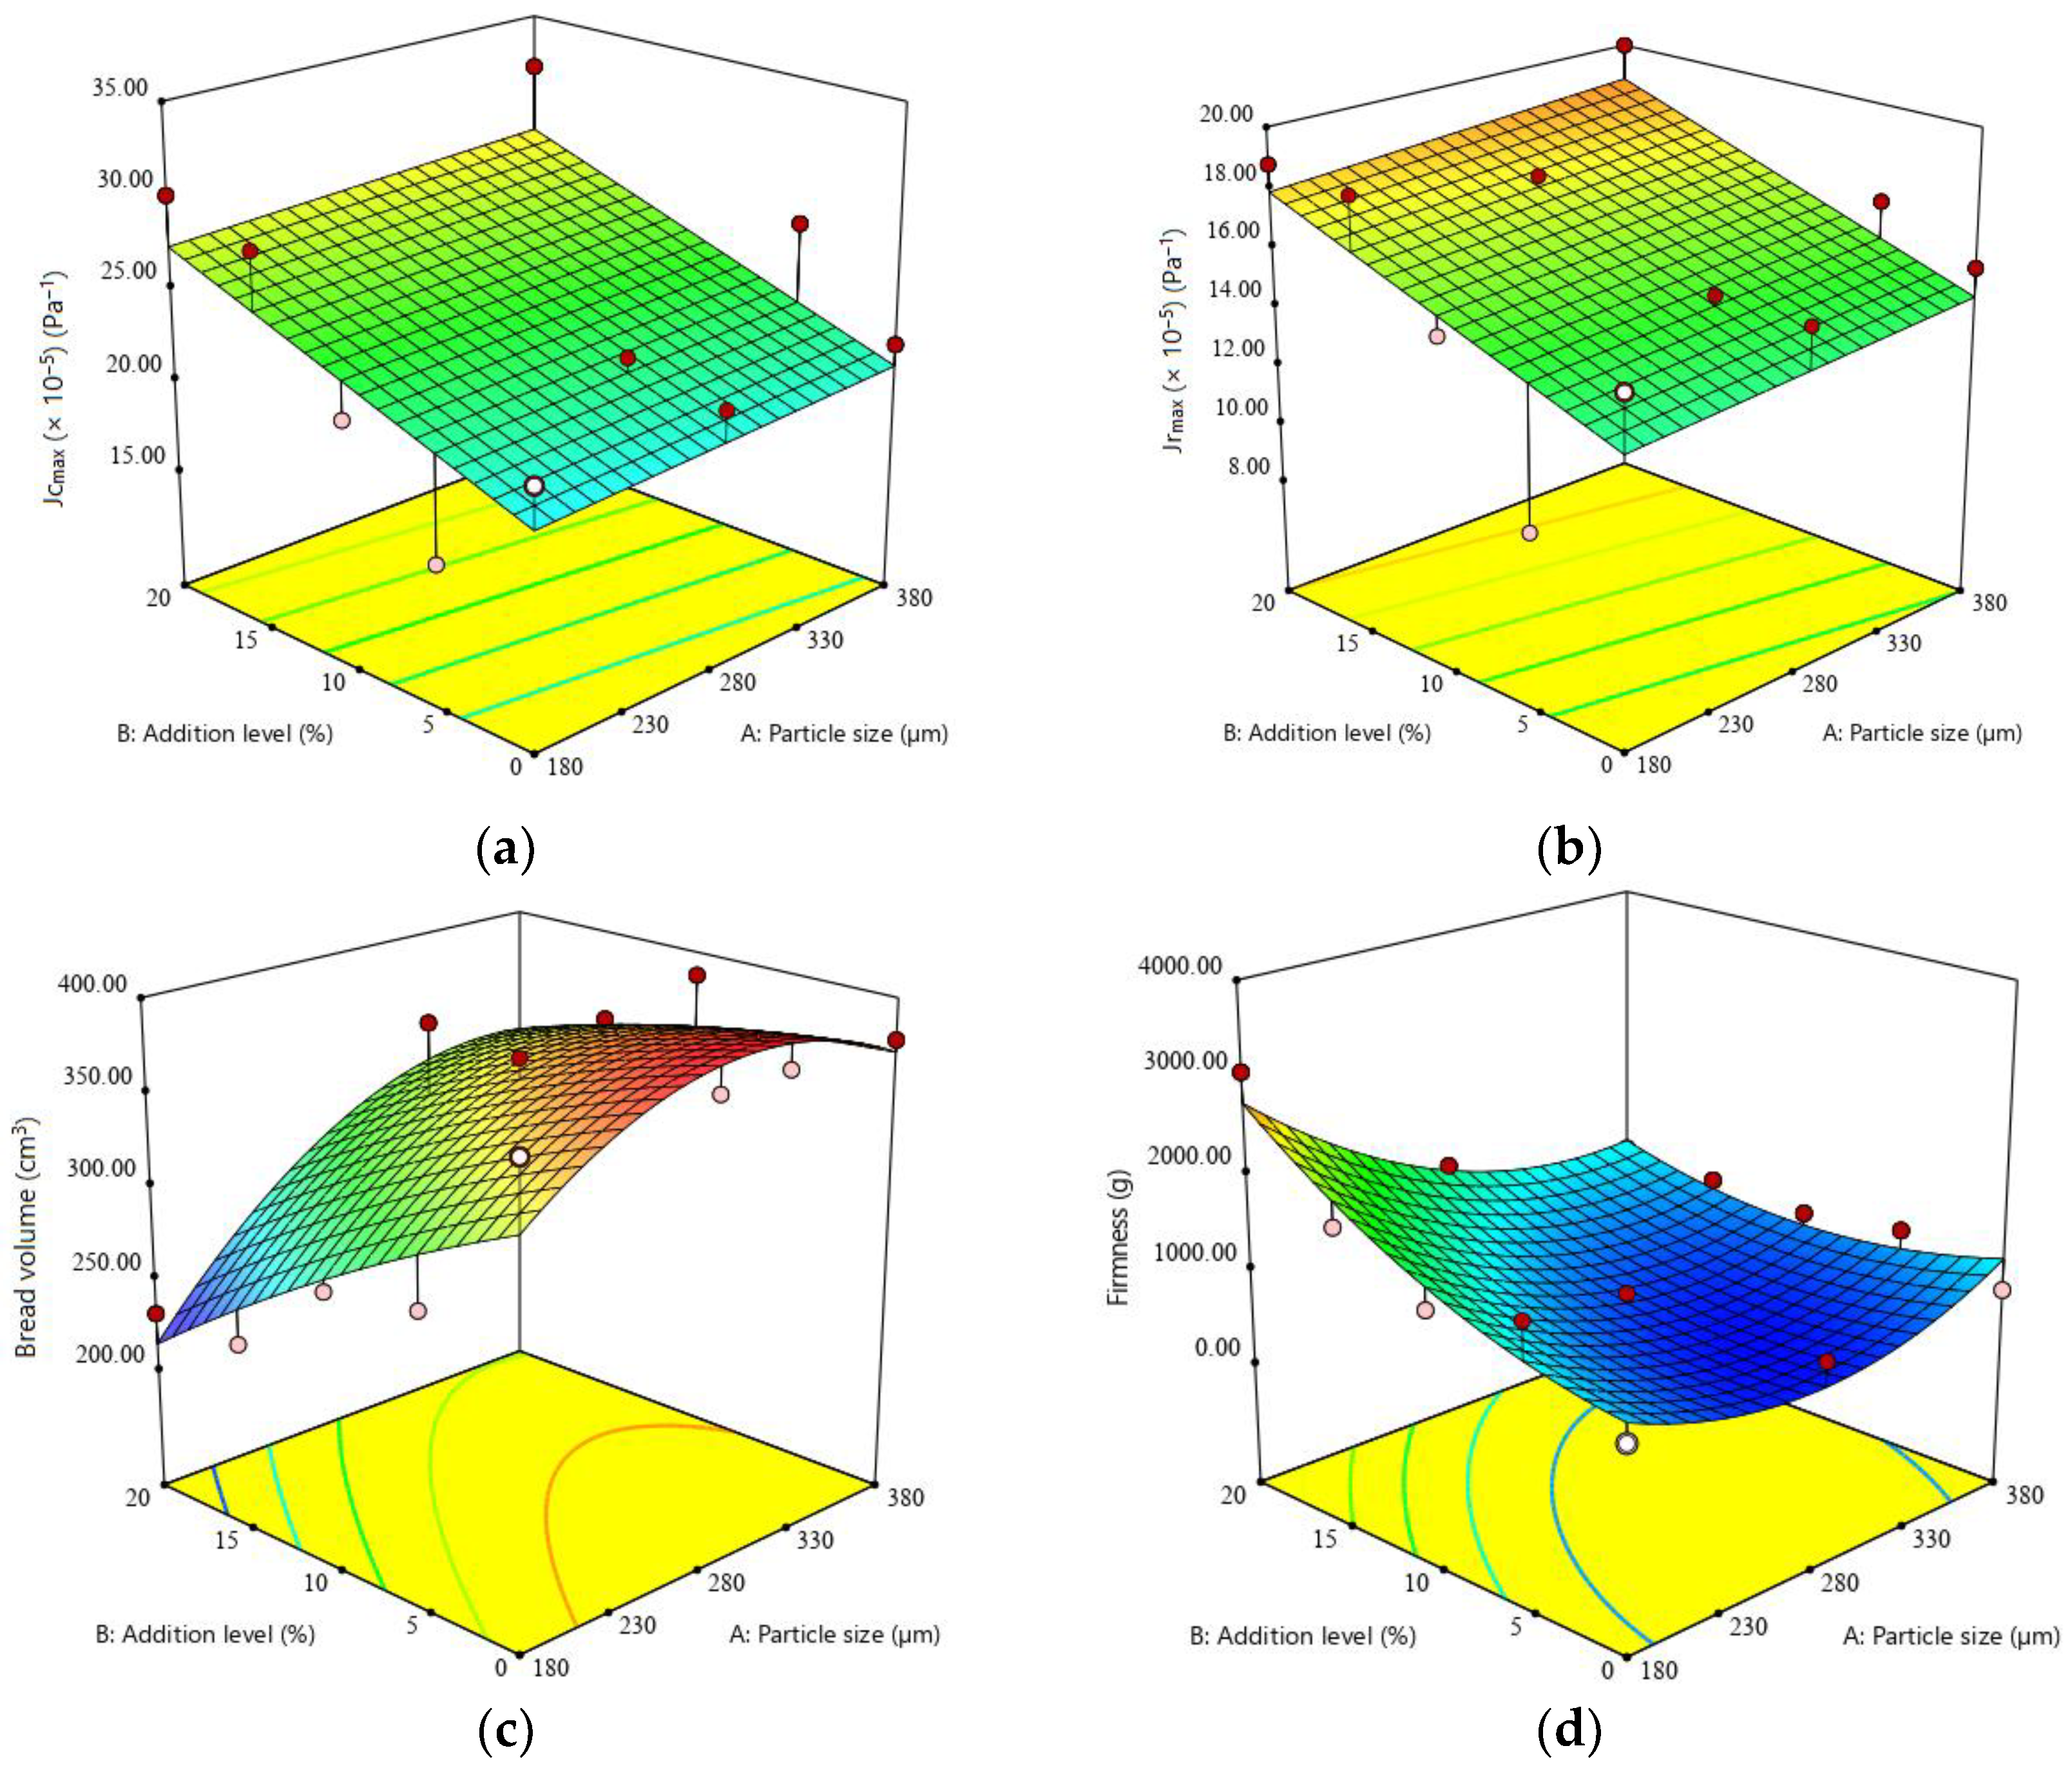
3.2. Effects of Formulated Factors on Dough Reofermentation, Dynamic Rheology and Bread Characteristics

The maximum height of the gas release curve (H’m), the total volume of gas produced (TV), the volume of gas retained in the dough (VR), the retention coefficient (CR), storage modulus (G′), loss tangent (tan δ), maximum gelatinization temperature (Tmax), bread volume (BV), and the bread hardness (BH) were successfully fitted to the quadratic model, explaining 72 to 92% of the data variation (Table 3). Of the data variation in loss modulus (G″) 69% was explained by the 2FI model, while for maximum creep compliance (Jcmax) and maximum recovery compliance (Jrmax), only 42–43% of the data variation was explained by the linear model (Table 3).
The maximum height of the gas release curve (H’m) showed a significant increase with increasing BF addition level and interaction between factors, while PS had no significant effects. The total volume of gas produced (TV) was considerably influenced by PS and addition levels (Table 3). Similarly, the volume of gas retained in the dough (VR) and the retention coefficient (CR) were substantial impacted by the PS and addition level factors. Figure 4 shows the positive influence of both of the studied factors on all rheofermentografic parameters, showing an increasing trend with increasing BF addition level and PS.
The dynamic rheological properties, in terms of storage modulus, loss modulus, loss tangent, and maximum gelatinization temperature, were influenced by PS and BF addition level, but with different trends. G′ decreased significantly with increasing PS and interactions between PS and BF addition level (Figure 5a), while BF addition level exerted a significant positive effect on G′ (Table 3). Loss modulus (G″) was considerably affected only by PS and by the interaction between PS and addition level. An increasing trend for G″ was noted with increasing PS (Figure 5). The quadratic model obtained for loss tangent adequately represented the experimental data. Loss tangent was significantly affected by the linear and quadratic terms of BF addition levels in a negative mode (Table 3). The maximum gelatinization temperature (Tmax) was significantly affected by the quadratic term of BF addition level, while PS had a non-significant effect (Table 3).
The amount of buckwheat flour added had a significant influence on maximum creep compliance, while PS did not exert a significant influence (Table 3). An increase in the maximum creep compliance was observed with increasing BF addition level (Figure 6). The maximum recovery compliance was influenced by the amount of BF, while the PS had a non-significant effect. The amount of BF had a considerable positive influence on Jrmax, presenting an increase in Jrmax with increasing BF addition level (Figure 6).
Bread volume (BV) was significantly affected by the PS and the amount added to the wheat flour, as shown by the ANOVA test (Table 3). It can be seen that the BF addition level had a negative influence on the BV, and it can be observed in Figure 6 that this bread technical parameter decreased with increasing BF addition level. Rather, the particle size significantly affected the bread volume in a positive way, with an increase in BV being apparent with increasing PS (Figure 6). The bread hardness (BH) was significantly influenced by the PS, the BF addition level, and the interactions between factors, with an increase being observed with decreasing PS (Figure 6).

3.3. Optimal Amount of Buckwheat Flour Fraction

The parameters of the samples with the optimal addition levels of buckwheat flour for each PS compared to the control are presented in Table 4. The optimum values of the variables with the highest desirability, obtained through the numerical optimization analysis, were selected.

4. Discussion

This research presents for the first time a complex investigation into the influence on the empirical-dynamic rheological properties of dough and bread characteristics of buckwheat flour PS and addition level when incorporated into wheat flour.
Wheat–buckwheat composite flour presented a higher α-amylase activity, since this is inversely correlated with FN, which exhibited a decreasing value with increasing PS. This effect could be related to the intake of calcium, which stabilizes α-amylase, producing a favorable effect on bread quality [29]. BF with small particle sizes possesses a higher quantity of phenolic compounds [38], which form bonds with α-amylase, leading to a decrease in α-amylase in composite flours containing small PS.
Water absorption increased with decreasing PS and BF addition level, which means that composite flours require a higher quantity of water to swell the starch and to achieve the optimum consistency. This trend could be due to the damaged granules of starch that result during the milling process, which affect the behavior of starch-containing systems, facilitating the penetration of water for hydration [39]. A similar effect of small PS on WA was also observed by other authors [40,41]. The phenolic compounds (tyrosol, lkylphenol, and phenolic acids) in buckwheat flour tend to absorb water, and can form non-covalent bonds with starch, decreasing the pH of the dough, and modifying the water absorption of starch granules, starch gelatinization, pasting properties, and starch retrogradation [42]. The increase of PS and BF addition levels led to an increase in DT that can be attributed the content of dietary crude fibers (pentosane), which require a longer period to absorb water, including a longer mixing time [43]. Other authors who have studied the incorporation of buckwheat flour into wheat flour have observed the same decreasing trend in dough development time [43,44,45,46,47]. Dough stability, which provides information on dough strength, decreases with increasing BF addition level, a phonemonen that can be attributed to BF proteins, which mainly consist of albumin and globulin [47], and the lack of structure-forming capacity of the non-gluten proteins in buckwheat. Dough stability is influenced by diluted gluten content and gluten quality. With the addition of buckwheat flour, which contains non-gluten proteins, a weaker structure-forming ability and viscoelastic behavior were reported [48]. The protein from buckwheat flour contributes to the replacement of gluten, which also influences the dough’s rheological behavior, similarly to protein from amaranth [49]. The interactions between the different types of starch and protein impact the rheological characteristics of the dough, also affecting the pasting properties of the starch [50]. The protein weakening due to heat (C1-2) increased with BF addition. This effect can presumably be attributed to the gluten dilution effect, with the protein network becoming less compact during heating, a fact that favors enzymatic attacking points. Similar findings with respect to the effect of different PS on protein weakening in wheat flour dough were observed by Torbica et al. (2010) [45]. The starch gelatinization (C3-2) of composite flour, describing the transition of semicrystalline starch granules into an amorphous structure, presented a decreasing trend when both factors, PS and BF addition level, increased, probably due to the formation of buckwheat amylose with complex lipid compounds [51]. The lower degree of swelling and gelatinization of the starch granules can probably be attributed to the presence of phenolic components from BF, such as rutin, which acts as a rigid filler in the starch matrix [52,53]. Our results are in accordance with the findings reported by Filipèev et al. (2015) and Sciarini et al. (2019) [54,55]. Decreasing gel stability (C3-4) with increasing BF addition level in composite flour can be associated with the fraction components, most probably with the soluble fiber and phenolic compounds, which bind water through hydrogen bonds, limiting the availability of water for the starch [48]. Similar results were obtained by Filipèev et al. (2015) [54]. Starch retrogradation (C5-4), which describes the changes in viscosity during starch re-association during the cooling phase, indicates cooking stability, which is correlated with gel firmness. The decrease in starch recrystallization occurring in the composite flour samples with increasing amounts of BF could be due to the effects of the content of leached amylose and long-chain amylopectin [56]. This decrease could be also associated with increased amounts of lipid from BF [12,43], because the amylose chain cannot bind and reassociate in a free manner like in lower lipid systems with low lipid content, which will improve the staling of the formulated bread. These results are in line with those reported by other researchers [43,57].
With respect to dough biaxial extension parameters, it can be stated that dough tenacity increased with increasing PS decreasing BF addition level, most likely because of the fiber content of BF with large PS, which can form strong interactions with wheat flour proteins. Instead, dough extensibility decreased remarkably with the addition of BF. This decrease in dough extensibility may be due to the fact that BF is gluten-free, which is the main cause of modifications in the rheological properties of wheat dough, whose protein components create a three-dimensional sponge-mesh structure in the dough, determining the physical properties of the dough. Dough deformation energy presented significant decreases with increasing BF addition level, revealing a weakening effect of the addition of BF on the formulated dough. This consequence could derive from the BF protein content substituting for gluten proteins, causing a dilution effect. Similar results regarding dough behavior during biaxial extension were found in other studies when different amounts of BF were used, but they did not take into account the PS [58].
The incorporation of buckwheat flour PS at different amounts into wheat flour resulted in an increase in the dough rheofermentation parameters assessed. Buckwheat differs from wheat flour in its starch, monosaccharide, and disaccharide contents, which represent the substrate for the future fermentation process. The fermentation resulted in significant hydrolysis of 13S globulin, the main storage protein in buckwheat [59], with the intensification of enzymatic hydrolysis of the polymers resulting in the release of small polypeptides and an increase in the amount of nutrients for the yeast [60]. Additionally, the proteolytic activities during fermentation release amino acids and peptides, improving this process, and strongly enhancing the taste and the flavor of the bread [61]. Similar results were found by Mariotti et al. (2008) [58] when substituting wheat flour with 20–40% wholemeal buckwheat flour, reporting that replacement of up to 20% did not significantly lower the maximum dough development and but that a higher volume of released gas was obtained during leavening.
The dynamic modulus provides information about the three-dimensional conformation of the gluten matrix. An increase in storage modulus (G′) with the addition of BF and the increase of loss modulus (G″) with increasing PS may be linked with the presence of phenolic compounds and damaged starch from BF and the attractive forces between buckwheat dietary fibers and starch granules, indicating that the WF–BF dough possesses a solid, elastic-like behavior. The increase in both of the dynamic modulus values depending on these factors is presumably due to the interactions between the proteins and starch. Some studies have reported that the damaged starch that results during the milling process affects dough visco-elasticity, resulting in stiffer doughs [62]. The addition buckwheat flour with large PS to the dough resulted in a decrease in storage modulus (G′), suggesting that this fraction decreases the strength and elasticity of the dough. This phenomenon could be due to lipid–starch interactions, suggesting a shift in the relaxation time of the dough cross-links to shorter times, causing decreased rigidity with increasing PS [60]. Similar findings were reported in another study [63]. Loss tangent (tan δ) values decreased with increasing BF addition levels, resulting in an elastic and firm dough. This trend could be due to the damaged starch present in the buckwheat fractions. Partial replacement of wheat flour with buckwheat flour was conducted to increase Jcmax and Jrmax values, leading to higher dough extensibility. Maximum creep compliance data exhibited a similar trend to that of the oscillation data, which also revealed a decrease in dough strength with increasing BF addition level. Data on the elastic properties of the dough with respect to tan δ were also in accordance. These changes in gel strength could potentially be due to modification of the macromolecular organization with respect to the interactions between components of the system [45], because it is well known that protein–polysaccharide interactions modify the visco-elastic profile [64]. Our results are in agreement with previous reports studying gluten-free bread based on buckwheat flour [45,57].
Bread volume increased when the dough contained BF with large particle sizes, but decreased when the amount of BF added increased. These changes could be linked to the decrease in the wheat gluten-forming protein content (prolamin represented by gliadin and glutelin, by glutenin), which lead to the dough having diminished gas-retention capacity. In any case, some authors have demonstrated that gluten dilution has only a secondary physical effect on the decrease in loaf volume, because the interaction between gluten proteins and ferulic acid monomers, glutathione, and phytate present in the fractions with large particle size have an evident positive impact [65]. This fact can be demonstrated by the difference between bread with large particle sizes (which have fibers and other compounds from the outer layers of buckwheat) and that containing the fractions with smaller particle sizes [65]. Our results fall in line with those reported in other studies, revealing that a low volume and high crumb texture occurred in bread with increasing buckwheat flour replacement [45,66]. Furthermore, the bread quality parameters, volume, and hardness can be affected by the phenolic compounds in buckwheat flour that are able to bind the gluten thiol groups from wheat flour doughs, leading to a weak gluten network [67]. The decrease of crumb hardness with increasing particle size may be due to the fiber content of buckwheat endosperm (which is rich in starch). The fibers may retard starch retrogradation during storage, thus having a positive effect on the crumb structure [68].
The optimization of BF addition level in wheat flour for each PS revealed that the best rheological properties were obtained when the BF addition level was 9.13% BF for large PS, 10.57% BF for medium PS, and 10.25% BF for small PS. Compared to the control, the optimized samples were characterized by lower values of dough stability, hot starch stability, starch retrogradation, dough extensibility, deformation energy, storage modulus, maximum gelatinization temperature, and bread volume. Conversely, development time, protein weakening, alveograph ratio, the maximum height of the gas release curve, total volume gas produced, the volume of the gas retained in the dough, retention coefficient, and bread hardness were higher in the optimal samples compared to the control. These differences could be due to the addition of non-gluten proteins, lipids, minerals, and carbohydrates in the BF fractions and their interactions within the dough matrix [29].

5. Conclusions

Buckwheat flour fractions present good potential for achieving nutritious baking products, while minimally diminishing their quality characteristics. An evaluation of the effect of PS and BF addition level, along with their interactions, on composite flour, dough properties, and bread characteristics was performed on the basis of mathematical data modeling. With increasing BF particle size, falling number, water absorption, starch gelatinization, storage modulus, and bread hardness decreased, while dough development time, rheofermentation parameters, loss modulus, and bread volume increased. Increasing BF addition level was correlated with lower values of water absorption, dough stability, starch gelatinization, retrogradation, dough extensibility, deformation energy, loss tangent, and bread volume, while dough development, speed of protein weakening, stability of starch gel, alveograph ratio, rheofermentation parameters, maximum creep and recovery compliance, and bread hardness increased.
The results of the optimization process indicated a decrease in consistency during the starch retrogradation stage, extensibility, deformation energy, maximum gelatinization temperature, and bread volume, and an increase in the maximum height of the gas release curve, total volume of gas produced, volume of the gas retained in the dough at the end of the test, retention coefficient, and loss tangent compared to the control. On the basis of these results, new bread formulations with the desired characteristics of higher volume, porosity, and elasticity, as well as improved nutritional profiles in comparison with wheat bread, can be introduced to the market. Further research regarding the influence of the optimal amount of buckwheat flour corresponding to each fraction substituting wheat flour on the sensory bread characteristics would be needed.

Author Contributions

I.C., C.M. and S.M. contributed equally to the study design, collection of data, development of the sampling, analyses, interpretation of results, and preparation of the paper. All authors have read and agreed to the published version of the manuscript.

Funding

This work was funded by the Ministry of Research, Innovation and Digitalization within Program 1—Development of national research and development system, Subprogram 1.2—Institutional Performance—RDI excellence funding projects, under contract no. 10PFE/2021.

Institutional Review Board Statement

Not applicable.

Informed Consent Statement

Not applicable.

Data Availability Statement

Not applicable.

Conflicts of Interest

The authors declare no conflict of interest.

References

  1. Dewettinck, K.; Van Bockstaele, F.; Kühne, B.; Van de Walle, D.; Courtens, T.M.; Gellynck, X. Nutritional value of bread: Influence of processing, food interaction and consumer perception. J. Cereal Sci. 2008, 48, 243–257. [Google Scholar] [CrossRef]
  2. Dall’ Asta, M.; Dodi, R.; Di Pede, G.; Marchini, M.; Spaggiari, M.; Gallo, A.; Righetti, L.; Brighenti, F.; Galaverna, G.; Dall’Asta, C.; et al. Postprandial blood glucose and insulin responses to breads formulated with different wheat evolutionary populations (Triticum aestivum L.): A randomized controlled trial on healthy subjects. Nutrition 2021, 111533. [Google Scholar] [CrossRef]
  3. Yasui, Y.; Hirakawa, H.; Ueno, M.; Matsui, K.; Katsube-Tanaka, T.; Yang, S.J.; Aii, J.; Sato, S.; Mori, M. Assembly of the draft genome of buckwheat and its applications in identifying agronomically useful genes. DNA Res. 2016, 23, 215–224. [Google Scholar] [CrossRef] [PubMed]
  4. Alonso-Miravalles, L.; O’Mahony, J.A. Composition, protein profile and rheological properties of pseudocereal-based protein-rich ingredients. Foods 2018, 7, 73. [Google Scholar] [CrossRef] [Green Version]
  5. Martínez-Villaluenga, C.; Penas, E.; Hernández-Ledesma, B. Pseudocereal grains: Nutritional value, health benefits and current applications for the development of gluten-free foods. Food Chem. Toxicol. 2020, 111178. [Google Scholar] [CrossRef]
  6. Gimenez-Bastida, J.A.; Zielinski, H. Buckwheat as a functional food and its effects on health. J. Agric. Food Chem. 2015, 63, 7896–7913. [Google Scholar] [CrossRef]
  7. Gao, L.; Xia, M.; Li, Z.; Wang, M.; Wang, P.; Yang, P.; Gao, J. Common buckwheat-resistant starch as a suitable raw material for food production: A structural and physicochemical investigation. Int. J. Biol. Macromol. 2020, 145, 145–153. [Google Scholar] [CrossRef]
  8. Yu, D.; Chen, J.; Ma, J.; Sun, H.; Yuan, Y.; Ju, Q.; Luan, G. Effects of different milling methods on physicochemical properties of common buckwheat flour. LWT 2018, 92, 220–226. [Google Scholar] [CrossRef]
  9. Steadman, K.J.; Burgoon, M.S.; Lewis, B.A.; Edwardson, S.E.; Obendorf, R.L. Buckwheat seed milling fractions: Description, macronutrient composition and dietary fibre. J. Cereal Sci. 2001, 33, 271–278. [Google Scholar] [CrossRef]
  10. Sinkovič, L.; Sinkovič, D.K.; Meglič, V. Milling fractions composition of common (Fagopyrum esculentum Moench) and Tartary (Fagopyrum tataricum (L.) Gaertn.) buckwheat. Food Chem. 2021, 365, 130459. [Google Scholar] [CrossRef]
  11. Horbowicz, M.; Obendorf, R.L. Changes in sterols and fatty acids of buckwheat endosperm and embryo during seed development. J. Agric. Food Chem. 1992, 40, 745–750. [Google Scholar] [CrossRef]
  12. Coțovanu, I.; Mironeasa, S. Impact of different amaranth particle size addition level on wheat flour dough rheology and bread features. Foods 2021, 10, 1539. [Google Scholar] [CrossRef] [PubMed]
  13. Ma, S.; Wang, C.; Li, L.; Wang, X. Effects of particle size on the quality attributes of wheat flour made by the milling process. Cereal Chem. 2020, 97, 172–182. [Google Scholar] [CrossRef]
  14. Coţovanu, I.; Ungureanu-Iuga, M.; Mironeasa, S. Investigation of Quinoa Seeds Fractions and Their Application in Wheat Bread Production. Plants 2021, 10, 2150. [Google Scholar] [CrossRef] [PubMed]
  15. Coţovanu, I.; Mironeasa, S. Influence of Buckwheat Seed Fractions on Dough and Baking Performance of Wheat Bread. Agronomy 2022, 12, 137. [Google Scholar] [CrossRef]
  16. Song, Y.Y.; Wang, Y.H.; Chen, J. Physicochemical properties of wheat flour with different particle size ranges. Mod. Food Sci. 2016, 32, 116–120. [Google Scholar]
  17. Choi, H.; Baik, B. Significance of wheat flour particle size on sponge cake baking quality. Cereal Chem. 2013, 90, 150–156. [Google Scholar] [CrossRef]
  18. Sakhare, S.D.; Inamdar, A.A.; Soumya, C.; Indrani, D.; Rao, G.V. Effect of flour particle size on microstructural, rheological and physico-sensory characteristics of bread and south Indian parotta. J. Food Sci. Technol. 2014, 51, 4108–4113. [Google Scholar] [CrossRef] [Green Version]
  19. Wang, N.; Hou, G.G.; Kweon, M.; Lee, B. Effects of particle size on the properties of whole-grain soft wheat flour and its cracker baking performance. J. Cereal Sci. 2016, 69, 187–193. [Google Scholar] [CrossRef]
  20. Niu, M.; Zhang, B.; Jia, C.; Zhao, S. Multi-scale structures and pasting characteristics of starch in whole-wheat flour treated by superfine grinding. Int. J. Biol. Macromol. 2017, 104, 837–845. [Google Scholar] [CrossRef]
  21. Marchini, M.; Carini, E.; Cataldi, N.; Boukid, F.; Blandino, M.; Ganino, T.; Vittadini, E.; Pellegrini, N. The use of red lentil flour in bakery products: How do particle size and substitution level affect rheological properties of wheat bread dough? LWT 2021, 136, 110299. [Google Scholar] [CrossRef]
  22. Ahmed, J.; Ptaszek, P.; Basu, S. Influence of fibers and particle size distribution on Food Rheology. In Advances in Food Rheology and Its Applications; Woodhead Publishing: Cambridge, UK, 2016. [Google Scholar]
  23. Mironeasa, S.; Iuga, M.; Zaharia, D.; Mironeasa, C. Optimization of grape peels particle size and flour substitution in white wheat flour dough. Sci. Study Res. Chem. Eng. Biotechnol. Food Ind. 2019, 20, 29–42. [Google Scholar]
  24. Mironeasa, S.; Iuga, M.; Zaharia, D.; Mironeasa, C. Optimization of white wheat flour dough rheological properties with different levels of grape peels flour. Bull. UASVM Food Sci. Technol. 2019, 76, 27–39. [Google Scholar] [CrossRef] [Green Version]
  25. Iuga, M.; Mironeasa, C.; Mironeasa, S. Oscillatory rheology and creep-recovery behaviour of grape seed-wheat flour dough: Effect of grape seed particle size, variety and addition level. Bull. UASVM Food Sci. Technol. 2019, 76, 40–51. [Google Scholar] [CrossRef] [Green Version]
  26. Bloksma, A.H. Rheology of the breadmaking process. Cereal Foods World 1990, 35, 228–236. [Google Scholar]
  27. Sroan, B.S.; Bean, S.R.; MacRitchie, F. Mechanism of gas cell stabilization in bread making. I. The primary gluten–starch matrix. J. Cereal Sci. 2009, 49, 32–40. [Google Scholar] [CrossRef]
  28. Veraverbeke, W.S.; Delcour, J.A. Wheat protein composition and properties of wheat glutenin in relation to breadmaking functionality. Crit. Rev. Food Sci. Nutr. 2002, 42, 179–208. [Google Scholar] [CrossRef] [PubMed]
  29. Coțovanu, I.; Mironeasa, S. Buckwheat Seeds: Impact of Milling Fractions and Addition Level on Wheat Bread Dough Rheology. Appl. Sci. 2021, 11, 1731. [Google Scholar] [CrossRef]
  30. Romanian Standard SR 90:2007; Wheat Flour. Analysis Method. Romanian Standards Association: Bucharest, Romania, 2007.
  31. ICC. Standard Methods of the International Association for Cereal Chemistry. Methods 104/1, 110/1, 136, 105/2, 171, 121, 107/1, 173; International Association for Cereal Chemistry: Vienna, Austria, 2010. [Google Scholar]
  32. Mironeasa, S.; Mironeasa, C. Dough bread from refined wheat flour partially replaced by grape peels: Optimizing the rheological properties. J. Food Process Eng. 2019, 42, e13207. [Google Scholar] [CrossRef]
  33. Sanz, T.; Salvador, A.; Hernández, M.J. Creep–recovery and oscillatory rheology of flour-based systems. In Advances in Food Rheology and Its Applications; Woodhead Publishing: Sawston, UK, 2017; pp. 277–295. [Google Scholar] [CrossRef]
  34. Moreira, R.; Chenlo, F.; Torres, M.D.; Rama, B. Fine particle size chestnut flour doughs rheology: Influence of additives. J. Food Eng. 2014, 120, 94–99. [Google Scholar] [CrossRef]
  35. Coţovanu, I.; Mironeasa, S. Features of Bread Made from Different Amaranth Flour Fractions Partially Substituting Wheat Flour. Appl. Sci. 2022, 12, 897. [Google Scholar] [CrossRef]
  36. Wu, C.J.; Hamada, M.S. Experiments: Planning, Analysis, and Optimization; John Wiley & Sons: Hoboken, NJ, USA, 2011; p. 552. [Google Scholar]
  37. Coțovanu, I.; Stoenescu, G.; Mironeasa, S. Amaranth influence on wheat flour dough rheology: Optimal particle size and amount of flour replacement. J. Microbiol. Biotechnol. Food Sci. 2021, 10, 366–373. [Google Scholar] [CrossRef]
  38. Skrabanja, V.; Kreft, I.; Golob, T.; Modic, M.; Ikeda, S.; Ikeda, K.; Kosmelj, K. Nutrient Content in Buckwheat Milling Fractions. Cereal Chem. 2004, 81, 172–176. [Google Scholar] [CrossRef]
  39. Zhu, F. Impact of ultrasound on structure, physicochemical properties, modifications, and applications of starch. Trends Food Sci. Technol. 2015, 43, 1–17. [Google Scholar] [CrossRef]
  40. Sapirstein, H.; Wu, Y.; Koksel, F.; Graf, R.J. A study of factors influencing the water absorption capacity of Canadian hard red winter wheat flour. J. Cereal Sci. 2018, 81, 52–59. [Google Scholar] [CrossRef]
  41. Bressiani, J.; Oro, T.; Da Silva, P.M.L.; Montenegro, F.M.; Bertolin, T.E.; Gutkoski, L.C.; Gularte, M.A. Influence of milling whole wheat grains and particle size on thermo-mechanical properties of flour using Mixolab. Czech J. Food Sci. 2019, 37, 276–284. [Google Scholar] [CrossRef] [Green Version]
  42. Xu, J.; Wang, W.; Li, Y. Dough properties, bread quality, and associated interactions with added phenol compounds: A review. J. Funct. Foods 2019, 52, 629–639. [Google Scholar] [CrossRef]
  43. Sedej, I.; Sakač, M.; Mandić, A.; Mišan, A.; Tumbas, V.; Hadnađev, M. Assessment of antioxidant activity and rheological properties of wheat and buckwheat milling fractions. J. Cereal Sci. 2011, 54, 347–353. [Google Scholar] [CrossRef]
  44. Nikolić, N.; Sakač, M.; Mastilović, J. Effect of buckwheat flour addition to wheat flour on acylglycerols and fatty acids composition and rheology properties. LWT Food Sci. Technol. 2011, 44, 650–655. [Google Scholar] [CrossRef]
  45. Torbica, A.; Hadnađev, M.; Dapčević, T. Rheological, textural and sensory properties of gluten-free bread formulations based on rice and buckwheat flour. Food Hydrocoll. 2010, 24, 626–632. [Google Scholar] [CrossRef]
  46. Yıldız, G.; Bilgiçli, N. Utilisation of buckwheat flour in leavened and unleavened Turkish flat breads. Qual. Assur. Saf. Crop. 2015, 7, 207–215. [Google Scholar] [CrossRef]
  47. Alvarez-Jubete, L.; Wijngaard, H.; Arendt, E.K.; Gallagher, E. Polyphenol composition and in vitro antioxidant activity of amaranth, quinoa buckwheat and wheat as affected by sprouting and baking. Food Chem. 2010, 119, 770–778. [Google Scholar] [CrossRef]
  48. Lazaridou, A.; Duta, D.; Papageorgiou, M.; Belc, N.; Biliaderis, C.G. Effects of hydrocolloids on dough rheology and bread quality parameters in gluten-free formulations. J. Food Eng. 2007, 79, 1033–1047. [Google Scholar] [CrossRef]
  49. Matos, M.E.; Rosell, C.M. Understanding gluten-free dough for reaching breads with physical quality and nutritional balance. J. Sci. Food Agric. 2015, 95, 653–661. [Google Scholar] [CrossRef]
  50. Schirmer, M.; Jekle, M.; Becker, T. Starch gelatinization and its complexity for analysis. Starch-Stärke 2015, 67, 30–41. [Google Scholar] [CrossRef]
  51. Qian, J.; Rayas-Duarte, P.; Grant, L. Partial characterization of buckwheat (Fagopyrum esculentum) starch. Cereal Chem. 1998, 75, 365–373. [Google Scholar] [CrossRef]
  52. Wang, N.; Hou, G.G.; Dubat, A. Effects of flour particle size on the quality attributes of reconstituted whole-wheat flour and Chinese southern-type steamed bread. LWT Food Sci. Technol. 2017, 82, 147–153. [Google Scholar] [CrossRef]
  53. Wu, K.; Gan, R.; Dai, S.; Cai, Y.Z.; Corke, H.; Zhu, F. Buckwheat and millet affect thermal, rheological, and gelling properties of wheat flour. J. Food Sci. 2016, 81, E627–E636. [Google Scholar] [CrossRef]
  54. Filipčev, B.; Šimurina, O.; Bodroža-Solarov, M. Impact of buckwheat flour granulation and supplementation level on the quality of composite wheat/buckwheat ginger-nut-type biscuits. Ital. J. Food Sci. 2015, 27, 495–504. [Google Scholar]
  55. Sciarini, L.S.; Steffolani, M.E.; Fernández, A.; Paesani, C.; Pérez, G.T. Gluten-free breadmaking affected by the particle size and chemical composition of quinoa and buckwheat flour fractions. Food Sci. Technol. Int. 2020, 26, 321–332. [Google Scholar] [CrossRef]
  56. Xu, M.; Saleh, A.S.; Liu, Y.; Jing, L.; Zhao, K.; Wu, H.; Li, W. The changes in structural, physicochemical, and digestive properties of red adzuki bean starch after repeated and continuous annealing treatments. Starch-Stärke 2018, 70, 1700322. [Google Scholar] [CrossRef]
  57. Hadnađev, T.D.; Torbica, A.; Hadnađev, M. Rheological properties of wheat flour substitutes/alternative crops assessed by Mixolab. Procedia Food Sci. 2011, 1, 328–334. [Google Scholar] [CrossRef] [Green Version]
  58. Mariotti, M.; Lucisano, M.; Pagani, M.A.; Iametti, S. Macromolecular interactions and rheological properties of buckwheat-based dough obtained from differently processed grains. J. Agric. Food Chem. 2008, 56, 4258–4267. [Google Scholar] [CrossRef] [PubMed]
  59. Radovic, S.R.; Maksimovic, V.R.; Varkonji-Gasic, E.I. Characterization of buckwheat seed storage proteins. J. Agric. Food Chem. 1996, 44, e972–e974. [Google Scholar] [CrossRef]
  60. Moroni, A.V.; Dal Bello, F.; Zannini, E.; Arendt, E.K. Impact of sourdough on buckwheat flour, batter and bread: Biochemical, rheological and textural insights. J. Cereal Sci. 2011, 54, 195–202. [Google Scholar] [CrossRef]
  61. Gänzle, M.G.; Loponen, J.; Gobbetti, M. Proteolysis in sourdough fermentations: Mechanisms and potential for improved bread quality. Trends Food Sci. Technol. 2008, 19, e513–e521. [Google Scholar] [CrossRef]
  62. Hatcher, D.W.; Anderson, M.J.; Desjardins, R.G.; Edwards, N.M.; Dexter, J.E. Effects of flour particle size and starch damage on processing and quality of white salted noodles. Cereal Chem. 2002, 79, 64–71. [Google Scholar] [CrossRef]
  63. Hadnađev, T.R.D.; Torbica, A.M.; Hadnađev, M.S. Influence of buckwheat flour and carboxymethyl cellulose on rheological behaviour and baking performance of gluten-free cookie dough. Food Bioproc. Tech. 2013, 6, 1770–1781. [Google Scholar] [CrossRef]
  64. Fitzsimons, S.M.; Mulvihill, D.M.; Morris, E.R. Large enhancements in thermogelation of whey protein isolate by incorporation of very low concentrations of guar gum. Food Hydrocoll. 2008, 22, 576–586. [Google Scholar] [CrossRef]
  65. Noort, M.W.J.; van Haaster, D.; Hemery, Y.; Schols, H.A.; Hamer, R.J. The effect of particle size of wheat bran fractions on bread quality—Evidence for fibre–protein interactions. J. Cereal Sci. 2010, 52, 59–64. [Google Scholar] [CrossRef]
  66. Drobot, V.; Semenova, A.; Smirnova, J.; Mykhonik, L. Effect of buckwheat processing products on dough and bread quality made from whole-wheat flour. Int. J. Food Stud. 2014, 3. [Google Scholar] [CrossRef]
  67. Koh, B.-K.; Ng, P.K.W. Effects of Ferulic Acid and Transglutaminase on Hard Wheat Flour Dough and Bread. Cereal Chem. J. 2009, 86, 18–22. [Google Scholar] [CrossRef]
  68. Schmiele, M.; Jaekel, L.Z.; Patricio, S.M.C.; Steel, C.J.; Chang, Y.K. Rheological properties of wheat flour and quality characteristics of pan bread as modified by partial additions of wheat bran or whole grain wheat flour. Int. J. Food Sci. 2012, 47, 2141–2150. [Google Scholar] [CrossRef]
Figure 1. Response surface graphic of (a) falling number (FN), (b) water absorption (WA), (c) development time (DT), and (d) dough stability (ST) as a function of buckwheat flour fraction and addition level.
Applsci 12 02302 g001
Figure 2. Response surface graphic of (a) protein weakening (C1-2), (b) starch gelatinization (C3-2), (c) cooking stability (C3-4), and (d) starch retrogradation (C5-4) as a function of buckwheat flour fraction and addition level.
Applsci 12 02302 g002aApplsci 12 02302 g002b
Figure 3. Response surface graphic of (a) dough tenacity (P), (b) dough extensibility (L), (c) deformation energy (W), and (d) alveograph ratio (P/L) as a function of buckwheat flour fractions and addition level.
Applsci 12 02302 g003
Figure 4. Response surface graphic of (a) maximum height of the gas release curve (H’m), (b) total volume of gas produced (TV), (c) volume of gas retained in the dough (VR), and (d) retention coefficient (CR) as a function of buckwheat flour fractions and addition level.
Applsci 12 02302 g004
Figure 5. Response surface graphic of (a) storage modulus (G′), (b) loss modulus (G″), (c) loss tangent (tan δ), and (d) maximum gelatinization temperature (Tmax) as a function of buckwheat flour fractions and addition level.
Applsci 12 02302 g005
Figure 6. Response surface graphic of (a) maximum creep compliance (Jcmax), (b) maximum recovery compliance (Jrmax), (c) bread volume (BV), and (d) bread hardness (BH) as a function of buckwheat flour fractions and addition level.
Applsci 12 02302 g006
Table 1. Effects of PS and BF addition level on: (a) falling number and dough Mixolab parameters, (b) alveograph and rheofermentometer parameters, (c) dynamic rheology and bread characteristics.
(a)
RunFalling NumberMixolab
FN
(s)
WA
(%)
DT
(min)
ST
(min)
C1-2
(N⋅m)
C3-2
(N⋅m)
C3-4
(N⋅m)
C5-4
(N⋅m)
1307.00 ± 9.2157.70 ± 1.043.68 ± 0.069.07 ± 0.160.66 ± 0.031.30 ± 0.050.14 ± 0.010.71 ± 0.03
2358.50 ± 15.7757.90 ± 0.751.12 ± 0.048.58 ± 0.090.65 ± 0.031.43 ± 0.030.06 ± 0.000.82 ± 0.02
3299.00 ± 7.7757.60 ± 0.813.80 ± 0.068.15 ± 0.100.73 ± 0.031.22 ± 0.050.30 ± 0.010.78 ± 0.03
4345.50 ± 11.0658.30 ± 1.811.33 ± 0.018.55 ± 0.120.65 ± 0.021.45 ± 0.030.09 ± 0.000.98 ± 0.02
5312.00 ± 12.4858.50 ± 1.111.69 ± 0.079.96 ± 0.390.61 ± 0.011.41 ± 0.020.05 ± 0.001.15 ± 0.04
6303.00 ± 9.3957.80 ± 0.924.65 ± 0.209.92 ± 0.220.64 ± 0.021.33 ± 0.020.09 ± 0.000.87 ± 0.02
7317.00 ± 12.0558.40 ± 0.821.62 ± 0.069.23 ± 0.270.68 ± 0.021.39 ± 0.020.07 ± 0.000.75 ± 0.01
8312.00 ± 14.0458.50 ± 1.171.69 ± 0.079.96 ± 0.400.61 ± 0.011.41 ± 0.020.05 ± 0.001.15 ± 0.02
9349.00 ± 13.6158.70 ± 1.471.38 ± 0.058.98 ± 0.170.65 ± 0.021.39 ± 0.020.07 ± 0.001.06 ± 0.02
10369.50 ± 11.8257.50 ± 0.920.90 ± 0.029.15 ± 0.160.70 ± 0.031.44 ± 0.060.13 ± 0.010.84 ± 0.03
11314.00 ± 6.2858.20 ± 1.163.40 ± 0.077.05 ± 0.150.73 ± 0.011.23 ± 0.020.20 ± 0.000.67 ± 0.01
12321.00 ± 11.8858.00 ± 1.281.48 ± 0.0310.17 ± 0.320.58 ± 0.011.41 ± 0.020.04 ± 0.001.05 ± 0.01
13299.50 ± 8.3957.80 ± 1.104.35 ± 0.068.75 ± 0.120.66 ± 0.031.24 ± 0.050.21 ± 0.010.75 ± 0.03
14326.00 ± 9.1358.30 ± 1.573.55 ± 0.149.03 ± 0.150.65 ± 0.021.28 ± 0.010.17 ± 0.010.68 ± 0.01
15312.00 ± 12.4858.50 ± 1.051.69 ± 0.069.96 ± 0.380.61 ± 0.011.41 ± 0.030.05 ± 0.001.15 ± 0.04
(b)
RunAlveographRheofermentometer
P
(mm H20)
L
(mm)
W (×10−4)
(J)
P/L
(adim.)
H’m
(mm)
TV
(mL)
VR
(mL)
CR
(%)
193 ± 1.4931 ± 0.56115 ± 1.963.06 ± 0.0585.40 ± 2.221547 ± 43.321533 ± 39.8699.10 ± 2.68
284 ± 1.7642 ± 0.76131 ± 2.622.03 ± 0.0471.80 ± 2.801311 ± 18.351192 ± 13.1190.90 ± 1.18
389 ± 1.6926 ± 0.5595 ± 1.903.40 ± 0.0389.80 ± 3.501638 ± 36.041628 ± 37.4499.40 ± 2.19
483 ± 1.4949 ± 0.74146 ± 5.691.70 ± 0.0377.70 ± 3.031390 ± 16.681247 ± 18.7189.70 ± 1.26
587 ± 2.6694 ± 3.67253 ± 9.870.93 ± 0.0362.00 ± 1.181168 ± 18.69991 ± 15.8684.80 ± 1.36
684 ± 1.8542 ± 0.80132 ± 5.152.01 ± 0.0474.00 ± 2.891405 ± 15.461336 ± 17.7697.20 ± 1.17
778 ± 1.4050 ± 0.80139 ± 5.421.56 ± 0.0368.00 ± 2.651278 ± 17.891163 ± 18.6191.00 ± 1.37
887 ± 2.4494 ± 2.82253 ± 0.120.93 ± 0.0362.00 ± 1.121168 ± 23.36991 ± 19.8284.80 ± 1.70
988 ± 2.1152 ± 1.09169 ± 6.591.69 ± 0.0470.90 ± 1.281278 ± 20.451172 ± 18.7591.70 ± 1.47
1083 ± 1.1634 ± 0.27112 ± 1.342.50 ± 0.0377.50 ± 1.711430 ± 28.601320 ± 39.6092.30 ± 2.31
1169 ± 1.3866 ± 1.32130 ± 2.601.04 ± 0.0271.70 ± 1.431329 ± 26.581204 ± 24.0890.60 ± 1.81
1286 ± 2.0648 ± 1.06156 ± 6.081.79 ± 0.0469.30 ± 2.701638 ± 29.481217 ± 23.1293.40 ± 1.68
1372 ± 0.6553 ± 0.48107 ± 0.961.34 ± 0.0177.30 ± 1.241413 ± 26.851241 ± 26.0687.80 ± 1.76
1481 ± 1.3040 ± 0.40121 ± 4.722.02 ± 0.0372.20 ± 2.821330 ± 11.971201 ± 9.6190.30 ± 0.81
1587 ± 2.6194 ± 3.57253 ± 9.610.93 ± 0.0362.00 ± 1.151168 ± 21.02991 ± 15.8684.80 ± 1.70
(c)
RunRheometerBread Characteristics
G′
(Pa)
G″
(Pa)
tan δ (adim.)Tmax
(°C)
Jcmax (×10−5) (Pa−1)Jrmax (×10−5)
(Pa−1)
BV
(cm3)
BH
(g)
120,080 ± 5427413 ± 2000.3690 ± 0.0181.76 ± 1.5524.47 ± 0.4417.18 ± 0.31350.58 ± 7.71988.50 ± 9.89
230,130 ± 42211,242 ±1800.3730 ± 0.0179.36 ± 1.2728.63 ± 0.3418.59 ± 0.24232.54 ± 4.881793.00 ± 10.76
325,050 ± 9769211 ± 3590.3150 ± 0.0182.36 ± 3.2132.07 ± 0.5820.00 ± 0.32312.70 ± 5.631048.00 ± 12.58
428,030 ± 22411,240 ±1010.4010 ± 0.0079.63 ± 1.4321.49 ± 0.2615.01 ± 0.24278.93 ± 6.691308.00 ± 17.00
526,370 ± 2379488 ± 850.3598 ± 0.0083.24 ± 2.1622.01 ± 0.4215.34 ± 0.37378.20 ± 14.75786.00 ± 7.07
623,820 ± 1438548 ± 770.3580 ± 0.0081.48 ± 2.3617.69 ± 0.1412.80 ± 0.12387.50 ± 6.20938.00 ± 4.69
726,650 ± 31910,285 ± 1020.3850 ± 0.0080.38 ± 1.6123.00 ± 0.2515.36 ± 0.18355.03 ± 6.39464.50 ± 4.18
826,370 ± 3169488 ± 1040.3598 ± 0.0083.24 ± 2.0022.01 ± 0.4415.34 ± 0.40378.20 ± 14.37786.00 ± 6.29
923,960 ± 1918962 ± 800.3740 ± 0.0079.36 ± 1.5115.94 ± 0.139.81 ± 0.09287.54 ± 10.351576.00 ± 12.61
1033,810 ± 71011,360 ± 2270.3400 ± 0.0181.95 ± 1.3130.07 ± 0.6318.78 ± 0.41230.90 ± 4.163070.00 ± 30.71
1127,030 ± 54110,210 ± 2040.3700 ± 0.0182.46 ± 1.6525.02 ± 0.5017.60 ± 0.35374.14 ± 7.48578.00 ± 4.62
1226,980 ± 2979394 ± 750.3480 ± 0.0080.15 ± 1.7627.10 ± 0.3816.73 ± 0.20348.92 ± 6.281083.00 ± 11.91
1332,700 ± 62110,650 ± 2240.3250 ± 0.0182.79 ± 1.4926.09 ± 0.5218.05 ± 0.36293.60 ± 4.701471.50 ± 13.24
1426,990 ± 29710,210 ± 1330.3600 ± 0.0080.48 ± 1.4523.61 ± 0.3815.85 ± 0.22368.78 ± 5.16748.00 ± 5.24
1526,370 ± 3169488 ± 1040.3598 ± 0.0083.24 ± 2.3322.01 ± 0.4815.34 ± 0.46378.20 ± 14.37786.00 ± 6.29
(a) FN: falling number index; WA: water absorption; DT: development time; ST: stability; C1-2: speed of protein weakening stage; C3-2: starch gelatinization; C3-4: cooking stability; C5-4: starch retrogradation. (b) P, dough elasticity; L, dough extensibility; W, deformation energy; P/L, alveograph ratio; H’m: maximum height of the gas release curve; TV: total volume of gas produced; VR: volume of the gas retained in the dough; CR: retention coefficient. (c) G′, G″: storage and viscous modulus; tan δ: loss tangent; Tmax: maximum gelatinization temperature; Jcmax, Jrmax: maximum creep-recovery compliance; BV: bread volume, BF: bread hardness.
Table 2. ANOVA results of the models fitted for falling number and dough rheological properties determined using Mixolab and alveograph.
FactorsParameters
Falling NumberMixolabAlveograph
FN
(s)
WA
(%)
DT
(min)
ST
(min)
C1-2
(N⋅m)
C3-2
(N⋅m)
C3-4
(N⋅m)
C5-4
(N⋅m)
P
(mm H2O)
L
(mm)
W (×10−4)
(J)
P/L
Constant318.8258.283.099.100.661.310.1220.7376.6449.22125.811.50
A−19.25 ***−0.13 *0.89 **0.20−0.00−0.04 **0.02−0.021.40−3.00−6.000.23
B3.77−0.43 ***0.78 *−0.75 **0.04 **−0.05 **0.07 **−0.18 ***−2.67−23.27 **−65.20 ***0.66 **
A × B−16.45 **0.070.83 *−0.270.01.−0.05 **0.04 *−0.022.30−2.30−3.700.27
A213.95 *−0.19−0.75-−0.010.07 **−0.030.14 **9.00 **−9.406.200.62 *
B2−10.24−0.09−0.33-0.00−0.000.030.14 *1.5222.76 *48.38 **−0.24
Model Assession
R20.880.860.760.510.660.870.860.880.660.810.930.86
Adj.-R20.820.790.620.380.470.790.790.820.480.700.890.79
p-value0.00050.00110.01300.0411˂0.00010.00100.00110.00060.04610.0048˂0.00010.0225
FN: falling number index; WA: water absorption; DT: development time; ST: stability; C1-2: speed of protein weakening stage; C3-2: starch gelatinization; C3-4: cooking stability; C5-4: starch retrogradation; P: dough tenacity; L: dough extensibility; W: deformation energy; P/L: alveograph ratio; A: particle size (µm); B: buckwheat flour addition level (%); R2, Adj.-R2: measures of model fit. ***, **, * indicated significance at p ˂ 0.0001, p ˂ 0.001, and p ˂ 0.05, respectively.
Table 3. ANOVA results of the models fitted for dough rheofermentation, and dynamic rheological and bread characteristics.
FactorsParameters
RheofermentometerRheometerBread Parameters
H’m
(mm)
TV
(mL)
VR
(mL)
CR
(%)
G′
(Pa)
G″
(Pa)
tan δ
(adim.)
Tmax
(°C)
Jcmax (×10−5)
(Pa−1)
Jrmax (×10−5)
(Pa−1)
BV
(cm3)
BH
(g)
Constant71.371335.081197.3890.9626,575.149812.600.376080.5824.0816.12357.55646.50
A2.0681.90 *81.30 **2.45 **−2000.00 **823.80 **−0.00930.540.520.4536.98 **−369.00 **
B9.19 ***129.80 **187.30 ***3.65 **1636.67 *382.53−0.0130 *−0.103.77 *2.21 *−41.94 **446.67 **
A × B3.98 *29.2091.20 *2.07−3059.00 **−855.90 *−0.00010.24--22.03−435.65 *
A23.8093.70105.70 *3.43 *1488.00-−0.0007−0.61--−0.35 *528.10 *
B2−2.26−62.95−74.76−4.12 *2745.71 *-−0.0330 **2.57 **--−0.72326.19
Model Assession
R20.900.720.920.860.830.690.750.750.420.430.830.86
Adj.-R20.850.570870.770.730.600.610.610.320.330.740.78
p-value0.00030.02160.00010.00140.00310.00360.01430.01530.040.0350.00290.0014
H’m: maximum height of the gas release curve; TV: total volume of gas produced; VR: volume of the gas retained in the dough; CR: retention coefficient; G′: storage modulus; G″: loss modulus; tan δ: loss tangent; Tmax: maximum gelatinization temperature; Jcmax, Jrmax: maximum creep-recovery compliance; BV: bread volume, BF: bread hardness. A: Particle size (µm); B: Buckwheat flour addition level (%); R2, Adj.-R2: measures of model fit. ***, **, * indicate significance at p ˂ 0.0001, p ˂ 0.001, and p ˂ 0.05, respectively.
Table 4. Wheat flour dough and optimized composite flour for each buckwheat flour particle size.
VariableControlO_BLO_BMO_BS
Adition Level100% WF9.13%10.57%10.25%
FN (s)312.00314.54319.00352.51
WA (%)58.5057.9958.2558.21
DT (min)1.693.083.131.44
ST (min)9.969.399.058.88
C1-2 (N∙m)0.610.630.660.65
C3-2 (N∙m)1.411.341.301.42
C3-4 (N∙m)0.050.090.120.06
C5-4 (N∙m)1.150.850.710.89
P (mm H2O)87.0087.0876.4984.11
L (mm)91.0039.2047.9542.30
W (×10−4) (J)253.00132.35122.22136.50
P/L (adim.)0.952.271.531.90
H’m (mm)62.0076.0871.8873.23
TV (mL)1168.001496.391342.321349.35
VR (mL)991.001359.631207.891224.13
CR (%)84.8096.3191.1591.97
G′ (Pa)26,370.0023,231.3326,678.2427,206.25
G″(Pa)9488.009029.909834.5810,667.36
tan δ (adim.)0.3600.3680.3760.385
Tmax (°C)83.2480.5280.5879.41
Jcmax (×10−5) (Pa−1)24.5024.2724.2923.65
Jrmax (×10−5) (Pa−1)16.6216.3716.2415.72
BV (cm3)372.20360.85355.11283.61
BH (g)786.00807.10673.241565.86
O_BL, O_BM, O_BS: optimal samples with fractions of buckwheat flour with large, medium, and small particle sizes; FN: falling number; WA: water absorption; DT: development time; ST: dough stability; C1-2: speed of protein weakening; C3-2: starch gelatinization; C3-4: cooking stability; C5-4: starch retrogradation; P: dough tenacity; L: dough extensibility; W: deformation energy; P/L: alveograph ratio; H’m: maximum height of the gas release curve; TV: total volume of gas produced; VR: volume of the gas retained in the dough; CR: retention coefficient; G′: storage modulus; G″: loss modulus; tan δ: loss tangent; Tmax: maximum gelatinization temperature; Jcmax, Jrmax: maximum creep-recovery compliance; BV: bread volume; BH: bread hardness.
Publisher’s Note: MDPI stays neutral with regard to jurisdictional claims in published maps and institutional affiliations.

