Abstract
Sorghum grain nutritional quality can be enhanced by applying dry heat treatments. The purpose of this study was to investigate the effects of dry heat treatment at two temperatures (121 and 140 °C) with three fractionation factors (S fraction < 200 μm, M fraction 200–250 μm and, L fraction > 300 μm) on sorghum flour chemical and functional properties, to optimize processes by means of a desirability function, and to characterize the optimal products. Treatment temperature negatively affected oil- and water-absorption capacity, protein and moisture contents, while the opposite trend was obtained for hydration capacity, swelling power, emulsifying properties, fat, ash, and carbohydrate content. Sorghum flour fractions positively influenced the hydration and water-retention capacities, emulsifying properties, and protein and carbohydrate content, while oil absorption, swelling power, fat, ash, and moisture were negatively affected. The optimal processing determined for each fraction was heat treatment at 121.00 °C for S fraction, 132.11 °C for M, and 139.47 °C for L. Optimal product characterization revealed that the color, bioactive properties, and protein and starch structures of the optimal samples had changed after heat treatment, depending on the fraction. These findings could be helpful for the cereal industry, since sorghum flour could be an alternative for conventional crops for the development of new products, such as snacks, baked goods, and pasta.
1. Introduction
Cereal-processing industry dynamics and the continuous growth in consumer demand for special purpose foods, such as those with lower glycemic index, higher fiber content, gluten free products, etc. are the key factors that drive researchers and producers to find solutions to diversify the variety of cereal-based products. Sorghum is the sixth most cultivated cereal in the world [1]. The biggest producer of sorghum in the world is the United States [2]. The surface area cultivated with sorghum in Romania in 2020 was 8.4 million ha, with a production of 26.6 thousand tons [3]. A gluten-free cereal, sorghum flour is usually employed for the manufacturing of bread, porridges, fermented beverages [4], tortilla, cookies, and pasta [5].
The results presented in the literature show that sorghum is generally rich in phenolic phytochemicals that may exert important health-promoting properties [6]. It has been stated that sorghum has low protein quality due to the structural property of its predominant protein (kafirin, Figure 1), to deficiency in amino acids, such as threonine, tryptophan, and lysine, and to interactions with phenol molecules, such as condensed tannins, which form complexes with proteins and reduce their digestion [7].
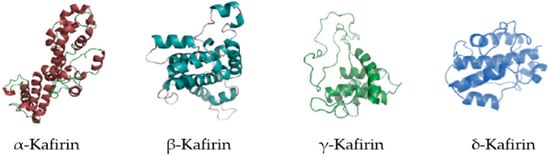
Figure 1.
Kafirin structure. Image adapted from Zhu et al. [8] with permission from Elsevier.
Sorghum grain chemical composition (Table 1) is influenced by genetic and environmental factors. A significant and inverse correlation has been observed for protein with grain weight and starch content, while the ash content was positively correlated with protein content [9]. The main carbohydrates found in sorghum grains are starch, soluble sugar, and fiber. Sorghum is a rich source of slowly digestible starch (SDS), which is beneficial for the digestion and intestinal absorption of carbohydrates in intestine, while the raised amount of dietary fiber (9.7–14.3 g) contributes to digestion enhancement and carbohydrate and cholesterol metabolization [9,10]. Sorghum grain contains low amounts of fat, which is mainly found in the scutellar zone of the germ [9]. Kim et al. [10] reported that sorghum grain contains compounds that could be introduced in foods or dietary supplements to regulate cholesterol levels. Sorghum is rich in minerals and vitamins, which are mainly found in the aleurone coating and germ, being an important fount of B vitamins, except for vitamin B12 [11].

Table 1.
Sorghum grain fraction chemical composition, adapted from Taylor and Duodu [12] with permission from Elsevier.
The main structural components of sorghum grain are the pericarp, germ, and endosperm (Figure 2). Sorghum grains are of the caryopsis type, with the pericarp fully merged with the endosperm. Component weights are pericarp 6%, endosperm 84%, and germ 10% [9]. Sorghum grain processing implies the partial removal and/or change of the three most important components (germ, endosperm, and pericarp), some of the techniques applied being decortication, malting, fermentation, roasting, flaking, and grinding [9].
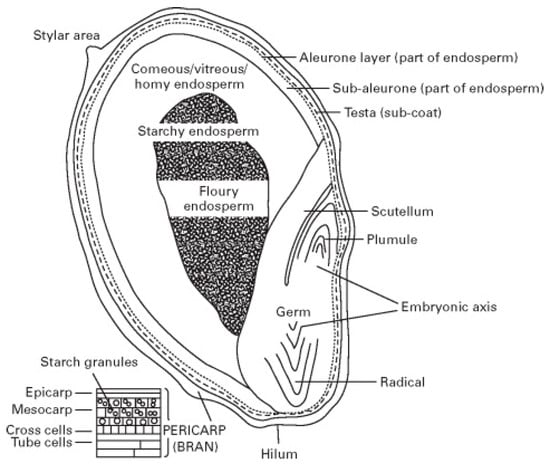
Figure 2.
Sorghum grain structure. Image reproduced after Taylor and Emmambux [13] with permission from Elsevier.
The processing of sorghum grains by milling promotes lipase enzyme release, which results in triglyceride transformation, rise of free fatty acid content, and consequently diminishes the shelf life of the flour [14]. Heat-treatment processing of the grains may be considered a suitable practice for overcoming these disadvantages, causing at the same time changes in final product texture, proximate composition, tannin and antinutrient content, antioxidant properties, digestibility, etc. [15]. Dry heat treatment is a practice in snack manufacturing that has been proved to enhance product edibility, digestibility, and organoleptic characteristics [16]. Schlörmann et al. [17] demonstrated that dry heat treatment of oat up to 160 °C generated an improved sensory profile of the final product and enhanced nutritional value, with lipid, protein, starch, and β-glucan content not being influenced by the treatment, whereas the dietary fiber content was slightly affected. Dry heat treatment of little millet generated the increase of the total phenolic, flavonoid, and tannin content, and antioxidant activity [18].
Milling has a great influence on starch digestibility of cereal-based products, higher digestibility being obtained for lower particle dimensions [19]. On the other hand, obtaining fine particles implies higher energy costs and might not be recommended due to their ability to increase the erosion of the gastrointestinal wall [19]. Furthermore, fine particles may diminish enzyme flow to substrates caused by the release of viscosity, promoting such components as β-glucans, which may influence gastrointestinal residence time, distribution, and digestion [20]. Thus, while it may be preferable to decrease sorghum flour particle-size dimensions for enhanced digestibility, other factors must also be considered to achieve an effective size for a desired product quality. Fractions should be selected according to the purpose of the flour. Alvarenga et al. [21] stated that the fraction containing more sorghum bran resulted in lower expansion and stability when extruded than flour with smaller particles. The chemical and physical properties of sorghum flour fractionated by two milling methods were distinguished depending on the particle size, indicating that sorghum grains were separated into different anatomical parts [22].
The transformation of sorghum grain components into forms that can be readily used in food products without generating negative effects on food sensory characteristics are of interest and under continuous development. To our knowledge, no paper has been published to date regarding the combined effect of sorghum grain dry heat treatment and grain fractionation. The purpose of this paper was: (1) to study the effects of dry heat treatment, temperature, and fractionation on the functional properties and proximate composition of sorghum flour, (2) to optimize the processing conditions for each fraction and compare the characteristics of the optimal samples with untreated ones, and (3) to characterize optimal products regarding molecular, physical characteristics, and bioactive compounds.
2. Materials and Methods
2.1. Materials
White sorghum (ES Albanus hybrid) was acquired from the Secuieni Agricultural Development Research Station (Neamț, Romania).
The dry heat treatment of sorghum grains at two temperatures (121 °C and 140 °C) was performed in a Binder ED53 L convection oven (Binder, Tuttlingen, Germany) for 15 min. The grains were ground in a laboratory mill (grain mill, KitchenAid, model 106 5 KGM, Italy) and sieved in a Retsch AS 200 basic vibratory sieve shaker (Haan, Germany) to get three different fractions: large (L > 300 μm), medium (200 μm < M < 250 μm), and small (S < 200 μm). Optimization of treatment temperature for each fraction considering the functional and proximate composition of the flours was done, then the optimal samples were compared to the control (untreated) fractions and characterized.
2.2. Methods
2.2.1. Functional Properties
Hydration Capacity (HC)
HC was evaluated in duplicate, following the protocol presented by Bordei et al. [23]. An amount of 5 g sorghum flour was weighed and mixed with 30 mL tap water by using a rod for 30 s every 10 min for 1 h. The rod was washed with 10 mL water at the end and the suspension was centrifuged for 20 min at 2300 rpm. The supernatant was discarded and the sample kept at 50 °C for 25 min, then it was weighed after reaching room temperature. The HC was calculated according to Equation (1):
where w0 = tube weight, w1 = sample weight before analysis, and w2 = sample weight after water absorption.
Oil-Absorption Capacity (OAC)
OAC was evaluated in duplicate using a protocol adapted from the one described by Elkhalifa and Bernhardt [24]. For this purpose, 3 g sorghum flour was mixed with sunflower oil (30 mL) and stirred for 1 min at 10 min intervals for 30 min. Then, the mix was centrifuged at 3000 rpm for 15 min, the supernatant discarded, and the pellet weighed after 5 min of draining. OAC was calculated using Equation (2):
where w0 = sample weight before analysis and w1 = sample weight after supernatant discard.
Water-Retention Capacity (WRC)
WRC was evaluated in duplicate using the method presented by Zhu et al. [25]. An amount of 1 g sorghum flour was mixed with 30 mL distilled water and left for 18 h at room temperature in a sealed tube. After centrifugation at 3000 rpm for 20 min, the supernatant was discarded, the sample dried for 2 h at 105 °C in a convection oven, and weighed. WRC was calculated with Equation (3):
where w1 = sample weight before drying an w2 = sample weight after drying.
Swelling Power (SP)
SP was evaluated in duplicate following the protocol described by Elkhalifa and Bernhardt [24], with some modifications. The sorghum flour (0.5 g) was mixed with 15 mL distilled water and heated in a water bath at 90 °C for 30 min. After cooling at room temperature (15 min) and centrifugation at 3000 rpm for 25 min, the supernatant was discarded and the swollen sorghum flour sediment was weighed.
Emulsion Activity (EA) and Stability (ES)
The emulsifying characteristics of sorghum flour fractions were achieved in duplicate following the protocol presented by Elkhalifa and Bernhardt [24]. For EA determination, 2 g sorghum flour was mixed with 20 mL distilled water at 4 °C and 20 mL of sunflower oil. After stirring for 20 min and centrifugation at 4000 rpm for 10 min, the height of the emulsion layer formed was measured. The EA was calculated with Equation (4):
where He = height of the emulsion layer and Hw = height of the whole layer.
For ES evaluation, the emulsion formed in the previous step was heated in a water bath at 80 °C for 30 min, then it was cooled at room temperature for 20 min. After another centrifugation at 4000 rpm for 10 min, the height of the emulsified layer was measured and ES calculated with Equation (5):
where Heh = height of the emulsion layer after heating and Hw = height of the whole layer.
2.2.2. Proximate Composition
The proximate composition in terms of moisture, protein, fat, and ash of sorghum flour fractions was determined by following the ICC standard protocols: moisture (101/1), fat (104/1), protein (105/2), and ash (105/1). The content of carbohydrates was calculated by difference [26].
2.2.3. Optimization of Sorghum Dry Heat Treatment
The response surface methodology (RSM) and D-optimal design (from Design Expert software, Stat-Ease, Minneapolis, MN, USA, trial version) were employed to evaluate the influence of two factors:treatment temperature (121 and 140 °C) and fractionation (L > 300, M 200–300 and S < 200 μm) on sorghum flour functional (HC—hydration capacity, OAC—oil-absorption capacity, SP—swelling power, WRC—water-retention capacity, EA—emulsion activity and ES—emulsion stability), and proximate composition (protein, ash, fat, moisture and carbohydrates). The maximum and minimum values of the responses used in the data matrix are listed in Table 2.
Table 2.
Minimum and maximum values of the responses used in the experimental design.
The effects of factors and their interaction on the considered responses were evaluated through analysis of variance (ANOVA) for the mathematical model fitted to each property. The mathematical model suitability was determined by F sequential test, coefficient of determination (R2), and adjusted coefficients of determination (Adj.-R2). Thus, the 2 FI model (Equation (6)) was selected for all the responses based on the highest R2 and Adj.-R2 values.
where Y = response, x0–3 regression coefficients, and A and B factors.
Desirability function was considered to optimize the treatment temperature for each of the three fractions. The constraints applied consisted of the maximization of HC, SP, WRC, EA, ES, protein, fat, and ash, minimization of carbohydrates, and maintaining the OAC and moisture content within the range. All the factors and responses received the same importance. Model validation was done by verifying the optimal values through experimental determinations, and the obtained values were compared to the fractions of the control sample. Optimal and control samples were used for further characterization.
2.2.4. Characterization of Optimal Samples
Color Evaluation
The color parameters of sorghum flour fractions were measured by reflectance using the CIE Lab system on a Konica Minolta CR-400 (Konica Minolta, Tokyo, Japan) device. The parameters recorded in triplicate were: L* (luminosity), a* (describing red nuance if positive or green nuance if negative), and b* (describing yellow nuance if positive or blue nuance if negative).
Starch Digestibility
Starch fractions, such as rapidly digestible starch (RDS), slowly digestible starch (SDS), resistant starch (RS), and total digestible starch (TDS), and total starch contents of sorghum flour fractions were determined in triplicate following the international AOAC 2017.16 protocol using a Megazyme kit (K-DSTRS; Megazyme, Bray, Ireland). The principle consists of spectrophotometric measurement (at 510 nm) of the glucose released after sample digestion with α-amylase and amyloglucosidase for 20 min (RDS), 120 min (SDS), or 240 min (RS, TDS) using GOPOD reagent.
Total Polyphenols and Antiradical Activity
The extract was prepared by mixing 1 g sorghum flour with methanol 99.9% (1:20 w/v), then the mix was sonicated at 50 °C, at 40 kHz for 30 min.
For total polyphenol content (TPC) determination, 0.2 mL extract was mixed with 2 mL Folin–Ciocâlteu reagent and 1.8 mL sodium carbonate (7.5%). After resting at room temperature in the darkness for 30 min, the absorbance was read at 750 nm [27]. The calibration curve made with gallic acid had R2 = 0.99 and the equation y = 0.00949x + 0.02950.
For antiradical activity (AA) of sorghum flour evaluation, the 2,2 diphenyl-1-picrylhydrazyl (DPPH) method was used. The extract (2 mL) was mixed with DPPH reagent (2 mL) and the absorbance read at 517 nm after 30 min of resting in the darkness at room temperature. The DPPH AA was calculated by using Equation (7).
Starch and Protein Molecular Characteristics
Sorghum flour starch and protein characteristics were evaluated by ATR-FTIR analysis, on a Thermo Scientific Nicolet iS20 (Waltham, MA, USA) device. Three spectra were recorded in the range of 650 cm−1 to 4000 cm−1, with a resolution of 4 cm−1 and 32 scans. After ATR correction of all spectra, the fractions of amide I (1652 cm−1 for α-helix structure and 1624 cm−1 for β-sheets) and starch (1049 cm−1 for crystalline area and 1022 cm−1 for the amorphous region) were evaluated after applying Fourier self-deconvolution on the average spectra. The ratio of structures was determined by reporting the corresponding peak areas [28,29]. Background was collected after each sorghum flour sample.
2.2.5. Statistics
The differences among the experimental and predicted values of the optimal samples were evaluated trough Student’s t test. The differences among the optimal and control samples were checked trough ANOVA and Tukey’s test. The significance level was 95%. All statistical tests and Pearson correlations were done using XLSTAT for Excel 2022 version (Addinsoft, New York, NY, USA) software.
3. Results and Discussion
3.1. Functional Properties and Proximate Composition
3.1.1. Influence of Factors
The experimental data obtained for sorghum flour fraction functional properties and chemical properties were successfully fitted to the 2 FI model (Table 3). The ANOVA results revealed that the model proposed was significant for all the responses, since the F-values were significant at p < 0.05, while R2 values were 0.58–0.97.
Table 3.
ANOVA results for the 2 FI model fitted for the functional properties of sorghum flour.
HC was positively influenced by both factors—treatment temperature and fraction dimension—and their interaction (Table 3), but only in the case of the fraction factor was the effect significant (p < 0.05). The increase in HC with temperature and fraction-dimension increase (Figure 3a) could be related to the increase of damaged starch induced by gelatinization during heat treatment [15]. As the determination method implied the application of an external force to the sample, as stated by Jacobs et al. [30], the nanopores caused by fractionation present on the surface of the sorghum flour particles could play an essential role. A similar trend of HC was reported by these authors for wheat bran with different particle sizes.
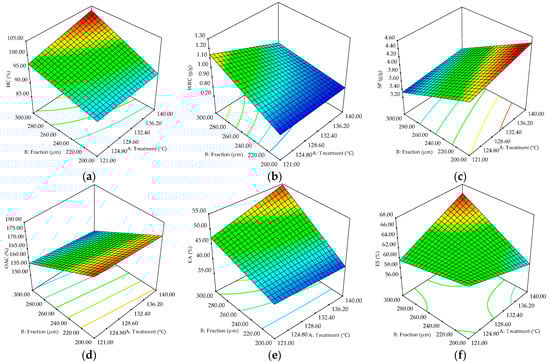
Figure 3.
Three-dimensional graphic showing the combined effects of factors (treatment temperature and fractions) on the sorghum flour: (a) hydration capacity (HC), (b) water-retention capacity (WRC), (c) swelling power (SP), (d) oil-absorption capacity (OAC), (e) emulsion activity (EA), and (f) emulsion stability (ES).
A negative effect of fractionation was observed for sorghum flour OAC (Table 3). OAC decreased with treatment temperature and fraction dimensions decreased, as can be seen in Figure 3d. Almaiman et al. [31] also reported a decrease in OAC of sorghum flour when microwave treatment was applied, probably as a result of the changes in protein hydrophobic properties, oil-absorption capacity being affected by starch–protein–lipid linkages, sequence of polypeptides, various conformational properties of macromolecules, and quantity of apolar amino acids [32]. Furthermore, OAC has been proved to be influenced also by the ability of oil physical entrapment of the sample, surface area, size of macromolecules, charge, and hydrophobicity [33].
Sorghum flour SP was positively influenced by treatment temperature and negatively by fractionation (p < 0.01), as shown in Table 3. A similar increasing trend of SP was obtained by Zou et al. [34] for thermally treated maize starch, which could be explained by the modification of starch granule surface, which determines higher water absorption, SP also being influenced by amylose/amylopectin ratio, molecular weight, and starch–lipid complexes. The milling process affects starch, protein, and cell wall components of sorghum grains, leading to changes in their capacity to bind water and release soluble components [20].
Fractionation exhibited significant positive (p < 0.01) effects (Table 3) on sorghum flour WRC, while treatment temperature and the interaction between factors had a negative influence (p < 0.05). The increase in fraction dimensions resulted in proportional rise of flour WRC (Figure 3b), while an opposite trend was obtained when temperature was increased. The reduction in WRC at the higher treatment temperature could be due to physical damage to the fiber structure at high temperatures, which may lead to changes in water-retention ability [35]. Heat treatment causes a rupture of weak linkages between polysaccharide chains, high temperatures also being able to break the glycosidic bonds in the polysaccharides [35]. The structure of sorghum flour particles comprising nanopores could be responsible for the water binding of sorghum flour, since this water is likely to be retained even when subjected to external forces, such as centrifugation due to capillary forces and the cell walls’ mechanical strength [30].
The EA and ES parameters were positively influenced by treatment temperature and fractionation (p < 0.05), while the interaction between factors showed significant positive influence (p < 0.05) (Table 3). The EA is mainly dependent on the dispersion of proteins at the surface tension of water and air by unfolding its structure, while ES is determined by the creation of a dense cohesive layer around the air bubble [36]. Similar enhancement of the emulsifying properties was obtained by Hassan et al. [36] when radio-frequency heat treatment was applied to maize grains. The increase in protein content as the fraction dimension was higher could represent an explanation for the enhanced EA and ES of sorghum flour with greater fraction size. The different nutritional composition could be explained by the different fractions obtained from sieving.
Sorghum flour protein content was positively influenced (at p < 0.01) by fractionation (Figure 4a), while treatment temperature and the interaction between factors had a significant negative effect. Treatment temperature significantly influenced (p < 0.05) in a positive way fat and ash content, while the fractionation negatively affected (p < 0.01) these parameters (Table 3).
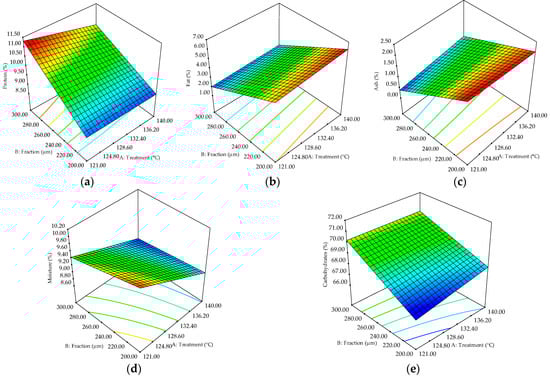
Figure 4.
Three-dimensional graphic showing the combined effects of factors (treatment temperature and fractionation) on the sorghum flour content of: (a) protein, (b) fat, (c) ash, (d) moisture, and (e) carbohydrates.
Sorghum flour moisture content was negatively affected (p < 0.01) by both factors, while their interaction positively influenced this parameter (Table 3). Positive effects of both factors on the carbohydrate content of sorghum flour were observed, but only the fractionation exhibited a significant effect (p < 0.01). Sorghum fractions can determine the contents of macronutrients and digestion rate [37]. Increased protein (Figure 4a) and carbohydrate (Figure 4e) contents as the fraction size raised was observed. Alvarenga et al. [21] stated that the proteins were most abundant in the fibrous mill-feed fraction because the aleurone layer in the pericarp and the peripheral endosperm tissue, which would be found in the sorghum mill-feed, are rich in proteins. On the other hand, the ash (Figure 4c) and moisture (Figure 4d) contents decreased with fraction dimension increase, which is explainable since the endosperm, which is mostly found in smaller fractions, is abundant in minerals [38] and moisture loss can occur during milling [21]. A reduction trend with particle-size increase was also observed for fat (Figure 4c) content, which seems to be more abundant in the germ [22]. The decrease in protein and moisture content with treatment temperature could be due to the denaturation of proteins and moisture loss induced by heating, similar results being reported by Mahajan and Gupta [39] for roasted sorghum. Higher amounts of fat, ash, and carbohydrates were obtained as the treatment temperature raised, which could be due to changes in lipid complexes with other molecules and partial starch gelatinization during heating, which also affects nutrient digestibility [40]. Dharmaraj and Malleshi [40] stated that the extractability of bound lipids increased after hydrothermal processing of millet, changing the fatty acid profile due to the formation of complexes between linoleic acid and amylose.
3.1.2. Pearson Correlations between Variables
Pearson correlation coefficients are presented in Table 4. The protein content was negatively correlated (p < 0.05) with OAC (r = −0.52) and SP (r = −0.75), while with WRC (r = 0.50), HC (r = 0.55), and EA (r = 0.60), significant positive correlations were obtained. The correlations of SP with protein and carbohydrates support the fact that polysaccharide–protein complexes have good emulsifying activity, their capacity to stabilize interfaces being led to the isoelectric point of proteins [41].
Table 4.
Pearson correlation coefficients.
Sorghum flour fat content was negatively correlated with WRC (r = −0.69), HC (r = −0.44), and EA (r = −0.83), while with OAC (r = 0.82) and SP (r = 0.80), positive relationships were observed. These correlations support the observation made by Joshi et al. [42] that different amounts and types of lipids, proteins, and carbohydrates can impact the WRC and HC because they may have distinct polarity and thus different water-binding and -retention capacities. Similar to the fat content variable, the ash content was positively correlated with OAC and SP (r = 0.84, p < 0.05) and negatively with WRC, HC, and EA (−0.41 > r > −0.75, p < 0.05). The moisture content and EA were negatively correlated (r = −0.51, p < 0.05), a negative correlation also being observed between OAC and EA (r = −0.80, p < 0.05).
Significant negative (p < 0.01) correlations were obtained for carbohydrates with OAC (r = −0.85) and SP (r = −0.68) and positive with WRC (r = 0.68) and EA (r = 0.87). WRC and HC are strongly influenced by carbohydrate content and structure, damaged starch, and fibers playing an essential role [22]. The ES parameter was significantly positively (p < 0.01) correlated with HC (r = 0.69) and EA (r = 0.60). OAC is determined by the physical oil entrapment and fat binding to apolar protein molecules, and it is directly dependent on the lipophilicity, amino acid composition, and surface polarity [14].
3.1.3. Optimization and Model Validation
The optimization process for each sorghum flour fraction revealed that dry treatment at 121.00 °C would be recommended for S fraction, 132.11 °C would be appropriate for the M fraction, while for L fraction a temperature of 139.47 °C (Table 5) can be applied to obtain the desired functional and nutritional properties.
Table 5.
Model validation. Properties of the optimal samples compared to the control samples.
Mathematical model validation revealed that the differences between the predicted and experimental values were less than 10%. Compared to Control S, the Optimal S sample presented higher OAC, SP, ES, fat, and ash contents, while the WRC, EA, and carbohydrates were lower. The Optimal M sample exhibited higher EA, ES, protein, fat, and ash contents and lower SP, WRC, and carbohydrates than Control M. Raised HC and ash content and smaller WRC, EA, ES, protein, fat, and carbohydrates values were observed for the Optimal L sample than Control L. Fractionation can lead to nutrient structure changes, mainly due to photo-oxidation, and to the decrease of some compounds’ bioavailability [12]. Previous research revealed that sorghum grain processing through thermal treatment, soaking, and steaming can significantly influence physical tissue structure, nutrient levels, and functional properties of grains [43].
3.2. Characterization of the Optimal Samples
3.2.1. Total Polyphenols, DPPH Antiradical Activity (AA), and Starch Digestibility
Dry heat treatment and fractionation significantly influenced TPC and DPPH AA (Table 6). TPC of the optimal samples was higher compared to the corresponding controls, except for the L fraction. The main polyphenols of sorghum are represented by phenolic acid, flavonoid, procyanidin, and stilbenoids [44]. Woo et al. [45] reported higher flavonoid content in sorghum bran compared to other fractions. Cardoso et al. [46] demonstrated that flavonoids were more sensitive to heat than other phenolics. Considering that, maybe the decrease of TPC in the L fraction could be related to the thermal degradation of the sensitive phenolics. Heat treatment determined a decrease of DPPH AA for all the fractions. Both TPC and DPPH AA reduced as the fraction size increased, the fraction containing the highest amount of bran registering the lowest values. Sharanagat et al. [14] also reported raised levels of DPPH free radical-scavenging activity in native sorghum flour compared to the roasted samples, which may be due to the diminishing of flavonoids that are the most active phenolic compounds after treatment. Zhu et al. [25] stated that the superfine grinding of hull-less barley led to an increase of AA DPPH and TPC, probably because the fiber matrix was damaged, thus causing some phenolic compounds to be released or exposed. The data obtained by Almaiman et al. [31] showed that microwave treatment of sorghum grains raised the TPC in a power-dependent manner, which could lead to the release of phenolic compounds from glycosidic components and to the disintegration of larger phenolic compounds into smaller ones.
Table 6.
Total polyphenols, antiradical activity, and starch digestibility of optimal and control samples.
Starch digestibility was affected by heat treatment, the magnitude of changes depending on the fraction. The content of SDS, TDS, RS, total starch, and RDS increased after heat treatment compared to the control samples, except for SDS in the L fraction sample. SDS formation can lead to some interactions that occur between starch and fat during thermal treatment [47], a fact that may possibly explain the lower SDS in the L optimal sample compared to the control, since it had the lowest lipid content (Table 5). Furthermore, the formation of polyphenol–starch complexes during treatment could also be related to this decrease, it being known that the bran is richer in phenolic compounds compared to other fractions [44,48]. The results for RS and total starch were comparable with those previously reported [37]. The increase in digestible starch content with fraction dimension reduction is the result of the higher substrate–enzyme contact surface and/or of the different composition of the fractions. Starch digestibility is directly influenced by granule size, structure, crystalline pattern, degree of crystallinity, presence of pores or channels on the granule surface, degree of polymerization, nonstarch components, and their interactions with starch [20]. Kanagaraj et al. [49] reported that dry heat treatment methods were found to increase RS content in both rice and barnyard millet, depending on the temperature and time. These results could be due to the reorganization of amylose and amylopectin chains of starch during heating [50].
3.2.2. Color and Molecular Characteristics
The color properties of optimal sorghum flours compared to the controls are presented in Table 7. No significant differences regarding L*, a* and b* values were recorded between Optimal S and Control S, while in the case of M and L fractions the optimal samples exhibited higher L* and lower a* and b* compared to the controls. All the studied samples showed red nuances indicated by the positive values of a* and yellow nuances suggested by the positive values of b*. Fraction dimension increase determined a decrease of L*, while the values of the a* parameter increased. The color of sorghum products is influenced by the quantity and type of phenols and metal ions found in the grains [51]. The differences between the three fractions in terms of color and luminosity may be attributed to the distribution of these phenolics in the sorghum grain, it being known that the color of the pericarp seems to be generated by a combination of primarily anthocyanin and anthocyanidin pigments and other flavonoid compounds [52]. Winger et al. [51] reported an increase in redness of tortillas as the fraction size was higher due to the presence of larger quantities of bran.
Table 7.
Color and molecular characteristics of optimal and control samples.
FT-IR spectra (Figure 5) interpretation allowed the identification of the main molecular characteristics of the optimal and control samples. The results obtained showed that for L fraction, the FT-IR spectra of the optimal sample registered some differences among peaks in the regions 1545, 1746 and 2338–2367 cm−1 (Figure 5a). The peaks found at 1200 to 1900 cm−1 indicate some functional groups and compounds, such as amides, amino acids, –C=O in aldehydes, C–O in esters, CˆO in anhydrides, =O in lactones, t-butyl groups, N–O pyridine groups, esters, lactones, etc. [14]. Changes in the amide II fraction after dry heat treatment can be observed at 1545 cm−1, which is given by the joining of N–H bond vibrations with CN stretching [53]. A prominent peak was observed at 1746 cm−1 for the Optimal L sample, suggesting the changes of amide I fractions caused by the heat treatment that determined denaturation of sorghum proteins. The differences in the 2338–2367 cm−1 regions could be related to the browning reactions that may occur during heat treatment that could lead to the increase in unsaturated carbonyl groups, the degradation of amino acids to aldehydes and their condensation with carbohydrate fractions, furfurals, and other species to set up chromophores and off-flavors [14].
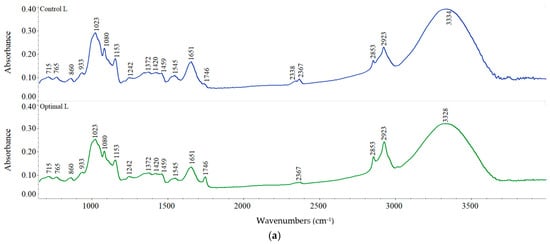
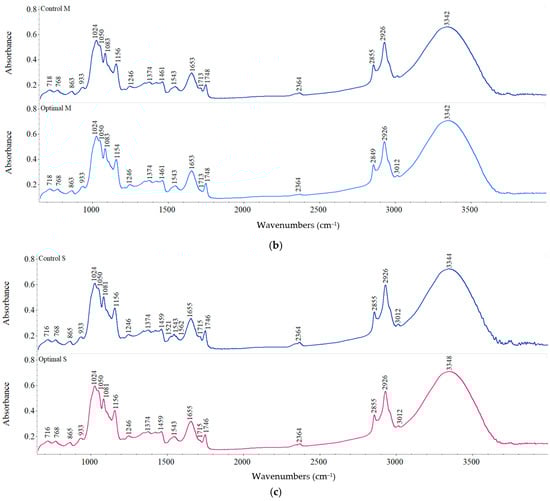
Figure 5.
FT-IR spectra of control and optimal sorghum flour with: (a) L, (b) M, (c) S fraction.
For M and S fractions, no significant changes between optimal and control samples were observed regarding peak occurrence (Figure 5b,c). Peak intensities exhibited differences among fractions, the smallest values being obtained for L fraction. The band appeared at around 3328–3342 cm−1 suggesting the O–H bond stretching from starch and protein–starch interaction and also from water molecules, alcohol, phenolic compounds, or carboxylic acid, while the modification in peak intensity indicates the degree of formation of hydrogen bonds (inter- and intramolecular) [54]. The lower intensities of peaks at 3328–3342 cm−1 for all the optimal samples compared to the corresponding controls could lead to a rise in dehydroxylation reactions upon dry heat treatment [14]. The modification of this band position towards a lower peak intensity suggests an enhancement in the bond strength caused by the interaction within starch molecules and starch with other compounds [55]. The bands observed at about 1156, 1081, and 865 cm−1 for all the studied samples suggest the presence of alcohol (C–O), anhydrides (C=O), and alkane (C–H) groups, respectively [54]. The modification in the intensities of these bands in the optimal samples could be related to the deformation of angular C–H bond, the vibration of—1–4 glycosidic bonds (C–O–C) and C–O linkages in the esters (developed between the –COOH and O–H group of protein and starch, respectively), and could have led to the appearance of new functional groups [14,54].
The amide I structure study revealed that α-helix/β sheet ratio was higher in Optimal S than Control S, while an opposite trend was observed for L and M fractions (Table 7). All the studied samples showed a predominant α–helix protein conformation that increased with fraction size decrease and was reduced after heat treatment of sorghum grains. This means that heat treatment promoted the rise in β-sheet formation, which could indicate protein aggregation [56]. Regarding starch structure, the crystalline areas were more abundant compared to the amorphous ones in all samples and increased after dry heat treatment. Higher crystalline/amorphous ratios were obtained for treated samples than controls, except for L fraction (Table 7), indicating the increase in crystalline molecular structures, a similar trend being reported by González et al. [57] for wheat starch and flour treated at temperatures up to 150 °C. The loss of water molecules during treatment seems to have played an essential role in the reorganization and recrystallization of starch chains.
4. Conclusions
Dry heat treatment of sorghum grains and fractionation significantly impacted flour properties in terms of functional and nutritional characteristics. Treatment temperature and fraction dimension rises determined the increase of sorghum flour hydration capacity, emulsifying properties, and carbohydrate content and the decrease of oil-absorption capacity and moisture content. Positive effects were observed for swelling power, fat, and ash contents when temperature increased gradually, while fractionation affected these parameters. The optimal conditions for the dry heat treatment of sorghum grains for each fraction were 121.00 °C for S fraction, 132.11 °C for M fraction, while for L fraction a temperature of 139.47 °C would be indicated. The optimal samples showed lower red and yellow nuances compared to the untreated samples, while fraction dimension increase determined lightness reduction. TPC increased after dry heat treatment, while antiradical activity slightly decreased. Starch digestibility was affected by heat treatment depending on the fraction type, higher amount of resistant starch, total digestible starch, rapid digestible starch, and total starch being obtained. Molecular characteristic analysis revealed that dry heat treatment induced structure changes in proteins and starch. These results may help producers to select the appropriate processing conditions of sorghum grains depending on the final product type in order to obtain the best quality. Further studies regarding the effects of dry heat treatment and fractionation on dough rheology and final product characteristics are needed. The main limitations of this study are related to the use of a single variety of sorghum grains and the temperature range, which was restrained. The main advantages of using dry heat treatment and milling for sorghum processing led to the eco-friendly character of these techniques and the possibility to enhance the nutritional value of the flour by reducing non-nutritious factors. The sorghum flours after processing could be used in the production of gluten-free baked goods, such as bread, biscuits, and cakes, but also for pasta production. The fraction needed should be selected according to the desired characteristics of the final product.
Author Contributions
A.B., M.U.-I. and S.M. contributed equally to the experimental design, data collection and modeling, data interpretation, and writing of the manuscript. All authors have read and agreed to the published version of the manuscript.
Funding
This work received no external funding.
Institutional Review Board Statement
Not applicable.
Informed Consent Statement
Not applicable.
Data Availability Statement
Data are available on request at the corresponding authors.
Acknowledgments
This work was supported by Romania National Council for Higher Education Funding, CNFIS, project number CNFIS-FDI-2022-0259.
Conflicts of Interest
The authors declare no conflict of interest.
References
- Tasie, M.M.; Gebreyes, B.G. Characterization of Nutritional, Antinutritional, and Mineral Contents of Thirty-Five Sorghum Varieties Grown in Ethiopia. Int. J. Food Sci. 2020, 2020, 8243617. [Google Scholar] [CrossRef] [PubMed]
- World Agricultural Production World Sorghum Production 2021/2022. Available online: http://www.worldagriculturalproduction.com/crops/sorghum.aspx (accessed on 10 May 2022).
- National Institute of Statistics. Romanian Statistical Yearbook; National Institute of Statistics: Bucharest, Romania, 2022.
- Popescu, A.; Condei, R. Some considerations on the prospects of sorghum crop. Sci. Pap. Ser. Manag. Econ. Eng. Agric. Rural Dev. 2014, 14, 295–304. [Google Scholar]
- Liu, L.; Herald, T.J.; Wang, D.; Wilson, J.D.; Bean, S.R.; Aramouni, F.M. Characterization of sorghum grain and evaluation of sorghum flour in a Chinese egg noodle system. J. Cereal Sci. 2012, 55, 31–36. [Google Scholar] [CrossRef]
- Taylor, J.R.N.; Belton, P.S.; Beta, T.; Duodu, K.G. Increasing the utilisation of sorghum, millets and pseudocereals: Developments in the science of their phenolic phytochemicals, biofortification and protein functionality. J. Cereal Sci. 2014, 59, 257–275. [Google Scholar] [CrossRef]
- Medina Martinez, O.D.; Lopes Toledo, R.C.; Vieira Queiroz, V.A.; Pirozi, M.R.; Duarte Martino, H.S.; Ribeiro de Barros, F.A. Mixed sorghum and quinoa flour improves protein quality and increases antioxidant capacity in vivo. LWT 2020, 129, 109597. [Google Scholar] [CrossRef]
- Zhu, L.; Song, X.; Pan, F.; Tuersuntuoheti, T.; Zheng, F.; Li, Q.; Hu, S.; Zhao, F.; Sun, J.; Sun, B. Interaction mechanism of kafirin with ferulic acid and tetramethyl pyrazine: Multiple spectroscopic and molecular modeling studies. Food Chem. 2021, 363, 130298. [Google Scholar] [CrossRef]
- Mir, S.A.; Manickavasagan, A.; Shah, M.A. Whole Grains: Processing, Product Development, and Nutritional Aspects; CRC Press: Boca Raton, FL, USA, 2019; ISBN 1351104756. [Google Scholar]
- Kim, E.; Kim, S.; Park, Y. Sorghum extract exerts cholesterol-lowering effects through the regulation of hepatic cholesterol metabolism in hypercholesterolemic mice. Int. J. Food Sci. Nutr. 2015, 66, 308–313. [Google Scholar] [CrossRef]
- Kulamarva, A.G.; Sosle, V.R.; Raghavan, G.S.V. Nutritional and rheological properties of sorghum. Int. J. Food Prop. 2009, 12, 55–69. [Google Scholar] [CrossRef]
- Taylor, J.; Duodu, K.G. Sorghum and Millets: Chemistry, Technology, and Nutritional Attributes; Elsevier: Duxford, UK, 2018; ISBN 0128115289. [Google Scholar]
- Taylor, J.R.N.; Emmambux, M.N. 13—Products containing other speciality grains: Sorghum, the millets and pseudocereals. In Technology of Functional Cereal Products; Hamaker, B.R., Ed.; Woodhead Publishing Series in Food Science, Technology and Nutrition; Woodhead Publishing: Sawston, UK, 2008; pp. 281–335. ISBN 978-1-84569-177-6. [Google Scholar]
- Sharanagat, V.S.; Suhag, R.; Anand, P.; Deswal, G.; Kumar, R.; Chaudhary, A.; Singh, L.; Singh Kushwah, O.; Mani, S.; Kumar, Y.; et al. Physico-functional, thermo-pasting and antioxidant properties of microwave roasted sorghum [Sorghum bicolor (L.) Moench]. J. Cereal Sci. 2019, 85, 111–119. [Google Scholar] [CrossRef]
- Meera, M.S.; Bhashyam, M.K.; Ali, S.Z. Effect of heat treatment of sorghum grains on storage stability of flour. LWT Food Sci. Technol. 2011, 44, 2199–2204. [Google Scholar] [CrossRef]
- Sharma, P.; Gujral, H.S. Effect of sand roasting and microwave cooking on antioxidant activity of barley. Food Res. Int. 2011, 44, 235–240. [Google Scholar] [CrossRef]
- Schlörmann, W.; Zetzmann, S.; Wiege, B.; Haase, N.U.; Greiling, A.; Lorkowski, S.; Dawczynski, C.; Glei, M. Impact of different roasting conditions on sensory properties and health-related compounds of oat products. Food Chem. 2020, 307, 125548. [Google Scholar] [CrossRef] [PubMed]
- Pradeep, S.R.; Guha, M. Effect of processing methods on the nutraceutical and antioxidant properties of little millet (Panicum sumatrense) extracts. Food Chem. 2011, 126, 1643–1647. [Google Scholar] [CrossRef] [PubMed]
- Kim, J.C.; Mullan, B.P.; Pluske, J.R. A comparison of waxy versus non-waxy wheats in diets for weaner pigs: Effects of particle size, enzyme supplementation, and collection day on total tract apparent digestibility and pig performance. Anim. Feed Sci. Technol. 2005, 120, 51–65. [Google Scholar] [CrossRef]
- Mahasukhonthachat, K.; Sopade, P.A.; Gidley, M.J. Kinetics of starch digestion in sorghum as affected by particle size. J. Food Eng. 2010, 96, 18–28. [Google Scholar] [CrossRef]
- Alvarenga, I.C.; Ou, Z.; Thiele, S.; Alavi, S.; Aldrich, C.G. Effects of milling sorghum into fractions on yield, nutrient composition, and their performance in extrusion of dog food. J. Cereal Sci. 2018, 82, 121–128. [Google Scholar] [CrossRef]
- Rumler, R.; Bender, D.; Speranza, S.; Frauenlob, J.; Gamper, L.; Hoek, J.; Jäger, H.; Schönlechner, R. Chemical and physical characterization of sorghum milling fractions and sorghum whole meal flours obtained via stone or roller milling. Foods 2021, 10, 870. [Google Scholar] [CrossRef]
- Bordei, D.; Bahrim, G.; Pâslaru, V.; Gasparotti, C.; Elisei, A.; Banu, I.; Ionescu, L.; Codină, G. Quality Control in the Bakery Industry-Analysis Methods. Galați Acad. 2007, 1, 203–212. [Google Scholar]
- Elkhalifa, A.E.O.; Bernhardt, R. Combination Effect of Germination and Fermentation on Functional Properties of Sorghum Flour. Curr. J. Appl. Sci. Technol. 2018, 30, 1–12. [Google Scholar] [CrossRef]
- Zhu, F.; Du, B.; Xu, B. Super fi ne grinding improves functional properties and antioxidant capacities of bran dietary fi bre from Qingke (hull-less barley) grown in Qinghai-Tibet Plateau, China. J. Cereal Sci. 2015, 65, 43–47. [Google Scholar] [CrossRef]
- FAO. Chapter 4: Summary—Integration of Analytical Methods and Food Energy Conversion Factors. Available online: https://www.fao.org/3/y5022e/y5022e05.htm#bm5 (accessed on 7 April 2022).
- Singleton, V.L.; Rossi, J.A. Colorimetry of total phenolics with phosphomolybdic-phosphotungstic acid reagents. Am. J. Enol. Vitic. 1965, 16, 144–158. [Google Scholar]
- Gao, X.; Tong, J.; Guo, L.; Yu, L.; Li, S.; Yang, B.; Wang, L.; Liu, Y.; Li, F.; Guo, J.; et al. Influence of gluten and starch granules interactions on dough mixing properties in wheat (Triticum aestivum L.). Food Hydrocoll. 2020, 106, 105885. [Google Scholar] [CrossRef]
- Iuga, M.; Mironeasa, S. Application of heat moisture treatment in wheat pasta production. Food Control 2021, 128, 108176. [Google Scholar] [CrossRef]
- Jacobs, P.J.; Hemdane, S.; Dornez, E.; Delcour, J.A.; Courtin, C.M. Study of hydration properties of wheat bran as a function of particle size. Food Chem. 2015, 179, 296–304. [Google Scholar] [CrossRef]
- Almaiman, S.A.; Albadr, N.A.; Alsulaim, S.; Alhuthayli, H.F.; Osman, M.A.; Hassan, A.B. Effects of microwave heat treatment on fungal growth, functional properties, total phenolic content, and antioxidant activity of sorghum (Sorghum bicolor L.) grain. Food Chem. 2021, 348, 128979. [Google Scholar] [CrossRef]
- Sharma, P.; Gujral, H.S. Extrusion of Hulled Barley Affecting β-Glucan and Properties of Extrudates. Food Bioprocess Technol. 2013, 6, 1374–1389. [Google Scholar] [CrossRef]
- Wani, I.A.; Sogi, D.S.; Shivhare, U.S.; Gill, B.S. Physico-chemical and functional properties of native and hydrolyzed kidney bean (Phaseolus vulgaris L.) protein isolates. Food Res. Int. 2015, 76, 11–18. [Google Scholar] [CrossRef]
- Zou, J.; Xu, M.; Tang, W.; Wen, L.; Yang, B. Modification of structural, physicochemical and digestive properties of normal maize starch by thermal treatment. Food Chem. 2020, 309, 125733. [Google Scholar] [CrossRef]
- Caprita, R.; Caprita, A.; Cretescu, I. Effect of Heat Treatment and Digestive Enzymes on Cereal Water-Retention Capacity. Sci. Pap. Anim. Sci. Biotechnol. 2015, 48, 94–96. [Google Scholar]
- Hassan, A.B.; von Hoersten, D.; Mohamed Ahmed, I.A. Effect of radio frequency heat treatment on protein profile and functional properties of maize grain. Food Chem. 2019, 271, 142–147. [Google Scholar] [CrossRef]
- Moraes, É.A.; Marineli, R.D.S.; Lenquiste, S.A.; Steel, C.J.; De Menezes, C.B.; Queiroz, V.A.V.; Maróstica Júnior, M.R. Sorghum flour fractions: Correlations among polysaccharides, phenolic compounds, antioxidant activity and glycemic index. Food Chem. 2015, 180, 116–123. [Google Scholar] [CrossRef] [PubMed]
- Xiong, Y.; Zhang, P.; Warner, R.D.; Fang, Z. Sorghum Grain: From Genotype, Nutrition, and Phenolic Profile to Its Health Benefits and Food Applications. Compr. Rev. Food Sci. Food Saf. 2019, 18, 2025–2046. [Google Scholar] [CrossRef] [PubMed]
- Mahajan, H.; Gupta, M. Nutritional, functional and rheological properties of processed sorghum and ragi grains. Cogent Food Agric. 2015, 1, 1109495. [Google Scholar] [CrossRef]
- Dharmaraj, U.; Malleshi, N.G. Changes in carbohydrates, proteins and lipids of finger millet after hydrothermal processing. LWT Food Sci. Technol. 2011, 44, 1636–1642. [Google Scholar] [CrossRef]
- Lucas-González, R.; Viuda-Martos, M.; Pérez-Álvarez, J.Á.; Fernández-López, J. Evaluation of Particle Size Influence on Proximate Composition, Physicochemical, Techno-Functional and Physio-Functional Properties of Flours Obtained from Persimmon (Diospyros kaki Trumb.) Coproducts. Plant Foods Hum. Nutr. 2017, 72, 67–73. [Google Scholar] [CrossRef] [PubMed]
- Joshi, A.U.; Liu, C.; Sathe, S.K. Functional properties of select seed flours. LWT 2015, 60, 325–331. [Google Scholar] [CrossRef]
- Wu, L.; Huang, Z.; Qin, P.; Ren, G. Effects of processing on phytochemical profiles and biological activities for production of sorghum tea. Food Res. Int. 2013, 53, 678–685. [Google Scholar] [CrossRef]
- Li, Z.; Zhao, X.; Zhang, X.; Liu, H. The Effects of Processing on Bioactive Compounds and Biological Activities of Sorghum Grains. Molecules 2022, 27, 3246. [Google Scholar] [CrossRef] [PubMed]
- Woo, K.S.; Seo, M.C.; Kang, J.R.; Ko, J.Y.; Song, S.B.; Lee, J.S.; Oh, B.G.; Do Park, G.; Lee, Y.H.; Nam, M.H.; et al. Antioxidant compounds and antioxidant activities of the methanolic extracts from milling fractions of sorghum (Sorghum Bicolor L. Moench). J. Korean Soc. Food Sci. Nutr. 2010, 39, 1695–1699. [Google Scholar] [CrossRef]
- Cardoso, L.d.M.; Pinheiro, S.S.; de Carvalho, C.W.P.; Queiroz, V.A.V.; de Menezes, C.B.; Moreira, A.V.B.; de Barros, F.A.R.; Awika, J.M.; Martino, H.S.D.; Pinheiro-Sant’Ana, H.M. Phenolic compounds profile in sorghum processed by extrusion cooking and dry heat in a conventional oven. J. Cereal Sci. 2015, 65, 220–226. [Google Scholar] [CrossRef]
- Silva, W.M.F.; Biduski, B.; Lima, K.O.; Pinto, V.Z.; Hoffmann, J.F.; Vanier, N.L.; Dias, A.R.G. Starch digestibility and molecular weight distribution of proteins in rice grains subjected to heat-moisture treatment. Food Chem. 2017, 219, 260–267. [Google Scholar] [CrossRef] [PubMed]
- Liu, B.; Zhong, F.; Yokoyama, W.; Huang, D.; Zhu, S.; Li, Y. Interactions in starch co-gelatinized with phenolic compound systems: Effect of complexity of phenolic compounds and amylose content of starch. Carbohydr. Polym. 2020, 247, 116667. [Google Scholar] [CrossRef] [PubMed]
- Kanagaraj, S.P.; Ponnambalam, D.; Antony, U. Effect of dry heat treatment on the development of resistant starch in rice (Oryza sativa) and barnyard millet (Echinochloa furmantacea). J. Food Process. Preserv. 2019, 43, e13965. [Google Scholar] [CrossRef]
- Adebowale, K.O.; Olu-Owolabi, B.I.; Olayinka, O.O.; Lawal, O.S. Effect of heat moisture treatment and annealing on physicochemical properties of red sorghum starch. African J. Biotechnol. 2005, 4, 928–933. [Google Scholar] [CrossRef]
- Winger, M.; Khouryieh, H.; Aramouni, F.; Herald, T.; Al, M.W.E.T. Sorghum Flour characterization and evaluation in gluten-free flour tortilla. J. Food Qual. 2014, 37, 95–106. [Google Scholar] [CrossRef]
- Ratnavathi, C.; Patil, L.V.; Chavan, U. Sorghum Biochemistry: An Industrial Perspective; Academic Press: Oxford, UK, 2016; ISBN 9780415475976. [Google Scholar]
- Kamble, D.B.; Singh, R.; Rani, S.; Kaur, B.P.; Upadhyay, A.; Kumar, N. Optimization and characterization of antioxidant potential, in vitro protein digestion and structural attributes of microwave processed multigrain pasta. J. Food Process. Preserv. 2019, 43, e14125. [Google Scholar] [CrossRef]
- Navyashree, N.; Singh Sengar, A.; Sunil, C.K.; Venkatachalapathy, N. White Finger Millet (KMR-340): A comparative study to determine the effect of processing and their characterisation. Food Chem. 2022, 374, 131665. [Google Scholar] [CrossRef]
- Sun, Q.; Dai, L.; Nan, C.; Xiong, L. Effect of heat moisture treatment on physicochemical and morphological properties of wheat starch and xylitol mixture. Food Chem. 2014, 143, 54–59. [Google Scholar] [CrossRef]
- Oladiran, D.A.; Emmambux, N.M. Nutritional and Functional Properties of Extruded Cassava-Soy Composite with Grape Pomace. Starch 2018, 70, 1700298. [Google Scholar] [CrossRef]
- González, M.; Vernon-Carter, E.J.; Alvarez-Ramirez, J.; Carrera-Tarela, Y. Effects of dry heat treatment temperature on the structure of wheat flour and starch in vitro digestibility of bread. Int. J. Biol. Macromol. 2021, 166, 1439–1447. [Google Scholar] [CrossRef]
Publisher’s Note: MDPI stays neutral with regard to jurisdictional claims in published maps and institutional affiliations. |
© 2022 by the authors. Licensee MDPI, Basel, Switzerland. This article is an open access article distributed under the terms and conditions of the Creative Commons Attribution (CC BY) license (https://creativecommons.org/licenses/by/4.0/).