Article

Competitive Detection of Volatile Compounds from Food Degradation by a Zinc Oxide Sensor

1
Department of Civil, Energy, Environment and Material Engineering, Mediterranea University of Reggio Calabria, Via Graziella Loc. Feo di Vito, 89124 Reggio Calabria, Italy
2
Department of Information Engineering, Infrastructures and Sustainable Energy, Mediterranea University of Reggio Calabria, Via Graziella Loc. Feo di Vito, 89124 Reggio Calabria, Italy
3
Department of Heritage, Architecture, Urbanism (PAU), Mediterranea University of Reggio Calabria, Via dell’Università 25, 89124 Reggio Calabria, Italy
*
Author to whom correspondence should be addressed.
Appl. Sci. 2022, 12(4), 2261; https://doi.org/10.3390/app12042261
Submission received: 30 November 2021 / Revised: 11 February 2022 / Accepted: 20 February 2022 / Published: 21 February 2022

Abstract

:
During the phenomenon of food degradation, several volatile organic compounds are generally released. In particular, due to lipid oxidation in stored and packed meat, hexanal is formed as a typical decomposition product. Therefore, its detection can provide an important indication of the quality and conservation of meat. Unfortunately, the simultaneous release of other compounds, such as 1-pentanol and 1-octen-3-ol, during the first phase of the degradation process can have an undesirable effect on the detection of hexanal. In this work, a metal oxide (MOX) sensor based on zinc oxide (ZnO) was prepared and tested for possible use in the monitoring of low concentrations of hexanal. The sensor was expected to detect the target volatile with minimum interference from all the others, when released all at the same time. For this purpose, the ZnO sensor was exposed to both pure and different mixtures of vapors of the main competing organic compounds. Comparing the results of the mixtures to the response relating to pure hexanal, it was highlighted that the presence of 1-pentanol and 1-octen-3-ol decreases the response of the sensor to hexanal in terms of the eR/R0 ratio, especially at low concentrations (5–10 ppm), while at 50 ppm, the sensor response was comparable with the hexanal quantity, proving that its detection was less affected at higher concentrations.

1. Introduction

Food quality evaluation, shelf-life determination, and raw product control are important fields in which conductometric gas sensors have been applied in recent years. In these sensors, the gas detection mechanism is based on the conductance variation of a semiconducting metal oxide (MOX) layer caused by the chemical/physical adsorption of the gas molecules on the MOX surface [1]. MOX sensors have been intensively studied and used for their low production cost, reduced size, and high sensitivity to a broad range of chemicals. Compared to typical chemical analytical techniques used in food industry, the lower accuracy of MOX sensors is compensated by a faster response, higher portability for field usage, and less expansive instrumentation. A possible application of MOX sensors in the food industry for meat quality control is the detection of hexanal, a typical decomposition product of meat formed during lipid oxidation in stored and packed meat products [2,3,4]. Hexanal, indeed, is considered an important indicator of the freshness status [5,6] of raw meat products. In a preliminary work, we compared three different MOX sensors for hexanal detection and we found that zinc oxide (ZnO), used as the detecting layer for resistive sensors, showed the best compromise between the sensing temperature (T = 523 K) and response amplitude [7,8]. Indeed, the ZnO resistive gas sensor was tested with a broad range of hexanal concentrations in different working conditions, especially in terms of the working temperatures and relative humidity. However, although the suitability of the ZnO sensor for hexanal detection was proved, the influence of other factors needs to be considered. In particular, in real food monitoring conditions, the decomposition process leads to the formation of numerous volatiles even during the early stage and the sensor must have the ability to detect the target volatile with minimal interference from others. In other words, the sensor must show sensitivity and selectivity towards hexanal. In general, as known, selectivity is one of the major issues in conductometric sensors made of semiconductor oxides because the sensing mechanism based on the exchange of electrons on the sensor surface during the “oxidation” of the volatile molecules is not a selective process and similar compounds can oxidize at the same time [9]. Several alternatives to improve the selectivity and sensitivity of MOX sensors are under continuous development, for example, the synthesis of particular architectures, such as nanowires, nanotubes, and nanosheets [10], exploiting the effect of nanostructured materials with respect to the bulk form [11], or the preparation of conductometric sensors based on p/n-type heterojunctions [12]. Similarly, the development of electronic noses requires the implementation of different sensor arrays to improve the ability to discriminate between similar volatile compounds [9,13,14,15]. However, electron noses, which ensure the widest applicability, are complex and voluminous equipment that require trained specialists for their use. A single sensor or at most a combination of two makes the detection system easy to use even for unskilled operators and easily transportable, even if it is not usable for generic analyses but suitably developed for a specific application. From this point of view, a complete characterization of the sensor’s behavior in the environment of interest is a fundamental step for the realization of the measurement system. Therefore, in this work, we studied the effect of the coexistence of the main volatiles formed during meat degradation on the response of a ZnO sensor to hexanal, which, to the best of our knowledge, has not been reported yet. In the first stage of the degradation process, 1-pentanol and 1-octen-3-ol are the two main compounds released together with hexanal that can unexpectedly and unwantedly interfere during the detection of the MOX sensor [4,6,16]. The ZnO sensor was initially exposed to the three pure compounds and subsequently to binary and ternary mixtures of the three compounds, simulating a degradation process, to compare the responses and evaluate the effect of the interference. The results showed that the interaction of the three volatiles on the ZnO surface interferes in the hexanal detection, reducing the sensor’s sensitivity in comparison to the response to the vapors of the pure component. A comparative analysis of the transient response, however, showed that the electrical resistance of the ZnO sensor in the presence of hexanal vapors had a very rapid decrease that was not observed with the other compounds. Therefore, in a detection device based on a single ZnO sensor, the intensity of the signal, which is related to the vapor concentration, should not be the only parameter that is relied on, but the combination with the decrease rate of the sensor’s resistance, which is distinctive of hexanal, has to be considered so to improve the reliability of the response.

2. Experimental

2.1. Sensor Preparation and Characterization

Zinc oxide powder was prepared dissolving zinc nitrate (0.68 M) in aqueous solution and hydrolyzing it with a solution of potassium carbonate (1 M) [8]. The precipitate was filtered, washed with deionized water, dried at 383 K for 12 h, and then calcinated at 673 K for 2 h in air.
The powder was characterized by XRD analysis, D2 Phaser, equipped with a heating chamber, Anton Paar HTK 1200N (Bruker, Billerica, MA, USA), in the 2θ range 15–65° (Cu Kα1 = 1.54056 Å) and by scanning electron microscopy (SEM) (Phenom ProX, Deben, Suffolk, UK). To evaluate the thermal stability of the synthesized zinc oxide, X-ray diffractometry at increasing temperatures was carried out to collect powder patterns at 298–373–473–523–573–673 K.
The ZnO powder was mixed with ethanol in an ultrasonic bath. The alcoholic paste was painted, with a controlled thickness, on the surface of an alumina support (3 mm × 6 mm) with interdigitated Pt electrodes on one side and a Pt heater on the other. The sensor was annealed at 673 K for 2 h in air before the sensing tests to stabilize the microstructure of the film.

2.2. Sensing Experiments

Liquid solutions of the three compounds, hexanal > 98%, 1-pentanol > 99%, 1-octen-3-ol > 98% (Sigma Aldrich, St. Louis, MO, USA), were used to generate pure vapors and mixtures for the experiments.
For the detection tests, the sensor was placed in a stainless-steel cell and exposed to 100 sccm of the vapor mixture, consisting of dry air (the carrier) and organic compounds. Pure vapors were obtained by bubbling dry air in pure liquid organics maintained at 258 (±0.1) K by a refrigerated circulating bath. Different concentrations (5–10–50 ppm) of vapors were obtained by regulating air fluxes by a battery of mass flow controllers (Brooks Instruments, Hatfield, PA, USA). Similarly, binary and ternary mixtures of vapors were obtained by flowing dry air in liquid mixtures of compounds according to the composition reported in Table 1.
The gas concentrations of the pure compounds were calculated from the vapor pressures at T = 258 K estimated by the Antoine equation with coefficients from literature data [17,18,19]. The calculated values were compared with the evaporated quantities by periodically weighting the remaining liquid using an analytical balance. In the case of binary and ternary mixtures, the vapor concentrations were calculated using Raoult’s law in the hypothesis of ideal mixtures:
x i P i 0 = y i P  
where xi = molar fraction of the component I in the liquid mixture, P i 0 = vapor pressure of the component I, yi = molar fraction of the component I in the gas mixture, and P = the total (atmospheric) pressure.
The sensor’s resistance data were collected in the four-point mode by an Agilent 34970A multimeter while a dual-channel power supplier instrument, Agilent E3632A (Agilent Technologies, Santa Clara, CA, USA) allowed the sensor’s temperature to be controlled, as explained elsewhere [7].

3. Results

3.1. ZnO Characterization

In Figure 1a, an SEM image of the synthesized ZnO powder is shown. The mean particle size of the powder ranged from 0.1–0.5 μm. The XRD pattern of ZnO acquired at 298 K is shown in Figure 1b and confirms the typical hexagonal structure of wurtzite (cell parameters: a = 3.249 Å, c = 5.207 Å) with crystallites size = 40.9 nm calculated by the Debye–Scherrer equation. MOX sensors, however, generally have a working temperature higher than 298 K. Thus, an investigation of the possible transformation/transitions of ZnO in temperatures ranging from 298–673 K was considered of interest, with T = 523 K being the working temperature of the sensor used in all the experiments and T = 673 K being the annealing temperature of the synthesized powder before the sensing tests. The results of the X-ray diffractometry and increasing temperature are shown in Figure 1b. After heating the oxide powder to 673 K, the hexagonal structure of ZnO did not show crystallographic variations as evidenced by the X-ray pattern and no increase in the peaks’ intensity or variation in the peaks’ shape were observed (Figure 1b), demonstrating that the particle size did not change at the annealing temperature. The only consequence of the powder heating was the shift in the diffractometric peaks towards lower angles when the temperature was increased, as shown in the inset of Figure 1b for the peak at 2-Tetha ≈ 31.7°. This is an indication of the thermal expansion of the unit cell volume with the temperature. The thermal stability of the sensing layer is important because in the case of the sintering of oxide particles, the sensor response decreases with time [20,21,22]. SEM analysis of the ZnO powder after the annealing treatment at T = 673 K confirmed the previous result because no evidence of morphologic variations was observed (Figure 1a).

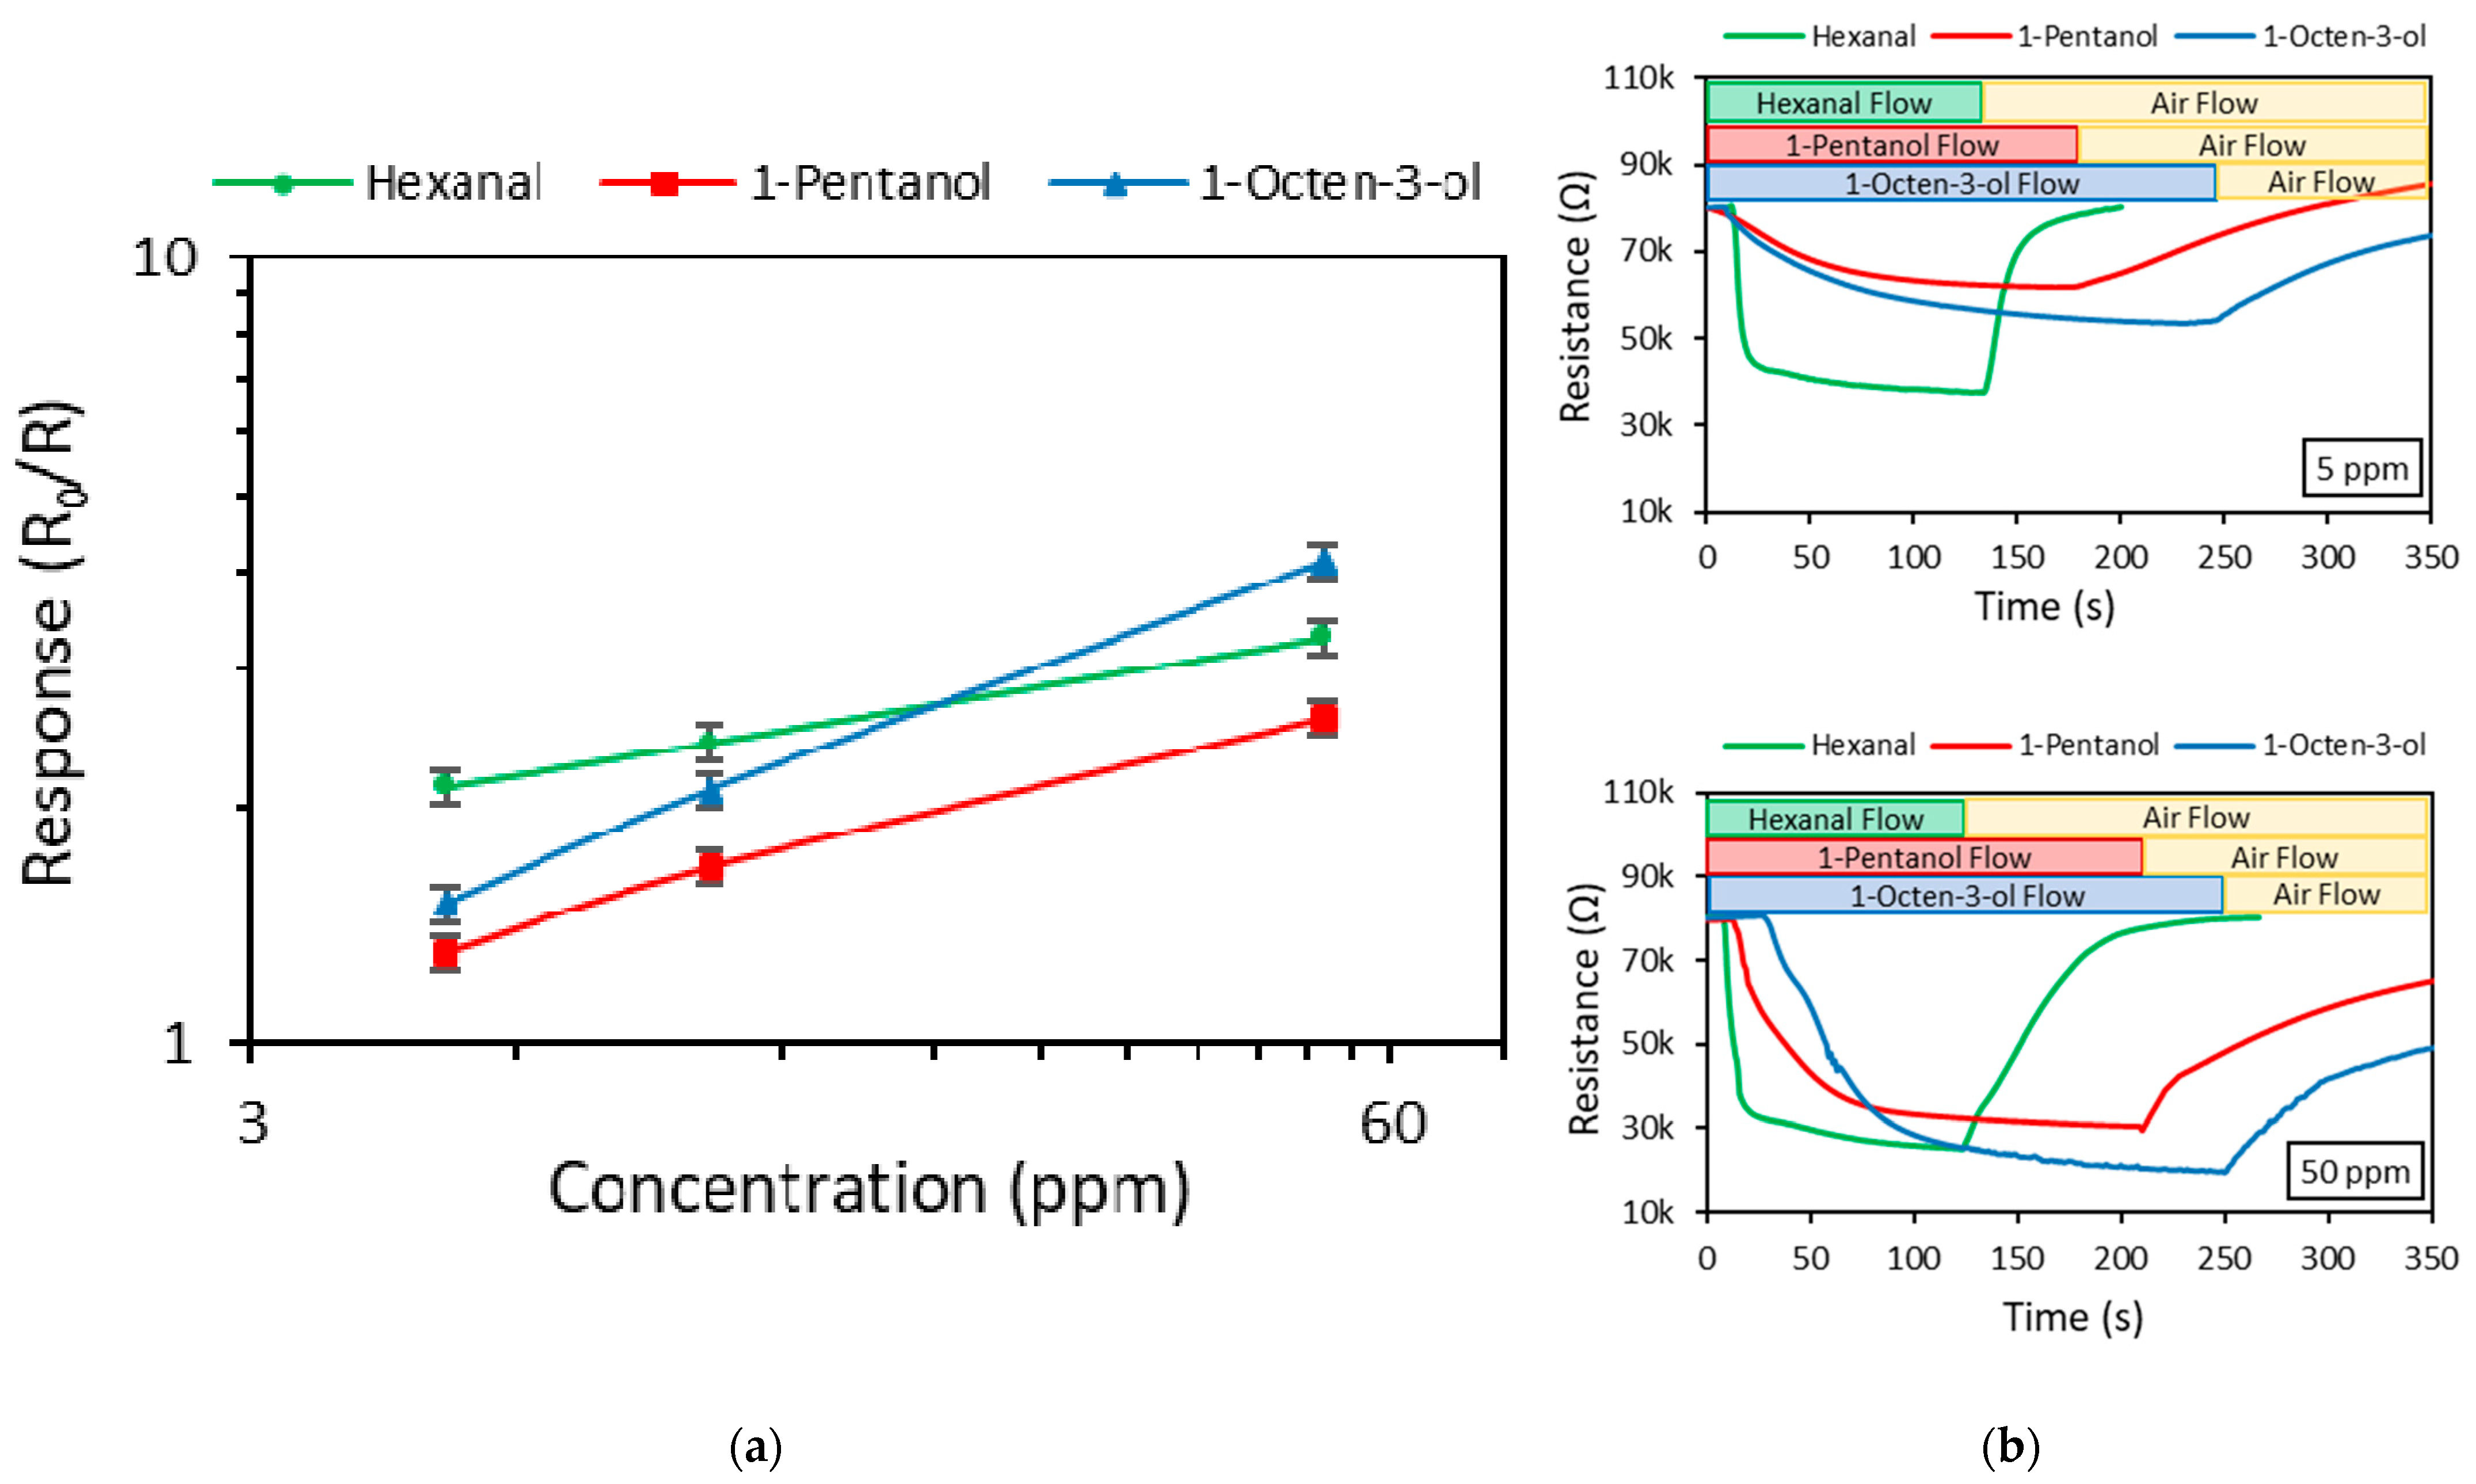
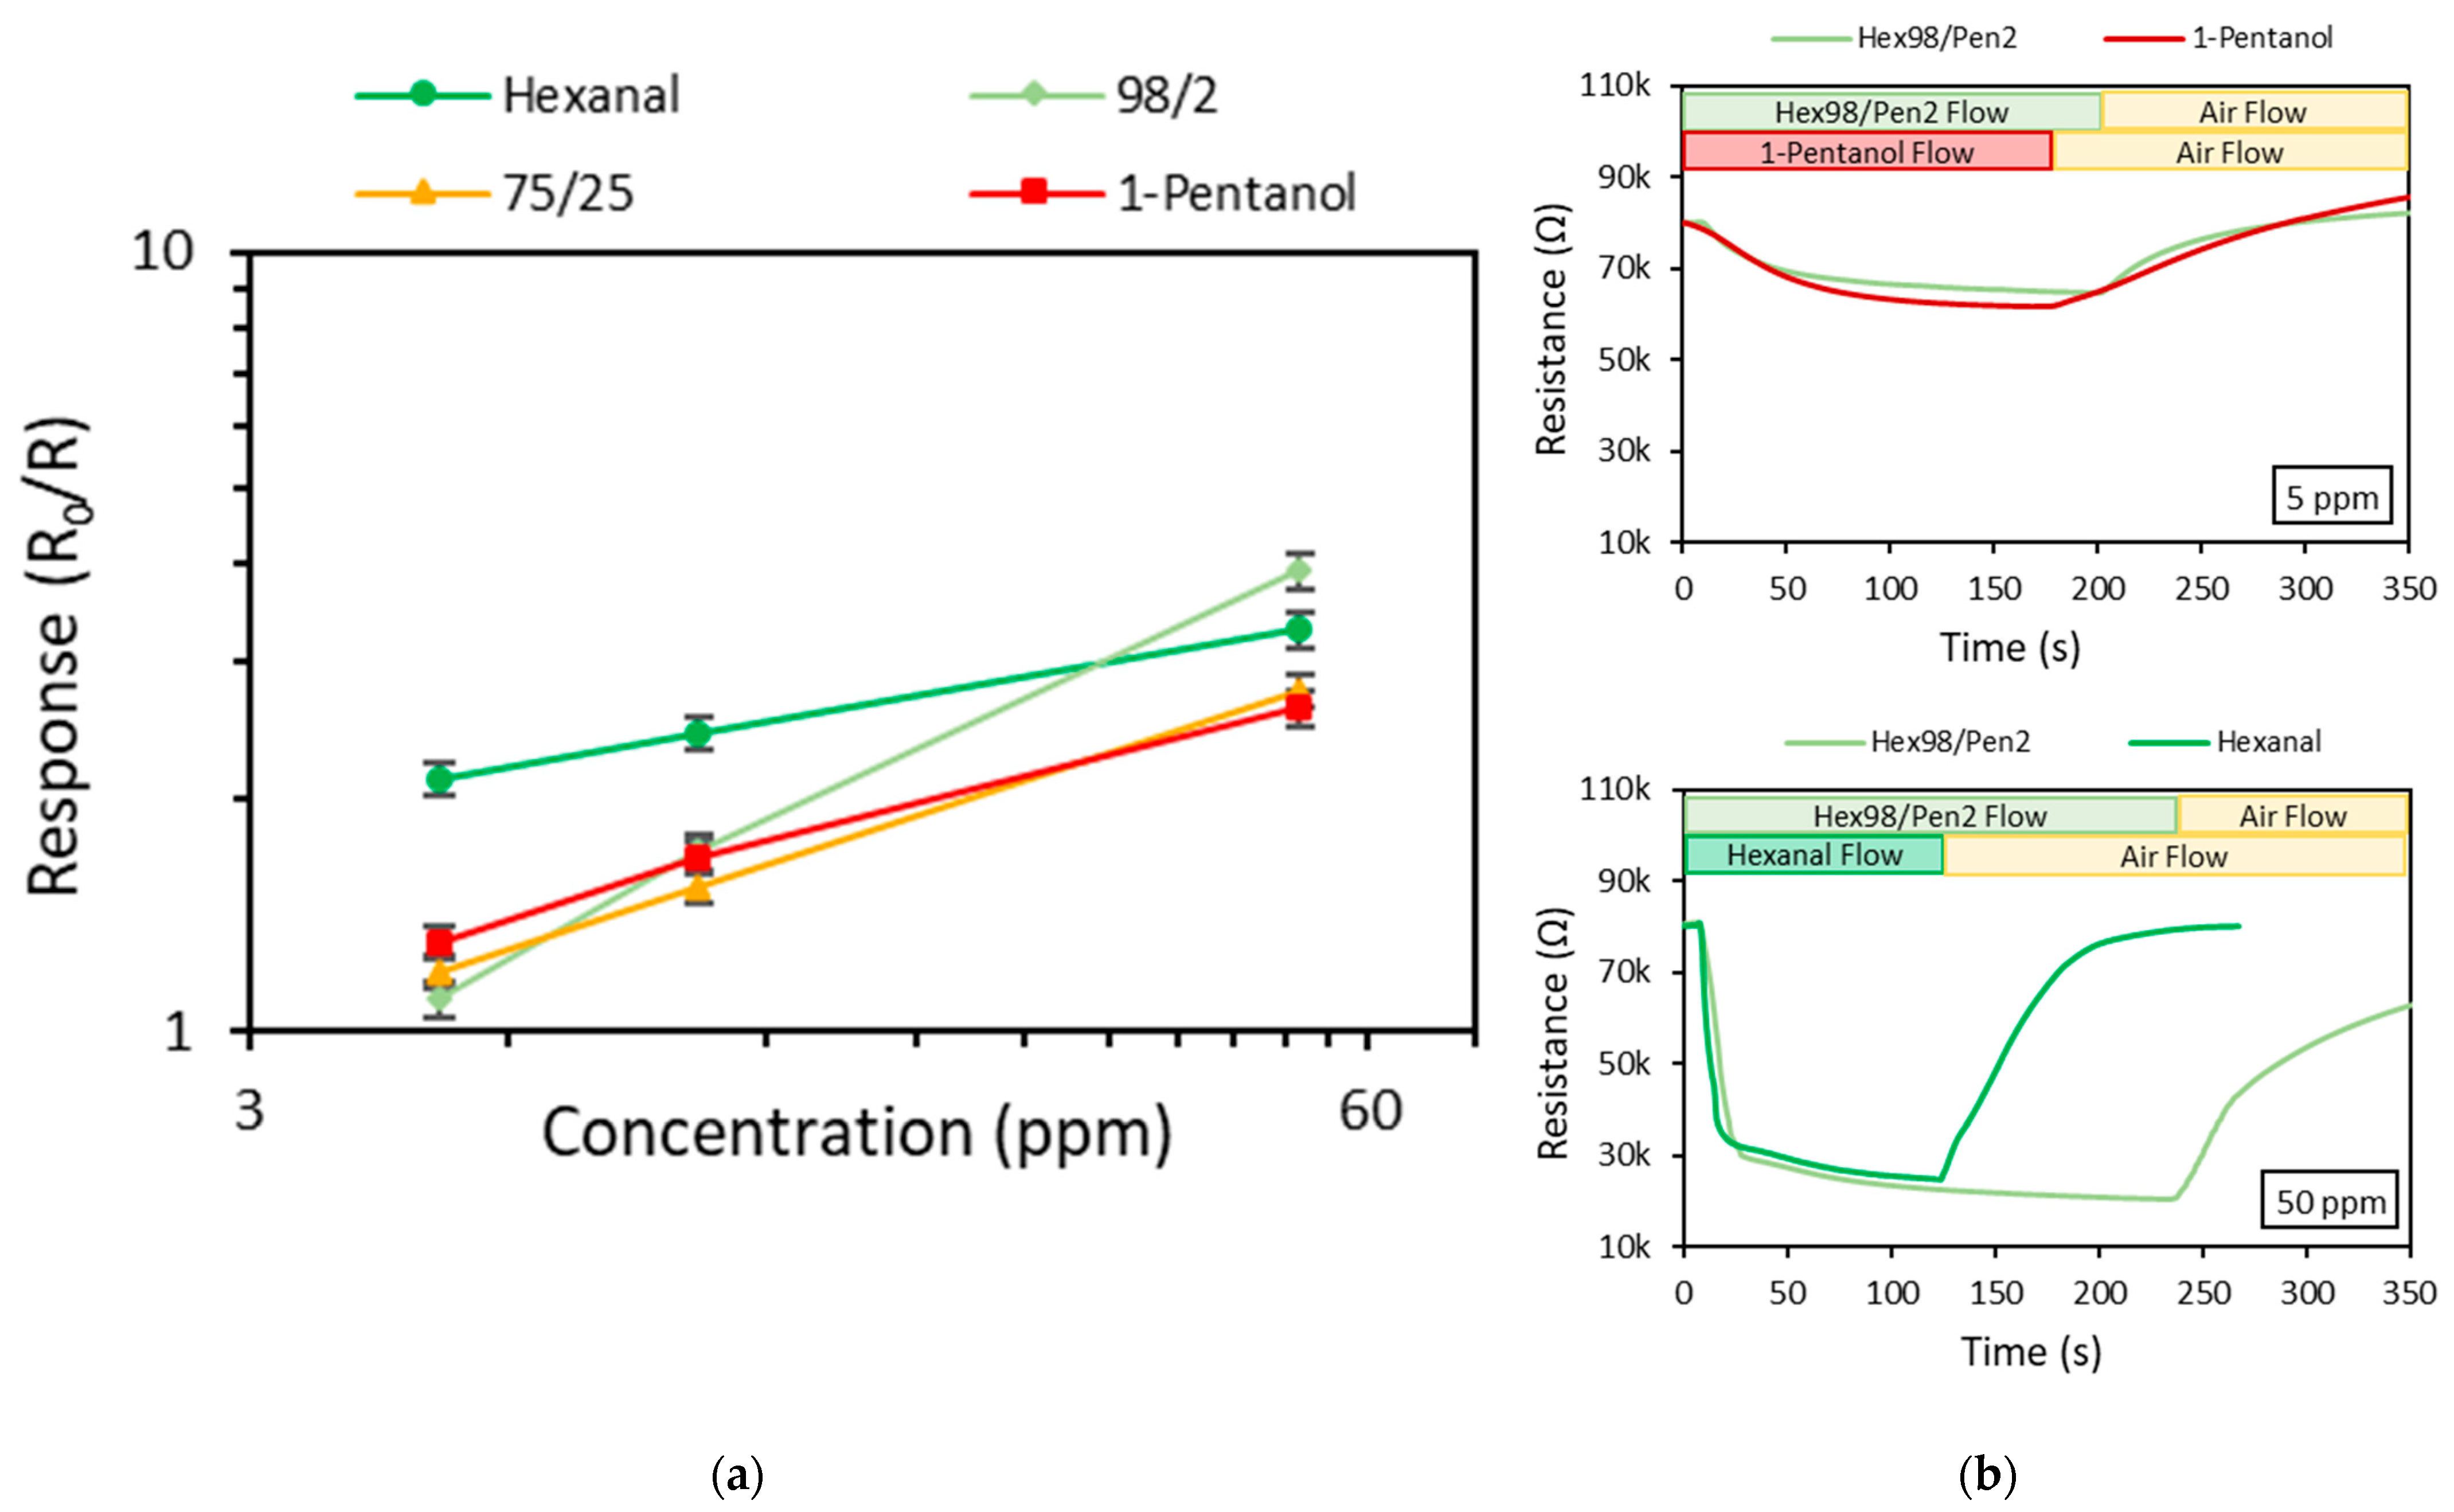
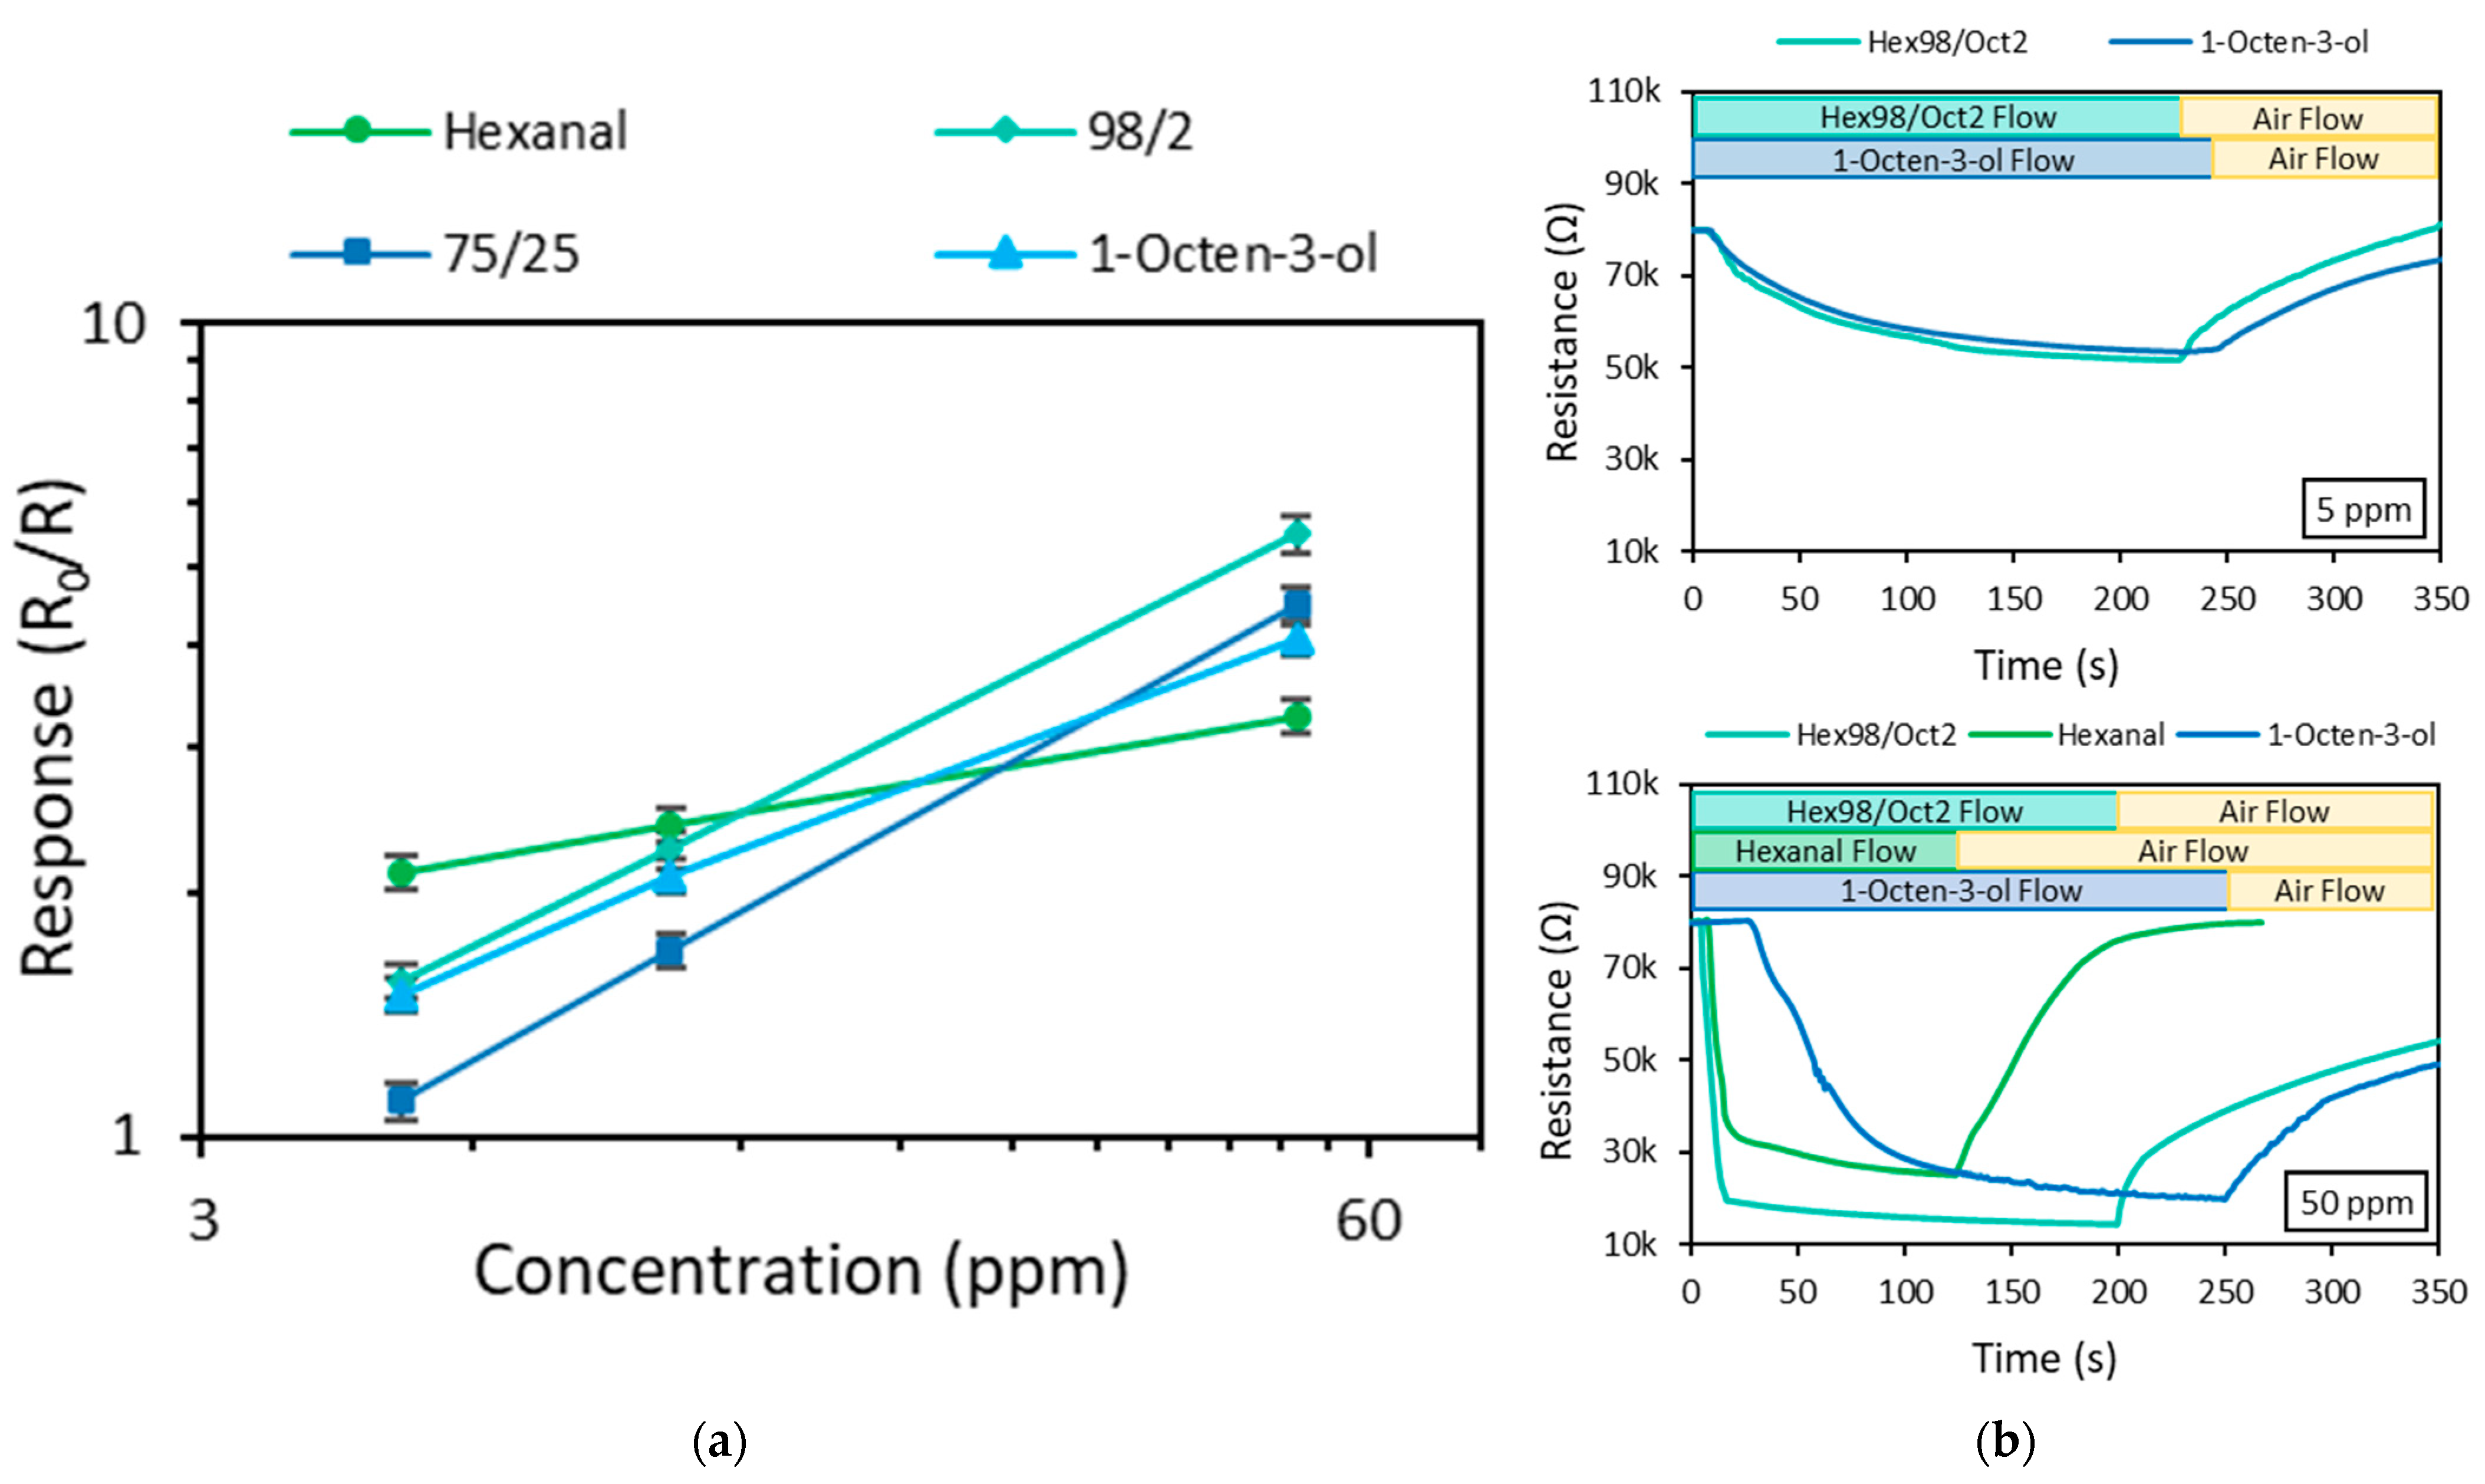
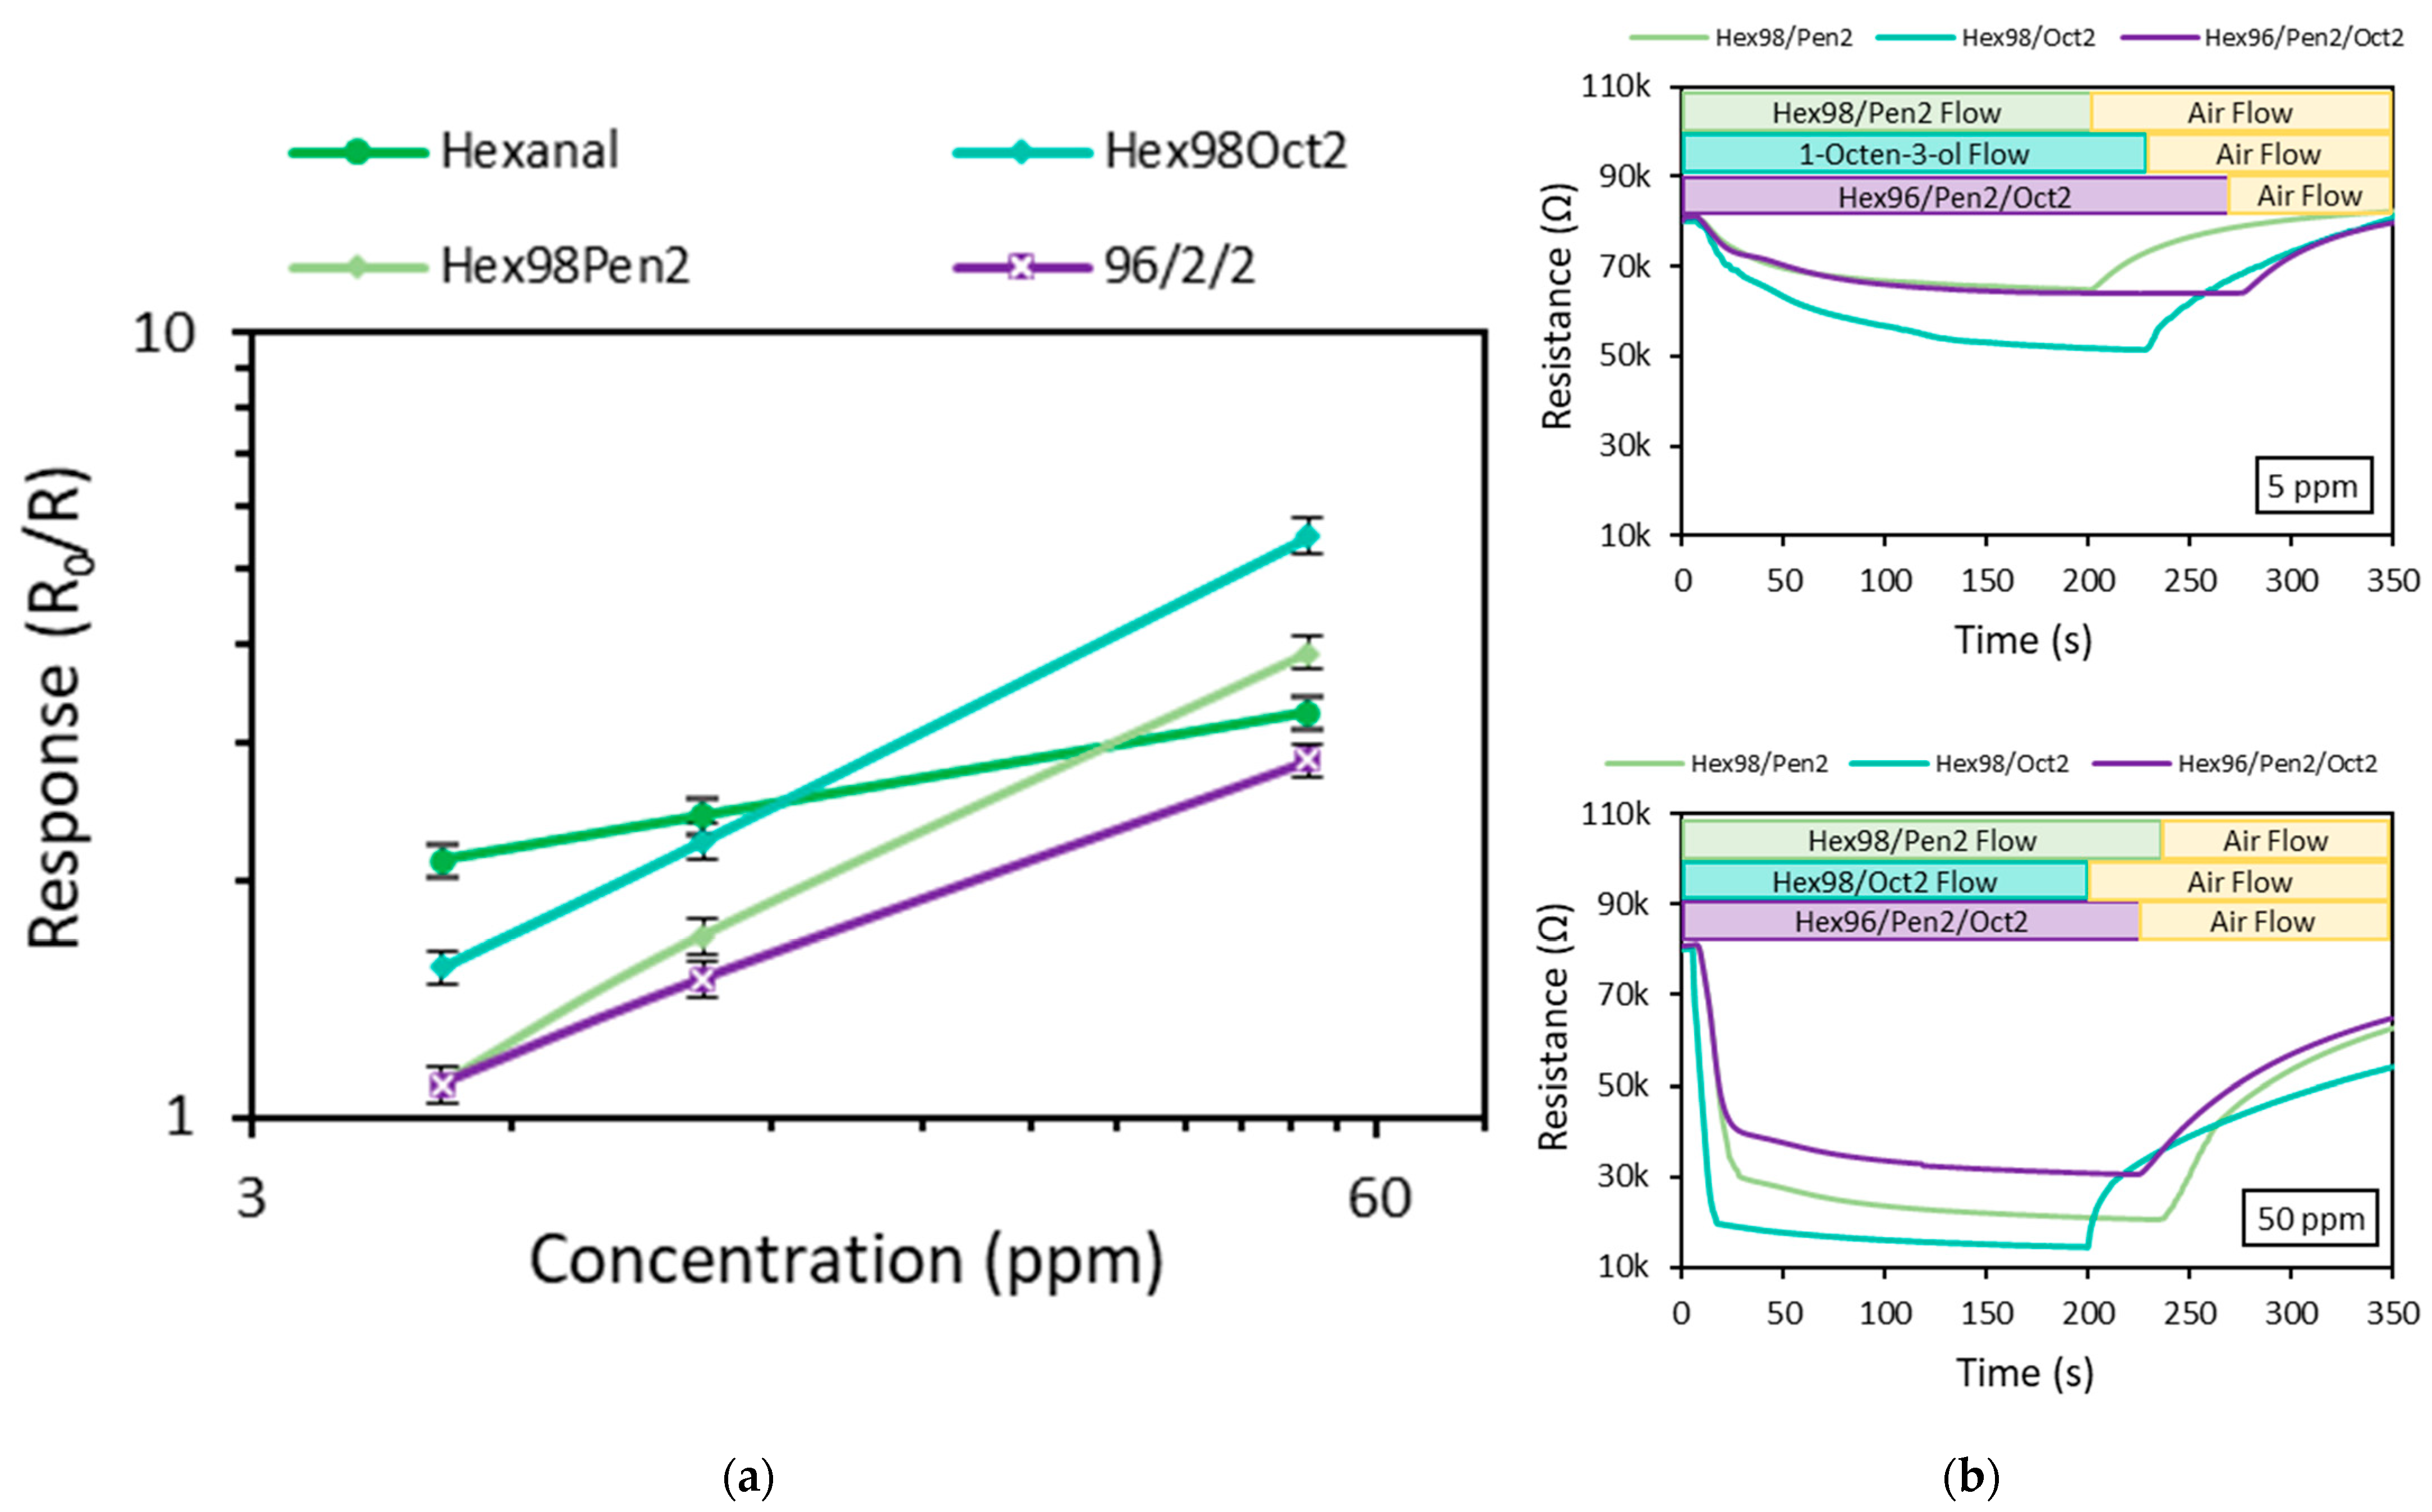
3.2. Sensing Experiments

The sensor response was defined as the ratio of the reference resistance measured in dry air (R0) and the resistance when the sensor was exposed to the vapor mixtures (R). In all sensing experiments the sensor temperature was maintained at 523 K because this working condition resulted in the highest response in a previous study on the ZnO sensitivity to hexanal [8]. The first set of experiments was carried out by measuring the response of pure compounds to different concentrations in dry air, as reported in Table 2 and shown in Figure 2. The lowest concentration was set at 5 ppm (in dry air) because this is considered the threshold value for the perception of hexanal by the human nose and therefore is used as an indication of the onset of meat degradation processes [23,24].
Comparing the data in Table 2, it is evident that ZnO is responsive to all three organic vapors, although in a different way. The sensor’s response to hexanal, as already reported in a previous work in which the ZnO response to different hexanal concentrations was studied [8], is the highest up to C = 10 ppm. However, the response to 1-octen-3-ol shows the faster rise and exceeds all others at C = 50 ppm (Figure 2a). In contrast, the ZnO sensitivity for 1-pentanol is the lowest at all concentrations. The high sensitivity of ZnO to hexanal at 5 ppm and the growth rate of the signal with the concentration (in Figure 2b) indicate that the sensor’s surface at C = 50 ppm of hexanal is close to the saturation of the adsorption centers so that the increase in the response is close to reaching an asymptotic value [22,23,24]. The response of the MOX sensor is the result of a complex interaction between the oxide surface and the adsorbed gas molecules so that the electrical properties of the ZnO layer are modified due to the effect of the redox reactions taking place with the adsorbed molecules and the oxygen ions on the layer surface [20,21,25,26,27,28,29,30]. The organic substances considered in our tests are chemically different with different reagent groups, which makes the comparison of the sensor response more difficult: hexanal is an alkyl aldehyde, 1-octen-3-ol is an unsaturated secondary alcohol, and 1-pentanol is an aliphatic alcohol. In these cases, the mechanism of reaction involves the preferential interaction of hexanal with the ZnO surface, which occurs through the carbonyl group of the aldehyde [5,7], while in the case of alcohols, the main interaction occurs through the hydroxyl group. Both aldehyde and alcohol compounds interact with oxygen ions on the sensor’s surface by oxidation reactions of the respective functional groups. Another important property that can affect the interaction at the interface between a vapor and the sensor’s surface is the volatility of the interacting substance.
Table 3 shows the boiling temperatures and vapor pressures of the three pure compounds for a comparison with the observed sensor responses. Hexanal, as expected, is the chemical compound that showed the lowest boiling temperature and highest vapor pressure; however, the sensor showed a higher response to 1-octen-3-ol than 1-pentanol despite the higher Tb and lower vapor pressure shown by unsaturated alcohol (Figure 2a).
For a more complete characterization of the ZnO sensor, the transient responses corresponding to the data shown in Table 2 are shown in Figure 2b for 2 concentrations: 5 and 50 ppm, respectively. The electrical resistance of the ZnO layer decreases with time when exposed to the organic vapors (n-type behavior) as a consequence of the redox reactions with the oxygen adsorbed on the sensor’s surface and the consequent electron release into the conduction band of the semiconductor layer [7,20,31]. The transient response to hexanal compared to other volatiles was the fastest in the detection (R decrease), reaching the lowest resistance in seconds, and in regeneration in dry air (R increase) at all concentrations (Figure 2b). For the two alcohols, 1-pentanol and 1-octen-3-ol, the transient response was significantly slower than the hexanal response for both the detection and regeneration (Figure 2b). According to these results, although the value of the R0/R ratio is the reference parameter used for evaluating the sensor’s sensitivity, the response as a function of time can be important for discriminating among competing species, such as in the examples shown. During the degradation process, however, the alcohol vapors are released simultaneously with hexanal so the sensor’s response cannot be considered a simple addition of the responses to pure compounds.
To study the sensor’s response in the presence of more than one volatile in the environment, a series of experiments were planned using binary and ternary mixtures. The results are shown in Table 4, where the composition of the vapor phases was determined as previously explained in the experimental paragraph.
According to [2,3,9,23,32], the beginning of food degradation is mainly correlated to the production of hexanal, which is predominant among the other organic compounds released and, indeed, is used as an indicator of the freshness of food and shelf-life determination. In our tests, this condition was simulated by binary mixtures with a concentration of 98/2 (w%). However, for a more complete characterization, the sensor was also tested with mixtures 75/25 (w%), with a higher concentration of the “competing” components (Table 4). Under the experimental conditions adopted, the vapors were generated by the liquid phase at T = 258 K and any reaction between the components was inhibited. The vapors were, then, conveyed directly to the sensor’s surface, the temperature of which was maintained at 523 K. The sensing mechanism is mainly based on the oxidation reactions that are dominant on the sensor’s surface, where, even in this case, due to the experimental conditions adopted, reactions between gas components are unlikely [33]. Indeed, the trend of the sensor’s response and the stability of its working temperature confirmed the absence of side reactions due to the formation of intermediate compounds (such as acetal and hemiacetal) in the gas phase [33]. However, with respect to pure substances, different signals were registered when the binary and ternary mixtures were considered. Therefore, due to the complexity of the phenomena involved, which cannot only be described by a superposition of the signals from pure components, studying the sensor’s response to binary and ternary mixtures was of fundamental importance. The sensor’s response to hexanal/1-pentanol vapors compared to pure components is shown in Figure 3b. According to the data shown in Table 4, the sensor’s behavior is strongly influenced by the presence of alcohol, as also evident in the comparison shown in Figure 3a. When exposed to the mixture 98/2, the sensor was more sensitive to 1-penthanol at low concentrations (5 and 10 ppm) and only when the compounds’ concentration increased to 50 ppm did hexanal detection become predominant (Figure 3a). In the presence of a higher concentration of 1-pentanol, mixture 75/25, the dominant effect of alcohol was confirmed as the detection of the hexanal was almost completely inhibited and the trend of the signal was similar to the case of the pure compound (Figure 3a). For a more complete characterization of the mixture 98/2, Figure 3b shows the sensor’s resistance as a function of time at C = 5 and 50 ppm. At low concentrations, the transient response follows the 1-pentanol trend while at 50 ppm, the resistance’s variation is similar to that of pure hexanal, in agreement with the results shown in Figure 3a. The sensor’s response to hexanal was only evident at the highest concentration.
The effect of 1-octen-3-ol in combination with hexanal is shown in Figure 4 together with the response to the pure components. The ZnO sensor was significantly influenced by the presence of secondary unsaturated alcohol in both mixtures, 98/2 and 75/25, as evident from the data shown in Table 4 plotted in Figure 4a. The sensor signal, R0/R, is affected by the alcohol even in the mixture 98/2 at all concentrations, from 5 to 50 ppm (Figure 4a). At the highest concentration, the response was even more intense than the sum of the two signals. The transient response shown in Figure 4b confirms that the sensor is mainly influenced by the 1-octen-3-ol traces at all concentrations, although after increasing the concentration of the mixture 98/2 to C = 50 ppm, the sensor’s resistance showed a decreasing rate regarding the detection, which is similar to the response to pure hexanal, which was much faster than in the presence of pure 1-octen-3-ol.
Finally, the ternary mixture with the composition 96/2/2 was used to study the ZnO sensor in an environment similar to the condition that develops when monitoring food degradation. Figure 5 shows the ZnO response to the different concentrations in dry air compared to the response recorded in the detection of hexanal vapors only.
Although the response increased with the concentration, the sensor was clearly negatively affected by the other two components of the mixture and low sensitivity was observed, especially at low concentrations. The comparison with the responses to the binary mixtures (Figure 5a) shows that the inhibition effect on the hexanal detection is mainly due to the presence of 1-pentanol vapors, which is the dominant component among the two alcohols.
A similar conclusion can be obtained from the analysis of the transient responses for the three mixtures tested, as shown in Figure 5b. At 5 ppm, the sensor’s resistance decreases over time, showing a trend that is very similar to the transient response of pure 1-pentanol (Figure 5b top). After increasing the concentration to 50 ppm, it was observed that the sensor’s resistance trend over time (Figure 5b bottom) is not sufficiently different from the transient responses to binary mixtures to be usable for the identification of the compounds in the mixture, although the presence of hexanal vapors is recognizable by the steep resistance decrease.

4. Conclusions

In the work presented, a resistive sensor based on ZnO oxide was prepared and tested for possible use in the monitoring of food degradation phenomena. The ZnO sensor showed a good sensitivity to low concentrations of hexanal, the target compound used in this work as an indicator of meat degradation. In a realistic scenario, the sensor must be able to discriminate among other organic volatiles released at the same time, so tests of the sensitivity were carried out by exposing the sensor to different mixture of vapors of the main competing organic compounds, 1-pentanol and 1-octen-3-ol. In this condition, the sensitivity to hexanal was reduced in the range of low concentrations (5–10 ppm) while at 50 ppm, the sensor’s response was comparable with the hexanal quantity. The experiments with binary and ternary mixtures showed, however, that the transient response of the ZnO sensor was significantly influenced by the presence of hexanal in the vapor mixture at all the concentrations tested. Although not so evident in terms of the intensity of the signal R0/R, the detection of hexanal in the vapor mixtures was characterized by a steep decrease with time of the sensor’s resistance even at low concentrations, which was not shown by the other organic components.
The ZnO sensor belongs to the family of conductometric sensors and for this reason, it is affected by some common limitations, such as reduced selectivity, electrical drift, and response reproducibility. The results obtained in this study indicate the possible use of ZnO for the monitoring of food degradation; however, further characterization of the material behavior is needed, and durability and repeatability studies, to confirm the observed potential regarding its use as a sensor.

Author Contributions

Conceptualization, L.B., A.D. and P.F.; methodology, A.F., A.G. and L.B.; formal analysis, L.B. and A.F.; investigation, A.F. and A.G.; data curation, A.F. and A.G.; writing—original draft preparation, A.F. and A.G.; writing—review and editing, L.B. and P.F.; supervision L.B., A.D. and P.F. All authors have read and agreed to the published version of the manuscript.

Funding

This research was funded by Regione Calabria, POR Calabria FESR/FSE 2014-2020: Asse 12 Azione 10.5.6 “Mobilità internazionale di dottorandi”.

Conflicts of Interest

The authors declare no conflict of interest.

References

  1. Gnisci, A.; Fotia, A.; Bonaccorsi, L.; Donato, A. Effect of Working Atmospheres on the Detection of Diacetyl by Resistive SnO2 Sensor. Appl. Sci. 2022, 12, 367. [Google Scholar] [CrossRef]
  2. Shahidi, F.; Pegg, R.B. Hexanal As an Indicator of Meat Flavor Deterioration. J. Food Lipids 1994, 1, 177–186. [Google Scholar] [CrossRef]
  3. Azarbad, M.H.; Jeleń, H. Determination of Hexanal—an Indicator of Lipid Oxidation by Static Headspace Gas Chromatography (SHS-GC) in Fat-Rich Food Matrices. Food Anal. Methods 2015, 8, 1727–1733. [Google Scholar] [CrossRef]
  4. Schindler, S.; Krings, U.; Berger, R.G.; Orlien, V. Aroma Development in High Pressure Treated Beef and Chicken Meat Compared to Raw and Heat Treated. Meat Sci. 2010, 86, 317–323. [Google Scholar] [CrossRef]
  5. Abd Wahab, N.Z.; Nainggolan, I.; Nasution, T.I.; Derman, M.N.; Shantini, D. Highly Response and Sensitivity Chitosan-Polyvinyl Alcohol Based Hexanal Sensors. MATEC Web. Conf. 2016, 78, 01072. [Google Scholar] [CrossRef] [Green Version]
  6. Jayasena, D.D.; Ahn, D.U.; Nam, K.C.; Jo, C. Flavour Chemistry of Chicken Meat: A Review. Asian-Australas. J. Anim. Sci. 2013, 26, 732–742. [Google Scholar] [CrossRef]
  7. Malara, A.; Bonaccorsi, L.; Donato, A.; Frontera, P.; Piscopo, A.; Poiana, M.; Leonardi, S.G.; Neri, G. Sensing Properties of Indium, Tin and Zinc Oxides for Hexanal Detection. In Sensors; Andò, B., Baldini, F., di Natale, C., Ferrari, V., Marletta, V., Marrazza, G., Militello, V., Miolo, G., Rossi, M., Scalise, L., et al., Eds.; Lecture Notes in Electrical Engineering; Springer International Publishing: Cham, Switzerland, 2019; Volume 539, pp. 39–44. ISBN 978-3-030-04323-0. [Google Scholar]
  8. Malara, A.; Bonaccorsi, L.; Donato, A.; Frontera, P.; Neri, G. Doped Zinc Oxide Sensors for Hexanal Detection; Springer International Publishing: Cham, Switzerland, 2020; Volume 629, ISBN 9783030375577. [Google Scholar]
  9. Ponzoni, A.; Comini, E.; Concina, I.; Ferroni, M.; Falasconi, M.; Gobbi, E.; Sberveglieri, V.; Sberveglieri, G. Nanostructured Metal Oxide Gas Sensors, a Survey of Applications Carried out at SENSOR Lab, Brescia (Italy) in the Security and Food Quality Fields. Sensors 2012, 12, 17023–17045. [Google Scholar] [CrossRef]
  10. Li, F.; Gao, X.; Wang, R.; Zhang, T.; Lu, G.; Barsan, N. Design of Core–Shell Heterostructure Nanofibers with Different Work Function and Their Sensing Properties to Trimethylamine. ACS Appl. Mater. Interfaces 2016, 8, 19799–19806. [Google Scholar] [CrossRef]
  11. Faggio, G.; Gnisci, A.; Messina, G.D.S.; Lisi, N.; Capasso, A.; Lee, G.-H.; Armano, A.; Sciortino, A.; Messina, F.; Cannas, M.; et al. Carbon Dots Dispersed on Graphene/SiO2/Si: A Morphological Study. Phys. Status Solidi 2019, 216, 1800559. [Google Scholar] [CrossRef]
  12. Xu, Y.; Zheng, L.; Yang, C.; Liu, X.; Zhang, J. Highly Sensitive and Selective Electronic Sensor Based on Co Catalyzed SnO2 Nanospheres for Acetone Detection. Sens. Actuators B Chem. 2020, 304, 127237. [Google Scholar] [CrossRef]
  13. Wasilewski, T.; Gębicki, J.; Kamysz, W. Bioelectronic Nose: Current Status and Perspectives. Biosens. Bioelectron. 2017, 87, 480–494. [Google Scholar] [CrossRef] [PubMed]
  14. Arshak, K.; Moore, E.; Lyons, G.M.; Harris, J.; Clifford, S. A Review of Gas Sensors Employed in Electronic Nose Applications. Sens. Rev. 2004, 24, 181–198. [Google Scholar] [CrossRef] [Green Version]
  15. Song, L.; Yang, L.; Wang, Z.; Liu, D.; Luo, L.; Zhu, X.; Xi, Y.; Yang, Z.; Han, N.; Wang, F.; et al. One-Step Electrospun SnO2/MOx Heterostructured Nanomaterials for Highly Selective Gas Sensor Array Integration. Sens. Actuators B Chem. 2019, 283, 793–801. [Google Scholar] [CrossRef]
  16. Soncin, S.; Chiesa, L.M.; Cantoni, C.; Biondi, P.A. Preliminary Study of the Volatile Fraction in the Raw Meat of Pork, Duck and Goose. J. Food Compos. Anal. 2007, 20, 436–439. [Google Scholar] [CrossRef]
  17. Covarrubias-Cervantes, M.; Mokbel, I.; Champion, D.; Jose, J.; Voilley, A. Saturated Vapour Pressure of Aroma Compounds at Various Temperatures. Food Chem. 2004, 85, 221–229. [Google Scholar] [CrossRef]
  18. Palczewska-Tulinska, M.; Oracz, P. Vapor Pressures of Hexanal, 2-Methylcyclohexanone, and 2-Cyclohexen-1-One. J. Chem. Eng. Data 2006, 51, 639–641. [Google Scholar] [CrossRef]
  19. Available online: Https://www.Cheric.Org/ (accessed on 18 November 2021).
  20. Dey, A. Semiconductor Metal Oxide Gas Sensors: A Review. Mater. Sci. Eng. B Solid-State Mater. Adv. Technol. 2018, 229, 206–217. [Google Scholar] [CrossRef]
  21. Oprea, A.; Degler, D.; Barsan, N.; Hemeryck, A.; Rebholz, J. Basics of Semiconducting Metal Oxide–Based Gas Sensors; Elsevier Inc.: Amsterdam, The Netherlands, 2018; ISBN 9780128112243. [Google Scholar]
  22. Wang, C.; Yin, L.; Zhang, L.; Xiang, D.; Gao, R. Metal Oxide Gas Sensors: Sensitivity and Influencing Factors. Sensors 2010, 10, 2088–2106. [Google Scholar] [CrossRef] [Green Version]
  23. Brewer, M.S.; Vega, J.D. Detectable Odor Thresholds of Selected Lipid Oxidation Compounds in a Meat Model System. J. Food Sci. 1995, 60, 592–595. [Google Scholar] [CrossRef]
  24. Ajuyah, A.O.; Fenton, T.W.; Hardin, R.T.; Sim, J.S. Measuring Lipid Oxidation Volatiles in Meats. J. Food Sci. 1993, 58, 270–273. [Google Scholar] [CrossRef]
  25. Schmidt, O.; Kiesel, P.; van de Walle, C.G.; Johnson, N.M.; Nause, J.; Dohler, G.H. Effects of an Electrically Conducting Layer at the Zinc Oxide Surface. Jpn. J. Appl. Phys. 2005, 44, 7271–7274. [Google Scholar] [CrossRef]
  26. Schmidt, O.; Geis, A.; Kiesel, P.; van de Walle, C.G.; Johnson, N.M.; Bakin, A.; Waag, A.; Döhler, G.H. Analysis of a Conducting Channel at the Native Zinc Oxide Surface. Superlattices Microstruct. 2006, 39, 8–16. [Google Scholar] [CrossRef]
  27. Janotti, A.; van de Walle, C.G. Fundamentals of Zinc Oxide as a Semiconductor. Rep. Prog. Phys. 2009, 72, 126501. [Google Scholar] [CrossRef] [Green Version]
  28. Korotcenkov, G. Metal Oxides for Solid-State Gas Sensors: What Determines Our Choice? Mater. Sci. Eng. B Solid-State Mater. Adv. Technol. 2007, 139, 1–23. [Google Scholar] [CrossRef]
  29. Barsan, N.; Weimar, U. Understanding the Fundamental Principles of Metal Oxide Based Gas Sensors; the Example of CO Sensing with SnO2 Sensors in the Presence of Humidity. J. Phys. Condens. Matter 2003, 15, R813–R839. [Google Scholar] [CrossRef]
  30. Barsan, N.; Weimar, U. Conduction Model of Metal Oxide Gas Sensors. J. Electroceram. 2001, 7, 143–167. [Google Scholar] [CrossRef]
  31. Hjiri, M.; el Mir, L.; Leonardi, S.G.; Pistone, A.; Mavilia, L.; Neri, G. Al-Doped ZnO for Highly Sensitive CO Gas Sensors. Sens. Actuators B Chem. 2014, 196, 413–420. [Google Scholar] [CrossRef]
  32. Galstyan, V.; Bhandari, M.; Sberveglieri, V.; Sberveglieri, G.; Comini, E. Metal Oxide Nanostructures in Food Applications: Quality Control and Packaging. Chemosensors 2018, 6, 16. [Google Scholar] [CrossRef] [Green Version]
  33. Agirre, I.; Barrio, V.L.; Güemez, M.B.; Cambra, J.F.; Arias, P.L. Acetals as possible diesel additives. Econ. Eff. Biofuel Prod. 2011, 15, 299–316. [Google Scholar]
Figure 1. Electron microscopy (SEM) image of the ZnO powder as prepared at 298 K and after the annealing treatment at 673 K (a), X-ray patterns of ZnO from 298 K to 673 K and (inset) the temperature shift at 2θ = 31.7° (b).
Applsci 12 02261 g001
Figure 2. (a) Comparison of the sensor’s response to pure compounds according to data from Table 2 and (b) the transient response of the ZnO sensor to pure volatiles at 5 (top) and 50 ppm (bottom).
Applsci 12 02261 g002
Figure 3. (a) Sensor’s response to hexanal/1-pentanol mixtures (data from Table 4) and (b) transient response to mixture 98/2 (hexanal/1-pentanol) at 5 (top) and 50 ppm (bottom).
Applsci 12 02261 g003
Figure 4. (a) Sensor’s response to hexanal/1-octen-3-ol mixtures (data from Table 4) and (b) transient response to mixture 98/2 (hexanal/1-octen-3-ol mixtures) at 50 (top) and 50 ppm (bottom).
Applsci 12 02261 g004
Figure 5. (a) Sensor’s response to the ternary mixture 96/2/2 (data from Table 4) and (b) the transient response of the ZnO sensor to the ternary mixture 96/2/2 for 5 (top) and 50 ppm (bottom).
Applsci 12 02261 g005
Table 1. The composition of liquid and vapor mixtures used in the sensing tests.
MixturesComposition (w%)
LiquidVaporLiquidVapor
Hexanal/1-pentanol70/3075/2595/598/2
Hexanal/1-octen-3-ol70/3075/2595/598/2
Hexanal /1-pentanol/1-octen-3-ol--90/5/596/2/2
Table 2. ZnO sensor’s response to pure compounds (T = 523 K).
Chemical CompoundResponse (R0/R)
C = 5 ppmC = 10 ppmC = 50 ppm
Hexanal2.122.423.28
1-pentanol1.301.682.60
1-octen-3-ol1.502.104.10
Table 3. Boiling temperatures and vapor pressures of pure compounds.
Chemical CompoundTb
[K]
P° (293 K)
[kPa]
P° (258 K)
[kPa]
Hexanal40221.1 × 10−1
1-pentanol4115 × 10−13.7 × 10⁻²
1-octen-3-ol4473 × 10−23.1 × 10⁻²
Table 4. Sensor’s response to binary and ternary mixtures.
Vapor MixtureResponse (R0/R)
Composition (w%)C = 5 ppmC = 10 ppmC = 50 ppm
Hexanal/1-pentanol98/21.101.693.90
75/251.201.532.74
Hexanal/1-octen-3-ol98/21.552.255.50
75/251.111.714.50
Hexanal /1-pentanol/1-octen-3-ol96/2/21.101.502.85
Publisher’s Note: MDPI stays neutral with regard to jurisdictional claims in published maps and institutional affiliations.

