Article

iEnhancer-Deep: A Computational Predictor for Enhancer Sites and Their Strength Using Deep Learning

1
Department of Electronics and Information Engineering, Jeonbuk National University, Jeonju 54896, Korea
2
Department of Computer Science, Abdul Wali Khan University, Mardan 23200, Pakistan
3
School of International Engineering and Science, Jeonbuk National University, Jeonju 54896, Korea
4
Advanced Electronics and Information Research Center, Jeonbuk National University, Jeonju 54896, Korea
*
Authors to whom correspondence should be addressed.
Appl. Sci. 2022, 12(4), 2120; https://doi.org/10.3390/app12042120
Submission received: 17 November 2021 / Revised: 10 February 2022 / Accepted: 15 February 2022 / Published: 17 February 2022
(This article belongs to the Special Issue Deep Learning in Bioinformatics and Biomedicine)

Abstract

:
Enhancers are short motifs that contain high position variability and free scattering. Identifying these non-coding DNA fragments and their strength is vital because they play an important role in the control of gene regulation. Enhancer identification is more complicated than other genetic factors due to free scattering and their very high amount of locational variation. To classify this biological difficulty, several computational tools in bioinformatics have been created over the last few years as current learning models are still lacking. To overcome these limitations, we introduce iEnhancer-Deep, a deep learning-based framework that uses One-Hot Encoding and a convolutional neural network for model construction, primarily for the identification of enhancers and secondarily for the classification of their strength. Parallels between the iEnhancer-Deep and existing state-of-the-art methodologies were drawn to evaluate the performance of the proposed model. Furthermore, a cross-species test was carried out to assess the generalizability of the proposed model. In general, the results show that the proposed model produced comparable results with the state-of-the-art models.

1. Introduction

In the field of transcriptomics, enhancers [1] are unique non-coding DNA fragments that target the control of gene expression for the generation of proteins (activators) and RNA [2]. The proteins are conventionally referred to as transcription factors, which are proteins involved in transcribing DNA into RNA, and they can be located and mapped up to 1 Mbp from the gene or sometimes even to divergent chromosomes [3]. Due to their vigorous nature, the occurrence of enhancers in perceptible genomic sections makes them difficult to identify. Despite some of these challenges in pinning down enhancers at a genomic scale, some useful methods have been initiated over the last few years. The presence of enhancers has been revealed in different species of mammals and vertebrates [4]. For instance, inflammatory bowel disease (IBD)-upregulated promoters and enhancers are highly enriched with IBD-associated SNPs and are bound by the same transcription factors [5]. Much remains to be completed to identify enhancers and connect them to human biology and disease. The human genome consists of a large number of enhancers. Furthermore, enhancers are found in both prokaryotes and eukaryotes. A promoter, a slightly different fragment of DNA, is a sequence where gene transcription initiates [3]. Unlike promoters, enhancers are typically found 20 kb upstream/downstream of genes, or even of chromosomes that may not be carrying genes. Due to the nature of this location disparity, it is very challenging to identify new enhancers. Certain contemporary studies of alterations suggest that enhancers are a large class of functional elements that may have many subgroups, whose targets experience different types of biological activities and regulatory effects [6]. Moreover, genetic variety in enhancers has been demonstrated to be associated with human diseases such as different types of cancer and inflammatory bowel disease [5]. Some computational work has recently been carried out to identify regulatory enhancers because experimental methods are time-consuming and costly. In contrast to the past, computational researchers are now well-appointed with high-profile computing assets and sophisticated strategies to master the outgrowth of biological data. With the improvement of machine learning, numerous computational prediction models that can rapidly recognize enhancers in genes have been developed. These approaches include CSI-ANN [7], RFECS [8], EnhancerFinder [9], ChromeGenSVM [10], GKM-SVM [11], DEEP [12], EnhancerDBN [13], and BiRen [14]. However, these methods merely classify identified enhancers. Meanwhile, enhancers are wide-ranging and comprise many diverse subgroups such as strong/weak enhancers, inactive enhancers, and pent-up enhancers. iEnhancer-2L [3] is the primary predictive model that solely relies on sequence data to assist predictors in differentiating enhancers and their quality. Recently, two efficient predictors, iEnhancer-2L [3] and iEnhancer-EL [15], have been proposed; these do not only identify enhancers but also identify their strength and classify them as strong and weak enhancers. In 2016, iEnhancer-2L by Liu et al. [3] presented an operational methodology using a support vector machine (SVM) learning algorithm. Pseudo k-tuple nucleotide composition (PseKNC) was used for the sequence-encoding scheme in iEnhancer-2L [3]. In 2018, iEnhancer-EL [15] was presented as an improved description of iEnhancer-2L [3]. This model is complex as it requires an ensemble of six classifiers for the first stage and ten classifiers for the second stage. The crucial classifiers were assembled from many SVM-based elementary classifiers [15], which are composed of three diverse feature categories: the PseKNC, k-mers, and subsequence profiles. Although the aforementioned machine learning-based methods can deliver good results, deep learning models perform better without the need for manual feature extraction [16,17]. Moreover, the machine learning models still require hand-designed input features from specific sequences; however, convolutional neural networks (CNNs) can readily learn substantial features from numerous stages. Even though iEnhancer-EL [15] is currently classified as a leading method for classifying enhancers and their strength, it is likely to inspire far better models that will utilize novel learning algorithms and encoding strategies. In this study, we propose a two-stage deep learning prediction framework for the classification of enhancers in the first stage and their strength in the second stage; this framework is called iEnhancer-Deep. For sequence encoding, this model offers a combination of One-Hot Encoding and the use of CNNs. During the test time, if the input sequence from the proposed model was classified as an enhancer in the primary stage, it was then sent off to the latter stage to determine its quality or strength. If not, the proposed sequence was termed a non-enhancer sequence. We followed Chou’s 5-step rules that had been widely used in recent publications [18,19,20,21,22,23,24,25,26]. The regulations state: (i) implement a considerable benchmark dataset to prepare and then test the indicator, (ii) emphasize extraction or determination, (iii) employ a robust classification computation, (iv) perform cross-validation, and finally, (v) assemble a web server.

2. Materials and Methods

The benchmark dataset, the suggested model, and the performance evaluation are described in this section.

2.1. Benchmark Dataset

The dataset utilized in our study was collected from the study by Liu et al. [3]. This dataset was also used in the progression of iEnhancer-2L [3], iEnhancer-EL [15], and EnhancerPred [27]. The enhancers in this dataset were extracted from nine diverse cell lines where they were withdrawn as DNA groupings out of short 200 bp clips of the same length. The nine different cell lines were HUVEC, K562, HepG2, H1ES, HSMM, NHLF, GM12878, NHEK, and HMEC. The CD-HIT software program [28] was utilized to prohibit pairwise sequences with more than 20% of characteristics in common. The benchmark dataset encompassed 1484 enhancers, of which 742 were strong enhancers, while the remaining 742 were weak enhancers. Furthermore, 1484 were non-enhancer specimens. Hence, the benchmark dataset can be defined as follows:
E = E + E  
E + = E s t r o n g + E w e a k +
where E represents the overall number of positive and negative sequences. Union in the set theory is shown by the symbol . The E+ subset contained 1484 enhancer sequences, whereas E contained 1484 non-enhancer sequences. The first 1484 enhancers were divided into two portions: E+strong comprised 742 strong enhancers, and Eweak comprised 742 weak enhancers. E+strong (strong enhancers) and E (non-enhancers) were identified in all nine tissues emphasized above; nevertheless, Eweak (weak enhancers) substantially vary within diverse tissues. To account for this, weak enhancers were based on human embryonic stem cells. Similar to other studies, we used the training set to build two different models for two different problems: identification of enhancers in stage 1 and classification of enhancers in stage 2. We started by randomly dividing the training set into five folds, utilizing stratified sampling for both layers. Each fold was utilized as the validation set, whereas the remaining four folds were employed as the training set for the preparation of the CNN model.

2.2. Methods

In this study, we aimed to enhance the classification accuracy compared with the previous method. Therefore, we proposed the addition of Gaussian noise to make the model more robust, more generalizable, and more accurate, especially when the available training data are limited and the models are prone to overfitting. Gaussian noise addition helps to avoid overfitting and produces a more generalizable model. This study proposes a combination of deep learning with One-Hot Encoding for classifying the enhancers’ quality and strength. The strategy suggested in this study is composed of two steps. The first step is the feature representation phase, in which One-Hot Encoding is used to encode each encoding sequence to feed our CNN model for classification. The secondary step involves the prediction of enhancers through the use of a CNN-based model by supplying the already identified enhancers from the first step. A detailed illustration of the proposed model is shown in Figure 1. Each enhancer is 200 nt long and is formed by four nucleic acids, including adenine (A), guanine (G), cytosine (C), and thymine (T). The first two of the aforementioned nucleic acids (adenine and guanine) are purines, while the latter two (cytosine and thymine) are pyrimidines. A new matrix from a set of four binary numbers representing the four types of nucleic acids was assembled for One-Hot Encoding, where A was encoded by [1 0 0 0], C was encoded by [0 1 0 0], G was encoded by [0 0 1 0], and T was encoded as [0 0 0 1]. The input for the network was a 200 × 4 encoding matrix sequence, which had a length of 200. We deployed the use of Gaussian noise in our input layer. Additional input signals can be considered in the model design, such as H3K27ac signals; however, for simplicity, the design relied only on One-Hot Encoding. We used Gaussian noise with a standard deviation of 0.2. The network consisted of three 1-D CNN blocks comprising Conv1D, a regularizer layer, group normalization, max pooling, and a dropout layer. The regularization layer L2, also known as weight decay, forced the weights to be very close to zero, but not entirely zero. This helped to polish the model implementation for new data. The regularization layer was also useful for the slight tailoring of the algorithm for better functioning. Group normalization functioned as a layer that normalized the features within each group. A max pooling layer was used because of its ability to reduce overfitting by putting forward an epitomized form of the representation and trimming the computational cost by depleting some parameters. A flattened layer was used between the convolutional layer and the fully connected layer. A flattened layer was used to modify the feature matrix into a vector that could later be used in the fully connected neural network classifier via a rectified linear unit (ReLU), which was used for all except the last layer that would employ the sigmoid activation function. A similar architecture was used to classify strong and weak enhancers. The models were trained within 200 epochs, the use of early stopping with a patience level of 10, binary cross entropy, and an Adagrad optimizer with a learning rate of 0.0001. The work in [26] required the training of a language model for encoding the input sequence; however, the encoding of the proposed model was simpler because it did not require the use of a language model as it relied solely on One-Hot Encoding. Table 1 lists the detailed configurations of the proposed model for both stages.
To demonstrate our model’s performance, we used another highly regarded encoding technique denoted ‘nucleotide chemical properties (NCP) and nucleotide density (ND)’. This encoding technique accounts for the fact that the four nucleic acids, adenine (A), cytosine (C), guanine (G), and thymine (T), have diverse chemical properties [29]. In addition, the technique allows adenine and cytosine to be sorted as amino groups, while guanine and thymine are classified as keto groups based on their chemical functionality. Cytosine and guanine form strong hydrogen bonds, whereas adenine and thymine can form weak hydrogen bonds. Adenine and guanine are purines, whereas cytosine and thymine are pyrimidines. Consequently, nucleic acids can be divided into three different classes, as shown in Table 2.
To define these properties, we used the trinity of the ring structures, hydrogen bond strength, and functional group classifications. In addition, the values of 0 and 1 were assigned to the trinity for classification purposes. For the first element ring, a structure with a value of 1 indicates a purine, and a value of 0 indicates a pyrimidine. For the second element of the trinity, the values 0 and 1 indicate the strength of the hydrogen bonds; 1 classifies a strong hydrogen bond, and 0 classifies a weak hydrogen bond. The third and last element of our trinity indicates whether the nucleotide is an amino or keto, where 1 signifies an amino, and 0 characterizes a keto. To incorporate these properties, three coordinates (x, y, z) were utilized to illustrate the chemical properties of the four nucleotides. If the ring structure, hydrogen bond, and chemical functionality are represented by the coordinates x, y, and z, then a particular nucleotide can be encoded by (xi, yi, zi) [30]:
x i = 1   i f   s i A ,   G 0   i f   s i C ,   T
y i = 1   i f   s i A ,   T 0   i f   s i C ,   G
z i = 1   i f   s i A ,   C 0   i f   s i G ,   T
where nucleotide density (ND) provides information about the nucleotide’s frequency as well as the nucleotide’s location. The nucleotide density di of a specific nucleotide nj at a certain position in a given sequence i can be defined as follows:
d i = 1 N i j = 1 i f n j ,   f n j = 1   i f   n j = q   0   o t h e r w i s e
where di indicates the nucleotide density of each position i in a given DNA sequence. |Ni| characterizes the length of the subsequence from the very first position to position i of the sequence. The nj states the base in position j of a given DNA sequence and q A ,   C ,   G ,   T . The combination of the nucleotide density and nucleotide chemical properties yields a matrix with 41 rows and 4 columns, which are used to epitomize each DNA sequence. The first three elements represent the nucleotide chemical properties, and the last element represents the nucleotide density for each column. A grid search algorithm was used to search for the best possible parameters.

2.3. Gaussian Noise

Small datasets can cause problems while training expansive neural networks; to begin with, the model may effectively memorize the training dataset rather than learning a common mapping from inputs to outputs, and the model may learn the particular input cases and their related outputs and overfits. This will generate a certain model that will provide good performance on the training dataset but comparatively poor performance on a test dataset. The downside of using small datasets is that they provide less opportunity to learn the structure of the input and its interaction with the output. The larger the training dataset, the better the description of the problem that the model needs to comprehend. A smaller dataset implies that there is a relatively smooth input space, causing a very complex mapping function that may be difficult for the model to learn. The introduction of noise in the course of the training of a neural network model has a kind of regularization effect, which improves the strength of the model [31]. Moreover, the impact of random noise has a similar effect on the loss function. The incorporation of random noise implies that there is very little possibility that our model will memorize the training data because they are constantly changing. This results in small network weights and a network that is more vigorous, along with a lower generalization error. Gaussian noise adds random small values to our input with a specific shape and gives us an output of the same shape with a slight change in the noise added to the values. The addition of random noise makes the data different each time it is introduced to the model, since the noise constantly changes the network weights and strengthens the network [31].

2.4. Evaluation Parameters

By inspecting other similar studies in the recent past [16,18,19,20,22,23], we concluded that the following parameters should be used to evaluate the standard of the proposed predictor model. The following four metrics were chosen: (i) sensitivity (SP), (ii) specificity (SN), (iii) accuracy (ACC), and (iv) the Mathews correlation coefficient (MCC), which are described below:
Sensitivity = TP TP + FN
Specificity   = TN TN + FP
Accuracy = TP + TN TP + FN + TN + FP
MCC = TP × TN FP × FN TP + FP TP + FN TN + FP TN + FN
TN, TP, FN, and FP represent true negative, true positive, false negative, and false positive values, respectively. The connotations of SN, SP, ACC, and MCC are more natural and simpler to apprehend, and they have been discussed and utilized in a number of studies in numerous biological fields in the recent past. Metric specificity can also be represented as the true negative rate (TNR). It calculates the ratio of negative samples to the model. Authentic predictions of the test data are called accuracy. The Matthews correlation coefficient (MCC) shows the model’s output as a binary classifier [32]. MCC values exist within a range of [−1, 1], where 1 signifies a 100% true prediction, −1 signifies that the prediction does not entirely correlate with the observation, and 0 implies any random predicted value.

3. Results and Discussion

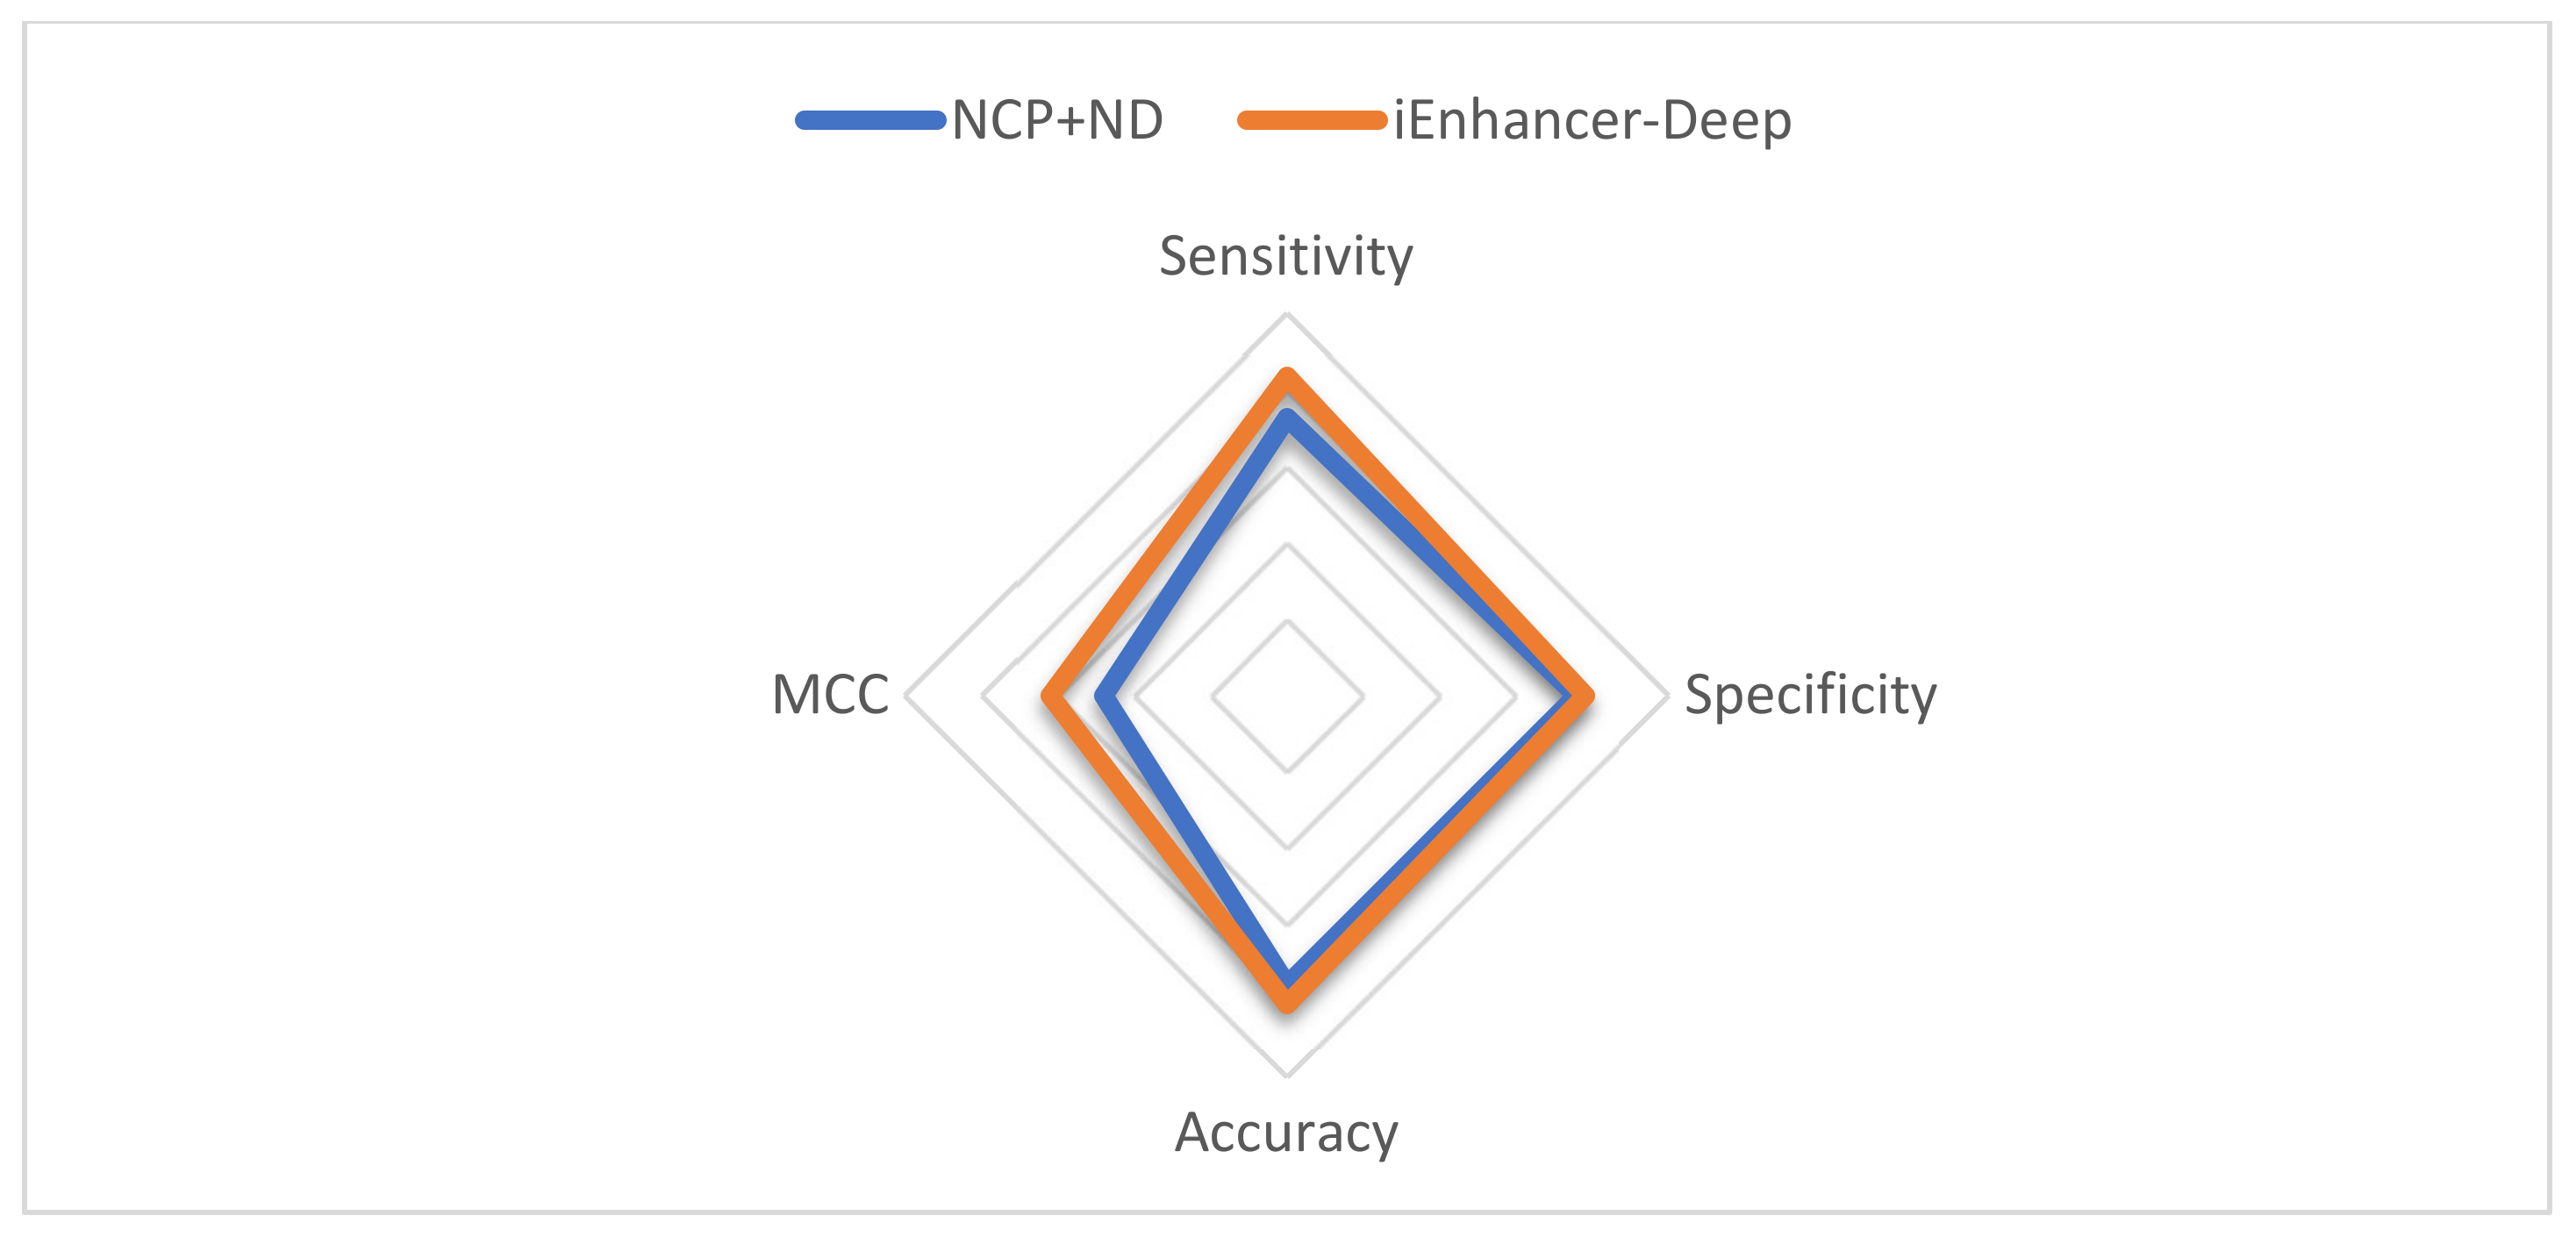
3.1. Effect of Different Encoding Techniques

The results show that One-Hot Encoding outperforms the NCP+ND encoding technique. Table 3 shows the comparison between nucleotide chemical properties and the proposed model using different encoding schemes for both stages. Figure 2 demonstrates a comparison in the first stage, and Figure 3 demonstrates a comparison in the second stage.

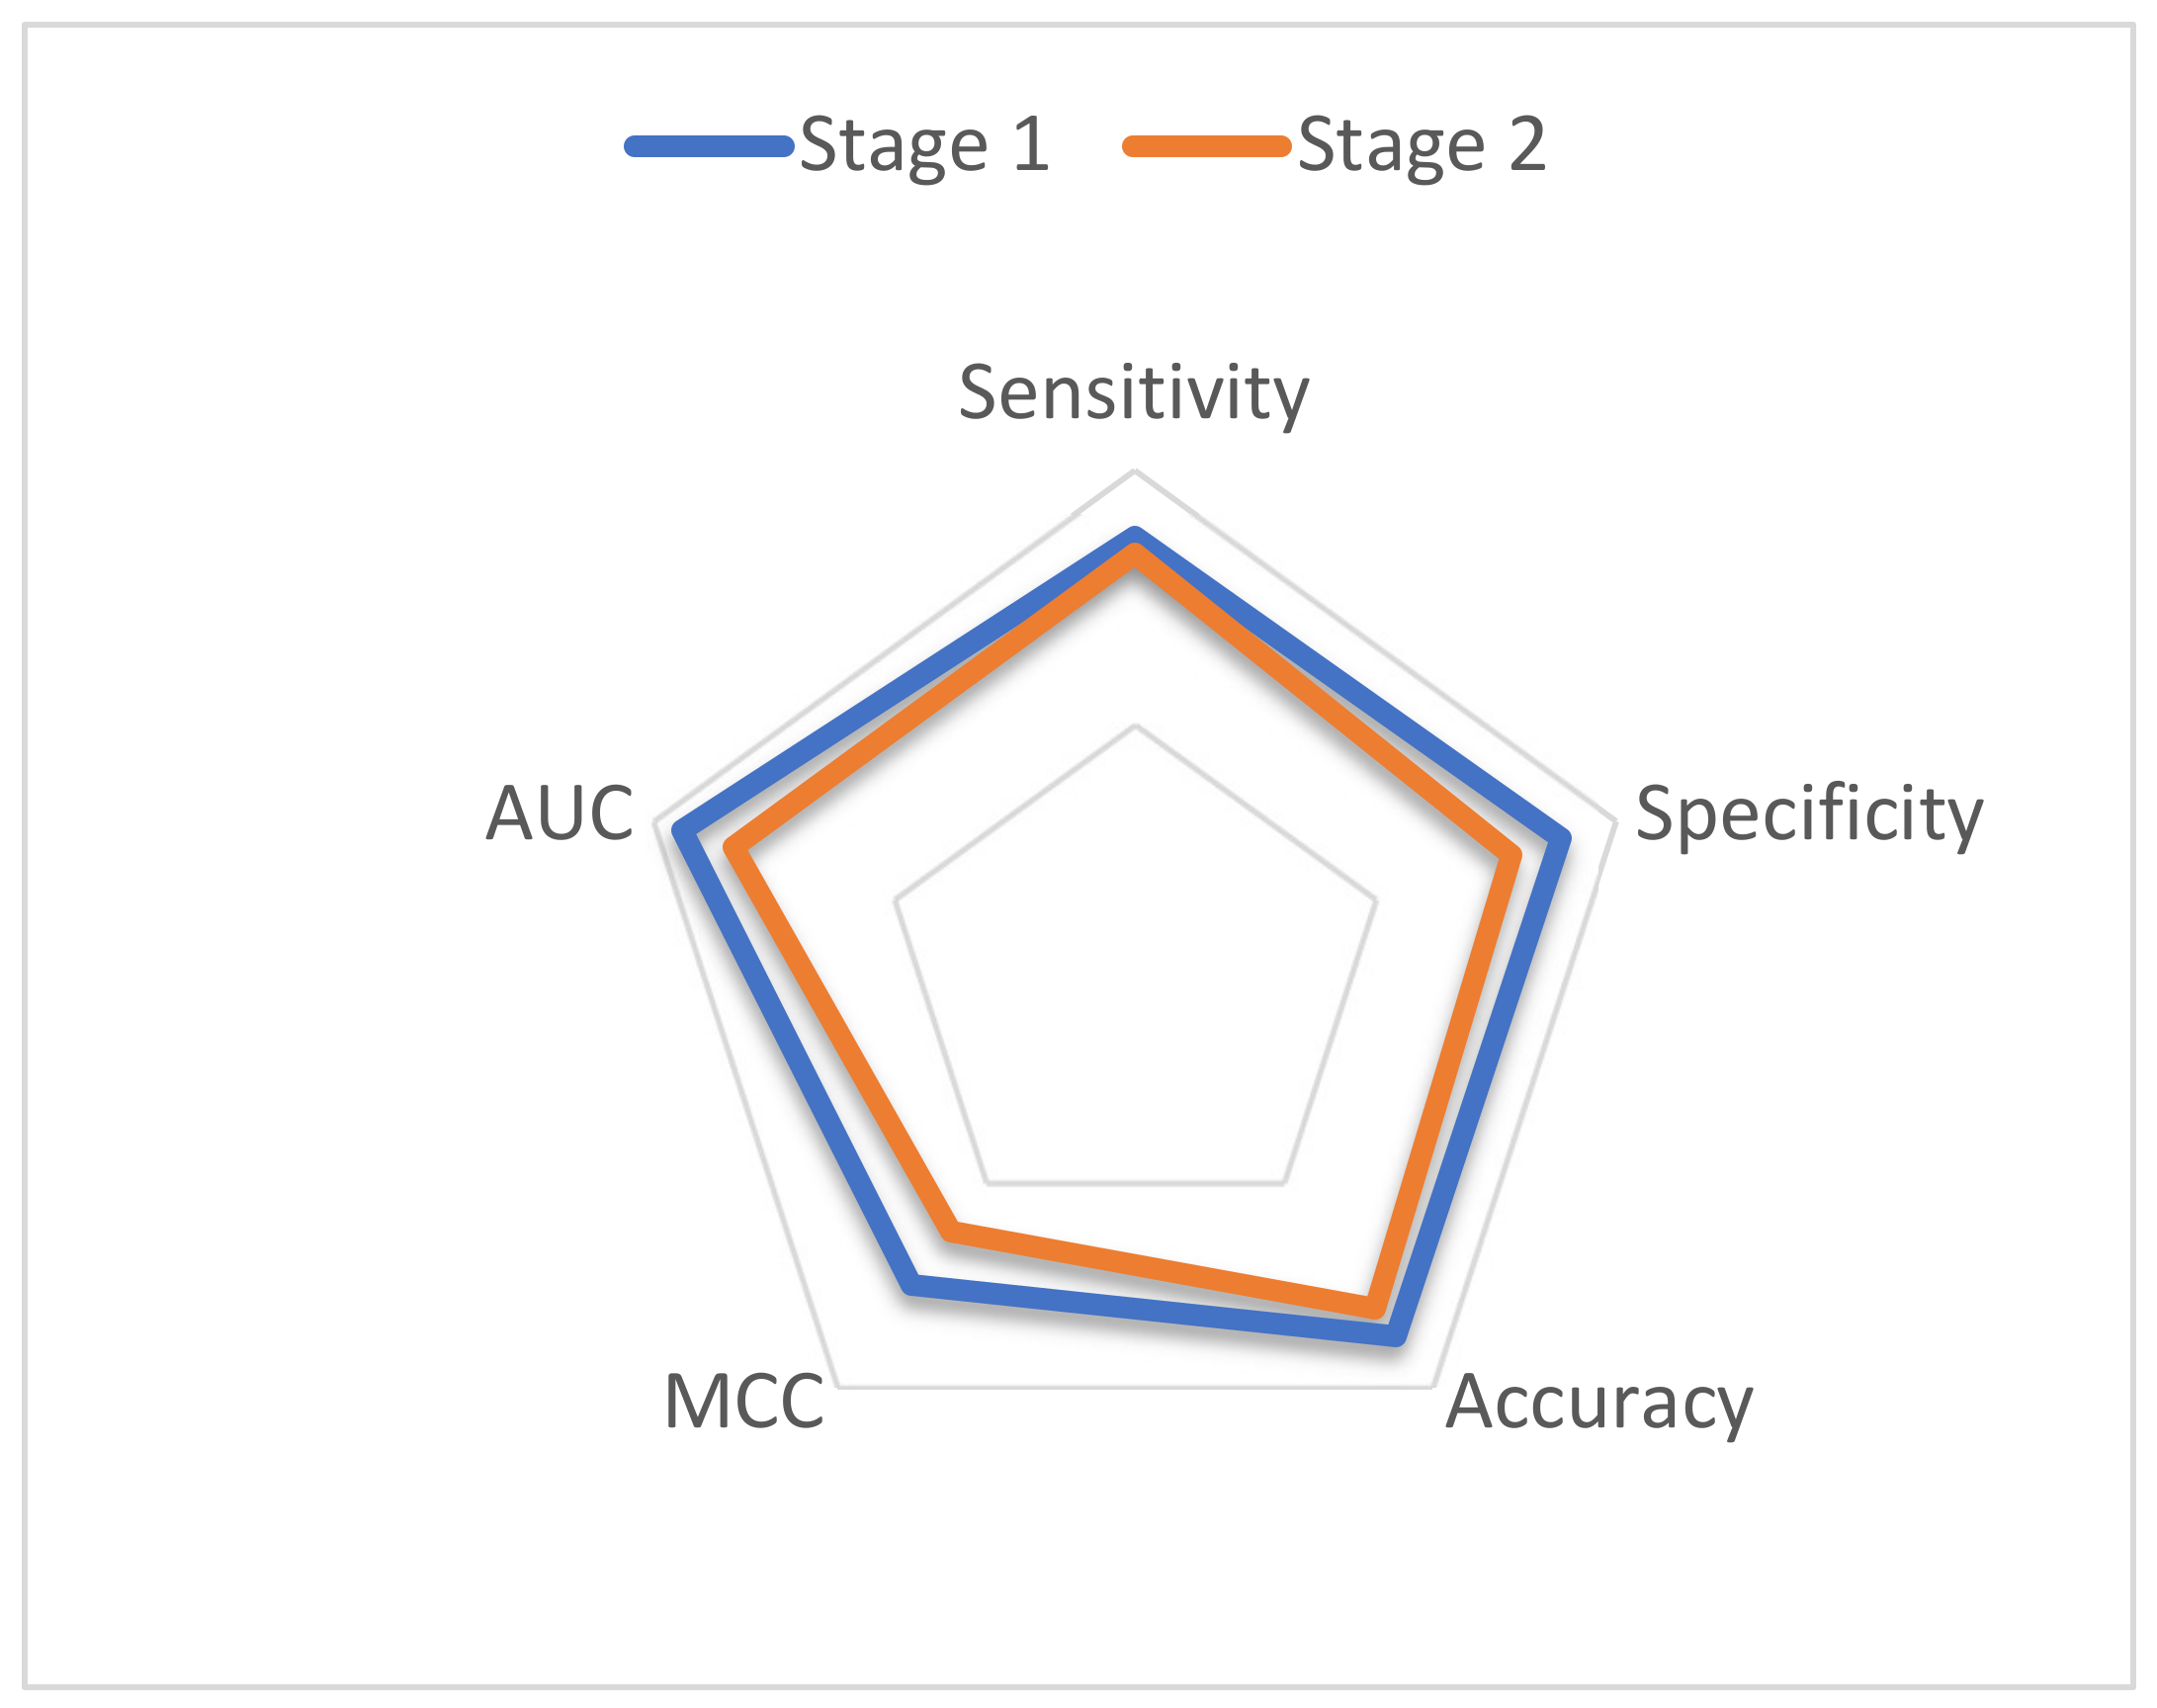
3.2. Cross-Validation Test

While using a cross-validation test, the complete dataset should be broken down into k subsets. In our study, one of the k-folds was applied in training and hyper-parameter selection; however, the remaining fold was utilized for testing the model. The reported results are the average of all five folds. The benchmark dataset shown in Equation (1) was used to train the first-stage classifier; similarly, the predictor was trained on the benchmark dataset, which is stated in (2) for the second-stage classifier. Table 4 and Figure 4 show the results obtained using the five-fold cross-validation on the benchmark dataset for both the first and second layers. Results from the cross validation show that the proposed model acquired a sensitivity of 86.99%, specificity of 88.54%, accuracy of 87.77%, MCC of 75.96%, and AUC of 94.01% for the first phase of the classification. For the second phase, the proposed predictor attained a sensitivity of 83.57%, specificity of 78.16%, accuracy of 76.7%, MCC of 62.05%, and AUC of 83.28%.

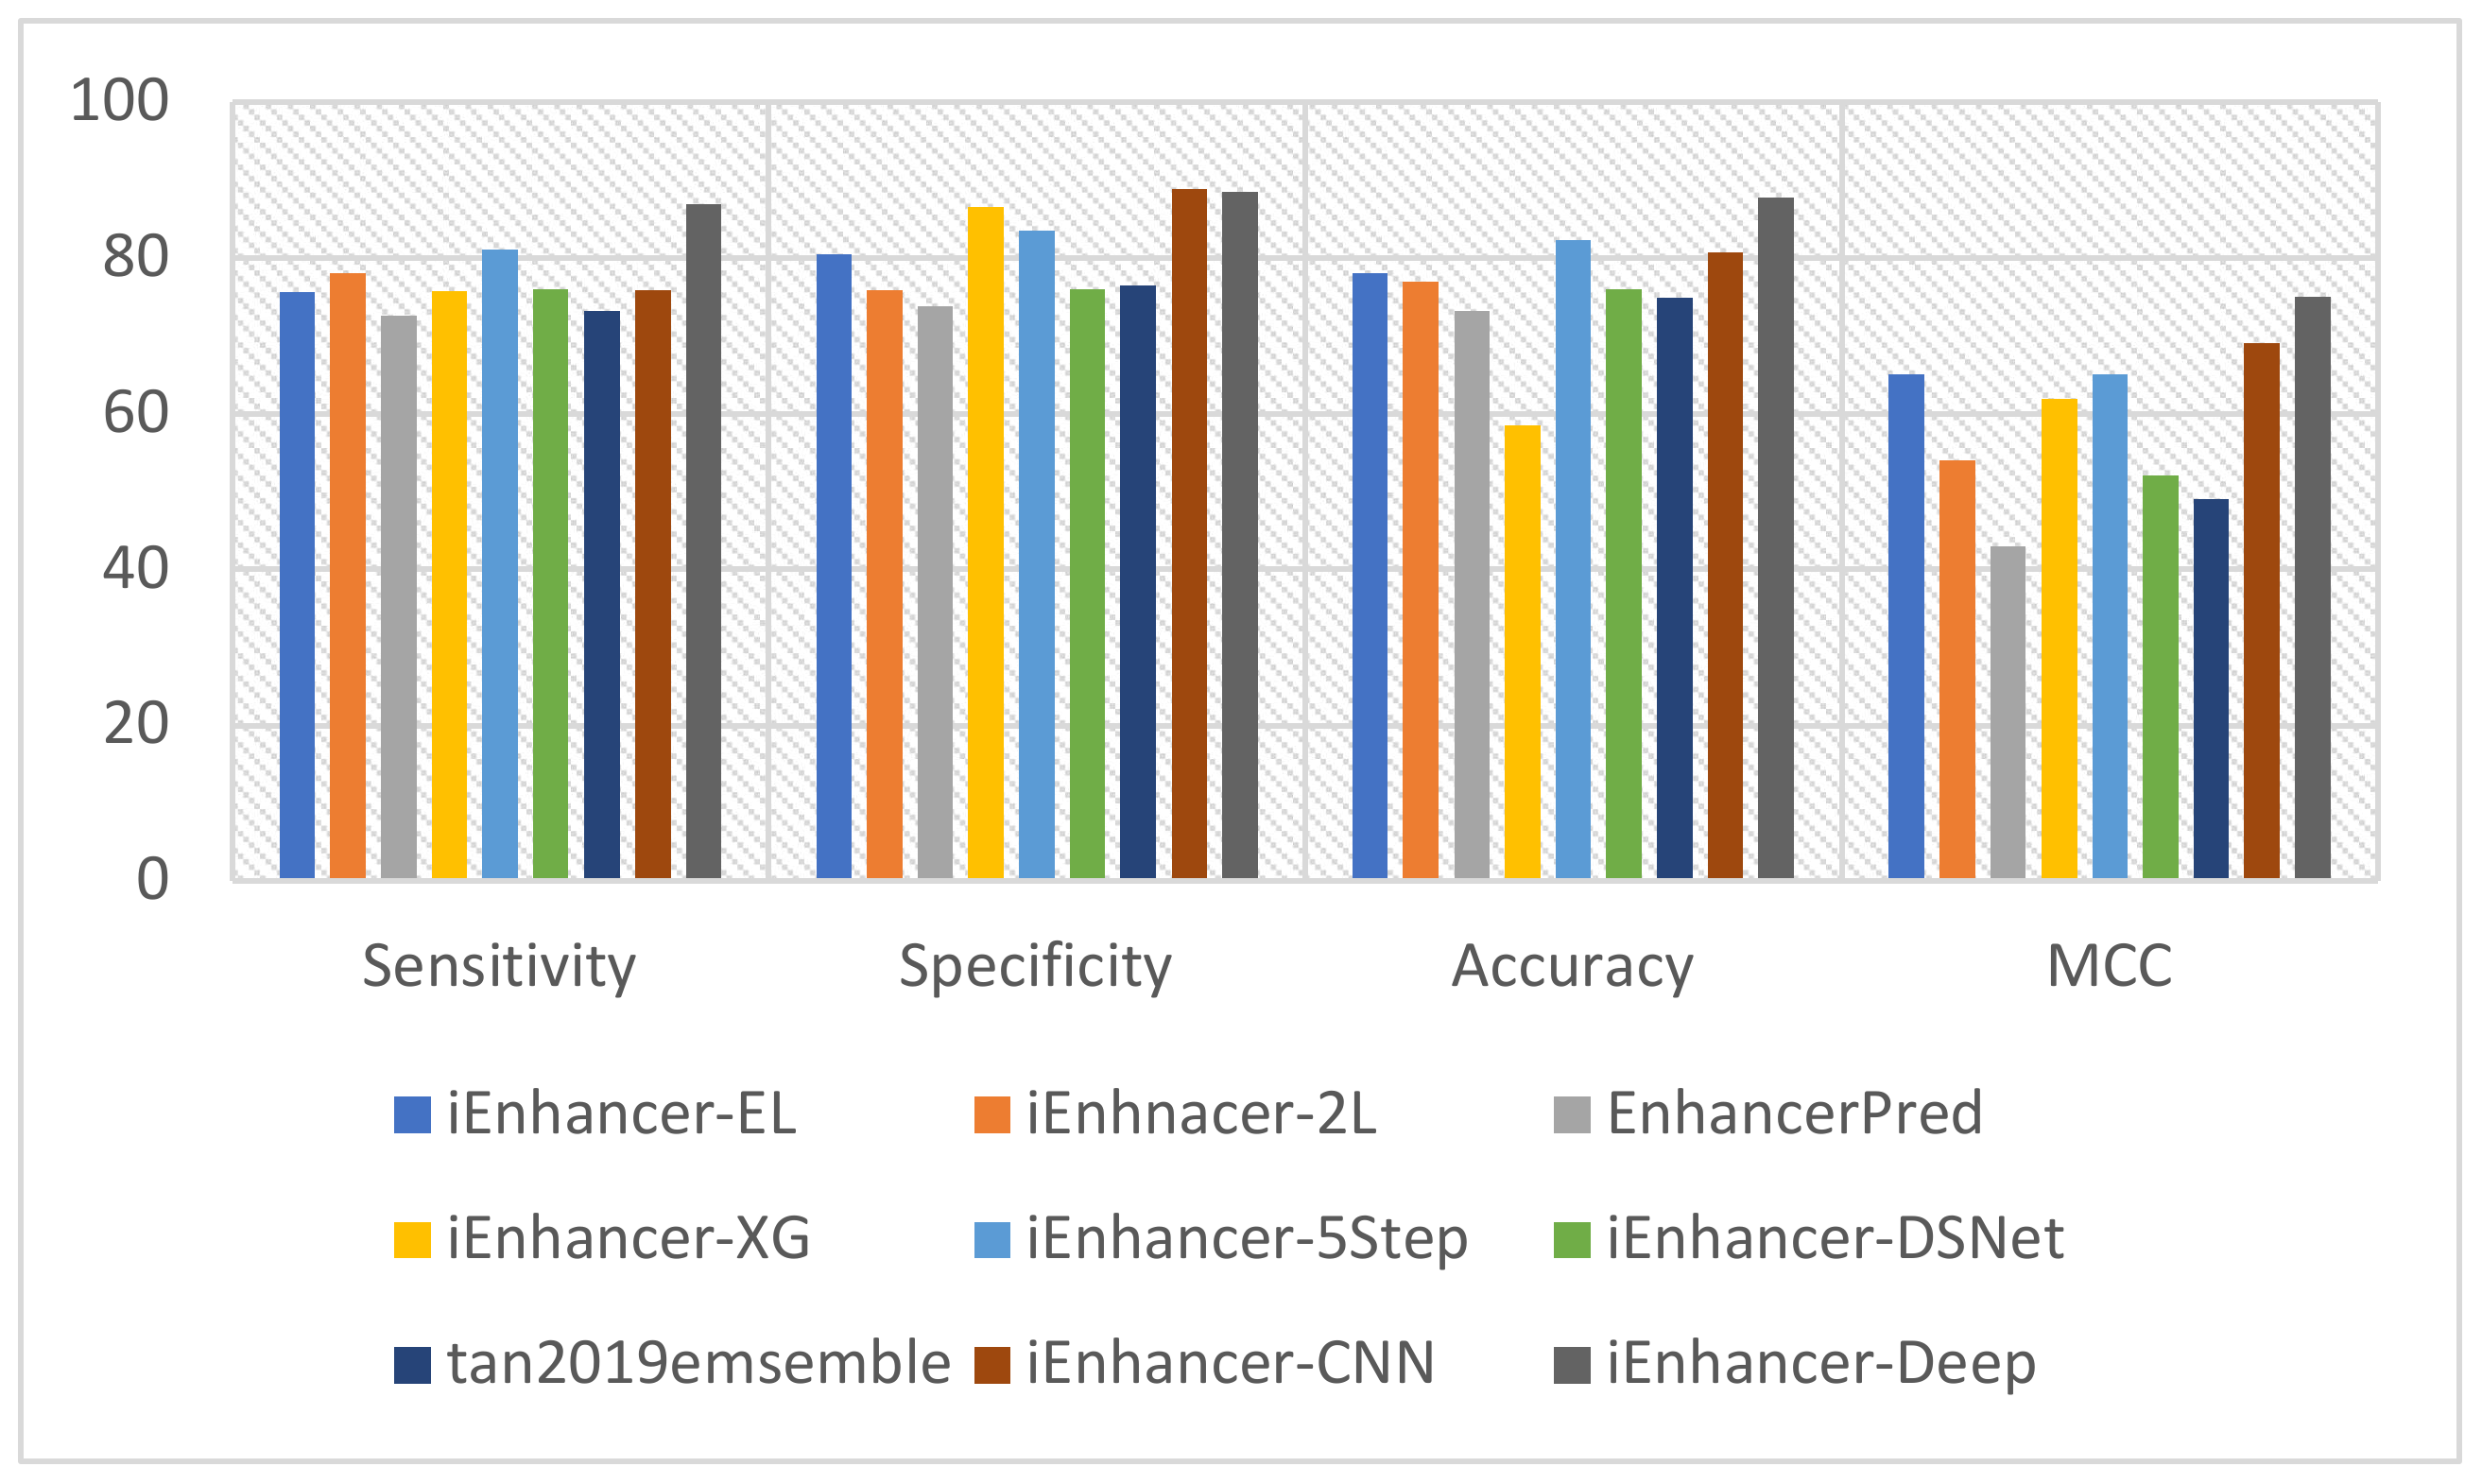
3.3. Performance Comparison with Existing Methods

This study used state-of-the-art classification models such as iEnhancer-EL [15], iEnhancer-2L [3], EnhancerPred [27], iEnhancer-XG [33], iEnhancer-5Step [34], iEnhancer-DSNet [35], tan2019ensemble [36], and iEnhancer-CNN [26]. These prediction methodologies were compared to that of this study for better evaluation. These studies employed a similar dataset for the functional evaluation and analysis of the benchmark dataset. The comparison of the accuracy of our model to other models demonstrated a significant increase for both layers. However, a detailed comparison using cross-validation tests of performance on the state-of-the-art predictors and our predictor in the first stage is shown in Table 5, and a similar comparison with state-of-the-art predictors for the second stage is shown in Table 6. The most noteworthy values for each class of metrics are highlighted. Furthermore, the performance of enhancer identification in the first stage was amended by 8.9%, 7.14%, and 0.06% for Sn, ACC, and MCC, respectively, as illustrated in Figure 5. Similarly, there was a significant improvement in the second stage by 3.92%, 1.36%, 4.43%, and 0.17 for Sn, Sp, ACC, and MCC, as shown in Figure 6. A detailed comparative analysis of the performance of the proposed model illustrates that our study achieved a significant improvement in model execution based on the performance assessment metrics. In both stages 1 and 2, the suggested predictor resulted in a significant enhancement of the perceived parameters. The considerable increase in MCC values demonstrates that our study increases the stability of the predictor and the overall performance of the model in comparison with the state-of-the-art methodologies that generally have smaller MCC values. This advancement is key to verifying the consistency of binary classification problems. MCC values are considered comparatively more instructive than ACC values because it considers the extent of all four parameters (TN, TP, FP, and FN) of the confusion matrix to show a balanced assessment during model appraisal [37]. In general, iEnhancer-Deep produced comparable performance with other previously proposed strategies.

3.4. Independent Dataset

We further tested the proposed model using the independent dataset proposed in [15]. This dataset contained 100 strong enhancers, 100 weak enhancers, and 200 non-enhancers. Table 7 shows the results of the comparison of the proposed model with other state-of-the-art models in the first stage, whereas Table 8 shows results of the comparison of the proposed model with other state-of-the-art models in the second stage. The achieved results show that the proposed model in both stages performed better in terms of sensitivity. This illustrates the robustness of the model by correctly predicting the true enhancer sites and their strength. In general, the combination of the results of the proposed model and iEnhancer-CNN provides more confidence at prediction time.

3.5. Cross-Species Test
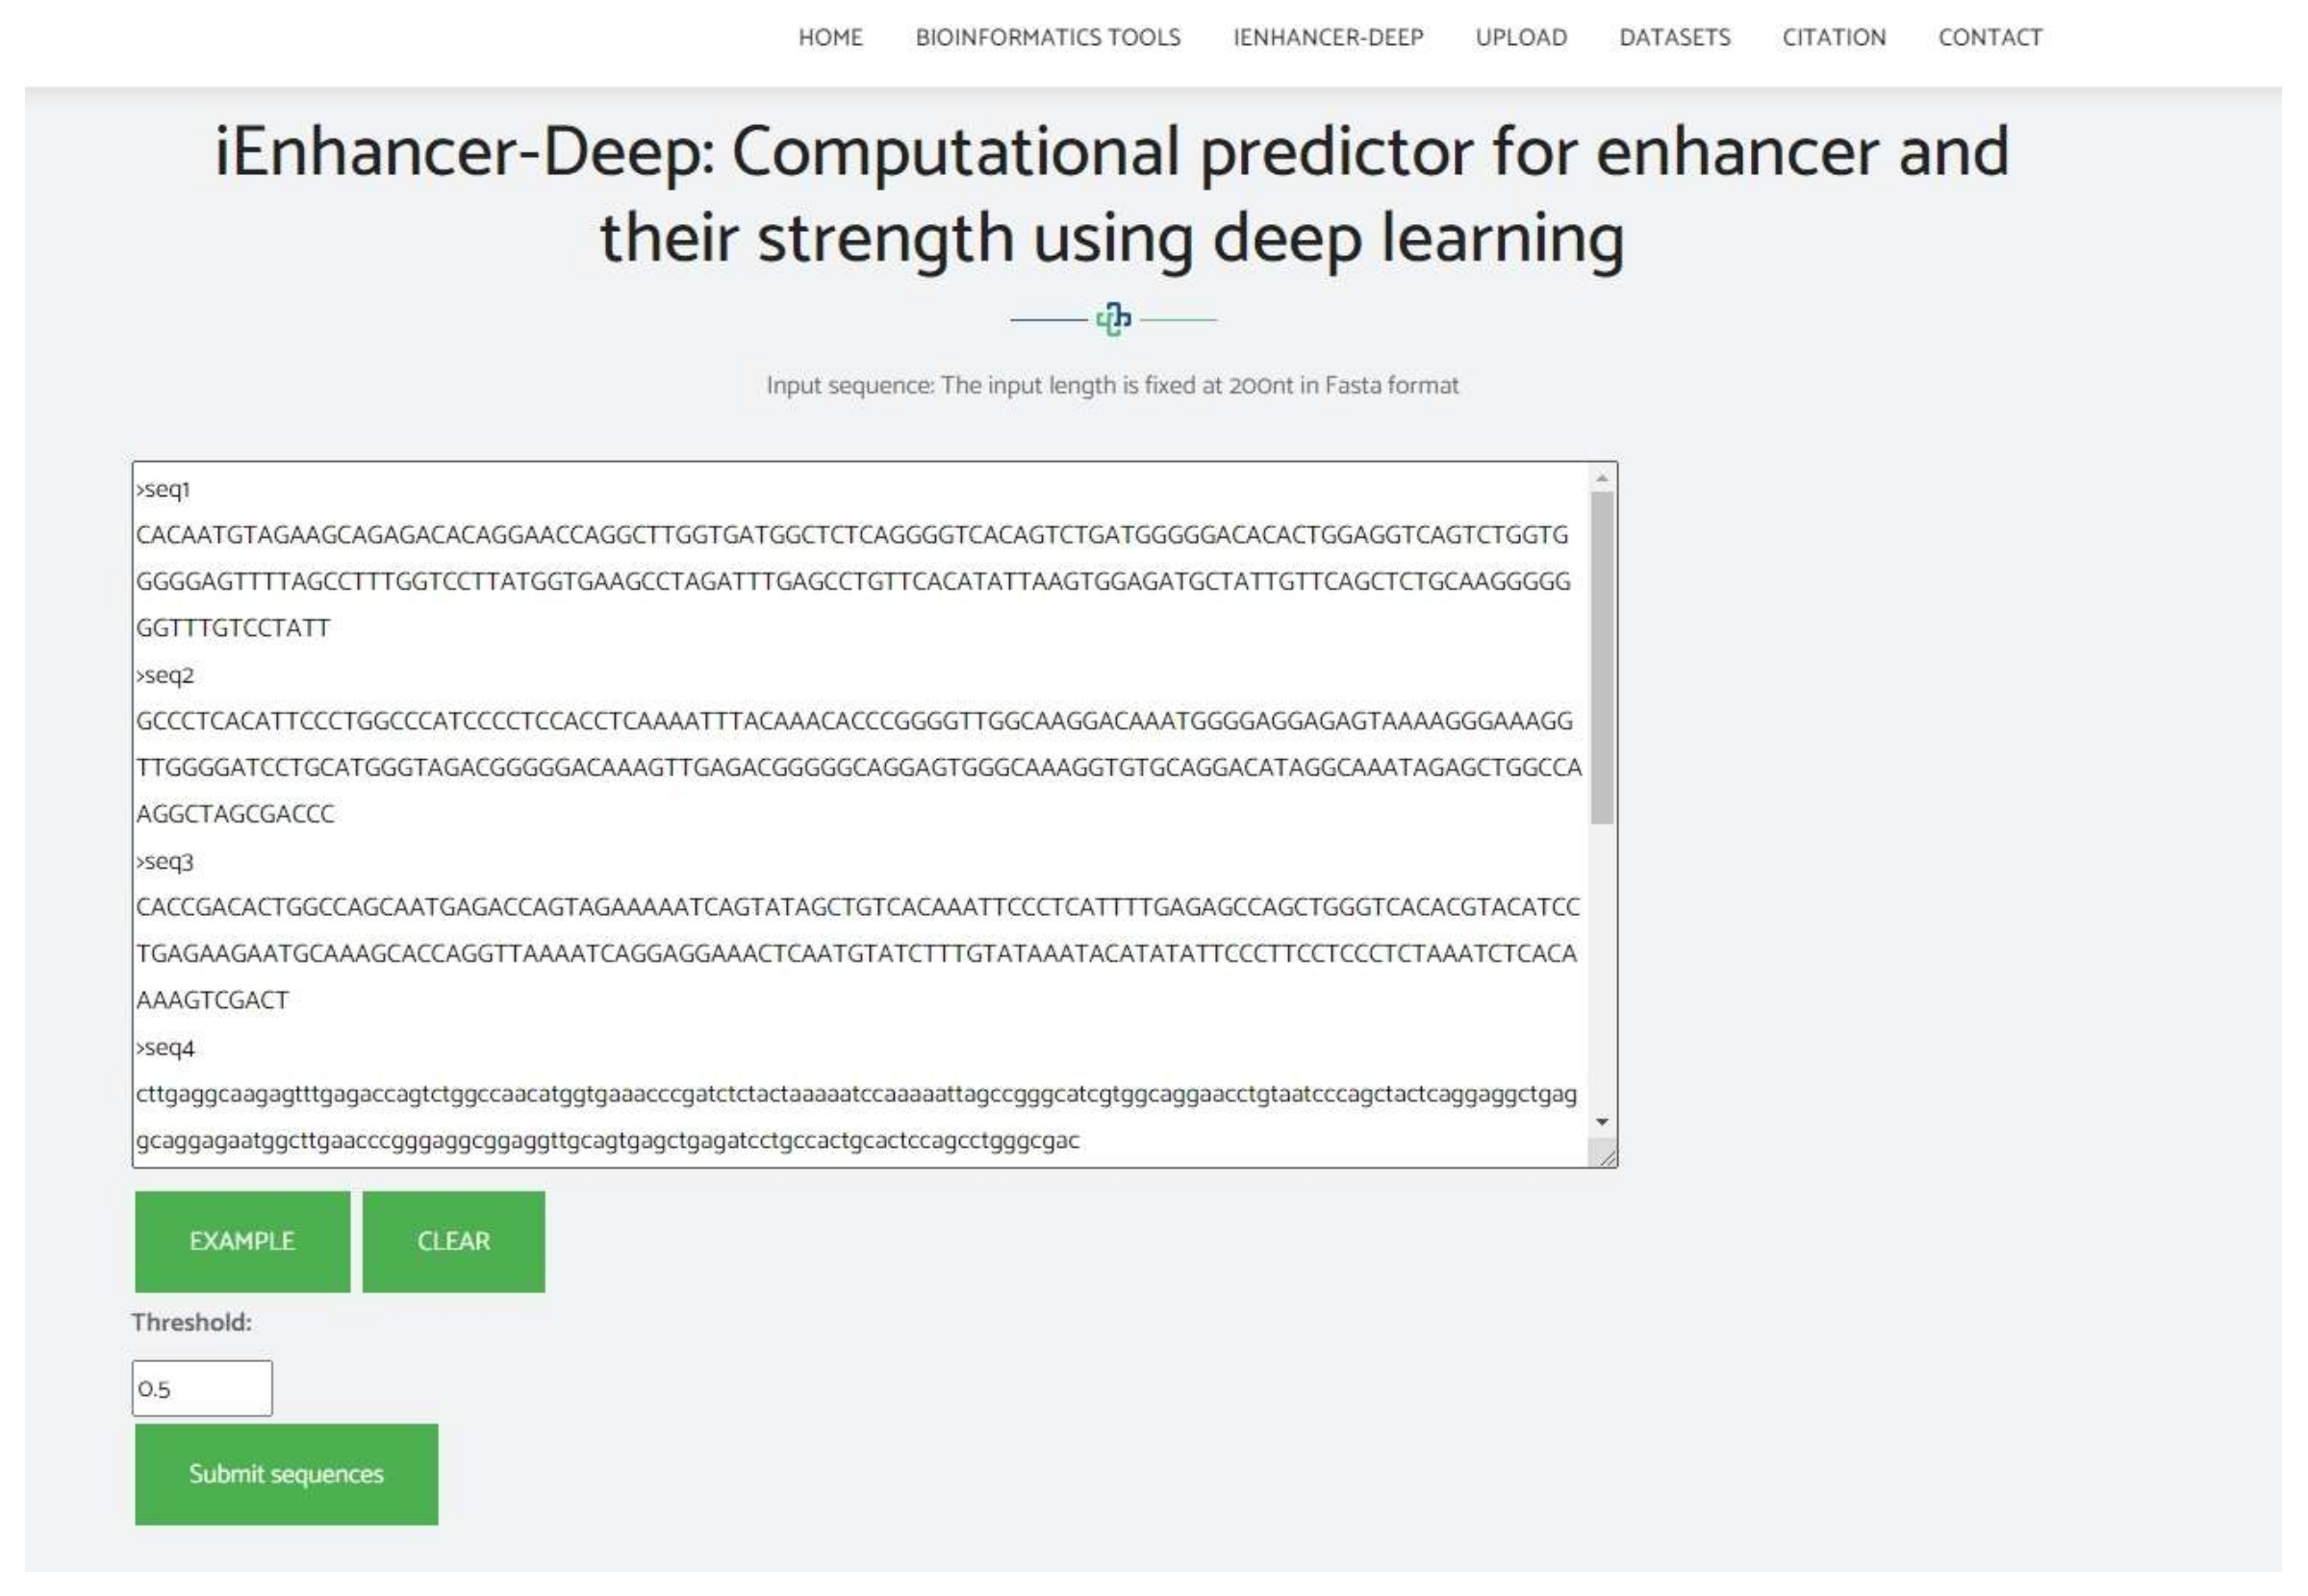
We further tested the generalizability of the proposed model to detect enhancer sites in additional species. We tested our model on M. musculus, D. melanogaster, C. elegance, and A. thaliana. The data on M. musculus, D. melanogaster, and C. elegance were obtained from (http://www.enhanceratlas.org/, accessed on 17 November 2021) [38], whereas the data on A. thaliana were obtained from Zhu et al. [39]. The results were compared with our previous tool iEnhancer-CNN. The M. musculus test set contained 34,696 enhancer sites. iEnhancer-Deep detected 22,184 enhancer sites, whereas iEnhancer-CNN detected 19,500 enhancer sites. The D. melanogaster test set contained 8060 enhancer sites. iEnhancer-Deep identified 4511 enhancer sites, and iEnhancer-CNN identified 4748 enhancer sites. In the case of the C. elegance test set, iEnhancer-Deep detected 4381 enhancer sites, and iEnhancer-CNN detected 4076 enhancer sites out of 11,870 enhancer sites in this test set. Finally, the obtained results of iEnhancer-CNN and iEnhancer-Deep were 855 and 462 enhancer sites out of 5871 enhancer sites in this test set, respectively. These results are summarized in Table 9. The detailed results can be downloaded from the tool webserver site (http://nsclbio.jbnu.ac.kr/tools/iEnhancer-Deep, accessed on 17 November 2021). The obtained results show that the performance of the proposed tool is generally better than that of iEnhancer-CNN. M. musculus is phylogenetically closer to H. Sapience (training dataset) compared with the other species we tested [40], therefore the detection rate in M.musculus is higher than the detection rates of other species.

4. Web Server

The design of a web server is extremely beneficial for the development of computational tools for scientists despite the need for a vast knowledge in mathematics and of several algorithms. We find it very important to construct a user-friendly web server that can be publicly accessible. A web server was constructed using the Flask library and Python software. We also provide genome-wide enhancers and enhancer strength predictions on the human genome uploaded to our web server under the dataset section. A snippet of the web server is shown in Figure 7. To utilize the web server, you may follow the following instructions:
-
Click on the following link to access the web server http://nsclbio.jbnu.ac.kr/tools/iEnhancer-Deep/ (accessed on 17 November 2021);
-
Options to copy/paste, upload, or simply write the DNA sequence in the input box in FASTS format are available;
-
For results, press the ‘submit sequence’ option;
-
One thousand is the largest number of sequences that our server can instantaneously sort.
Figure 7. Snippet of the web server for iEnhancer-Deep.
Applsci 12 02120 g007

5. Conclusions

Our fundamental issue is how to distinguish between enhancers and non-enhancers. In the early stages, this classification was performed with the help of biological experiments; however, classifying enhancers in this way requires a great deal of time, money, and work. Thus, we utilized a computational approach to quickly distinguish enhancers using deep learning. In this study, we proposed a computational method called iEnhancer-Deep. This predictor performs two tasks: the identification of enhancers and their strength. The proposed study produced comparable performance with other previously proposed methodologies. We further performed cross-species tests on M. musculus, D. melanogaster, C. elegance, and A. thaliana. Although the performance of iEnahncer-Deep is slightly better than the previous tool, comprehensive studies should be carried out in the future. In closing, an easy-to-access web server was initiated at http://nsclbio.jbnu.ac.kr/tools/iEnhancer-Deep/ (accessed on 17 November 2021).

Author Contributions

Conceptualization, H.K. and H.T.; methodology, H.K. and M.T.; software, H.K.; validation, H.K. and M.T.; formal analysis, H.K.; resources, H.T. and K.T.C.; data curation, H.K. and M.T.; writing—original draft preparation, H.K.; writing—review and editing, H.K. and M.T.; visualization, H.K.; supervision, K.T.C.; project administration, K.T.C.; funding acquisition, K.T.C. All authors have read and agreed to the published version of the manuscript.

Funding

This work was supported in part by a National Research Foundation of Korea (NRF) grant funded by the Korean government (MSIT) (No.2020R1A2C2005612), and in part by the Brain Research Program of the National Research Foundation (NRF) funded by the Korean government (MSIT) (No. NRF-2017M3C7A1044816).

Data Availability Statement

All data used in this study is available at http://nsclbio.jbnu.ac.kr/tools/iEnhancer-Deep/ (accessed on 17 November 2021).

Conflicts of Interest

The authors declare that they have no conflict of interest to report regarding this study.

References

  1. Pennacchio, L.A.; Bickmore, W.; Dean, A.; Nobrega, M.A.; Bejerano, G. Enhancers: Five essential questions. Nat. Rev. Genet. 2013, 14, 288–295. [Google Scholar] [CrossRef]
  2. Plank, J.L.; Dean, A. Enhancer function: Mechanistic and genomewide insights come together. Mol. Cell 2014, 55, 5–14. [Google Scholar] [CrossRef] [PubMed] [Green Version]
  3. Liu, B.; Fang, L.; Long, R.; Lan, X.; Chou, K.-C. Ienhancer-2l: A twolayer predictor for identifying enhancers and their strength by pseudo ktuple nucleotide composition. Bioinformatics 2016, 32, 362–369. [Google Scholar] [CrossRef] [PubMed] [Green Version]
  4. Bejerano, G.; Pheasant, M.; Makunin, I.; Stephen, S.; Kent, W.J.; Mattick, J.S.; Haussler, D. Ultraconserved elements in the human genome. Science 2004, 304, 1321–1325. [Google Scholar] [CrossRef] [PubMed] [Green Version]
  5. Boyd, M.; Thodberg, M.; Vitezic, M.; Bornholdt, J.; Vitting-Seerup, K.; Chen, Y.; Coskun, M.; Li, Y.; Lo, B.Z.S.; Klausen, P.; et al. Characterization of the enhancer and promoter landscape of inflammatory bowel disease from human colon biopsies. Nat. Commun. 2018, 9, 1–19. [Google Scholar] [CrossRef]
  6. Shlyueva, D.; Stampfel, G.; Stark, A. Transcriptional enhancers: From properties to genome-wide predictions. Nat. Rev. Genet. 2014, 15, 272–286. [Google Scholar] [CrossRef]
  7. Firpi, H.A.; Ucar, D.; Tan, K. Discover regulatory DNA elements using chromatin signatures and artificial neural network. Bioinformatics 2010, 26, 1579–1586. [Google Scholar] [CrossRef] [Green Version]
  8. Rajagopal, N.; Xie, W.; Li, Y.; Wagner, U.; Wang, W.; Stamatoyannopoulos, J.; Ernst, J.; Kellis, M.; Ren, B. Rfecs: A random-forest based algorithm for enhancer identification from chromatin state. PLoS Comput. Biol. 2013, 9, e1002968. [Google Scholar] [CrossRef]
  9. Erwin, G.D.; Oksenberg, N.; Truty, R.M.; Kostka, D.; Murphy, K.K.; Ahituv, N.; Pollard, K.S.; Capra, J.A. Integrating diverse datasets improves developmental enhancer prediction. PLoS Comput. Biol. 2014, 10, e1003677. [Google Scholar] [CrossRef] [Green Version]
  10. Fernández, M.; Miranda-Saavedra, D. Genome-wide enhancer prediction from epigenetic signatures using genetic algorithm-optimized support vector machines. Nucleic Acids Res. 2012, 40, e77. [Google Scholar] [CrossRef] [Green Version]
  11. Ghandi, M.; Lee, D.; Mohammad-Noori, M.; Beer, M.A. Enhanced Regulatory Sequence Prediction Using Gapped k-mer Features. PLoS Comput. Biol. 2014, 10, e1003711. [Google Scholar] [CrossRef] [PubMed] [Green Version]
  12. Kleftogiannis, D.; Kalnis, P.; Bajic, V.B. DEEP: A general computational framework for predicting enhancers. Nucleic Acids Res. 2014, 43, e6. [Google Scholar] [CrossRef] [PubMed] [Green Version]
  13. Bu, H.; Gan, Y.; Wang, Y.; Zhou, S.; Guan, J. A new method for enhancer prediction based on deep belief network. BMC Bioinform. 2017, 18, 418. [Google Scholar] [CrossRef] [Green Version]
  14. Yang, B.; Liu, F.; Ren, C.; Ouyang, Z.; Xie, Z.; Bo, X.; Shu, W. BiRen: Predicting enhancers with a deep-learning-based model using the DNA sequence alone. Bioinformatics 2017, 33, 1930–1936. [Google Scholar] [CrossRef] [Green Version]
  15. Liu, B.; Li, K.; Huang, D.-S.; Chou, K.-C. ienhancer-el: Identifying enhancers and their strength with ensemble learning approach. Bioinformatics 2018, 34, 3835–3842. [Google Scholar] [CrossRef] [PubMed]
  16. Khanal, J.; Nazari, I.; Tayara, H.; Chong, K.T. 4mccnn: Identification of n4-methylcytosine sites in prokaryotes using convolutional neural network. IEEE Access 2019, 7, 145455–145461. [Google Scholar] [CrossRef]
  17. Tayara, H.; Chong, K.T. Improving the Quantification of DNA Sequences Using Evolutionary Information Based on Deep Learning. Cells 2019, 8, 1635. [Google Scholar] [CrossRef] [Green Version]
  18. Nazari, I.; Tayara, H.; Chong, K.T. Branch Point Selection in RNA Splicing Using Deep Learning. IEEE Access 2018, 7, 1800–1807. [Google Scholar] [CrossRef]
  19. Tahir, M.; Tayara, H.; Chong, K.T. irna-pseknc (2methyl): Identify rna 2′-o-methylation sites by convolution neural network and chou’s pseudo components. J. Theor. Biol. 2019, 465, 1–6. [Google Scholar] [CrossRef]
  20. Ali, S.D.; Alam, W.; Tayara, H.; Chong, K. Identification of Functional piRNAs Using a Convolutional Neural Network. IEEE/ACM Trans. Comput. Biol. Bioinform. 2020, 1. [Google Scholar] [CrossRef]
  21. Tayara, H.; Tahir, M.; Chong, K.T. iss-cnn: Identifying splicing sites using convolution neural network. Chemom. Intell. Lab. Syst. 2019, 188, 63–69. [Google Scholar] [CrossRef]
  22. Tahir, M.; Hayat, M. Machine learning based identification of protein—Protein interactions using derived features of physiochemical properties and evolutionary profiles. Artif. Intell. Med. 2017, 78, 61–71. [Google Scholar] [CrossRef] [PubMed]
  23. Wei, L.; Luan, S.; Nagai, L.A.E.; Su, R.; Zou, Q. Exploring sequencebased features for the improved prediction of DNA n4-methylcytosine sites in multiple species. Bioinformatics 2018, 35, 1326–1333. [Google Scholar] [CrossRef] [PubMed]
  24. Ali, S.D.; Kim, J.H.; Tayara, H.; Chong, K.T. Prediction of RNA 5-Hydroxymethylcytosine Modifications Using Deep Learning. IEEE Access 2021, 9, 8491–8496. [Google Scholar] [CrossRef]
  25. Jia, C.; Yang, Q.; Zou, Q. NucPosPred: Predicting species-specific genomic nucleosome positioning via four different modes of general PseKNC. J. Theor. Biol. 2018, 450, 15–21. [Google Scholar] [CrossRef] [PubMed]
  26. Khanal, J.; Tayara, H.; Chong, K.T. Identifying Enhancers and Their Strength by the Integration of Word Embedding and Convolution Neural Network. IEEE Access 2020, 8, 58369–58376. [Google Scholar] [CrossRef]
  27. Jia, C.; He, W. EnhancerPred: A predictor for discovering enhancers based on the combination and selection of multiple features. Sci. Rep. 2016, 6, 38741. [Google Scholar] [CrossRef] [Green Version]
  28. Fu, L.; Niu, B.; Zhu, Z.; Wu, S.; Li, W. CD-HIT: Accelerated for clustering the next-generation sequencing data. Bioinformatics 2012, 28, 3150–3152. [Google Scholar] [CrossRef]
  29. Bari, A.G.; Reaz, M.R.; Choi, H.-J.; Jeong, B.-S. DNA encoding for splice site prediction in large DNA sequence. In International Conference on Database Systems for Advanced Applications; Springer: Berlin/Heidelberg, Germany, 2013; pp. 46–58. [Google Scholar]
  30. Wei, L.; Chen, H.; Su, R. M6APred-EL: A Sequence-Based Predictor for Identifying N6-methyladenosine Sites Using Ensemble Learning. Mol. Ther. Nucleic Acids 2018, 12, 635–644. [Google Scholar] [CrossRef] [Green Version]
  31. Ying, X. An Overview of Overfitting and its Solutions. J. Phys. Conf. Ser. 2019, 1168, 022022. [Google Scholar] [CrossRef]
  32. Matthews, B. Comparison of the predicted and observed secondary structure of T4 phage lysozyme. BBA Protein Struct. 1975, 405, 442–451. [Google Scholar] [CrossRef]
  33. Cai, L.; Ren, X.; Fu, X.; Peng, L.; Gao, M.; Zeng, X. iEnhancer-XG: Interpretable sequence-based enhancers and their strength predictor. Bioinformatics 2020, 37, 1060–1067. [Google Scholar] [CrossRef] [PubMed]
  34. Le, N.Q.K.; Yapp, E.K.Y.; Ho, Q.-T.; Nagasundaram, N.; Ou, Y.-Y.; Yeh, H.-Y. iEnhancer-5Step: Identifying enhancers using hidden information of DNA sequences via Chou’s 5-step rule and word embedding. Anal. Biochem. 2019, 571, 53–61. [Google Scholar] [CrossRef] [PubMed]
  35. Asim, M.N.; Ibrahim, M.A.; Malik, M.I.; Dengel, A.; Ahmed, S. Enhancer-dsnet: A supervisedly prepared enriched sequence representation for the identification of enhancers and their strength. In International Conference on Neural Information Processing; Springer: Berlin/Heidelberg, Germany, 2020; pp. 38–48. [Google Scholar]
  36. Tan, K.K.; Le, N.Q.K.; Yeh, H.-Y.; Chua, M.C.H. Ensemble of Deep Recurrent Neural Networks for Identifying Enhancers via Dinucleotide Physicochemical Properties. Cells 2019, 8, 767. [Google Scholar] [CrossRef] [Green Version]
  37. Chicco, D. Ten quick tips for machine learning in computational biology. BioData Min. 2017, 10, 35. [Google Scholar] [CrossRef]
  38. Tianshun, G.; Qian, J. EnhancerAtlas 2.0: An updated resource with enhancer annotation in 586 tissue/cell types across nine species. Nucleic Acids Res. 2020, 48, D58–D64. [Google Scholar]
  39. Bo, Z.; Zhang, W.; Zhang, T.; Liu, B.; Jianga, J. Genome-Wide Prediction and Validation of Intergenic Enhancers in Arabidopsis Using Open Chromatin Signatures. Plant Cell 2015, 27, 2415–2426. [Google Scholar]
  40. Ivica, L.; Bork, P. Interactive Tree Of Life (iTOL) v4: Recent updates and new developments. Nucleic Acids Res. 2019, 47, W256–W259. [Google Scholar]
Figure 1. Illustration of the proposed model architecture.
Applsci 12 02120 g001
Figure 2. Radar plot for the performance comparison between iEnhancer-Deep and the NCP+ND in the first stage.
Applsci 12 02120 g002
Figure 3. Radar plot for the performance comparison between iEnhancer-Deep and the NCP+ND in the second stage.
Applsci 12 02120 g003
Figure 4. Radar plot for the performance of the proposed model in both stages.
Applsci 12 02120 g004
Figure 5. Graphical representation of the comparison in the first stage.
Applsci 12 02120 g005
Figure 6. Graphical representation of the comparison in the second stage.
Applsci 12 02120 g006
Table 1. Detailed architecture of the proposed model for both stages.
LayerParameters
Input-
Gaussian NoiseStandard deviation = 0.2
Conv1DKernels = 128
Kernel size = 7
Group NormalizationGroups = 2
Max poolingWindow size = 2
DropoutDropout rate = 0.2
Conv1DKernels = 256
Kernel size = 6
Group NormalizationGroups = 2
Max poolingWindow size = 2
DropoutDropout rate = 0.15
Conv1DKernels = 256
Kernel size = 5
Group NormalizationGroups = 2
Max poolingWindow size = 2
DropoutDropout rate = 0.04
Flatten-
DenseNodes = 16
OutputNodes = 1
Table 2. Representation of nucleotides based on their chemical properties.
Chemical PropertiesClassNucleotides
Ring StructurePurine[A, G]
Pyrimidine[C, T]
Hydrogen BondStrong[C, G]
Weak[A, T]
Functional GroupAmino[A, C]
Keto[G, T]
Table 3. Performance comparison for both stages between NCP+ND and the proposed model.
StageModelSensitivitySpecificityAccuracyMCC
Stage 1NCP+ND72.772.774.590.49
iEnhancer-Deep86.9988.5487.770.75
Stage 2NCP+ND72.675.975.90.48
iEnhancer-Deep83.5778.1680.860.62
Table 4. Performance of the proposed model iEnhancer-Deep in both stages using cross-validation.
StagesSensitivitySpecificityAccuracyMCC
Stage 186.9988.5487.770.75
Stage 283.5778.1680.860.62
Table 5. Performance comparison between the state-of-the-art predictors and the proposed model in the first stage.
ModelSensitivitySpecificityAccuracyMCC
iEnhancer-EL75.6780.3978.030.56
iEnhnacer-2L78.0975.8876.890.54
EnhancerPred72.5773.7973.180.43
iEnhancer-XG75.7086.5058.550.62
iEnhancer-5Step81.1083.5082.300.65
iEnhancer-DSNet76.0076.0076.000.52
tan2019emsemble73.2576.4274.83.49
iEnhancer-CNN75.8888.8880.630.69
iEnhancer-Deep86.9988.587.770.75
Table 6. Performance comparison between the state-of-the-art predictors and the proposed model in the second stage.
ModelSensitivitySpecificityAccuracyMCC
iEnhancer-EL69.0061.0565.030.31
iEnhnacer-2L62.2161.8261.930.24
EnhancerPred62. 6761.4662.060.24
iEnhancer-XG74.9458.5566.740.33
iEnhancer-5Step75.5360.8068.100.37
iEnhancer-DSNet63.0067.0063.000.26
tan2019emsemble79.6538.2858.960.19
iEnhancer-CNN73.6476.876.430.45
iEnhancer-Deep83.5778.1680.860.62
Table 7. Performance comparison in the first stage between the state-of-the-art predictors and the proposed model in the independent test.
ModelSensitivitySpecificityAccuracyMCC
iEnhancer-EL71.0078.5074.750.4969
iEnhnacer-2L71.0075.0073.000.4604
EnhancerPred73.5074.5074.000.4800
iEnhancer-CNN78.2579.0077.500.5850
iEnhancer-Deep81.567.0074.020.4902
Table 8. Performance comparison in the second stage between the state-of-the-art predictors and the proposed model in the independent test.
ModelSensitivitySpecificityAccuracyMCC
iEnhancer-EL54.0068.0061.000.2222
iEnhnacer-2L47.0074.0060.500.2181
EnhancerPred45.0065.0055.000.1021
iEnhancer-CNN65.2576.1075.000.3232
iEnhancer-Deep73.0049.0061.000.2266
Table 9. The performance comparison of the proposed model on the cross-species test.
ModelSpeciesTotal EnhancersTPFN
iEnhancer-CNNM. musculus34,69619,50015,196
iEnhancer-Deep22,18412,512
iEnhancer-CNND. melanogaster806047483312
iEnhancer-Deep45113549
iEnhancer-CNNC. elegance11,87040767794
iEnhancer-Deep 43817489
iEnhancer-CNNA. thaliana58714625409
iEnhancer-Deep8555016
Publisher’s Note: MDPI stays neutral with regard to jurisdictional claims in published maps and institutional affiliations.

