Abstract
To reduce the cutting force and cutting power consumption during harvest, the cutting mechanical properties of the root of little cabbage were studied. The cutting experiment was carried out using a texture analyzer, and the influence of the individual factors, the cutting bevel angle, the sliding angle, and the cutting gap on the maximum cutting stress and specific cutting energy were studied, respectively. On the basis of single factor experiments, multi-factor experiments were carried out using the central composite design scheme of the response surface method (RSM), and finally, the cutting parameters were optimized. The single factor test results showed that the maximum cutting stress and specific cutting energy first decreased and then increased with the increase in the cutting bevel angle, decreased with the increase in the sliding angle, and first dropped and then went up with the increase in the cutting gap. Response surface test results showed that the order of significance of factors affecting the maximum cutting stress of the root were the oblique angle, sliding angle, and cutting gap in sequence, and the order of the significance of factors affecting the specific cutting energy are cutting gap, oblique angle, and sliding angle. The interaction between the sliding angle and the cutting gap had a significant impact on the maximum cutting stress, and the interaction between the oblique angle and the cutting gap had a significant impact on the cutting energy. The optimal parameter combination is as follows: oblique angle of 9.1°, sliding angle of 30°, and cutting gap of 1.3 mm. At this time, the predicted maximum cutting stress was 7.43 × 10⁴ Pa, and the specific cutting energy was 0.28 mJ mm−2. Finally, a verification experiment was carried out, and the errors of the predicted and measured values of cutting under the optimal parameter combination were 6.9% and 10.8%, respectively, showing that the cutting parameter optimization results were reliable. This research can provide data support for the design and improvement in the cutting device of the little cabbage combine harvester.
1. Introduction
Little cabbage is rich in nutrients and is one of the most important vegetable species in China. However, the degree of mechanization in the harvesting of little cabbage is low at present, and there are problems such as high labor intensity and low production efficiency in manual harvesting. The cutting device is an important component of little cabbage vegetable harvesters. Reducing power consumption and cutting damage in the cutting operation and improving the service life of the tool are the main factors to be considered in the design of the cutting device. Investigating the physical and mechanical properties of the roots of little cabbage has important guiding significance for the research and development of cutting devices [1,2].
The stress–strain process in plant cutting, in essence, is that when the cutter com-presses the root and bend root to elastically deform, the fibers at the minimum radius of curvature of the cutter blade generates tensile stress. When the tensile stress exceeds the resistance of fiber tissues at tensile strength, fibers break and fail. As the cutter moves for-ward against the cutting resistance, the entire fiber layer of the root slips and breaks, resulting in shear failure of the entire root [3]. In general, the cutting process of plant roots is typical high-speed collision and contact, and the interaction force between the cutting blade and the root is random and nonlinear, hence, it is difficult to clarify the relationship between them by traditional theoretical analysis methods. Therefore, physical experiments are usually adopted to study the cutting mechanical properties of plant roots [4,5].
Some studies have found that the structural and working parameters of the cutting blade also affect the cutting mechanical properties [6,7]. Many studies have investigated the effect of factors such as the oblique angle of the cutting blade on the mechanical properties in cutting. Zhao et al. [8] analyzed the cutting resistance and power consumption of maize stalks under a self-designed testing system and found that the power consumption declined by 11.04% and 16.65%, respectively, when the cutting angle was 75°. Vu et al. [9] took corn stem as the research object and studied the influence of feed angle of cutting blade on cutting force forces and cutting power, and determined the optimum cutting condition found was 50° by calculating using the grey relational grades method. It was reported that the sliding angle of the cutter also had obvious significance on affecting the cutting mechanical properties of plant roots. Gan et al. [10] compared power consumption in harvesting Miscanthus using a right angle cutter and bevel cutter and found that the design of the cutter had a significant impact on the energy consumption and field performance of biomass harvesting equipment. Zhang et al. [11] used the cutting device of a texture analyzer to study the effect of the slide cutting angle on the cutting energy of a single rice stem. The results showed that optimizing the sliding cutting angle had a significant effect on savings in cutting energy. With the increase in the sliding cutting angle of the blade, the peak cutting force per unit stem cross-sectional area was reduced. Similar results were also reported by Boydas et al. [12], who found that the shear stress value at the 28° bevel angle was lower than that at the 0° bevel angle in cutting red bean stems. Cutting gap is another important factor that affects cutting force [13]. A study designed a shear fixture for cutting lettuce stems on a universal materials tester, and the results showed that the optimal cutting gap for a cutter design was 1.66 mm [14]. Therefore, according to the relevant literature, the relationship between the cutting mechanical properties of the plant and the physical structure of the stem, the structure, and the working parameters of the cutter can be studied through a texture analyzer or a specific experimental device with a mechanical sensor, and related parameters can be optimized. However, there are few studies on the cutting mechanical properties of the root of little cabbage. In addition, the cutting devices of existing commercial harvesters are mostly used for crops such as rice and wheat, which are not suitable for root and leaf vegetables due to the different physical parameters [15]. In order to study the cutting mechanical properties of little cabbage root and optimize the parameters of the cutting device of the little cabbage harvester, oblique angle, sliding cutting angle, and cutting gap were taken as test factors, and effects of test factors on the cutting performance of little cabbage roots were studied. Finally, the optimal combination of cutting parameters was obtained to improve the cutting process and cutting device for little cabbage.
2. Materials and Methods
2.1. Materials
The variety of little cabbage test samples was Nanjing Yongxin, which is widely grown in Jiangsu Province, China. The test samples were cultivated in a facility greenhouse for 35 days, and were randomly selected from 200 plants. The plants grew normally without obvious defects. We kept the soil at the roots of the plants and sealed them with plastic wrap [16]. Before the cutting test, ten cabbage roots were randomly selected and weighed, respectively, and were continuously dried in an oven at 103 °C for 24 h to measure the moisture content (ASABE standard, 2012). The moisture content was calculated by Equation (1).
where MC is the moisture content, %; is the weight lost after drying, g; and is the weight of the wet sample, g.
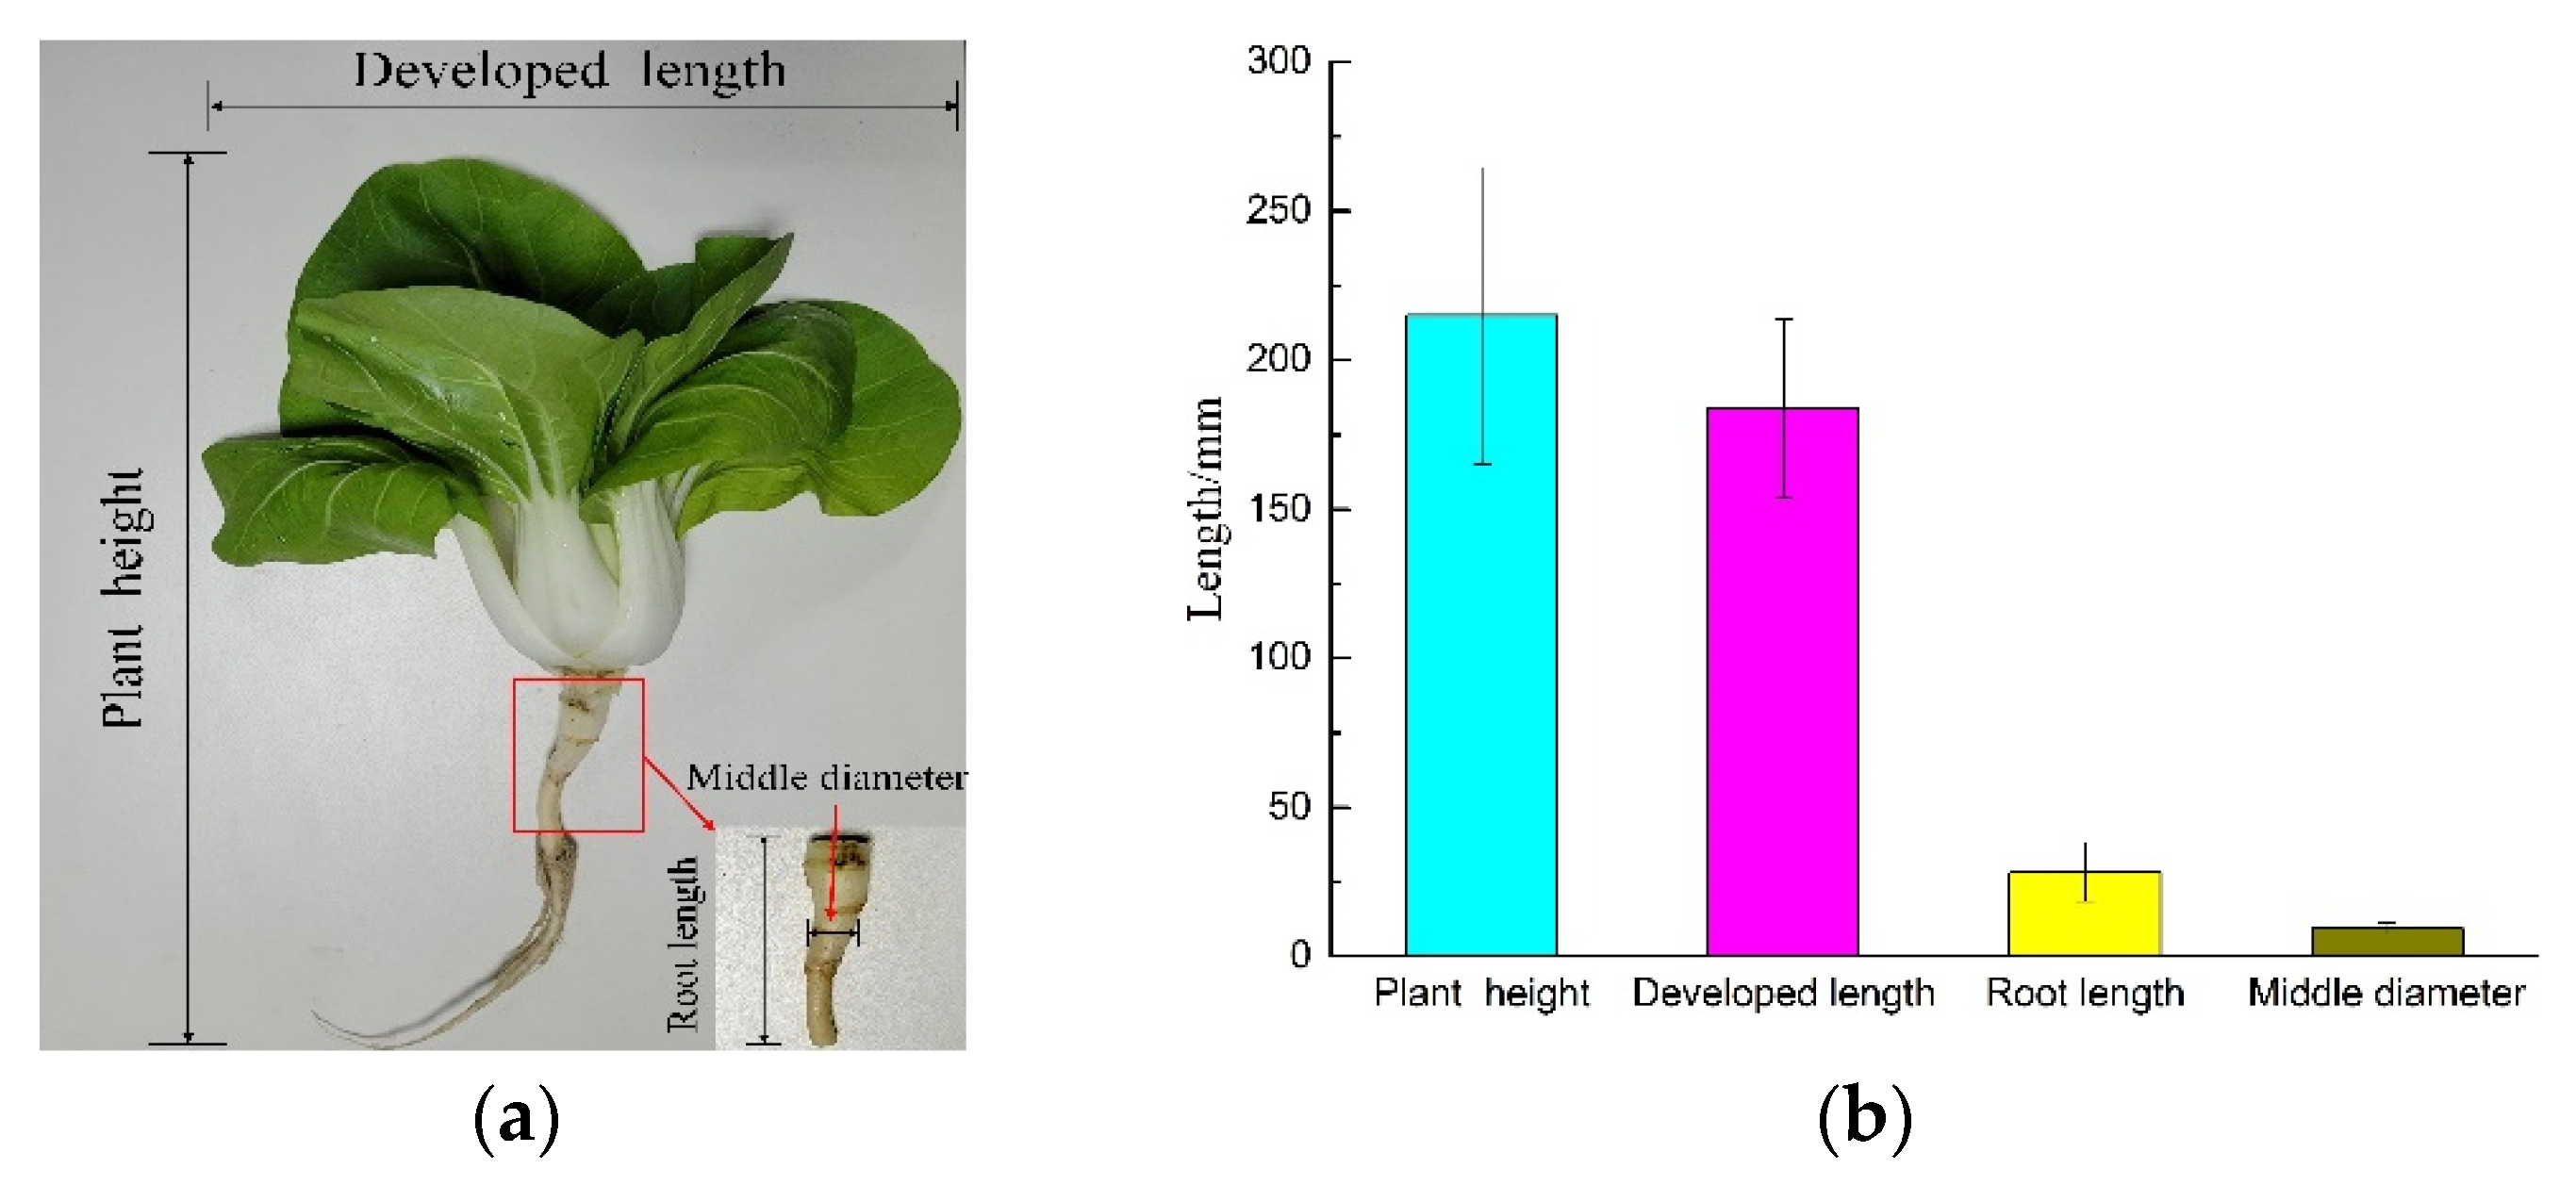
In the laboratory, the root moisture content of cabbage was 93.9% ± 0.8%, and the difference in moisture content was small, indicating that the root moisture content had little influence on the test results, so it was not necessary to consider. Before the cutting test, the geometric parameters of vegetables such as plant height and developed length were measured using a meter ruler and a vernier caliper, the leaves were manually removed, and the root was retained. The upper end of the root was the growth position of the bottommost vegetable leaf, and the lower end of the root was where the cabbage root made contact with the ground surface. The length of the retained root was the cuttable area for the cutting device. Length and diameter at the middle of the root were measured (Figure 1a). The measured geometric parameters of little cabbage are shown in Figure 1b.
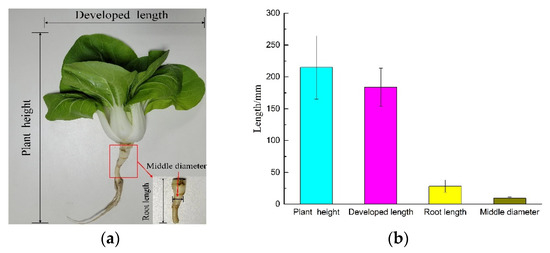
Figure 1.
Test sample preparation. (a) Test sample. (b) Size parameters of little cabbage.
2.2. Experiment Test Equipment
The test equipment was a texture analyzer (TMS-Pro, FTC, USA) that adopts a single-arm mainframe with range of 0~1000 N, a measurement accuracy of 0.01 N, the maximum test speed of 1000 mm/min, and a test distance of more than 300 mm.
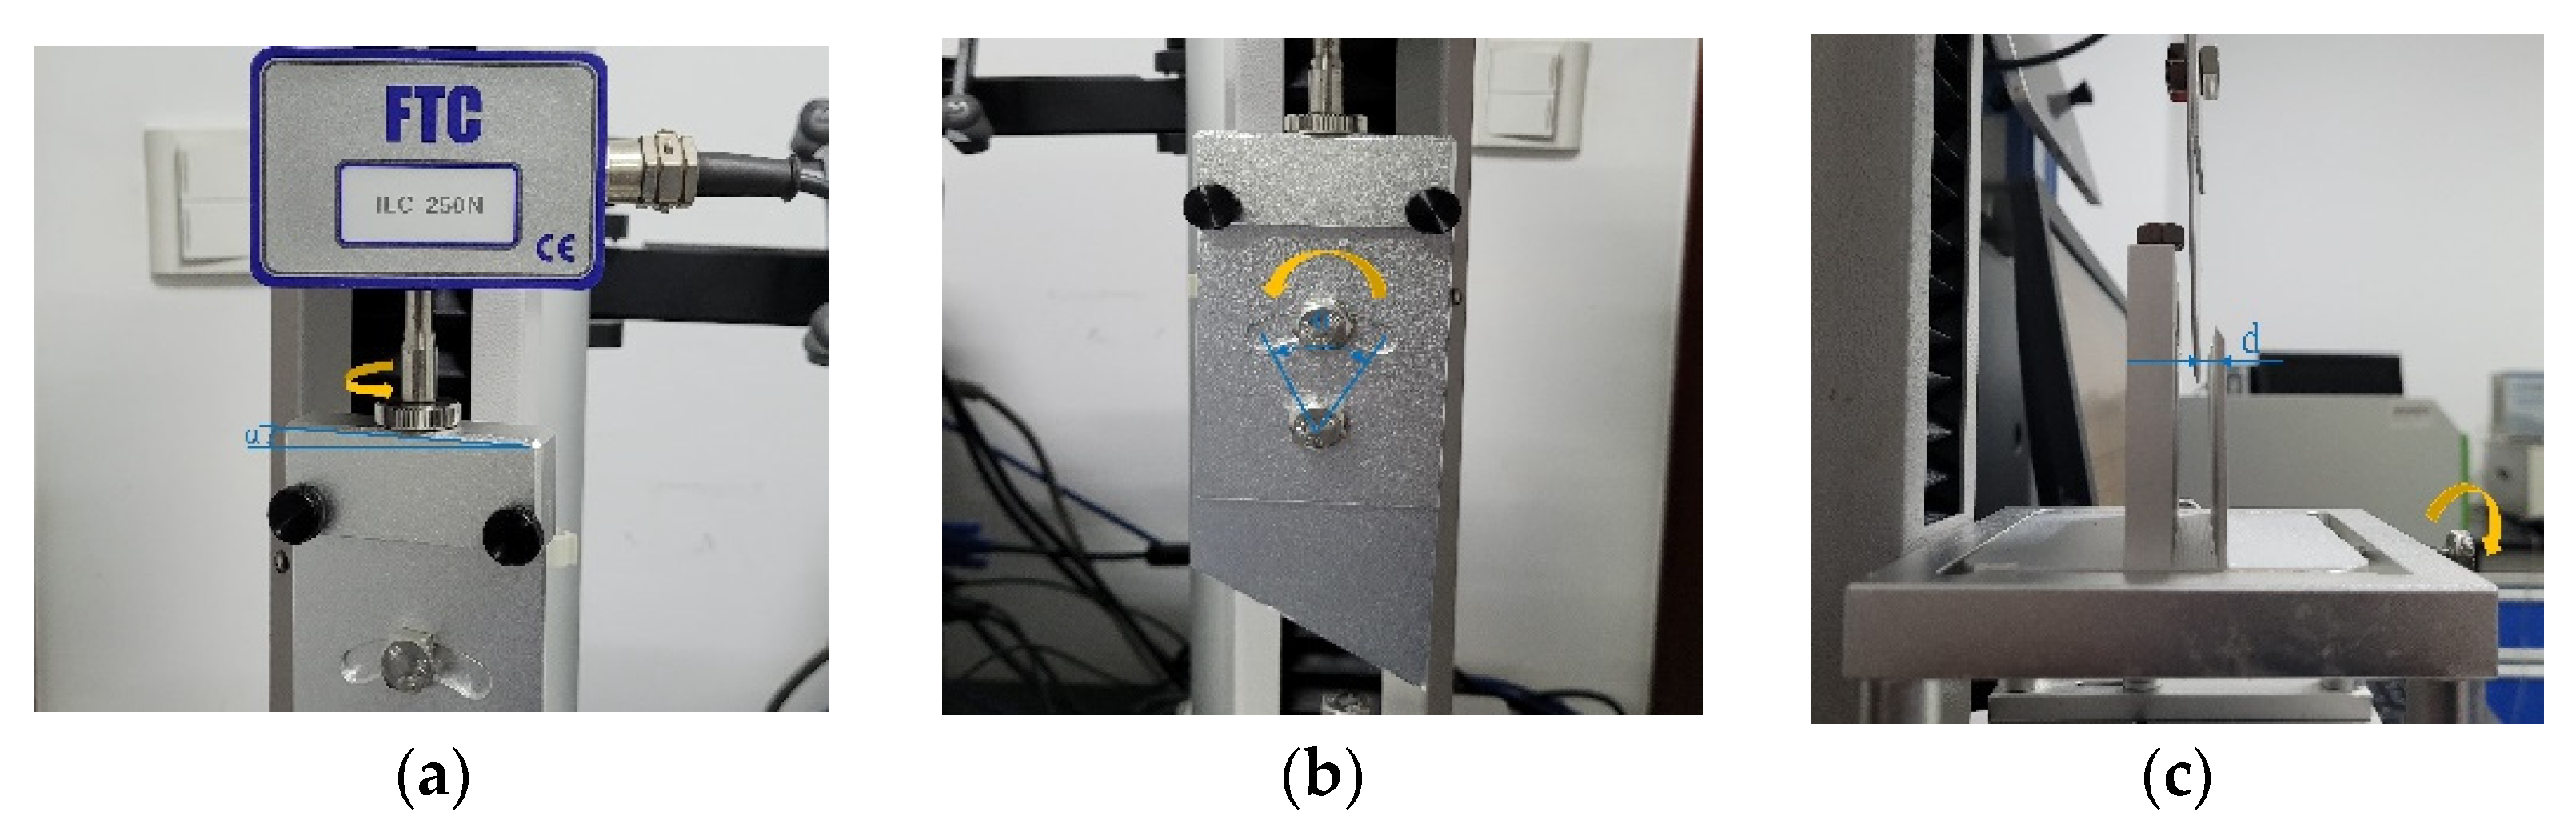
A set of the cutter and fixture was designed to match the work of the texture analyzer (Figure 2). The movable cutter mounting frame and the measuring arm of the texture analyzer were connected by bolts, and the inclination angle of the movable cutter could be adjusted by rotating the connecting bolt at the upper end of the movable cutter fastening plate, and the adjustment range was 0~12° (Figure 2a). The movable cutter was fixed on the mounting frame by adjusting bolts, and the inclination angle of the movable cutter was adjusted by changing the relative angle of the center line of the fastening bolt. The adjustable range was 0~60°, and the corresponding cutting angle was 0~60° (Figure 2b). The method of non-support and single-point clamping was adopted in the cutting device. By manually rotating the bolt to clamp the bottom end of the cabbage stem, and adjusting the gap between the movable cutter and the fixed cutter by changing the advancing distance of the bolt on the base of the texture analyzer bearing platform, the blade gap could be adjusted in the range of 0 to 3 mm (Figure 2c).
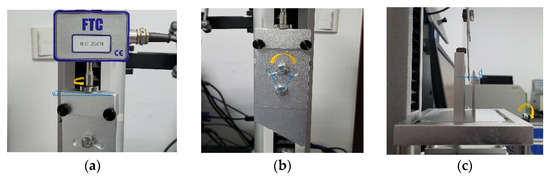
Figure 2.
Cutting and clamping device of the experiment test equipment. (a) Adjusting device of the oblique angle. (b) Adjusting device of the sliding angle. (c) Adjusting device of the cutting gap.
Bolts were used to fix the bottom of the cabbage root, and the oblique angle, sliding angle, and cutting gap of the movable cutter were adjusted by rotating the bolts during the test. The working mode and cutting speed of the texture analyzer were set as shear mode 500 mm/min, respectively. When working, the moving cutter moved down at a constant speed, and completed the cutting operation on the root at a constant speed of 500 mm/min at the moment of contact with the root. The sensor collected the cutting force during the cutting process, and the computer drew the relationship curve between the cutting force and displacement. The energy consumption was calculated during the cutting process [17,18].
2.3. Evaluation Index of Experiment
The cutter must move forward against the cutting resistance during the cutting process [19]. The cutting force is periodic and nonlinear, serving as an important factor in causing the fracture and slippage of the fiber layer in the root. Some studies have found that the cutting quality and cutter life are closely related to the cutting force, and a larger cutting force will cause problems such as splitting of the stem cutting cross-section and cutter wear [4]. Therefore, the cutting force was used as one of the test evaluation indicators in this study.
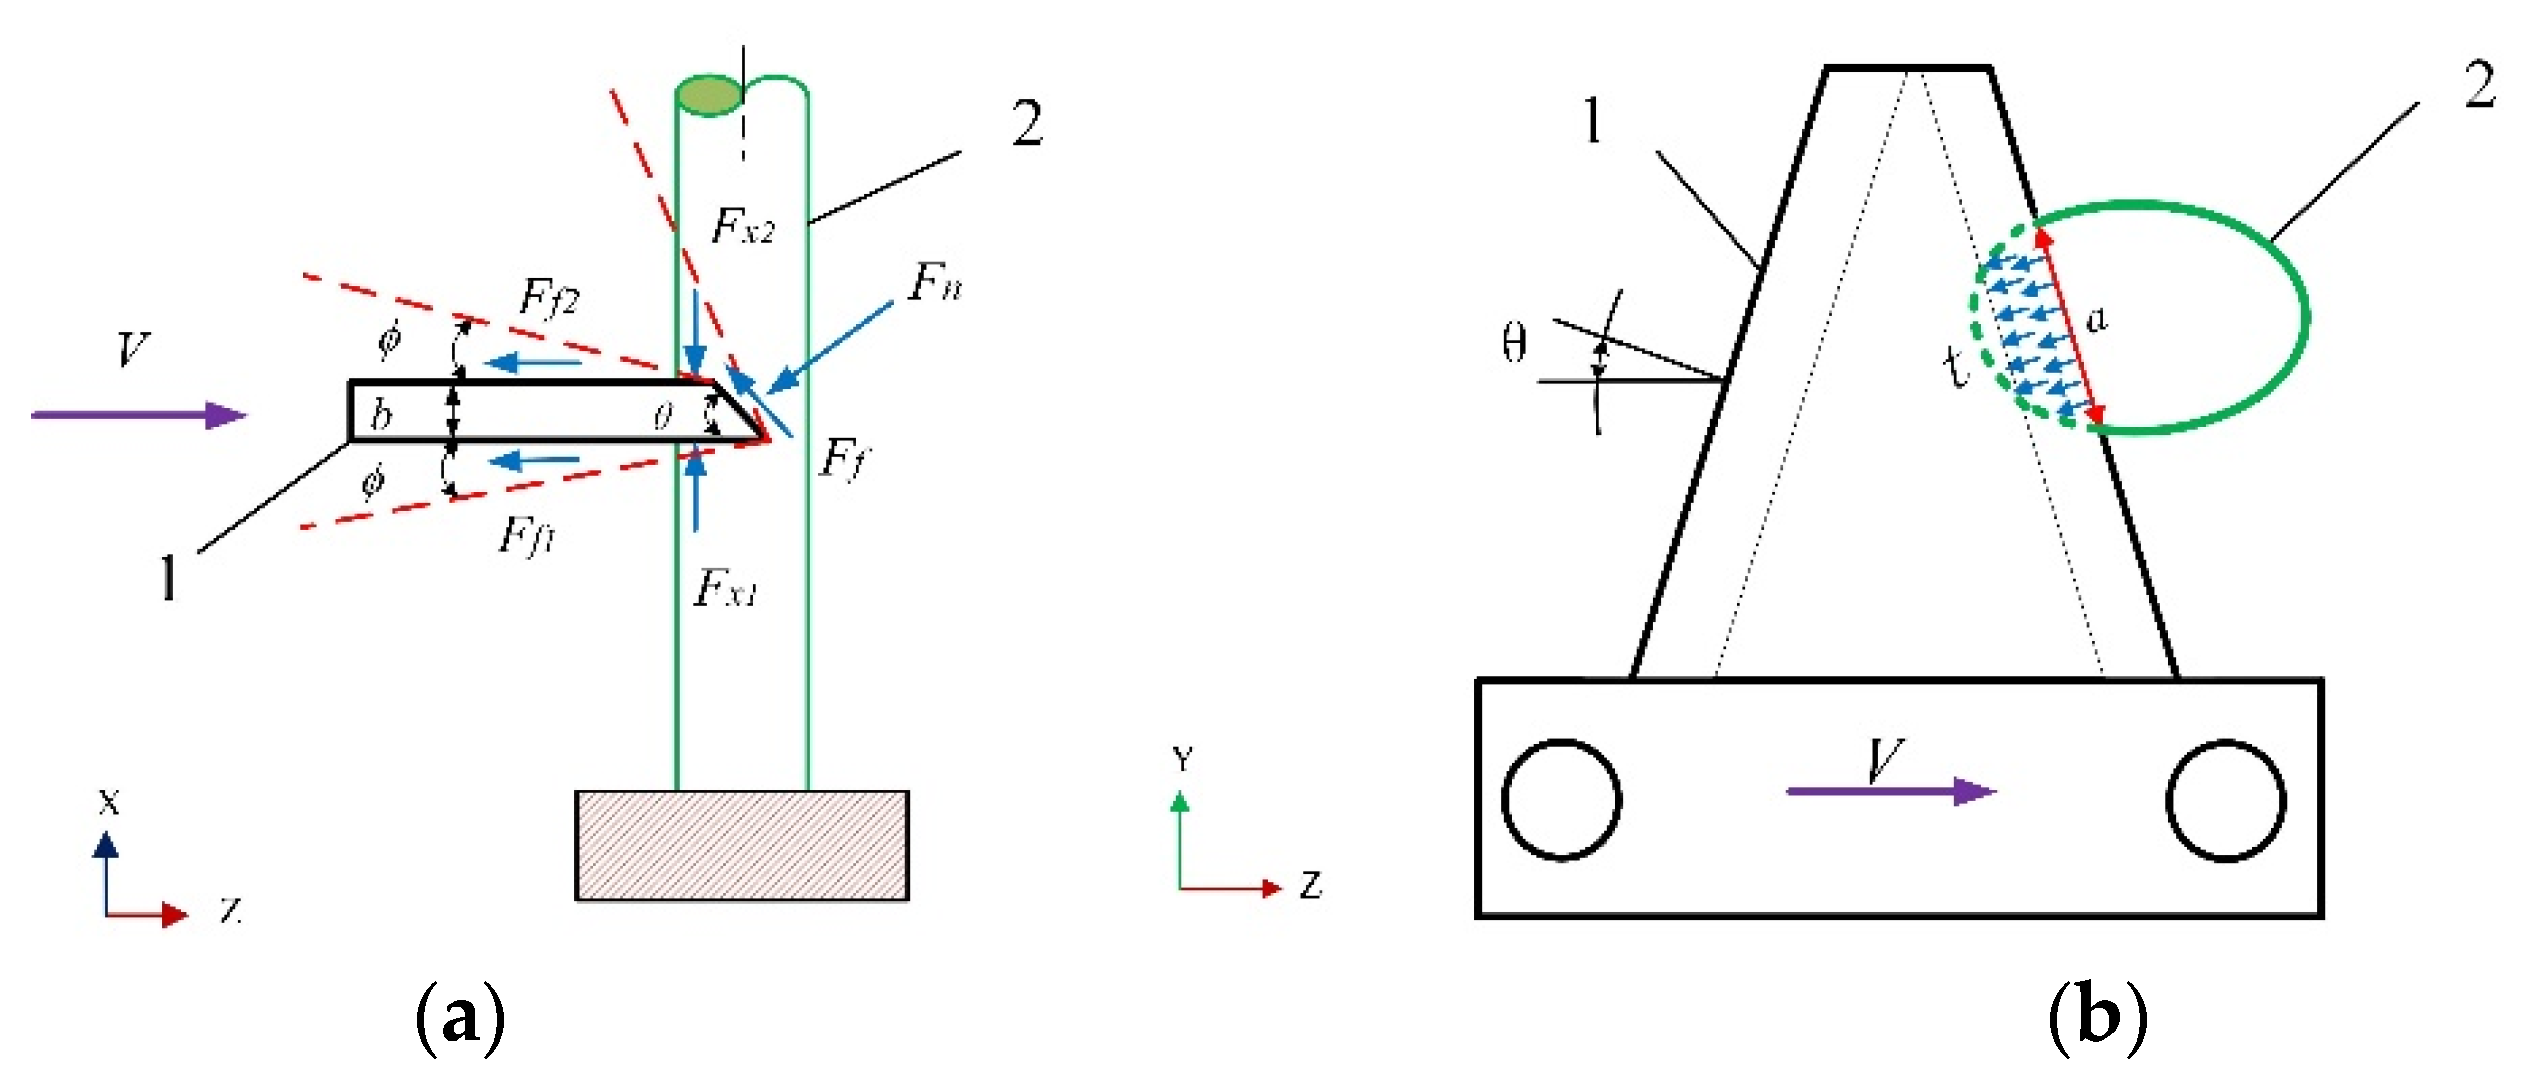
Suppose that the root was a spatially homogeneous body and the cutting surface was always in the same plane during the cutting process. The force analysis of the cutter is shown in Figure 3. The equilibrium condition from the vertical direction is computed as follows:
where is the positive pressure on the cutter wedge surface, N; and are the positive pressure on the lower and upper surfaces of the cutter, respectively, N;
is the friction angle, deg; and is the cutter wedge angle, deg. The cutting force received by the cutter in the Z direction is as follows:
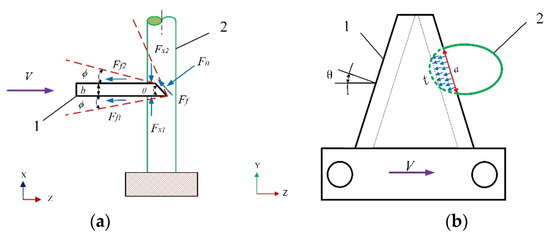
Figure 3.
Cutting force diagram of the cutting blade. (a) Cutting force diagram in XZ-plan; (b) Cutting force diagram in YZ-plan; 1. Cutting blade; 2. Stem.
According to Equations (2) and (3), can be obtained by Equation (4):
The cutting force is proportional to the wedge angle of the cutter during cutting. However, when the cutter slides, the actual wedge angle cutting into the root will become smaller. When the sliding angle is larger, the actual wedge angle is smaller, so the normal force of the cutter cutting into the root is smaller, and the cutting resistance is higher.
During the cutting process, Fx and are constantly changing with the increase in cutting depth. In order to avoid the influence of root diameter variation on the test results, the maximum cutting stress τ (maximum cutting force per unit area) was selected as the index. τ can be obtained by Equation (5):
where Fzmax is the maximum shear force in the Z direction, N and A is the cross-sectional area of the root cutting surface, mm2. The cross-sectional area of the root cutting surface was obtained by a leaf area scanner.
Cutting energy consumption is an important economic factor. Low-power cutting operations can improve economic efficiency and reduce the operation time of harvesting machinery as well as improve equipment production efficiency. Therefore, cutting power consumption was taken as another test index in this study. The calculation equation for cutting power consumption is as follows:
where Ws is the cutting power consumption, mJ; a is the initial cutting position, mm; b is the end position in cutting, mm; FZ is the instantaneous cutting force in cutting, N; and s is the cutting displacement, mm.
In order to avoid the influence of root diameter change on cutting power consumption, the specific cutting energy (cutting energy per unit area) was used as the test evaluation index in this study [9]. The specific cutting energy was calculated as follows:
where ES is specific cutting energy, mJ mm−2.
2.4. Influencing Factors of Experiment
The cutting stress and specific cutting energy are correlated to the interaction mechanism between the cutting blade and the root. During the cutting process, the root fiber layer is deformed and fractured under the action of the cutting blade. Therefore, the structural parameters and working methods of the cutting blade have important impacts on the test indicators [20].
The oblique angle, sliding cutting angle, and the cutting gap were considered as the factors affecting the maximum cutting stress and specific cutting energy, and the cutting test was carried out on this basis. The cutting surface is deviated from the root axis, and the cutting method in which the direction is perpendicular to the root axis is oblique cutting. The oblique cutting angle is the angle between the cutting surface and the root axis, which is a factor in the cutting test. The oblique cutting angle can be adjusted by rotating the connecting bolt on the movable cutter mounting frame [8]. When the absolute movement direction of the cutter is at a certain angle to the cutting edge, the cutting method is sliding cutting. The sliding angle is the angle between the absolute speed direction and the normal speed direction of the cutter movement, and can be adjusted by changing the relative position of the fastening bolts between the moving cutter and the fixed plate [11,21]. The cutting gap refers to the distance between the movable cutter and the fixed cutter, and is also considered as one of the experimental factors. The cutting spacing can be changed by adjusting the bolts on the base of the host platform of the texture analyzer [13].
Therefore, the oblique angle, sliding cutting angle, and the cutting gap were considered as the factors affecting the maximum cutting stress and specific cutting energy, and the cutting test was carried out on this basis.
2.5. Design of Single Factor and RSM Test
In order to study the influence of various factors on the mechanical properties of little cabbage root, the maximum cutting stress τ and the specific cutting energy Es were taken as the evaluation indexes, and the cutting bevel (α), sliding cutting angle (θ), and cutter gap (d) were designed as factors in three groups of single-factor tests. In the single factor test of the oblique angle, the sliding angle was set to 30° and the cutting gap was 1.5 mm. In the actual cutting operation, considering the issue that the root cannot be cut completely due to the excessive oblique angle, the selection range of the oblique angle was 0~12°. In the single factor test of the sliding cutting angle, the oblique angle was set to 6° and the cutter clearance was 1.5 mm. Although the cutting force decreases with the increase in the sliding cutting angle, too large a sliding cutting angle can easily cause problems such as unstable root clamping. Therefore, the sliding angle was set within the range of 0° to 60°. In the single factor test of the cutting gap cutter, the oblique angle and sliding angle were set to 6° and 30°, respectively. The cutting gap adjustment range was 0~3 mm. The cutting speed was set to 500 mm/min, and each set of tests consisted of six levels, and each level experiment was repeated five times. The factors and levels of the single factor test are shown in Table 1.

Table 1.
Factors and levels of single factor test.
In order to optimize the cutting parameters of little cabbage root, the optimal combination of the minimum cutting force and cutting energy was obtained to study the significance order of the influence of each factor on the test indexes by using the Design-Expert 10.0.3 software and based on key factors such as the single-factor test results and cutting performance. By taking the cutting bevel angle (α), sliding cutting angle (θ), and cutting gap (d) as test factors, the appropriate test factor level range was selected, and taking the maximum cutting stress τ and specific cutting energy Es as the evaluation indicators, response surface experiments were conducted using the central composite design method. The factor coding table of the factors in the response surface test is shown in Table 2. The test was conducted in 20 groups, five times in each group, and took the average of the test results.
Table 2.
Factors and levels of the RSM test.
3. Results
3.1. Cutting Force Displacement Curve
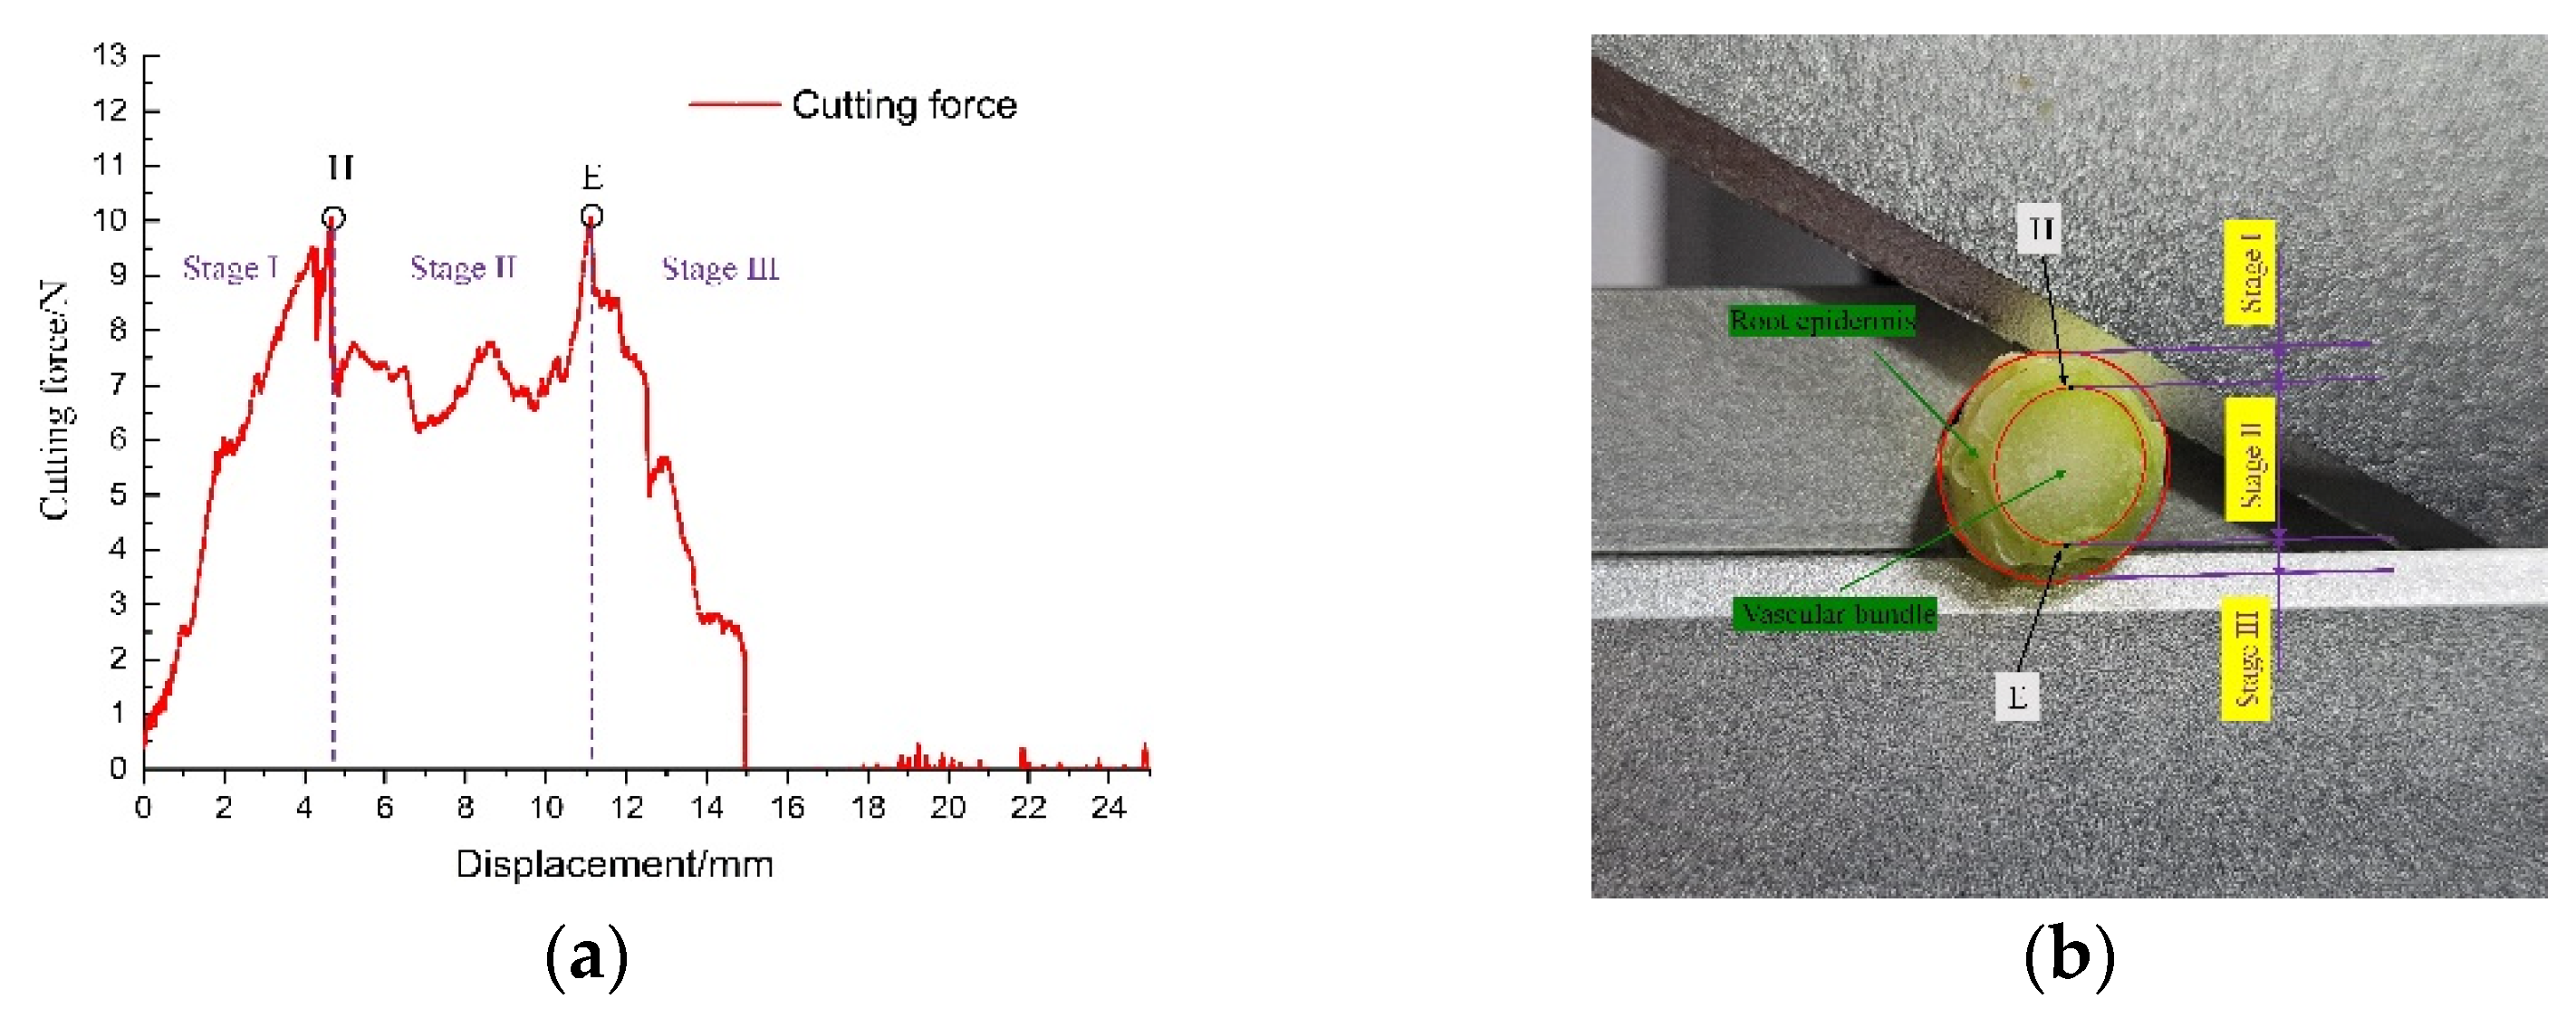
The cutting force–displacement curve of little cabbage root is shown in Figure 4. The cutting process was divided into three stages, namely, the near-linear rising stage (stage I), the oscillation fluctuation stage (stage II), and the near-linear descending stage (stage III), respectively. The increase in the cutting force from the starting point to the peak value H belongs to the near-linear rising stage, which is stage I. At this time, the cutting knife pressed and cut into the root epidermis. Since the fibrous tissues of the root epidermis are hard and tightly arranged, the cutting force increased rapidly and reached the peak value at the H point. When the root epidermis was cut, the cutting blade cut into the vascular bundle tissues. Since the vascular bundle had different mechanical properties with softer texture than the epidermis, the cutting force curve showed an oscillating trend until the second cutting force peak point E, forming stage II. When the cutter passed through the E point, the root epidermis was cut. At this time, the cutting force curve decreased rapidly and nearly linearly until the cutting root was 0, forming stage III. The cutting force-displacement curve is a double-peak curve, which is consistent with the research of Cui et al. [14], indicating that the change in cutting force on wooden stems is consistent to some extent.

Figure 4.
Cutting force–displacement curve. (a) Cutting force displacement curve. (b) Organizational chart of the root.
3.2. Results of Signal Factor Test
The single factor test verified the rationality of the selected factors and the range of values. After analysis, the influence law of the three factors of the oblique angle α, the sliding angle θ, and the cutting gap d on the maximum cutting stress τ and the specific cutting energy Es was concluded.
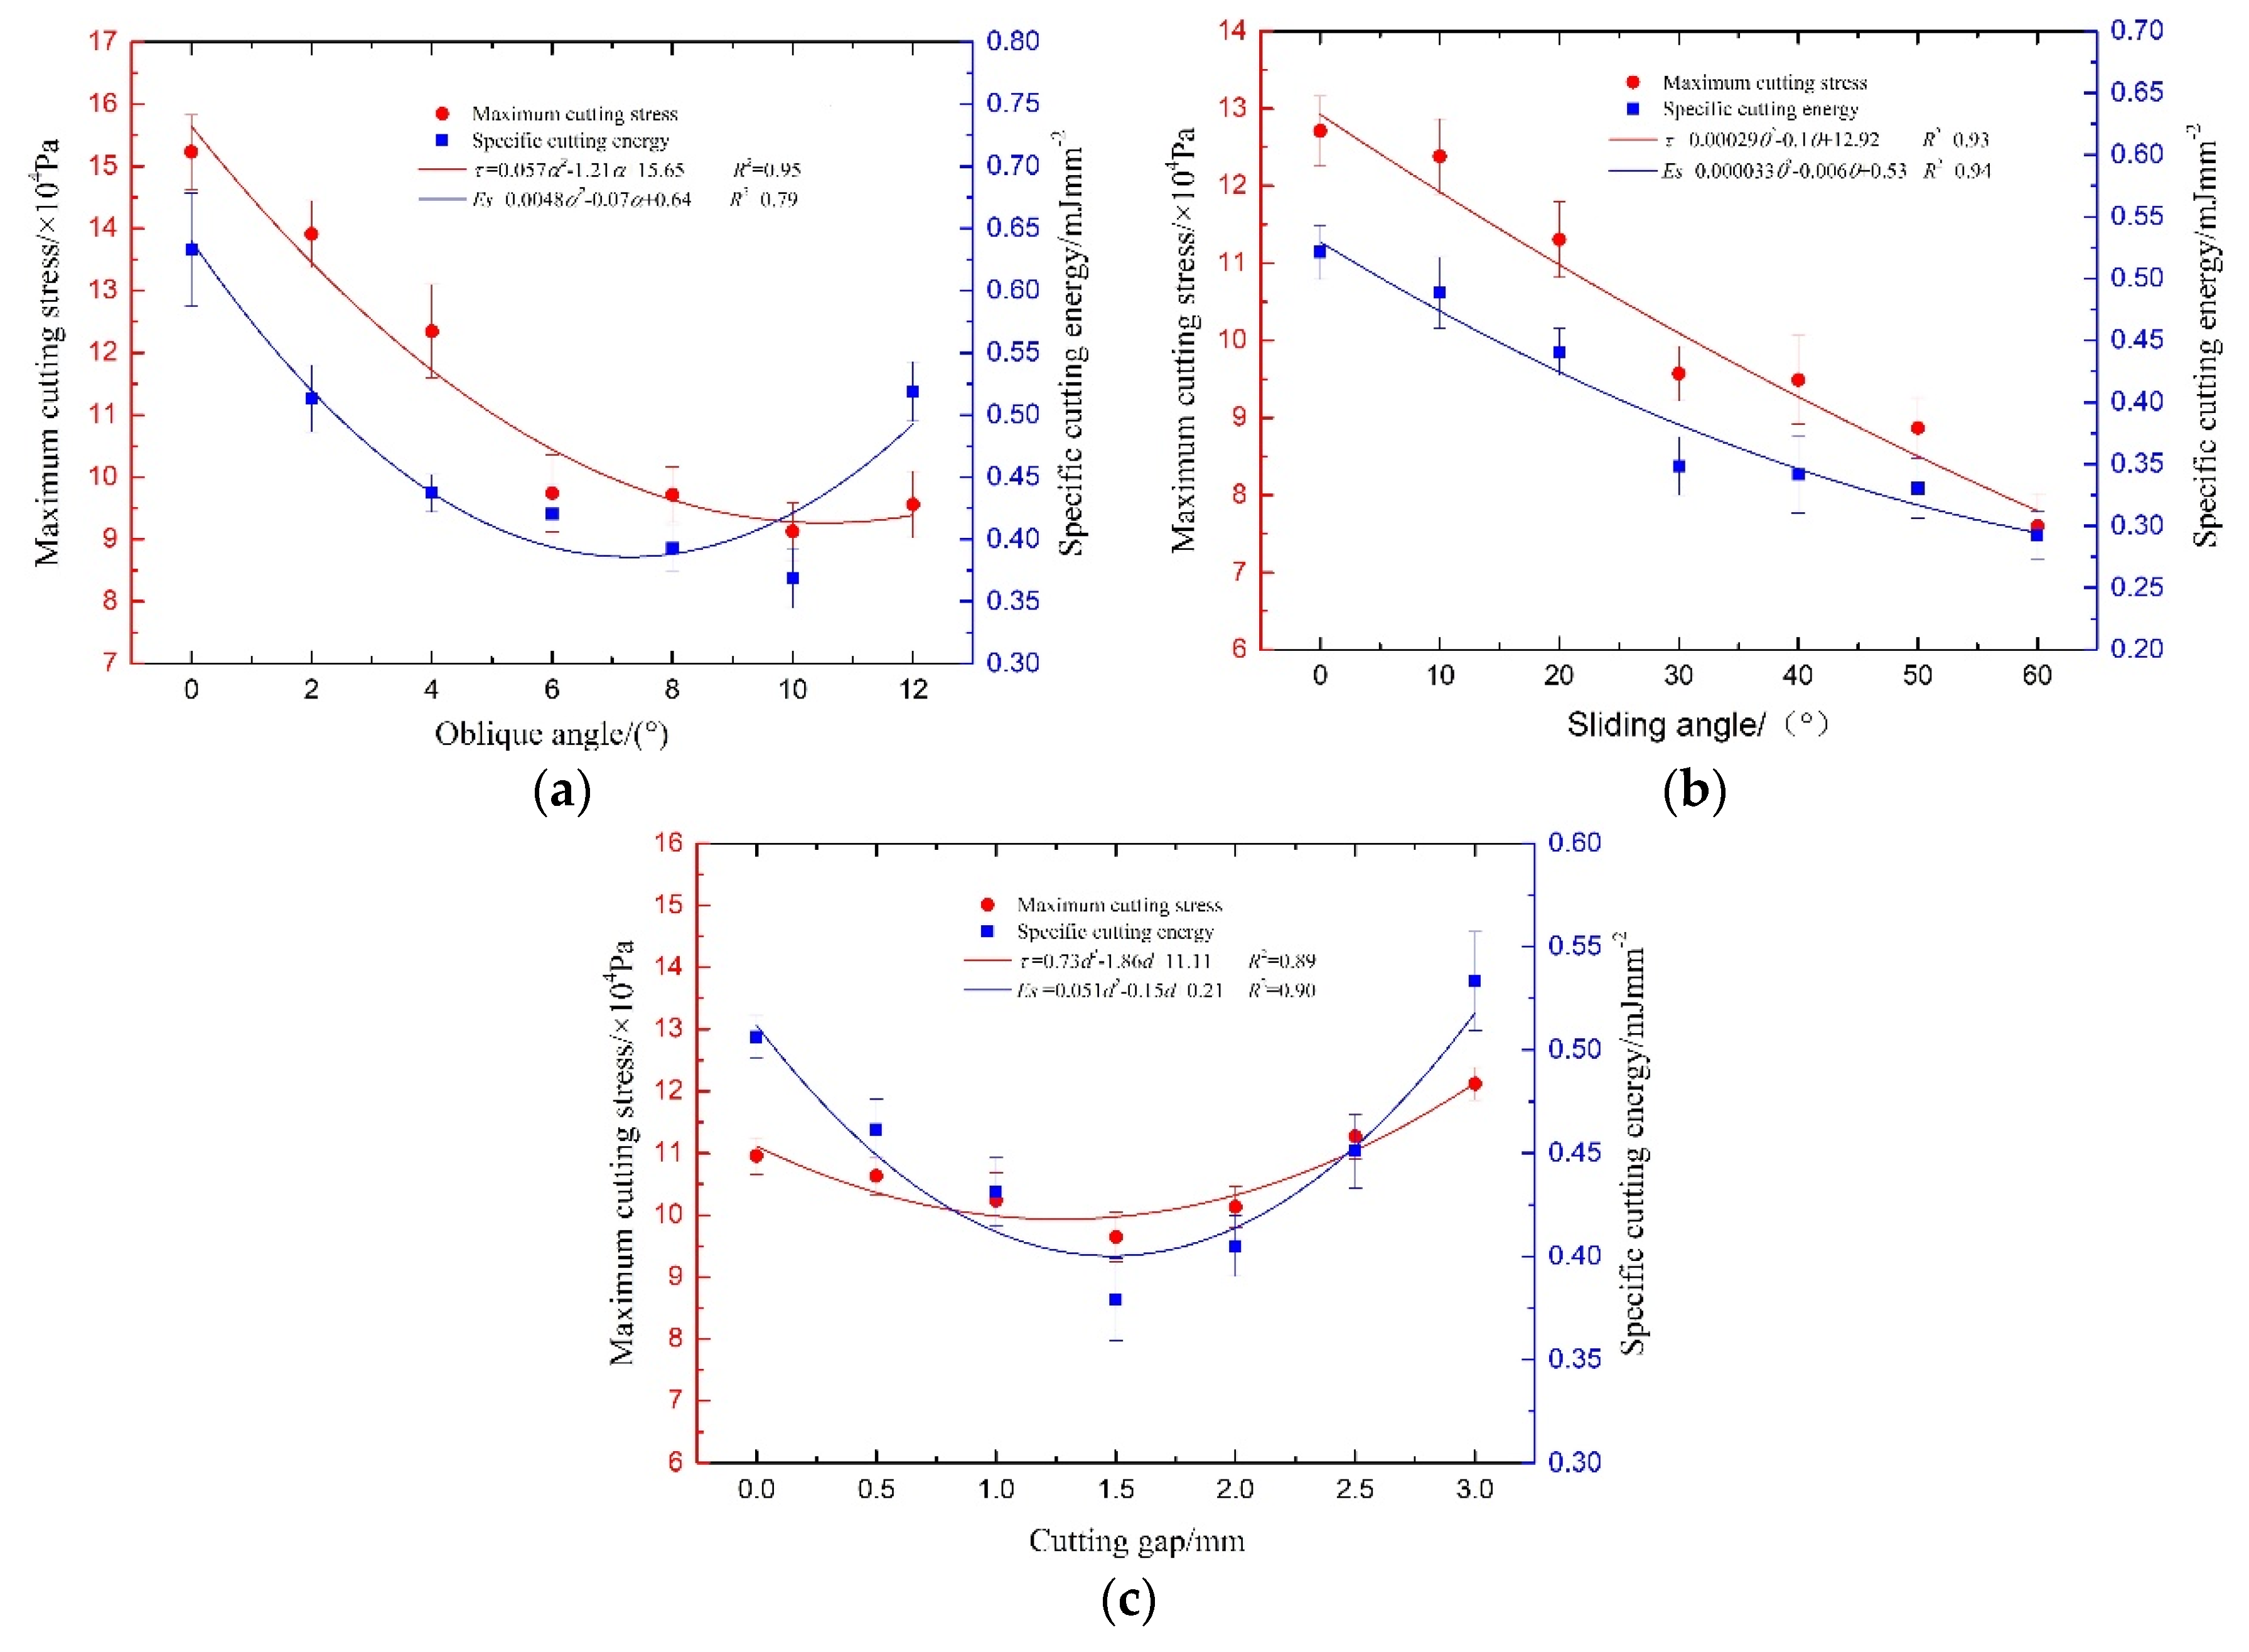
The results of the regression analysis of maximum cutting stress, specific cutting energy, and cutting bevel are shown in Figure 5a, and the fitting model accuracy R2 was 0.95 and 0.79, respectively. The maximum cutting stress and specific cutting energy of the 10° oblique angle were reduced by 41% and 42% compared with the 0° oblique angle, respectively. The changing trends of the maximum cutting stress and the specific cutting energy were consistent, and the oblique angle had a certain influence on the cutting stress and cutting energy consumption, which was consistent with the research of Zhang et al. [15]. With the increase in the cutting bevel angle, the two indexes both decreased before an increase, and reached the minimum value when the cutting bevel angle was 10°. As shown in Figure 5b, the sliding angle had a significant effect on the cutting stress and cutting power consumption, and the changing trends of the maximum cutting stress and the specific cutting energy were consistent. With the increase in the sliding angle, the cutting stress and cutting power consumption gradually decreased, and reached the lowest value when the sliding angle was 60°. The relationship between the test index and the cutting gap is shown in Figure 5c. With the increase in the cutting gap, the maximum cutting stress and the specific cutting energy showed a trend of decrease before an increase. When the cutting gap was 1~2 mm, the maximum cutting stress reached the lowest value. Likewise, the effect of cutting gap on cutting resistance and cutting power consumption should not be ignored.
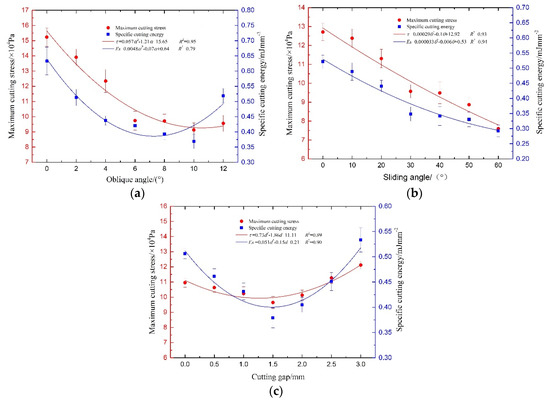
Figure 5.
Effect of different factors on maximum cutting stress and specific cutting energy. (a) Effect of different oblique angles on maximum cutting stress and specific cutting energy. (b)Effect of different sliding angles on maximum cutting stress and specific cutting energy. (c) Effect of different cutting gaps on maximum cutting stress and specific cutting energy.
3.3. Results of Response Surface Method Test
The response surface cutting test was carried out using Design-Expert 10.0.3 software and the central composite design scheme on the basis of the single factor test. The test was carried out in 20 groups, and each group of tests was carried out five times, and the average values of the test were selected as the evaluation indexes. The test results are shown in Table 3.
Table 3.
Design and results of the RSM test.
Multivariate regression fitting analysis was performed on the test results, and a quadratic polynomial model of the independent variables such as the maximum cutting stress and specific cutting energy on the oblique angle, sliding angle, and cutting gap was established. After removing the insignificant items, quadratic polynomial models were obtained, as shown in Equations (8) and (9), respectively.
τ = 8.22−0.77α − 0.68θ + 0.43d + 0.45θd + 0.59 α2 + 0.30θ2 + 0.85d2
Es = 0.32 − 0.030α − 0.024θ + 0.060 d − 0.040αd + 0.035θ2 + 0.064d2
Through the analysis of variance (ANOVA) in Table 4, it can be seen that the p value of the maximum cutting stress τ model was less than 0.01, indicating that the regression equation model was significant. The lack-of-fit term of the regression equation was 0.095, which was not significant, indicating that the model had high fitting accuracy. The coefficient of determination R2 was 93.87%, indicating that the regression equation of the maximum cutting stress could explain more than 90% of the evaluation indicators, and the model had high reliability, so the model can be used to study the optimal parameter combination of the cutter. The p value reflects the influence degree of each factor on the model. The p values of the three factors of oblique angle α, sliding angle θ, and cutting gap d were 0.0001, 0.0004, and 0.0078, respectively, all less than 0.01, indicating that the three factors had a very significant influence. The influence of each factor on the maximum cutting stress was the oblique angle, the sliding angle, and the cutting gap in descending order [22,23].
Table 4.
Variance analysis results of the RSM test.
The results of variance analysis of cutting energy were analyzed. It can be seen that the p value of the model was 0.0001, indicating that the model was significant, and the lack-of-fit term of the regression equation was greater than 0.05, and the lack-of-fit term was insignificant. The coefficient of determination of the model was 92.68%, indicating that the regression equation could explain 92.68% of the evaluation indicators, and the model was relatively reliable. The significance of each factor was analyzed according to the p value, where the influence of each factor on the cutting energy was significant (p < 0.05), and the cutting gap had the greatest influence, followed by the oblique angle and the sliding angle [24].
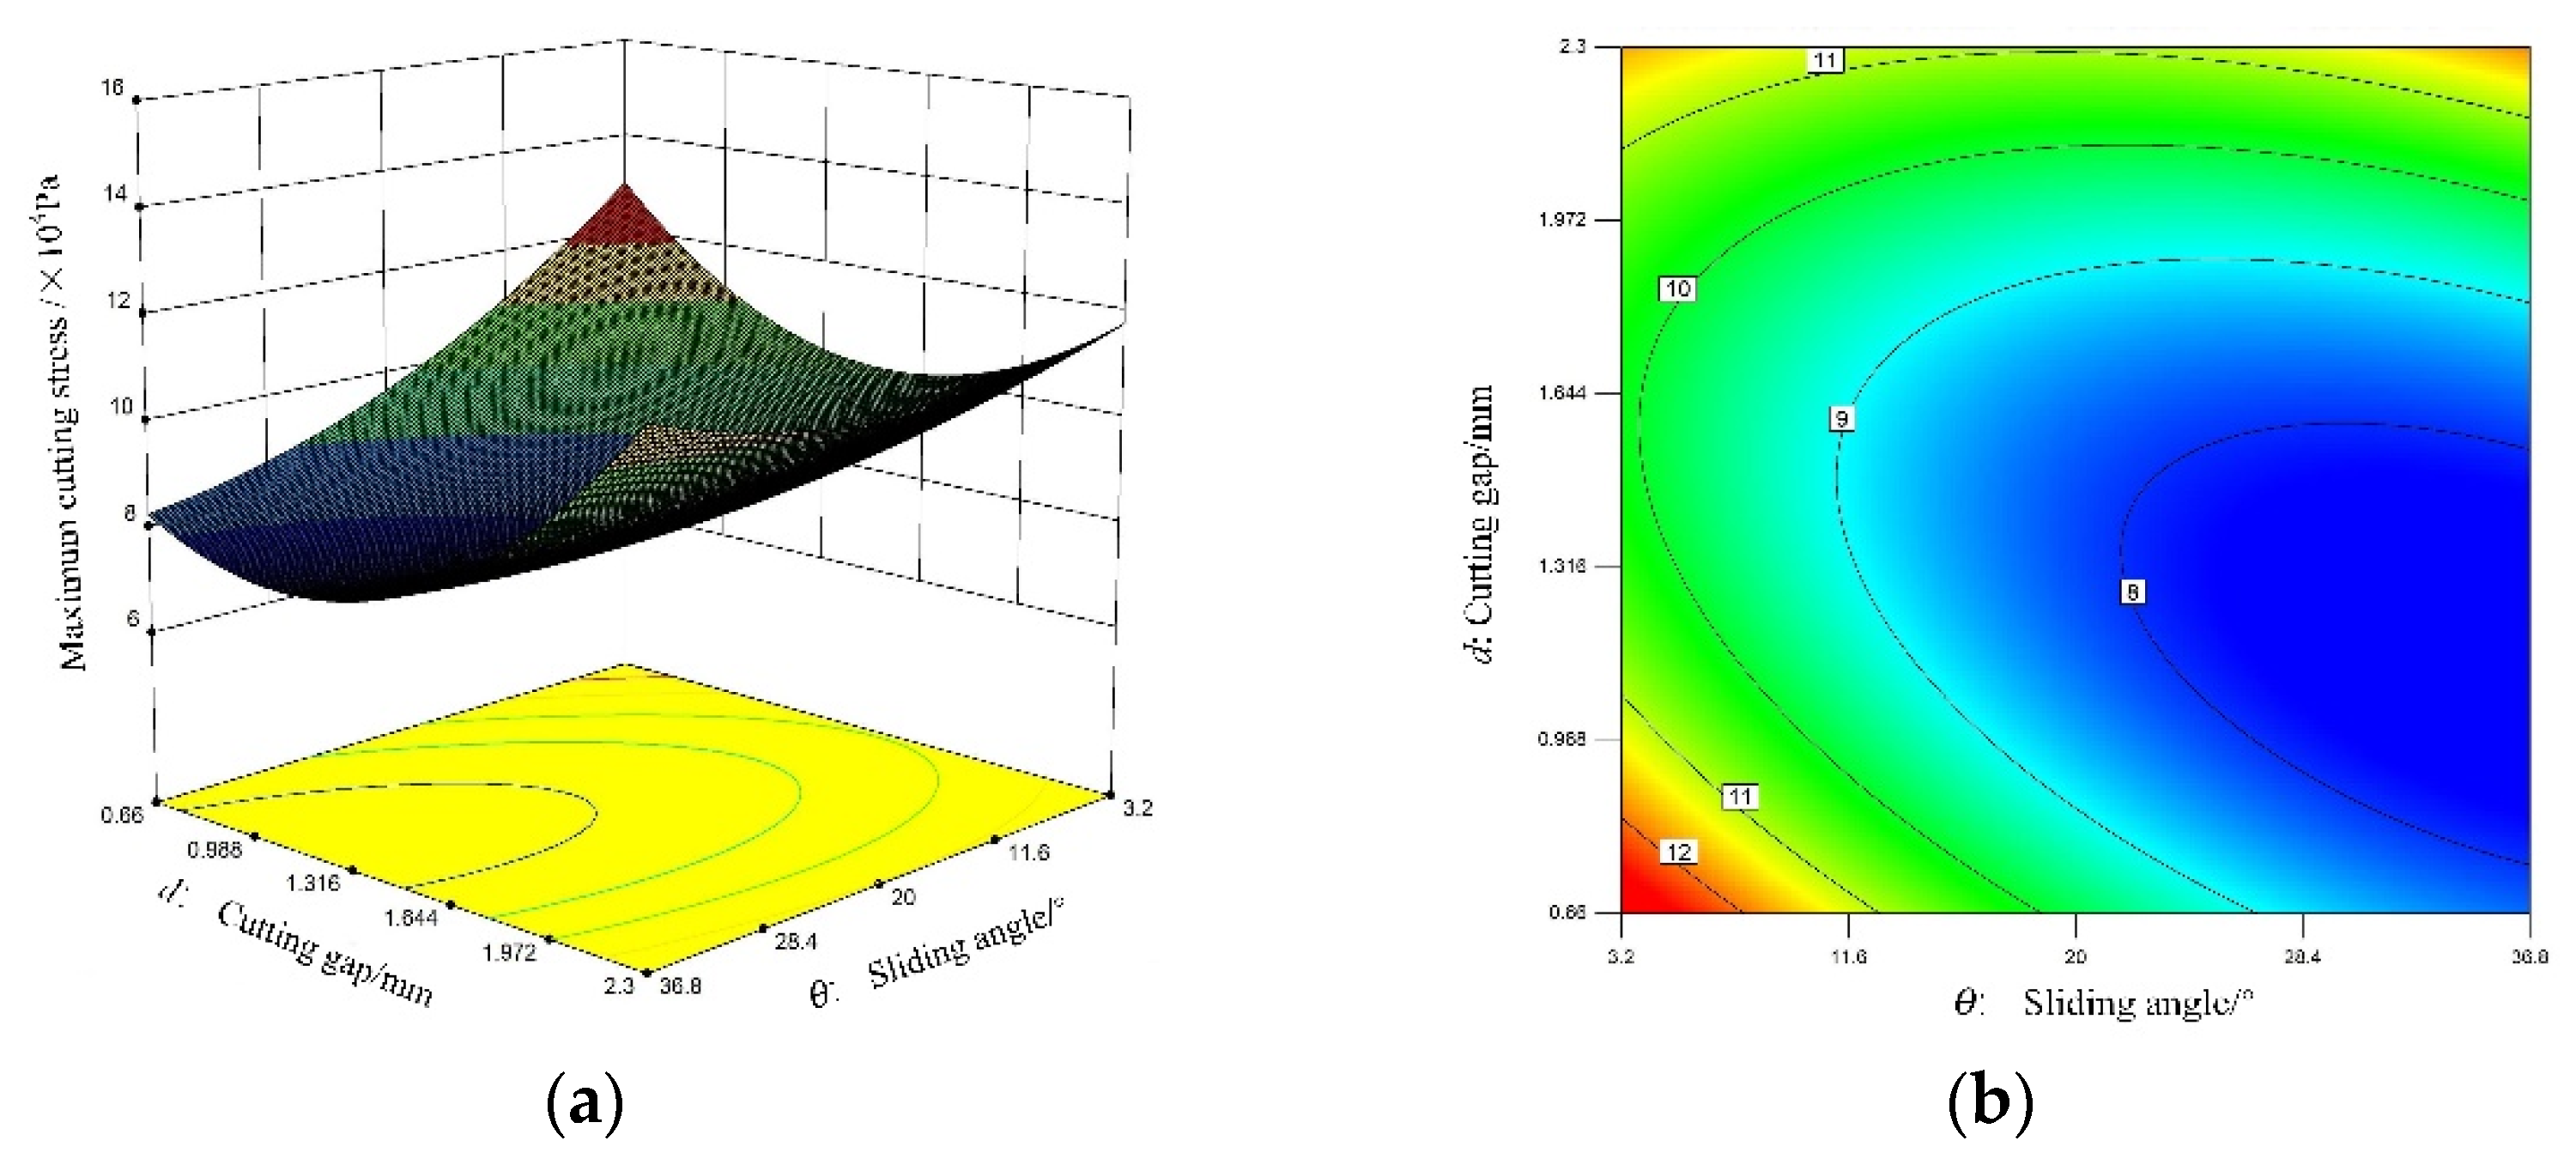
The influence of the interaction among the factors on the evaluation index were discussed. Design-Expert 10.0.3 software was used to analyze the influence of the interaction between the sliding cutting angle and the cutting gap on the maximum cutting stress. When the oblique angle was 8°, the response surface map and contour map are shown in Figure 6. It can be seen from Figure 6a that the interaction between the sliding angle and the cutting gap had a significant effect on the maximum cutting stress. The maximum cutting stress decreased with the increase in the sliding angle because the wedge angle when the cutting edge cut into the root was reduced during slip cutting, and the cutting was less labor-intensive. The maximum cutting stress first decreased and then increased with the increase in the cutting gap, and reached the minimum value at about 1.3 mm because the ratio of the root shear zone and the fracture zone were consistent at this time. It can be seen from the following contour diagram that the change rate of the maximum cutting stress along the sliding angle was faster than that of the cutting gap, which means that the sliding angle had a more significant effect on the cutting stress than the cutting gap, which was consistent with the results of the variance analysis in Table 4 [25,26,27].

Figure 6.
Effects of the sliding cutting angle and cutting gap on maximum cutting stress. (a) Response surface graph. (b) Contour map.
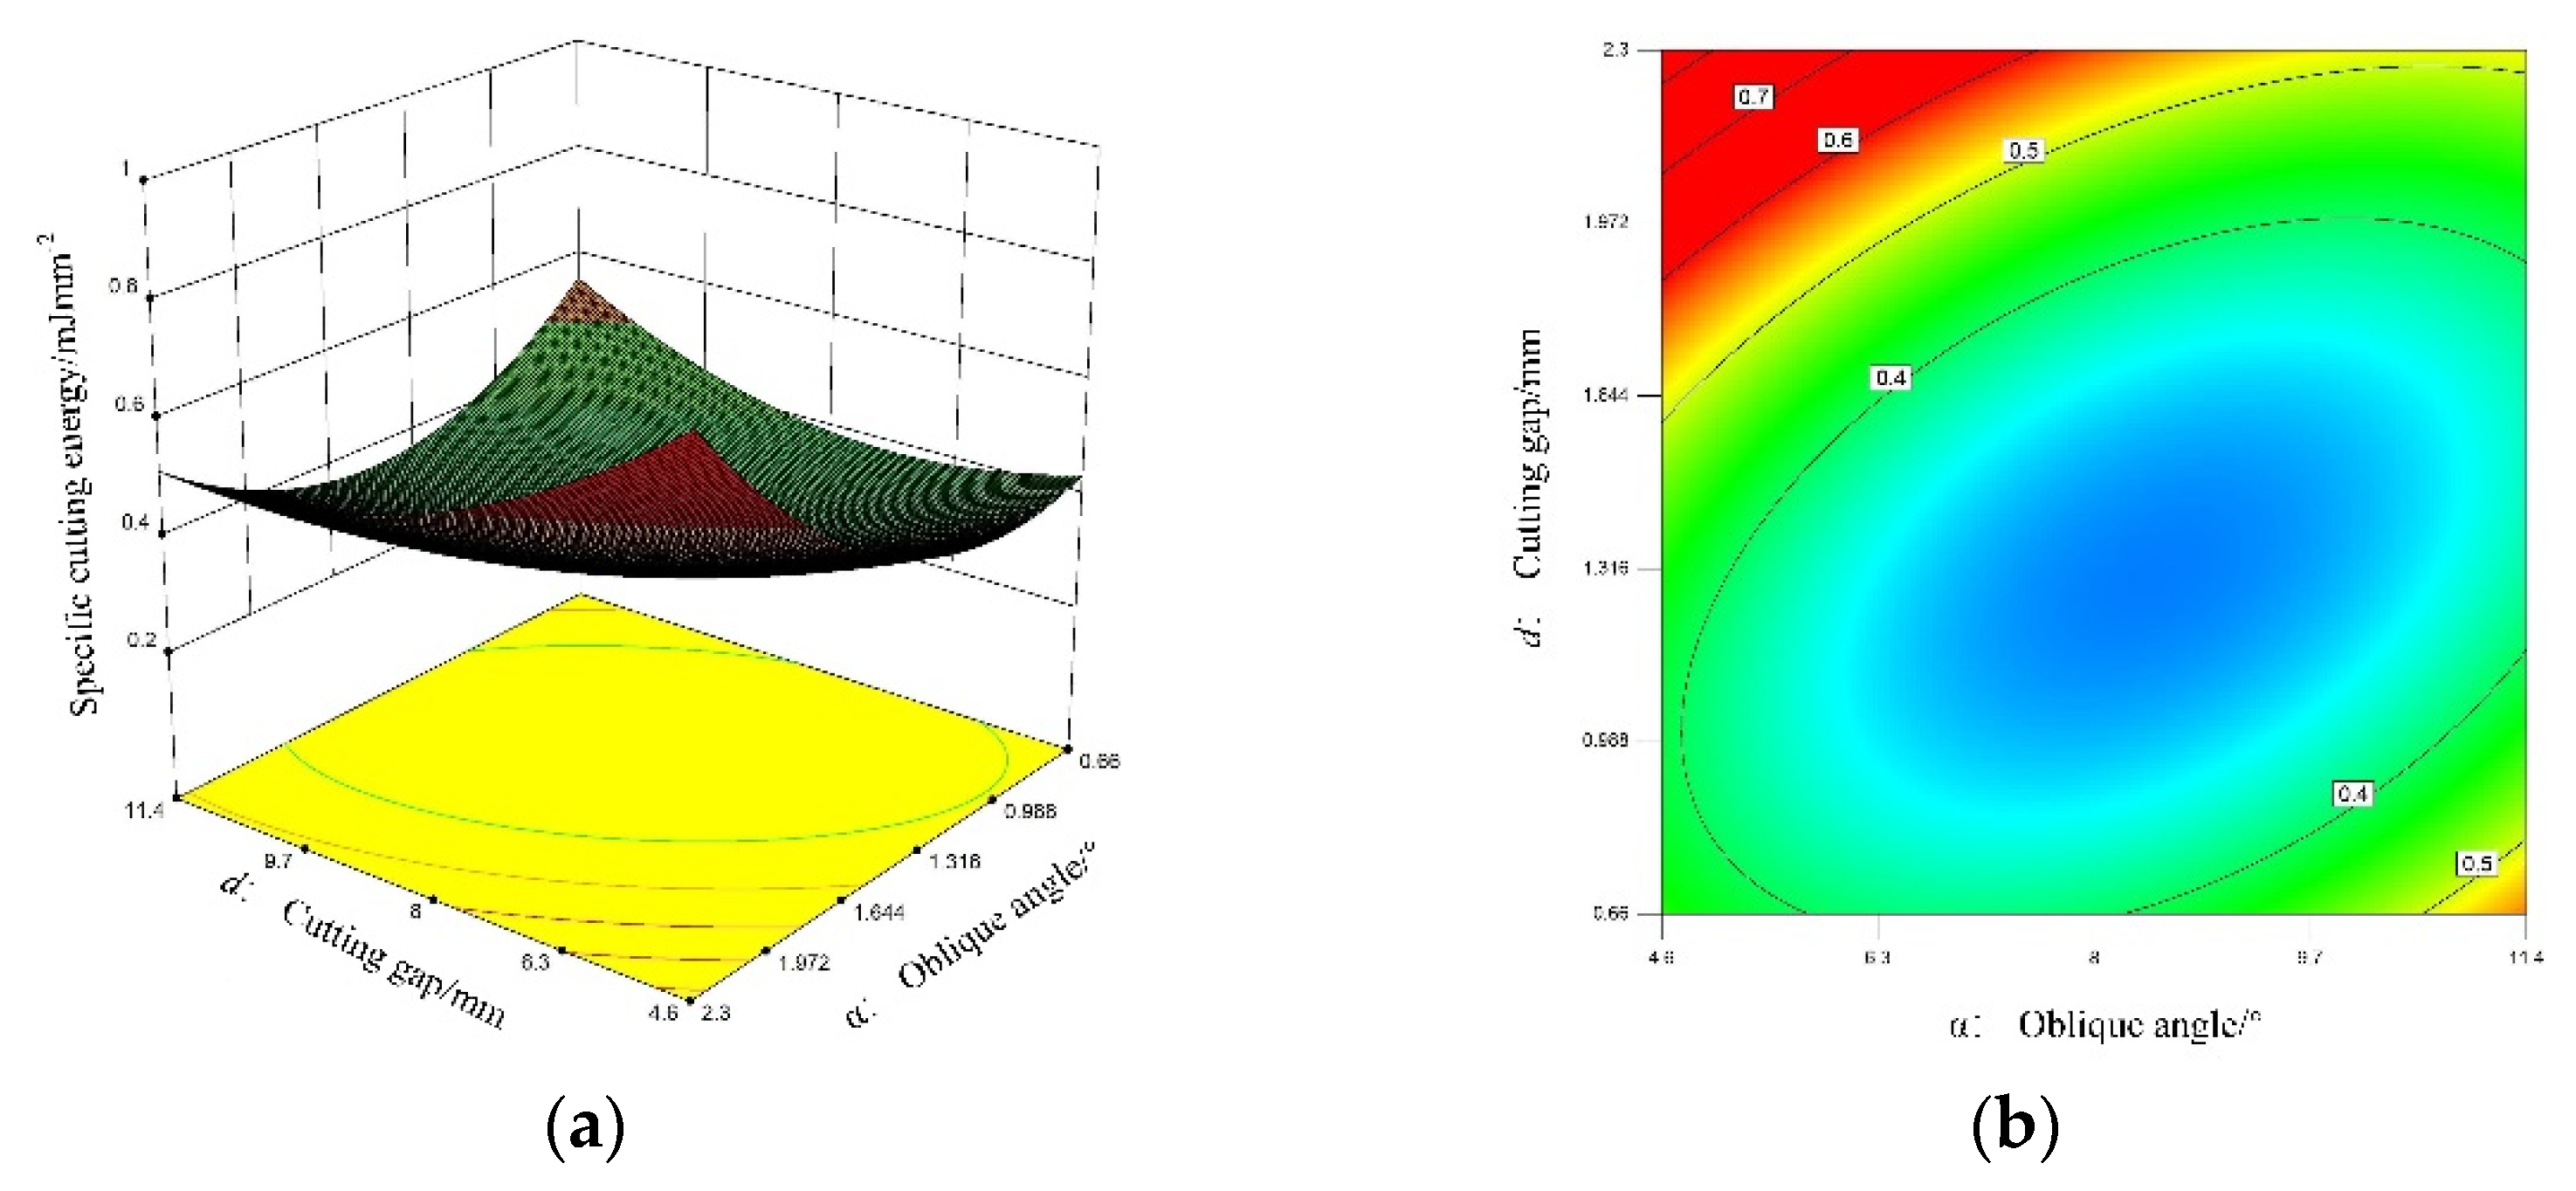
It can be seen from Figure 7a that the interaction between the oblique angle and the cutting gap had a very significant effect on the cutting energy. The specific cutting energy first decreased and then increased with the increase in the oblique angle. When the oblique angle of cutting was 0~9°, as the oblique angle increased, the root fibers were more prone to being damaged by bevel cutting, and the cutting power consumption decreased at this time. However, when the oblique angle was greater than 9°, the cross-section of the root cutting increased, which led to an increase in the power consumption during the cutting process, and the specific cutting energy of the root cutting increased. Similarly, the specific cutting energy decreased first and then increased with the increase in the cutting gap, and reached the minimum value at about 1.3 mm. The reason was that the ratio of the root shear zone and the fracture zone were the same at this time, and the cutting resistance and cutting energy consumption were the minimum.

Figure 7.
Effects of the sliding cutting angle and cutting gap on specific cutting energy. (a) Response surface graph. (b) Contour map.
It can be seen from Figure 7b that the change rate of specific cutting energy along the cutting gap was faster than that of the cutting bevel direction, which meant that the cutting gap had a more significant impact on the cutting energy consumption than the cutting bevel, which was consistent with the results of the variance analysis.
3.4. Regression Model Optimization
In order to obtain the minimum cutting stress and cutting power consumption, the corresponding index function was established, and the optimization model was calculated by:
The model was optimized using the optimization function in the Design-Expert software. Optimal cutting combination parameters of the cabbage root cutting system were obtained as follows: oblique angle was 9.1°, sliding angle was 30°, and cutting gap was 1.3 mm [28]. The predicted value of the maximum cutting stress and the specific cutting energy were 7.43 × 10⁴ Pa and 0.28 mJ mm−2 at this time. Compared with the maximum cutting stress of 12.58 × 10⁴ Pa and the maximum specific cutting energy of 0.6 mJ mm−2 in the RSM test, the reductions were 40.9% and 53.3%, respectively, showing an obvious optimization effect.
3.5. Validation Test
Validation test was conducted to check the accuracy of the model. The cutting system was set to have an oblique angle of 9.1°, a sliding angle of 30°, and a cutting gap of 1.3 mm. The cutting test was carried out under the condition of a cutting speed of 500 mm/min. A total of five groups of tests were carried out, and the average values were obtained. The test results are shown in Table 5 The test value of the maximum cutting stress of the root was 6.92 × 10⁴ Pa, and the experimental value of the specific cutting energy was 0.25 mJ mm−2. The relative errors with the prediction value of the regression model were 6.9% and 10.8%, respectively, indicating that the model could accurately predict the cutting stress and cutting power consumption of little cabbage.
Table 5.
Results of the verification test.
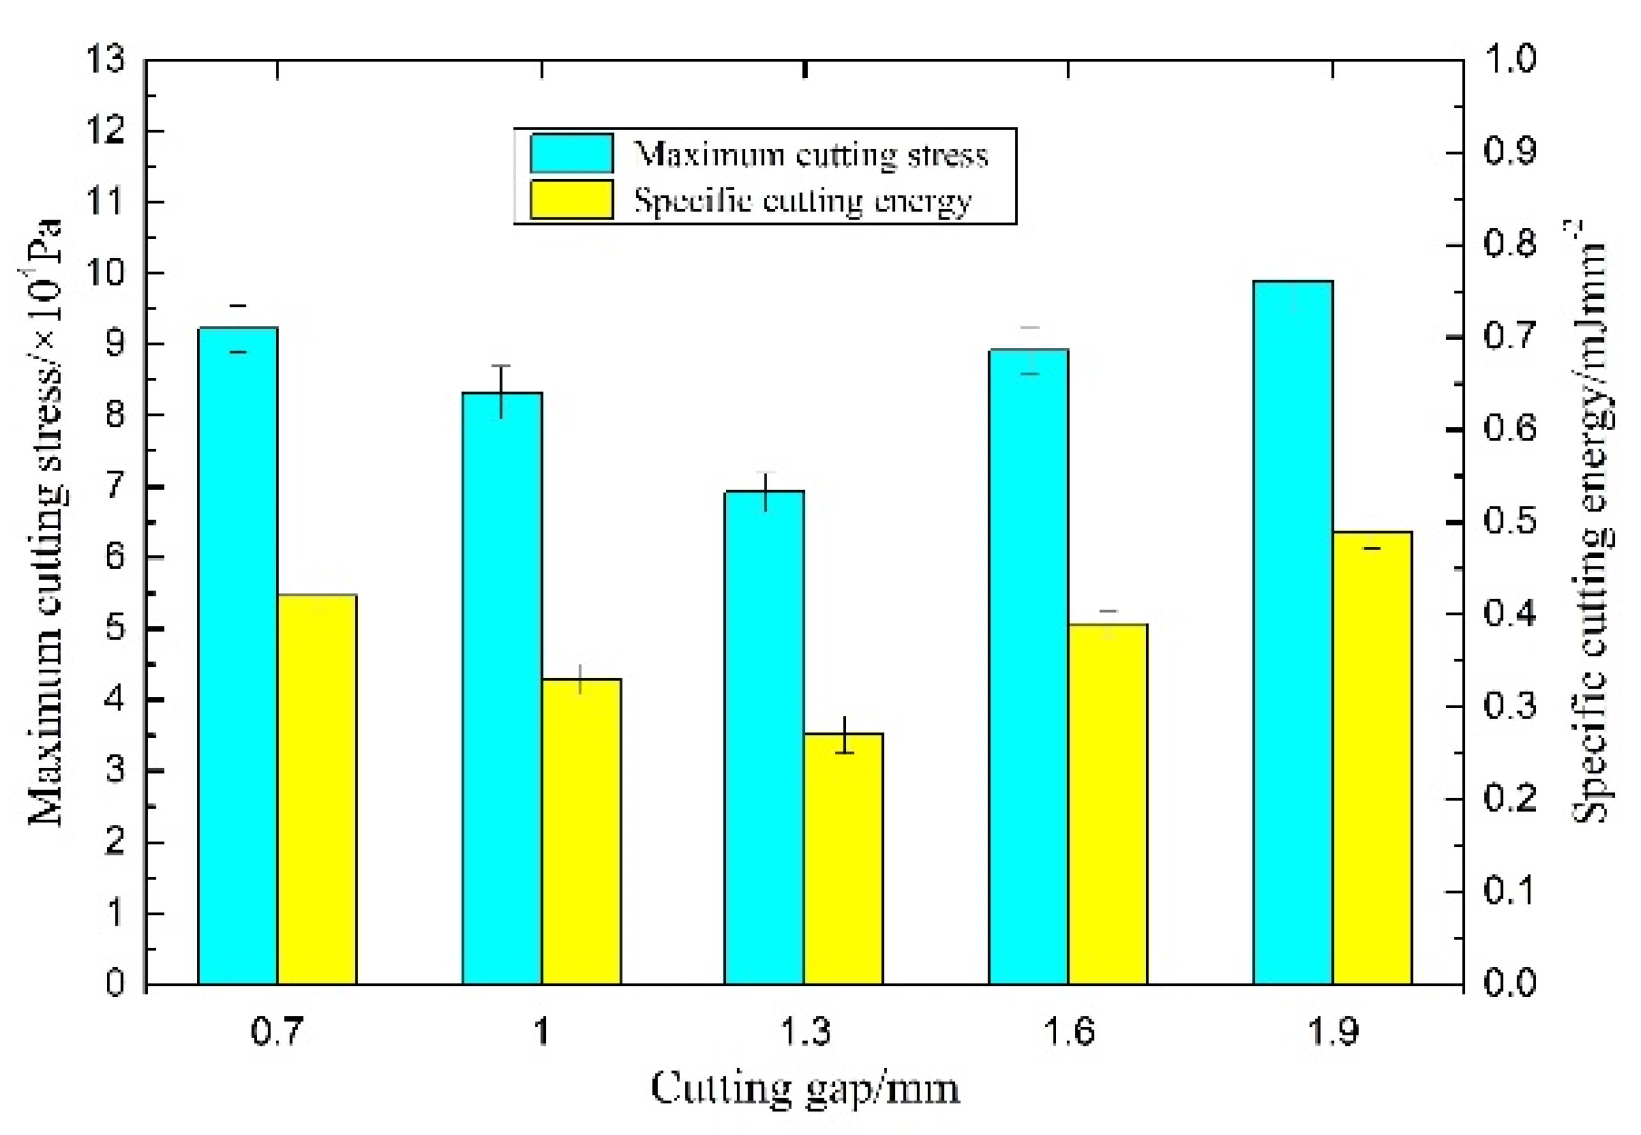
The optimal combination of the working parameters was further verified. The oblique angle and sliding angle of the three groups of tests were uniformly set to 9.1° and 30°, and the cutting tests were carried out under the conditions that the cutting gaps were 0.7 mm, 1 mm, 1.3 mm, 1.6 mm, and 1.9 mm, respectively. The test results are shown in Figure 8. When the cutting gap was increased from 0.7 mm to 1.3 mm, both the maximum cutting stress and the specific cutting energy decreased. When the cutting gap was increased from 1.3 mm to 1.9 mm, the maximum cutting stress and specific cutting energy significantly increased again. The cutting evaluation indexes under the best working parameter combination were all at the lowest value, indicating that the cutting force and cutting power consumption could be reduced by using the optimal working parameter combination, and the cutting parameters were optimized. Using this combination of cutting parameters to improve the cutting performance of the root of little cabbage can provide a reference for the design of low-power consumption and high-efficiency harvesting machinery for little cabbage.
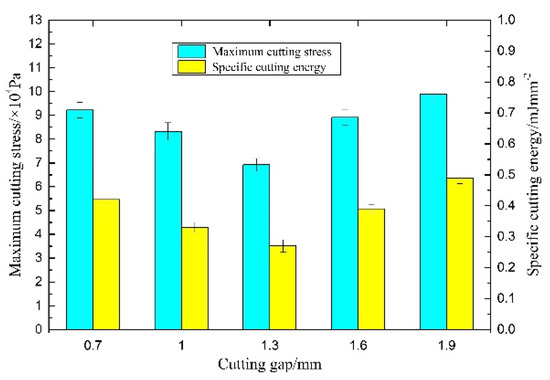
Figure 8.
Results of the comparation test.
4. Discussion
In the present study, we investigated the functional relevance between the working parameters of the cutting blade and working performance using a texture analyzer and found that cutting force and cutting energy were greatly influenced by oblique angle, sliding angle, and cutting gap of the cutting blade. Furthermore, the optimal combination of cutting parameters were obtained by the single factor test and RSM test, and the model for the optimal parameter combination was demonstrated by the validation experiments.
The maximum cutting stress and specific cutting energy were the lowest when the oblique angle was 10° (Figure 5a). Because the cutter needed to overcome the tensile strength from the root fibers and the cohesion and friction between fibers, since the tensile strength of the fiber in the axial direction was smaller than that in the radial direction. The fibrous tissues were torn, so the cutting stress and cutting energy decreased with the increase in the cutting bevel. However, as the oblique angle continued to increase, the cutting cross-sectional area on the root increased rapidly, resulting in an increase in cutting power consumption. This is consistent with the theory of Cui et al. [14] and indicates that the cutting mechanical properties of little cabbage root and lettuce stem are similar, to a certain extent. The greater the cutting slip, the smaller the required cutting amount during cutting. The phenomenon can be explained from the following two aspects: (1) Because the larger the sliding cutting angle, the smaller the actual wedge angle of the cutting edge cutting into the stem, and the smaller the normal resistance of the cutter cutting into the material; and (2) The greater the slippage of the cutter along the tangential direction, the stronger the cutting action of the cutter on the stem fibers, so the required cutting stress and cutting energy consumption are smaller. The results are supported by the previously mentioned theory of sliding cutting research and the derivation of Equation (4) [11]. When the cutting gap was less than 1 mm, the proportional value of the root shear area was greater than the fracture area, showing a pure shear state, and the cutting resistance value was larger at this time (Figure 5c). When the cutting gap was greater than 2 mm, the ratio of the fracture area was greater than the ratio of the shear area, showing an increase in cutting resistance [15,28]. In order to ensure the accurate determination of the model optimization, compared with the traditional method, this work carried out multiple sets of experiments to complete the verification work. The final results found that the maximum cutting stress and specific cutting energy under the optimal parameter combination were significantly reduced by more than 40%, which was helpful for the optimal design of the little cabbage cutting device.
However, it is worth noting that the cutting speed should also be regarded as one of the factors affecting the cutting index. Obviously, the texture analyzer cannot simulate the real cutting speed of the harvesting of little cabbage and needs to be operated with the help of a special test platform. However, compared with the texture analyzer, the vibration and other problems of the high-speed cutting test bench were more prominent. The measurement results were obviously not as accurate as the former. The above questions are also worth thinking about.
5. Conclusions
In this paper, we used a combination method of the physical testing and analysis of variance to measure and analyze the cutting mechanical properties of Chinese cabbage roots. The results showed that the single factor test results showed that the maximum cutting stress and specific cutting energy had a trend of a decrease first and then increase with the increase in the oblique angle, decreasing with the sliding angle, and decreasing first and then increasing with the cutting gap. In addition, the order of influence on the maximum cutting stress was the oblique angle, sliding angle, and cutting gap. The cutting gap had the greatest impact on cutting energy. The optimal cutting combination parameters of the cabbage root cutting system were the oblique angle of 9.1°, the sliding angle of 30°, and the cutting gap of 1.3 mm. At this time, the maximum cutting stress was 0, the specific cutting energy was 6.92 × 10⁴ Pa, and the specific cutting energy test value was 0.25 mJ mm−2.
Author Contributions
Z.Y. led the project; W.W. operated the tests, wrote the manuscript, and processed data; S.W. was responsible for guiding the device operations; J.Z. performed the tests; and X.L. revised the manuscript. All authors have read and agreed to the published version of the manuscript.
Funding
This research was funded by the Jiangsu Agricultural Science and Technology Innovation Fund, project number CX(19)2025 and the Jiangsu Modern Agricultural Equipment and Technology Demonstration Promotion Fund, project number NJ2020-23.
Institutional Review Board Statement
Not applicable.
Informed Consent Statement
Not applicable.
Data Availability Statement
The data presented in this study are openly available from Jiangsu University.
Conflicts of Interest
The authors declare that the research was conducted in the absence of any commercial or financial relationships that could be construed as potential conflict of interest.
References
- Wójtowicz, T.; Grabowska-Joachimiak, A.; Zieliński, A. Analysis of morpho-anatomical stem properties determining its mechanical strength in selected rye cultivars. Int. Agrophys. 2020, 1, 123–131. [Google Scholar] [CrossRef]
- Du, Z.; Hu, Y.G.; Buttar, N.A. Analysis of mechanical properties for tea stem using grey relational analysis coupled with multiple linear regression. Sci. Hortic. 2020, 260, 108886. [Google Scholar] [CrossRef]
- Meng, Y.; Wei, J.D.; Wei, J.; Chen, H.; Cui, Y.S. An ANSYS/LS-DYNA simulation and experimental study of circular saw blade cutting system of mulberry cutting machine. Comput. Electron. Agric. 2019, 157, 38–48. [Google Scholar] [CrossRef]
- Qiu, M.M.; Meng, Y.M.; Li, Y.Z.; Shen, X.B. Sugarcane stem cut quality investigated by finite element simulation and experiment. Biosyst. Eng. 2021, 206, 135–149. [Google Scholar] [CrossRef]
- Guo, J.; Fu, H.; Yang, Z.; Li, J.; Jiang, Y.L.; Jiang, T.T.; Liu, E.X.; Duan, J.L. Research on the Physical Characteristic Parameters of Banana Bunches for the Design and Development of Postharvesting Machinery and Equipment. Agriculture 2021, 11, 362. [Google Scholar] [CrossRef]
- Zhao, J.L.; Wang, X.G.; Zhuang, J.; Liu, H.L.; Wang, Y.J.; Yu, Y.J. Coupled Bionic Design Based on Primnoa Mouthpart to Improve the Performance of a Straw Returning Machine. Agriculture 2021, 11, 775. [Google Scholar] [CrossRef]
- Chen, P.W.; Sui, J.B.; Wang, C.Y. Cutting Force Analysis of Bovine Acetabular Cartilage. Procedia CIRP 2020, 89, 189–193. [Google Scholar] [CrossRef]
- Zhao, J.L.; Huang, D.Y.; Jia, H.L.; Zhuang, J.; Guo, M.Z. Analysis and experiment on cutting performances of high-stubble maize stalks. Int. J. Agric. Biol. Eng. 2017, 10, 40–52. [Google Scholar] [CrossRef]
- Vu, V.D.; Nguyen, T.T.; Chu, N.H.; Ngo, Q.H.; Ho, K.T.; Nguyen, V.D. Multiresponse Optimization of Cutting Force and Cutting Power in Chopping Agricultural Residues Using Grey-Based Taguchi Method. Agriculture 2020, 10, 51. [Google Scholar] [CrossRef] [Green Version]
- Gan, H.; Mathanker, S.; Momin, M.A.; Kuhns, B.; Stoffel, N.; Hansen, A.; Grift, T. Effects of three cutting blade designs on energy consumption during mowing-conditioning of Miscanthus Giganteus. Biomass Bioenergy 2017, 109, 166–171. [Google Scholar] [CrossRef]
- Zhang, C.; Chen, L.Q.; Xia, J.F.; Zhang, J.M. Effects of blade sliding cutting angle and stem level on cutting energy of rice stems. Int. J. Agric. Biol. Eng. 2019, 12, 75–81. [Google Scholar] [CrossRef]
- Boyda, M.G.; Omakli, M.; Sayinci, B.; KARA, M. Effects of moisture content, internode region, and oblique angle on the mechanical properties of sainfoin stem. Turk. J. Agric. For. 2019, 43, 254–263. [Google Scholar] [CrossRef] [Green Version]
- Wang, Y.; Yang, Y.; Zhao, H.M.; Liu, B.; Ma, J.T.; He, Y.; Zhang, Y.T.; Xu, H.B. Effects of cutting parameters on cutting of citrus fruit stems. Biosyst. Eng. 2020, 193, 1–11. [Google Scholar] [CrossRef]
- Cui, Y.; Wang, W.Q.; Wang, M.H.; Ma, Y.D.; Fu, L.S. Effects of cutter parameters on shearing stress for lettuce harvesting using a specially developed fixture. Int. J. Agric. Biol. Eng. 2021, 14, 152–158. [Google Scholar] [CrossRef]
- Zhang, Y.Q.; Cui, Q.L.; Guo, Y.M.; Li, H.B. Experiment and analysis of cutting mechanical properties of millet stem. T Chin. Soc. Agric. Mach. 2019, 50, 146–155. [Google Scholar] [CrossRef]
- Jiang, P.; Li, Y.P.; Li, J.L.; Meng, H.W.; Peng, X.B.; Zhang, B.C.; He, J.X.; Kan, Z. Experimental research on the bending and fracture characteristics of cotton stalk. Trans. ASABE 2021, 64, 1771–1779. [Google Scholar] [CrossRef]
- Kim, M.S.; Duizer, L.M.; Grygorczyk, A. Application of a Texture Analyzer friction rig to evaluate complex texture attributes in apples. Postharvest Biol. Technol. 2021, 186, 111820. [Google Scholar] [CrossRef]
- Molnár, K.; Virág, A.D.; Halász, M. Shear and yarn pull-out grip for testing flexible sheets by universal load machines. Polym. Test. 2020, 82, 106345. [Google Scholar] [CrossRef]
- Jeong, H.; Choi, S.; Lee, S.; Jeon, S. Rock Cutting Simulation of Point Attack Picks Using the Smooth Particle Hydrodynamics Technique and the Cumulative Damage Model. Appl. Sci. 2020, 10, 5314. [Google Scholar] [CrossRef]
- Vu, V.D.; Ngo, Q.H.; Nguyen, T.T.; Nguyen, H.C.; Nguyen, Q.T.; Nguyen, V.D. Multi-objective optimization of cutting force and cutting power in chopping agricultural residues. Biosyst. Eng. 2020, 191, 107–115. [Google Scholar] [CrossRef]
- Li, C.H.; Hsu, Y.T.; Hsieh, C.H.; Cheng, C.W. A Novel Semiautomatic Flesh Peeling and Seed Removing Mechanism for Dried Longan. Agriculture 2021, 11, 48. [Google Scholar] [CrossRef]
- Jiang, Q.J.; Wang, Y.W.; Chen, J.; Wang, J.; Wei, Z.B.; He, Z.L. Optimizing the working performance of a pollination machine for hybrid rice. Comput. Electron. Agric. 2021, 187, 106282. [Google Scholar] [CrossRef]
- Kornecki, T.S.; Kichler, C.M. Effectiveness of Cover Crop Termination Methods on No-Till Cantaloupe. Agriculture 2021, 12, 66. [Google Scholar] [CrossRef]
- Perotti, F.; Annoni, M.; Calcante, A.; Monno, M.; Mussi, V.; Oberti, R. Experimental Study of Abrasive Waterjet Cutting for Managing Residues in No-Tillage Techniques. Agriculture 2021, 11, 392. [Google Scholar] [CrossRef]
- Jiang, Q.J.; He, Z.L.; Wang, Y.W.; Wang, J. Optimizing the working performance of a boat-type tractor using central composite rotatable design and response surface method. Comput. Electron. Agric. 2021, 181, 105944. [Google Scholar] [CrossRef]
- Zhang, G.S.; Zhang, A.Q.; Xiao, M.H.; Bartos, P.; Bohata, A. Soil-cutting simulation and parameter optimization of rotary blade’s three-axis resistances by response surface method. Comput. Electron. Agric. 2019, 164, 104902. [Google Scholar] [CrossRef]
- Duong, M.T.; Perriard, Y.; Chun, Y.D. Force Reduction in a Short-Stroke Vibration Tubular Generator for Vehicle Energy Harvesting Application. Appl. Sci. 2020, 10, 5847. [Google Scholar] [CrossRef]
- Kang, F.; Tong, S.Y.; Zhang, H.S.; Li, W.B.; Chen, Z.J.; Zheng, Y.J. Analysis and experiments of reciprocating cutting parameters for apple tree branches. Trans. Chin. Soc. Agric. Eng. 2020, 36, 9–16. [Google Scholar] [CrossRef]
Publisher’s Note: MDPI stays neutral with regard to jurisdictional claims in published maps and institutional affiliations. |
© 2022 by the authors. Licensee MDPI, Basel, Switzerland. This article is an open access article distributed under the terms and conditions of the Creative Commons Attribution (CC BY) license (https://creativecommons.org/licenses/by/4.0/).