Article

Polarization Sensitive Imaging with Qubits

by
Vitaly Sukharenko
* and
Roger Dorsinville
The City College of New York, City University of New York, 160 Convent Avenue, New York, NY 10031, USA
*
Author to whom correspondence should be addressed.
Appl. Sci. 2022, 12(4), 2027; https://doi.org/10.3390/app12042027
Submission received: 15 December 2021 / Revised: 1 February 2022 / Accepted: 9 February 2022 / Published: 15 February 2022

Abstract

:
We compare reconstructed quantum state images of a birefringent sample using direct quantum state tomography and inverse numerical optimization technique. Qubits are used to characterize birefringence in a flat transparent plastic sample by means of polarization sensitive measurement using density matrices of two-level quantum entangled photons. Pairs of entangled photons are generated in a type-II nonlinear crystal. About half of the generated photons interact with a birefringent sample, and coincidence counts are recorded. Coincidence rates of entangled photons are measured for a set of sixteen polarization states. Tomographic and inverse numerical techniques are used to reconstruct the density matrix, the degree of entanglement, and concurrence for each pixel of the investigated sample. An inverse numerical optimization technique is used to obtain a density matrix from measured coincidence counts with the maximum probability. Presented results highlight the experimental noise reduction, greater density matrix estimation, and overall image enhancement. The outcome of the entanglement distillation through projective measurements is a superposition of Bell states with different amplitudes. These changes are used to characterize the birefringence of a 3M tape. Well-defined concurrence and entanglement images of the birefringence are presented. Our results show that inverse numerical techniques improve overall image quality and detail resolution. The technique described in this work has many potential applications.

1. Introduction

Imaging using entangled photons is increasingly popular. Quantum imaging applications often use pairs of entangled photons with relatively weak photon flux that causes longer image acquisition times. Increasing acquisition speed impairs image quality as quantum correlations become comparable to the background noise. Recent reports have focused on the resilience of quantum imaging to stray light and overall enhancement of image quality and resolution [1,2]. In [1], this is achieved by combining the signal and the phase profile using entangled photons and spatial light modulators (SLM). Subsequently, the image is reconstructed using coincidence measurements of four projections operators. In this article, we mitigate the noise detriment by using inverse numerical optimization for the density matrix reconstruction and by assuming that the noise in correlation measurements has a Gaussian probability distribution. Similar techniques are used in quantum state tomography reconstruction [3,4,5,6]. Reconstruction of a quantum state and quantum state tomography are of increasing importance in quantum information science. Quantum state tomography is used to describe entanglement of trapped ions [3] and photons. The technique extracts information about the quantum state of a system. Inverse techniques offer significant improvement over the direct quantum tomography approach [4,5,6,7,8,9,10,11,12,13,14]. Yet, very little work was done to experimentally demonstrate image enhancement and the superiority of the inverse techniques. In this work, we compare images of birefringent samples obtained from the reconstructed density matrix of entangled states between two techniques, direct quantum state tomography (DQST) and inverse numerical optimization quantum state tomography (IQST). Both are linearly related to a set of measured coincidence rates [4,5,6,7,8,9,10,11,12,13,14]. A number of inverse algorithms were proposed with faster convergence time [15,16,17,18]. The performance and image enhancement of these algorithms is outside of the scope of this paper. Scanned images are reconstructed from the levels of entanglement and concurrence calculated for each pixel. The localized birefringence alters the relative phase and polarization of the entangled qubits. These variations in turn result in changes in the correlation measurements for projection operators. The correlation measurements are used to reconstruct the density matrix, from which the calculation of the entanglement follow. The changes in the calculated entanglement between two qubits reflect the localized birefringence in the reconstructed image. The density matrix obtained via inverse numerical optimization technique, IQST, reduces experimental noise and provides a positive, semidefinite unit trace matrix [17,18,19]. This technique improves overall image quality and detail resolution.

2. Materials and Methods

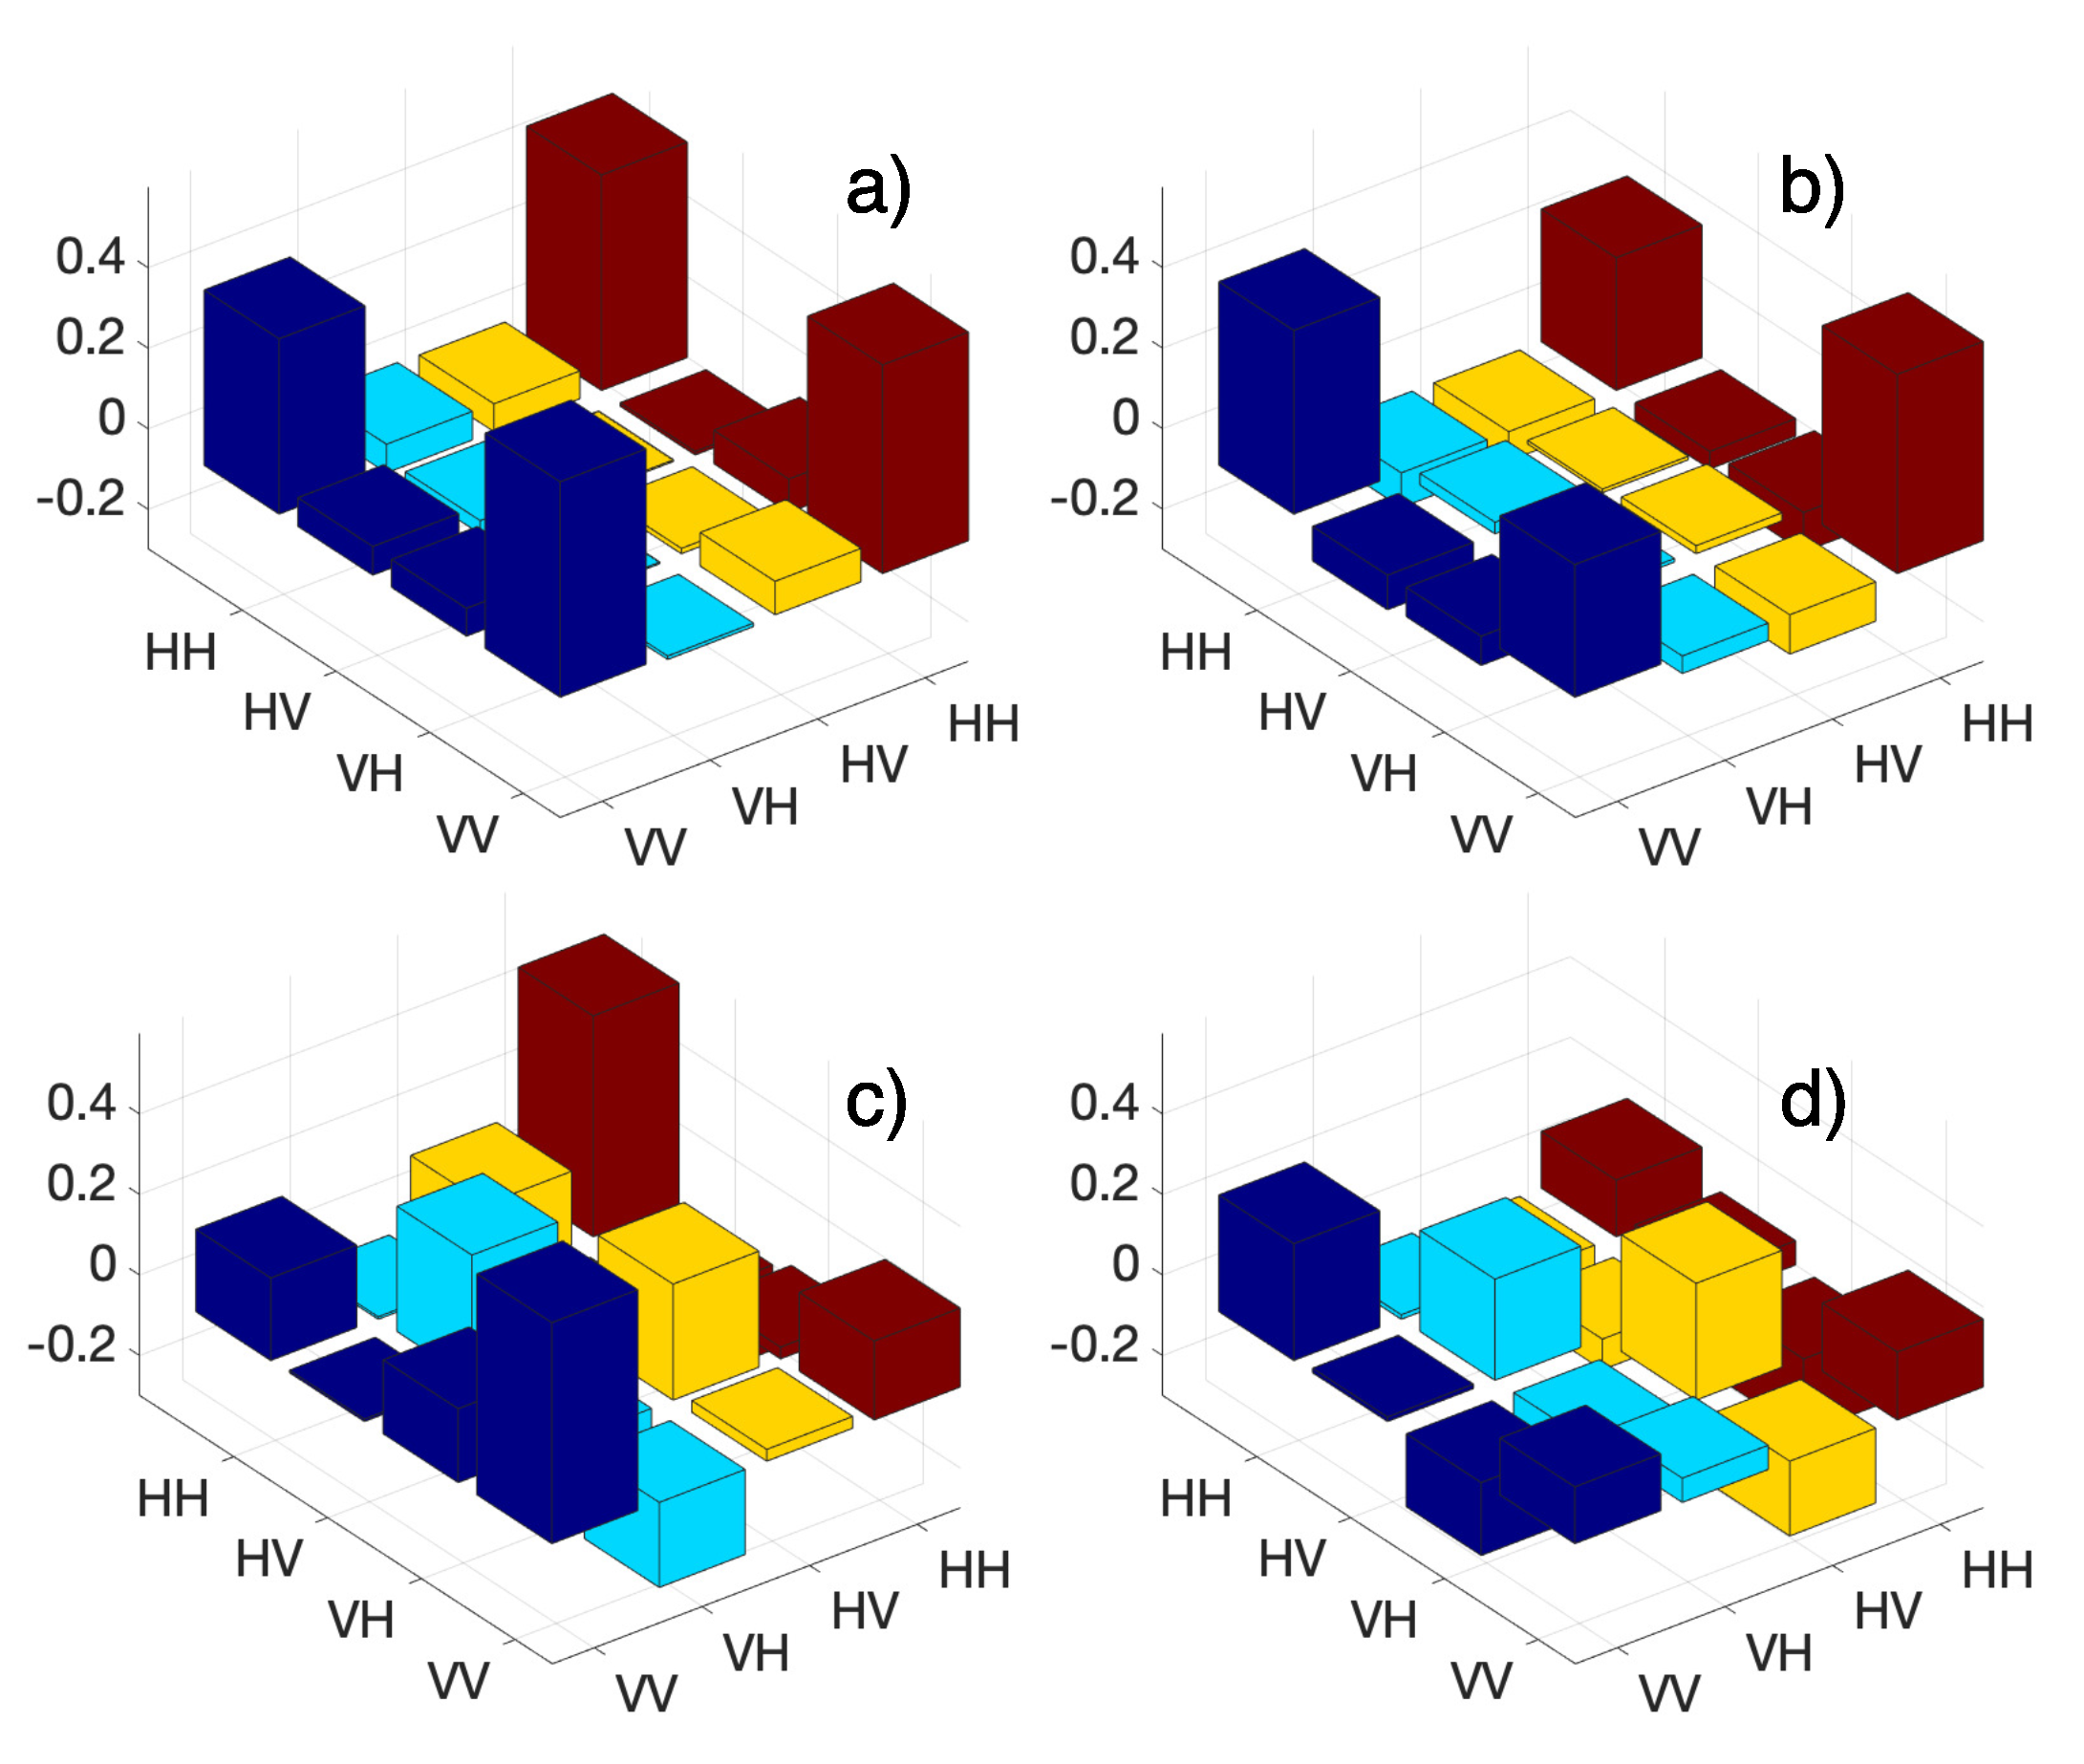
2.1. Direct Quantum State Tomography (DQST) Overview

Quantum state tomography is a technique that reconstructs density matrix ρ through multiple measurement of relevant quantum states. The measured probability p i for projection operator A i is given by
p i = T r [ ρ A i ] ,
The direct state reconstruction of a density matrix from the coincidence rate of the entangled photons projected on to a set of sixteen polarization states follows
ρ = i = 1 16 M i p i
where the matrix M i is determined from projection operators and listed in the appendix of [4]. The density matrix ρ of a quantum state must be Hermitian, positive, and semidefinite with unit trace. Directly reconstructed density matrix, Equation (2), fails to be positive and semidefinite. Numerical inverse optimization technique addresses this problem [4].

2.2. Inverse Numerical Optimization of Quantum State Tomography (IQST) Overview

We assume noise in correlation measurements has a Gaussian probability distribution and the probability of obtaining the set of sixteen measurements is
P ( p 1 , p 2 , , p 1 6 ) = i = 1 16 e x p ( p i p i ¯ ) 2 2 σ i 2
where σ is the standard derivation of the ith correlation measurement and is approximated by p i ¯ ; the expected measurement p i ¯ is defined as
p i ¯ = ψ i ρ t 1 , t 2 , , t 16 ψ i
the ψ i is the projection state and density matrix ρ ( t 1 , t 2 , , t 1 6 ) is described by
ρ ( t ) = T ( t ) T ( t ) T r [ T ( t ) T ( t ) ]
and
T t = t 1 0 0 0 t 5 + i t 6 t 2 0 0 t 11 + i t 12 t 7 + i t 8 t 3 0 t 15 + i t 16 t 13 + i t 14 t 9 + i t 10 t 4
The inverse optimization problem is reduced to finding the minimum of the following equation [4]:
L t 1 , t 2 , , t 16 = i = 1 16 ψ i ρ t 1 , t 2 , , t 16 ψ i n i 2 2 ψ i ρ t 1 , t 2 , , t 16 ψ i

2.3. Entanglement Computation

Concurrence and entanglement levels follow from the density matrix [4,6]
C = m a x 0 , a = 1 4 s g n 3 2 a r a
where C is the concurrence and r a is the eigen values of the matrix R defined by
R = ρ Σ ρ Σ
and
Σ = 0 0 0 1 0 0 1 0 0 1 0 0 1 0 0 0
The entanglement E is defined by the equation [4,6]
E = Z log 2 Z 1 Z log 2 1 Z
where
Z = 1 + 1 C 2 2
Reconstruction of concurrence and entanglement images are computed for each pixel and follow from Equations (8) and (11), respectively. In this work, two-level quantum entangled photons are generated in a type-II crystal via spontaneous parametric down-conversion (SPDC) [20,21]. One of the entangled photons interacts with the birefringent sample. The birefringent material changes the polarization and phase of the photons. These changes translate into a reduction of the coincidence rate of the entangled photons projected onto a set of sixteen polarization states. Subsequently, these variations transform the density matrix and the levels of concurrence and entanglement. The concurrence and entanglement levels are recorded for each pixel, and images of the sample (3M scotch tape) are reconstructed. The calculations were carried out using the standard methods described in [4].

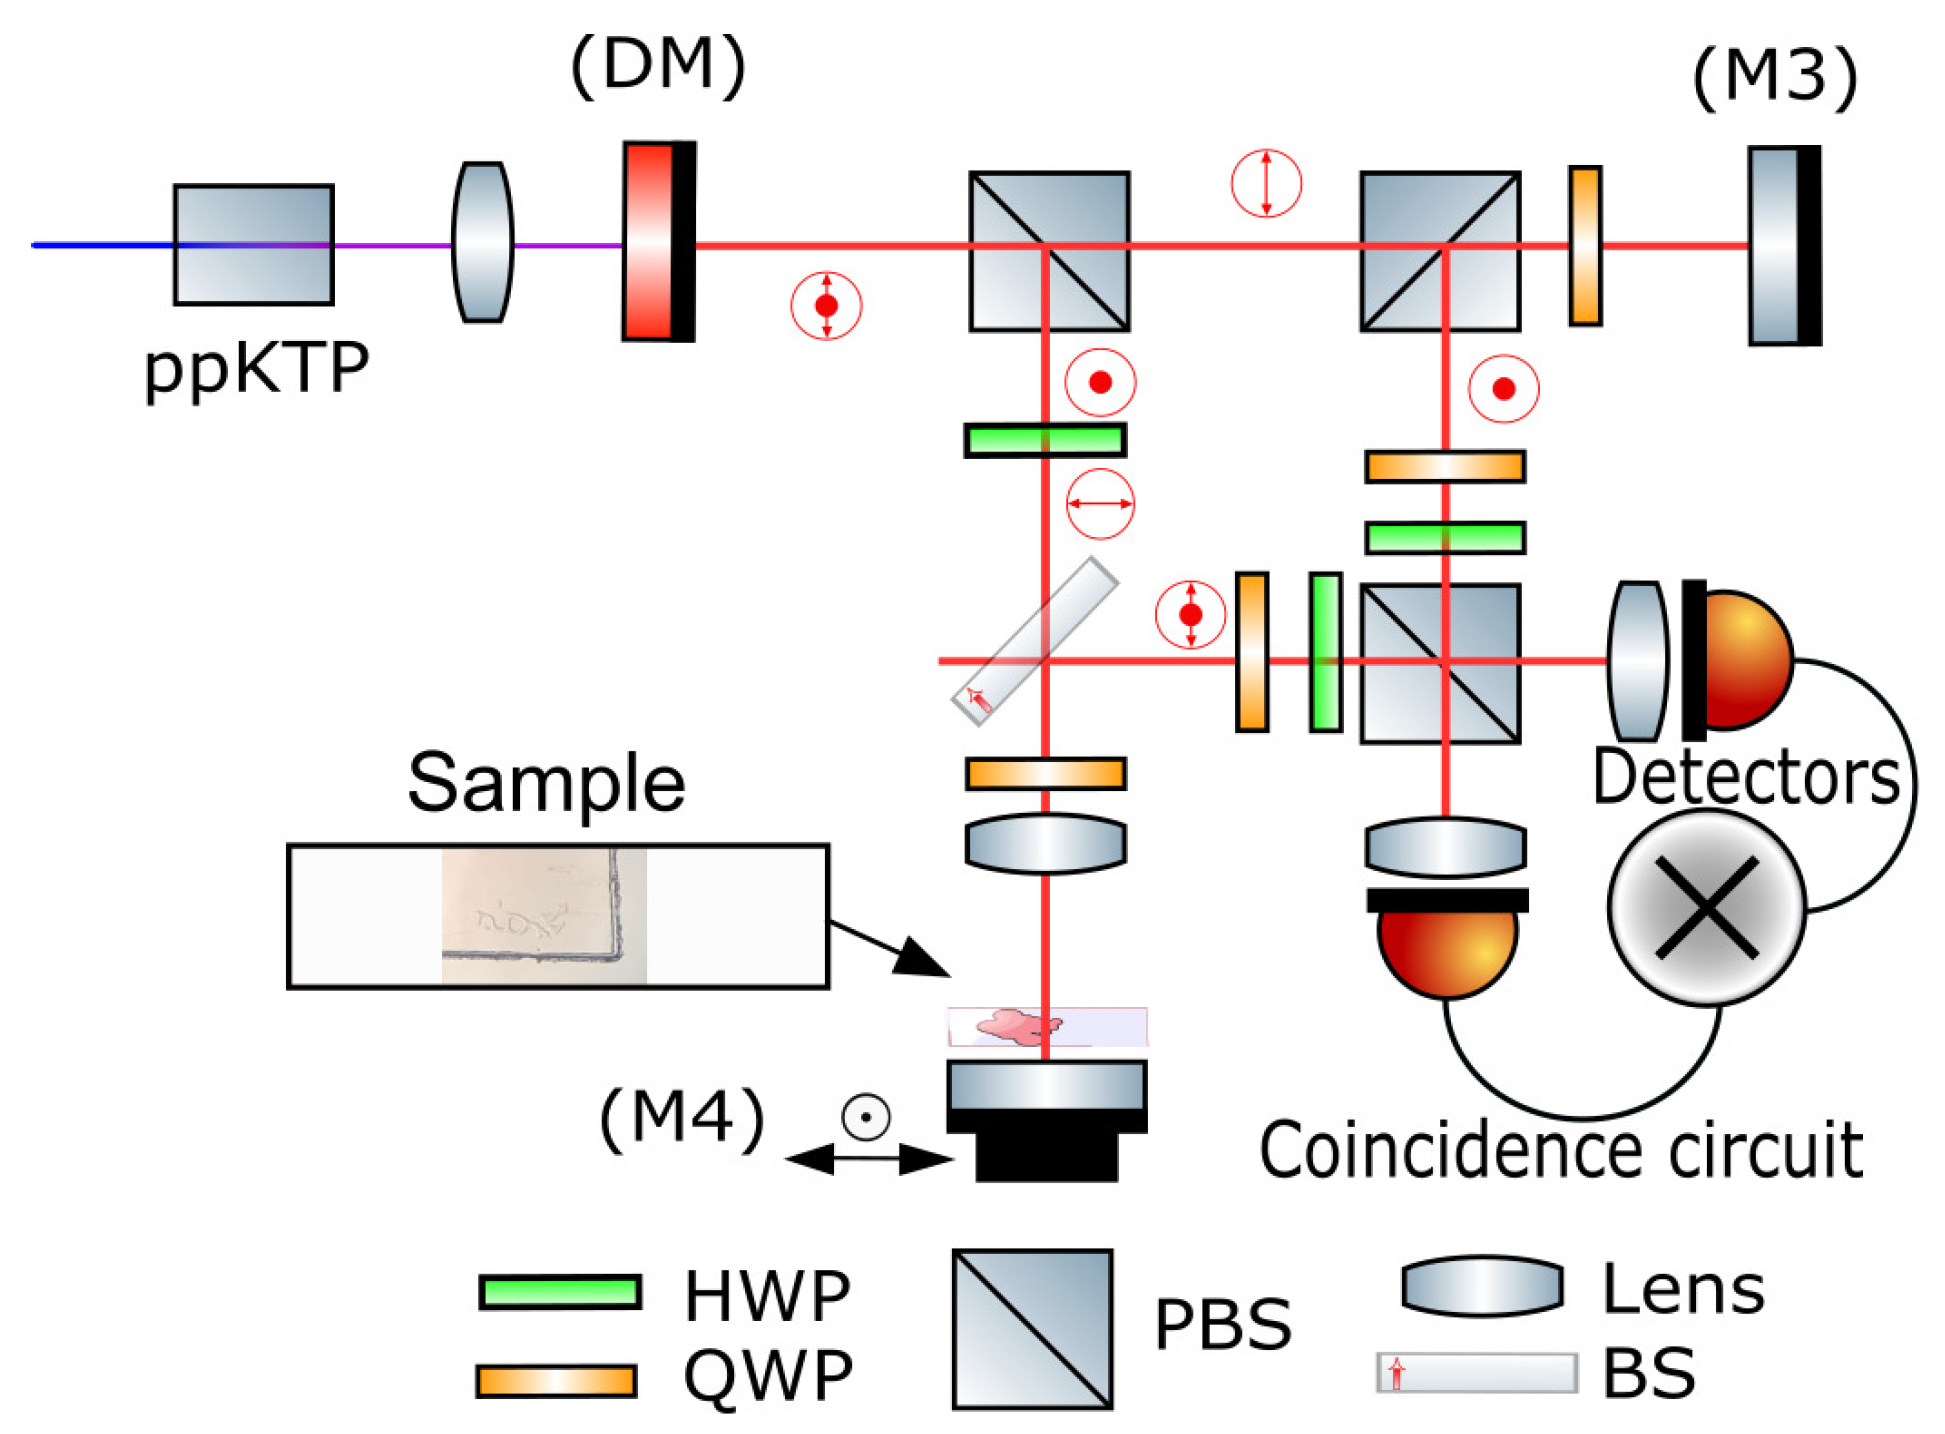
2.4. Experimental Setup
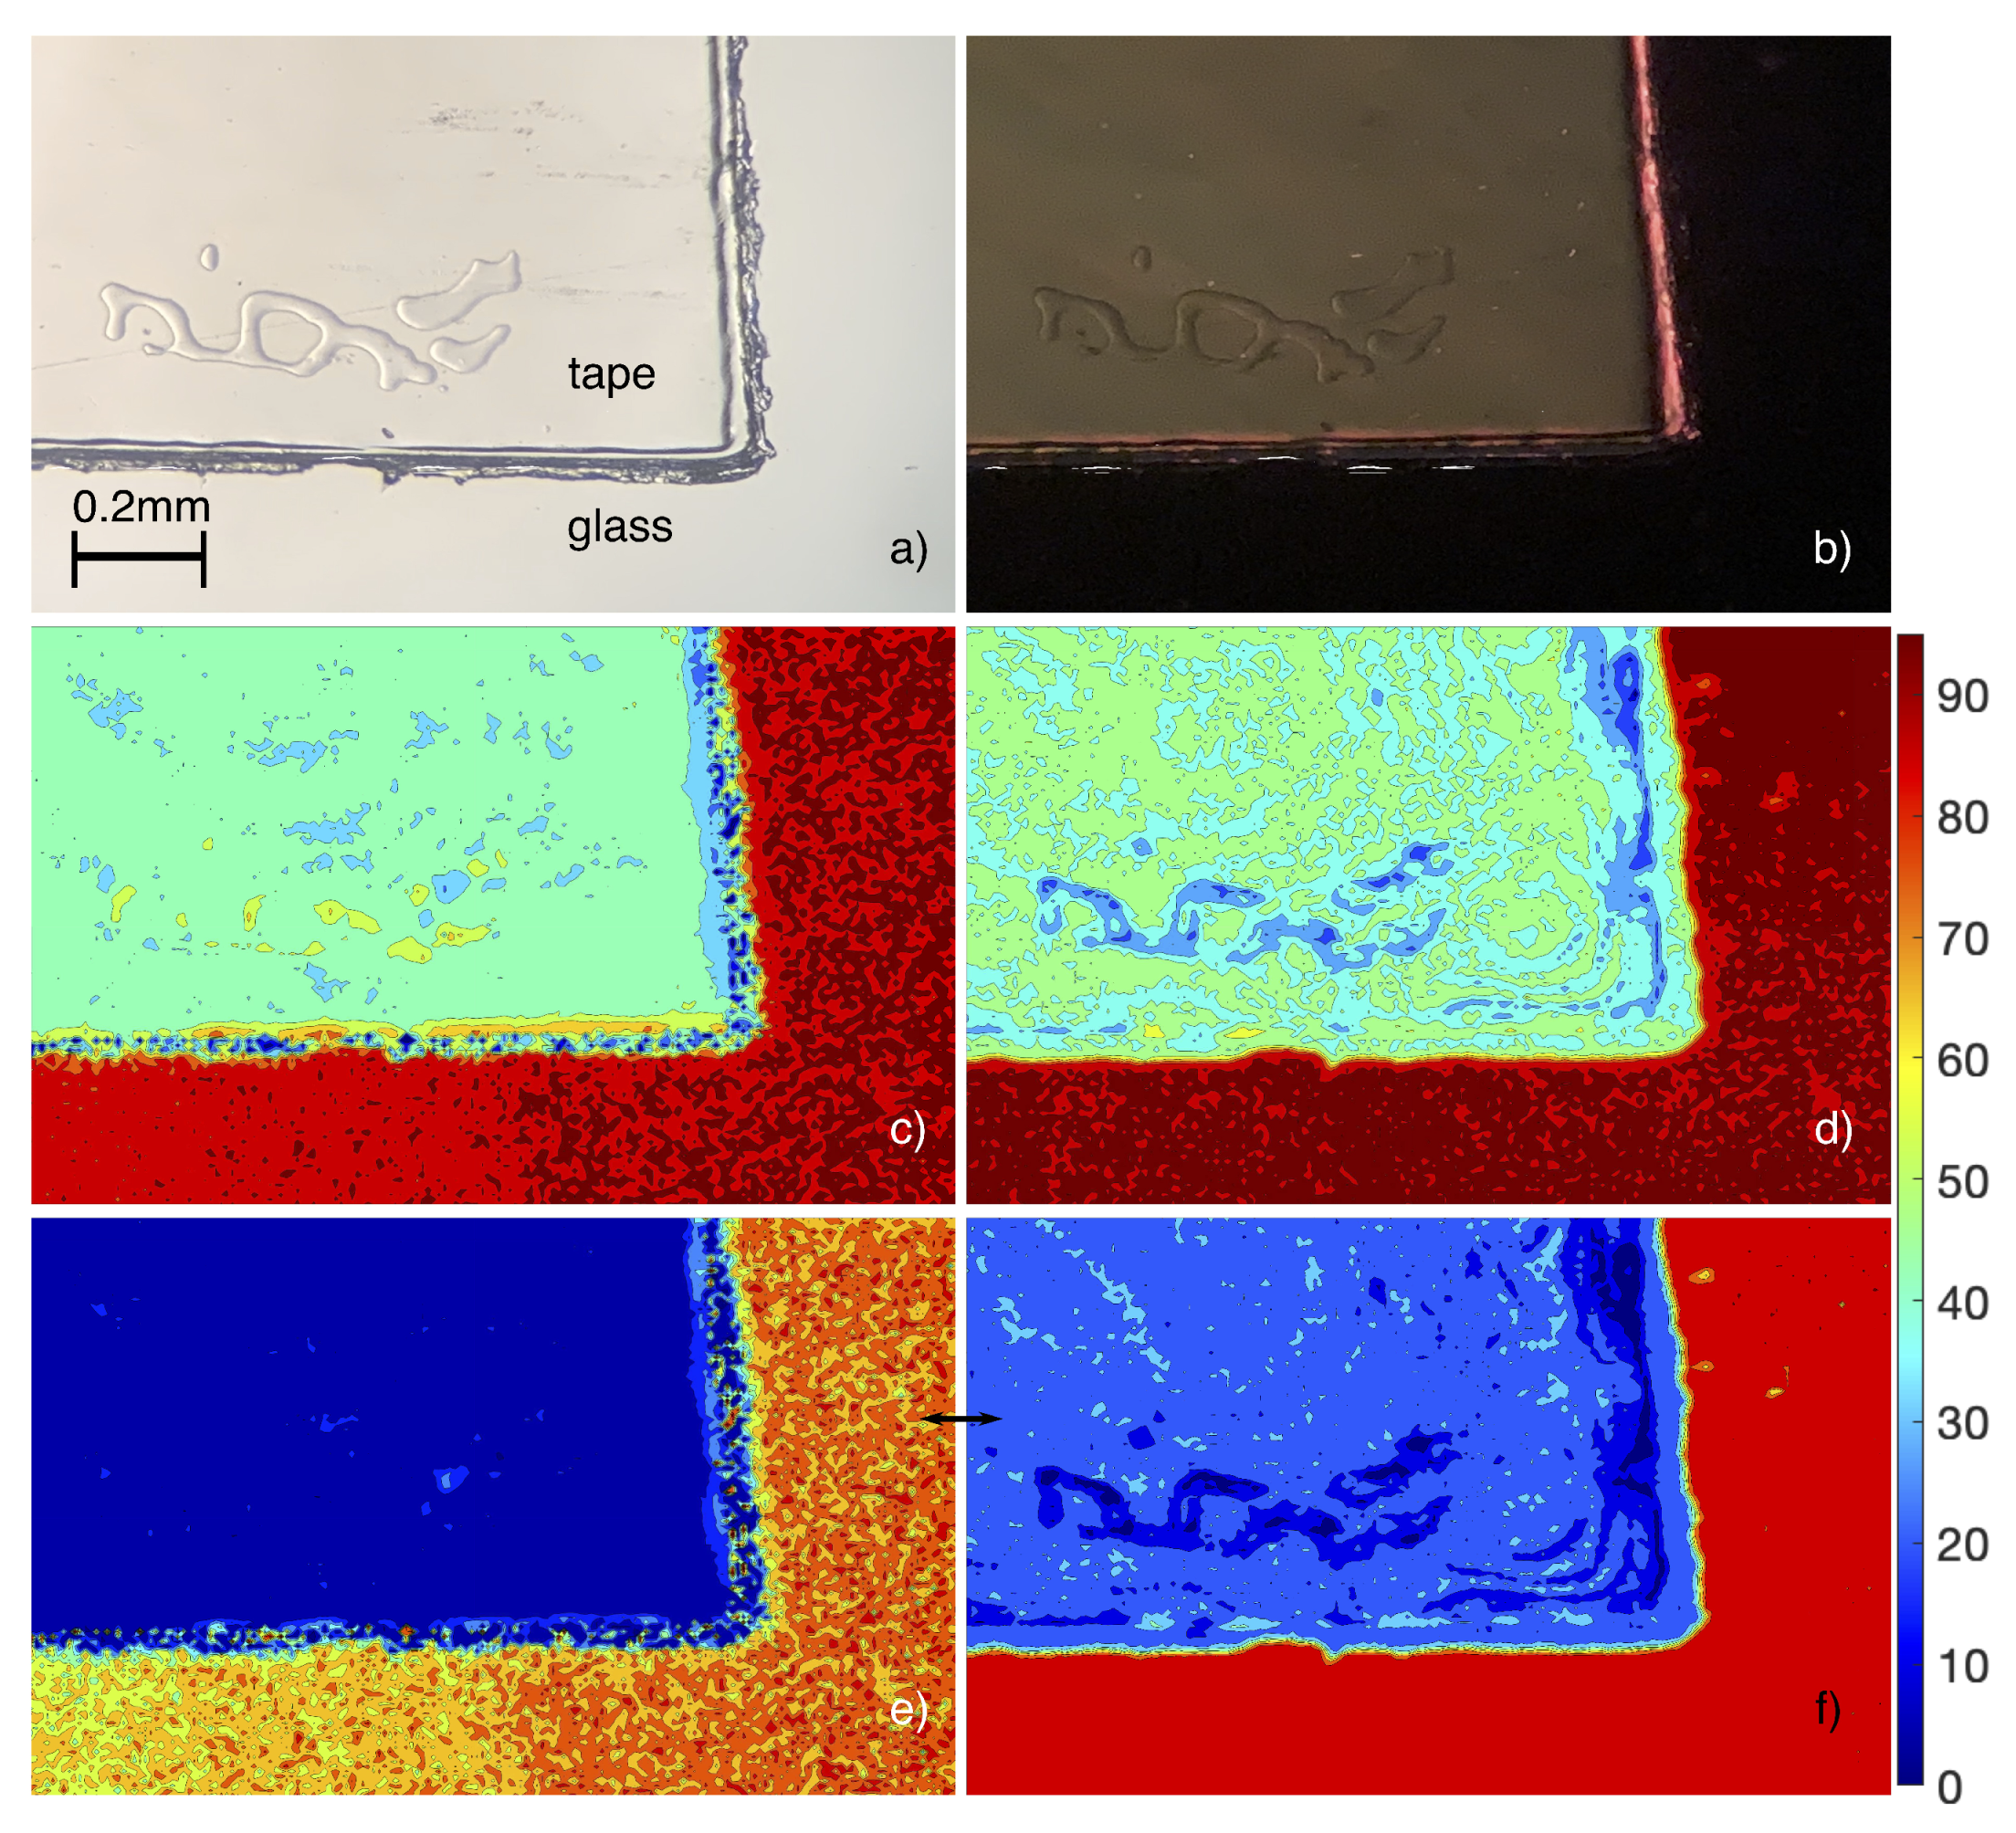
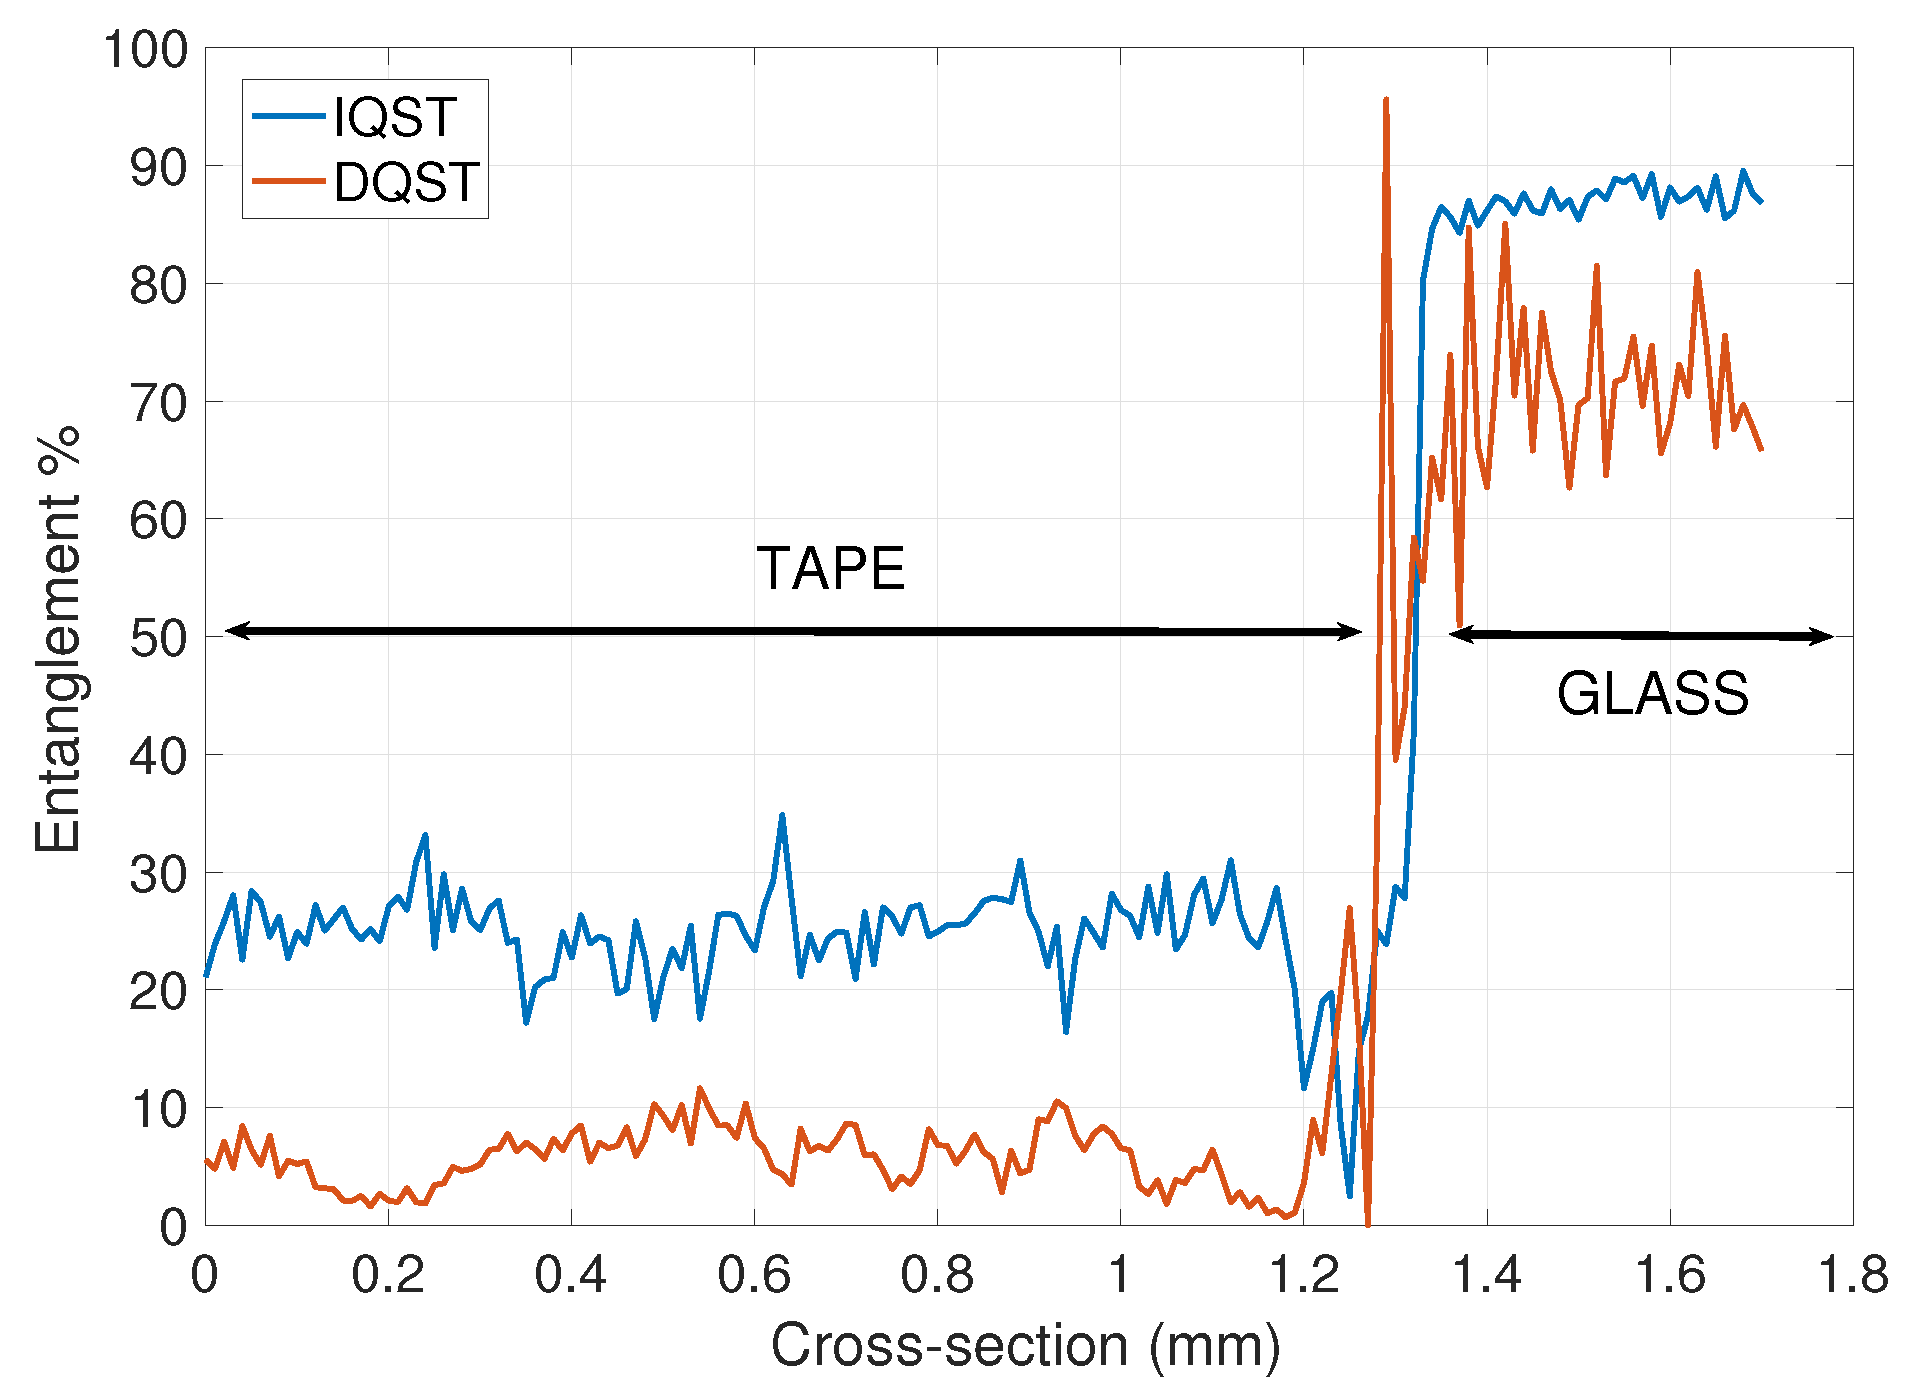
The experimental setup is shown in Figure 1. A continuous wavelength, single longitudinal mode laser diode with a center wavelength at 405 nm is focused into periodically poled KTiOPO 4 (ppKTP), type II crystal [20,21]. Entangled photons generated via SPDC are centered at 810 nm. The crystal is placed in a temperature-controlled chamber that maintains the crystal temperature to enable quasi-phase matching and to maximize the down-conversion efficiency. Entangled photon pairs have orthogonal polarization and are emitted in a collinear configuration with the pump [20,22]. A dichroic mirror (DM) transmits SPDC photons and reflects the pump photons. No additional filtering, by fiber or otherwise, is introduced into the experimental setup to sieve for the single spatial mode. At the first polarizing beam splitter (PBS), the down-converted entangled photon pairs are separated by polarization into the two arms of a Mach Zehnder interferometer.
The p-polarized photons are directed into an idler arm, where they are transmitted through a polarizing beam splitter (PBS), followed by a broadband quarter wave plate (QWP). The QWP converts the polarization of the photons from linear to circular. These photons are then reflected from a mirror (M3), back through the QWP, changing the photon polarization back from circular to linear, s-polarization. Polarized photons are reflected from the PBS through a QWP and an HWP that set the projection state operator of the idler beam towards the last PBS. The last PBS transmits p-polarized photons towards the left single photon counting module (SPCM) and reflects s-polarized photons towards the right SPCM module. The photons reflected by the first PBS are the sample arm photons and are directed towards a non-polarizing beam splitter (NPBS) through a broadband half wave plate (HWP), that converts vertically polarized photons into horizontally polarized. The NPBS has a 50:50 reflection/transmission ratio and transmits half of the entangled photons towards a mirror (M4). The sample is placed on a microscope slide against the mirror (M4) for transverse plane scanning (x and y directions). The QWP converts the polarization of the photons into circularly polarized photons, followed by a 20 mm focusing lens. Photons propagate through the sample and are reflected by the mirror (M4). The sample and mirror combination reflect photons towards the NPBS where they are redirected to the last PBS through QWP and HWP. The last PBS transmits p-polarized photons towards the right SPCM and reflects s-polarized photons towards the left SPCM. A combination of QWP and HWP plates before the last PBS are used to set the projection operator for sample and idler arms independently. Two single photon counting modules along with the coincidence circuit (denoted ⊗) measure the coincidence rate of entangled photons.

3. Results

A transparent 3M scotch tape is applied to a standard microscope slide and the density matrix of the entangled states are compared for photons propagating through the slide glass with and without the birefringent tape. Figure 2a,c show the real part of the DQST, direct tomographic density matrix measured using coincidence counts and Equation (2) with and without the birefringent tape, respectively. The density matrix obtained through the inverse numerical optimization technique, IQST, Equation (7), for the investigated sample with and without the birefringent tape are shown in Figure 2b,d, respectively. The birefringent material changes the phase and polarization of entangled photons in the sample arm, and the density matrix of the entangled states reflects these changes, as evident in Figure 2a–d. Concurrence and the entanglement levels are computed using Equations (8) and (11), for DQST and IQST methods, respectively, from the density matrices. DQST measurements of concurrence and entanglement without tape are 82.99 % ± 0.3101 and 76.2 % ± 0.8355, while IQST estimation of concurrence is 91.04 % ± 0.0102 and 87.27 % ± 0.0284 for entanglement. The same measurements of concurrence and entanglement with the birefringent tape are 14.57 % ± 0.112 and 4.77 % ± 0.124 for DQST, and IQST estimation of concurrence is 49.57 % ± 0.005 and 34.99 % ± 0.0109 of entanglement. Errors associated with entanglement and concurrence calculations represent the shot noise error in the measured coincidence counts and the uncertainty in the settings of the angles of the wave plates to set projection operators. The results for the birefringent tape appear different in the reconstructed density matrices in Figure 2c,d, between direct and the inverse technique. We attribute these differences to the superior accuracy of the inverse numerical optimization, IQST, compared to direct quantum state tomography, DQST.
The transparent 3M scotch tape is applied to a standard microscope slide and scanned in a transverse plane with 10 μm resolution. The photo of the tape is shown in Figure 3a, and the same section of the tape between two cross polarizers is shown in Figure 3b. The density matrix, concurrence, and entanglement were recorded for each pixel. The 2D DQST images of concurrence and entanglement are shown in Figure 3c,e, (Equations (2), (8) and (11)). The inverse numerical optimization technique, IQST is used to image levels of concurrence and entanglement, and are shown in Figure 3d,f, respectively (Equations (7), (8) and (11)). The SNR in the IQST Figure 3f was measured at 48 db while in the direct-QST, Figure 3e, it was measured at 8 db. In our work, we define the SNR as the ratio of average and standard deviation of pixels measured in a region of the glass slide. The factor that most influences the SNR is the acquisition time. Coincidence counts were measured for each pixel over one second. Reduction of experimental noise is clearly evident from Figure 3e,f. The image enhancement in Figure 3f is a result of an inverse numerical optimization technique that reduces experimental noise and provides positive, semidefinite unit trace density matrix [23]. The optimization technique improves overall image quality and detail resolution. Average entanglement of DQST pixels without the birefringent tape is 62.32% with standard deviation of 7.96%, while pixel distribution in the IQST technique image is 86.36% with standard deviation of 1.79%.

4. Discussion

In this paper, we present and compare the first experimental images and characterization of a birefringent material using direct quantum state tomography, DQST, and inverse numerical optimization, IQST, post-processing techniques. Images of concurrence and entanglement are reconstructed from the density matrix. These images reflect the computed entanglement between two qubits for each pixel and are a measure of the level of birefringence. Direct and inverse techniques are used to compare concurrence and entanglement image quality. Well-defined enhancement of images of entanglement and concurrence of a 3M tape are presented using the IQST technique of the 3M tape in images of entanglement and concurrence, Figure 3d,f, respectively, compared to the DQST, Figure 3c,e. Figure 4 shows the cross-section of the calculated entanglement taken at the position of the small double-sided arrow between Figure 3e,f. These results highlight the experimental noise reduction achieved by using numerical optimization techniques and overall image enhancement.
Classical optical techniques were used in reference [24] to image carcinoma cells of lung tissue via polarization sensitive optical coherence tomography (PS-OCT). The authors reported a birefringence signature. Similar classical polarization techniques were applied to imaging of other cancerous tissues [25,26], where birefringence was clearly visible in the malignant tissues. The technique described in this work has the potential to characterize birefringence of similar malignant tissues by means of polarization sensitive measurements using density matrices of two-level quantum entangled photons.

Author Contributions

Conceptualization, methodology, validation, writing, review and editing, V.S. and R.D.; visualization, V.S.; supervision, R.D. All authors have read and agreed to the published version of the manuscript.

Funding

This research was partially funded by Corning Incorporated Foundation.

Institutional Review Board Statement

Not applicable.

Informed Consent Statement

Not applicable.

Data Availability Statement

The data presented in this study are available on request from the corresponding author.

Conflicts of Interest

The authors declare no conflict of interest.

References

  1. Defienne, H.; Ndagano, B.; Lyons, A.; Faccio, D. Polarization entanglement-enabled quantum holography. Nat. Phys. 2021, 17, 591. [Google Scholar] [CrossRef]
  2. Devaux, F.; Mosset, A.; Bassignot, F.; Lantz, E. Quantum holography with biphotons of high Schmidt number. Phys. Rev. A 2019, 99, 033854. [Google Scholar] [CrossRef] [Green Version]
  3. Häffner, H.; Hänsel, W.; Roos, C.F.; Benhelm, J.; Chek-al-kar, D.; Chwalla, M.; Körber, T.; Rapol, U.D.; Riebe, M.; Schmidt, C.; et al. Scalable multiparticle entanglement of trapped ions. Nature 2005, 438, 643–646. [Google Scholar] [CrossRef] [Green Version]
  4. James, D.F.V.; Kwiat, P.G.; Munro, W.J.; White, A.G. Measurement of qubits. Phys. Rev. A 2001, 64, 052312. [Google Scholar] [CrossRef] [Green Version]
  5. Shi, L.; Galvez, E.; Alfano, R. Photon Entanglement Through Brain Tissue. Sci. Rep. 2016, 6, 37714. [Google Scholar] [CrossRef] [Green Version]
  6. Jack, B.; Leach, J.; Ritsch, H.; Barnett, S.M.; Padgett, M.J.; Franke-Arnold, S. Precise quantum tomography of photon pairs with entangled orbital angular momentum. New J. Phys. 2009, 11, 103024. [Google Scholar] [CrossRef]
  7. Altepeter, J.B.; Branning, D.; Jeffrey, E.; Wei, T.C.; Kwiat, P.G.; Thew, R.T.; O’Brien, J.L.; Nielsen, M.A.; White, A.G. Ancilla-Assisted Quantum Process Tomography. Phys. Rev. Lett. 2003, 90, 193601. [Google Scholar] [CrossRef] [Green Version]
  8. Israel, Y.; Afek, I.; Rosen, S.; Ambar, O.; Silberberg, Y. Experimental tomography of NOON states with large photon numbers. Phys. Rev. A 2012, 85, 022115. [Google Scholar] [CrossRef] [Green Version]
  9. Neugebauer, M.; Fischer, L.; Jager, A.; Czischek, S.; Jochim, S.; Weidemuller, M.; Garttne, M. Neural-network quantum state tomography in a two-qubit experiment. Phys. Rev. A 2020, 102, 042604. [Google Scholar] [CrossRef]
  10. Mihailov, A.E.; Latypov, I.Z.; Kalinkin, A.A.; Shkalikov, A.V.; Kalachev, A.A.; Samartsev, V.V. Polarization tomography of a narrow-band biphoton field. Bull. Russ. Acad. Sci. Phys. 2011, 75, 1658–1663. [Google Scholar] [CrossRef]
  11. Pilnyak, Y.; Zilber, P.; Cohen, L.; Eisenberg, H.S. Quantum tomography of photon states encoded in polarization and picosecond time bins. Phys. Rev. A 2019, 100, 043826. [Google Scholar] [CrossRef] [Green Version]
  12. Bayraktar, O.; Swillo, M.; Canalias, C.; Bjork, G. Quantum-polarization state tomography. Phys. Rev. A 2016, 94, 020105. [Google Scholar] [CrossRef] [Green Version]
  13. Erhard, M.; Qassim, H.; Mand, H.; Karimi, E.; Boyd, R.W. Real-time imaging of spin-to-orbital angular momentum hybrid remote state preparation. Phys. Rev. A 2015, 92, 022321. [Google Scholar] [CrossRef] [Green Version]
  14. Agnew, M.; Leach, J.; McLaren, M.; Roux, F.S.; Boyd, R.W. Tomography of the quantum state of photons entangled in high dimensions. Phys. Rev. A 2011, 84, 062101. [Google Scholar] [CrossRef] [Green Version]
  15. Gross, D.; Liu, Y.-K.; Flammia, S.T.; Becker, S.; Eisert, J. Quantum state tomography via compressed sensing. Phys. Rev. Lett. 2010, 15, 105. [Google Scholar] [CrossRef] [Green Version]
  16. Hradil, Z. Quantum state estimation. Phys. Rev. A 1997, 55, 1561. [Google Scholar] [CrossRef] [Green Version]
  17. Straupe, S.S. Adaptive quantum tomography. JETP Lett. 2016, 7, 510–522. [Google Scholar] [CrossRef]
  18. Řeháček, J.; Hradil, Z.; Knill, E.; Lvovsky, A.I. Diluted maximum-likelihood algorithm for quantum tomography. Phys. Rev. A 2007, 75, 042108. [Google Scholar] [CrossRef] [Green Version]
  19. Miranowicz, A.; Bartkiewicz, K.; Perina, J., Jr.; Koashi, M.; Imoto, N.; Nori, F. Optimal two-qubit tomography based on local and global measurements: Maximal robustness against errors as described by condition numbers. Phys. Rev. A 2014, 90, 062123. [Google Scholar] [CrossRef] [Green Version]
  20. Lee, S.M.; Kim, H.; Cha, M.; Moon, H.S. Polarization-entangled photon-pair source obtained via type-II non-collinear SPDC process with PPKTP crystal. Opt. Express 2016, 24, 2941–2953. [Google Scholar] [CrossRef] [Green Version]
  21. Jeong, Y.-C.; Hong, K.-H.; Kim, Y.-H. Bright source of polarization-entangled photons using a PPKTP pumped by a broadband multi-mode diode laser. Opt. Express 2016, 24, 1165–1174. [Google Scholar] [CrossRef] [PubMed]
  22. Lopez-Mago, D.; Novotny, L. Quantum-Optical Coherence Tomography with Collinear Entangled Photons. Opt. Lett. 2012, 37, 4077–4079. [Google Scholar] [CrossRef]
  23. Schwemmer, C.; Knips, L.; Richart, D.; Weinfurter, H.; Moroder, T.; Kleinmann, M.; Guhne, O. Systematic Errors in Current Quantum State Tomography Tools. Phys. Rev. Lett. 2015, 114, 080403. [Google Scholar] [CrossRef] [PubMed] [Green Version]
  24. Hariri, L.P.; Villiger, M.; Applegate, M.B.; Mino-Kenudson, M.; Mark, E.J.; Bouma, B.E.; Suter, M.J. Seeing beyond the bronchoscope to increase the diagnostic yield of bronchoscopic biopsy. Am. J. Respir. Crit. Care Med. 2013, 187, 125–129. [Google Scholar] [CrossRef] [PubMed] [Green Version]
  25. Carriel, V.S.; Aneiros-Fernandez, J.; Arias-Santiago, S.; Garzón, I.J.; Alaminos, M.; Campos, A. A novel histochemical method for a simultaneous staining of melanin and collagen fibers. J. Histochem. Cytochem. 2011, 3, 59. [Google Scholar]
  26. Patel, R.; Khan, A.; Quinlan, R.; Yaroslavsky, A.N. Polarization-Sensitive Multimodal Imaging for Detecting Breast Cancer. Cancer Res. 2014, 74, 4685–4693. [Google Scholar] [CrossRef] [PubMed] [Green Version]
Figure 1. Experimental setup for quantum state tomography imaging.
Applsci 12 02027 g001
Figure 2. (a) DQST density matrix without the tape, (b) IQST density matrix without the tape, (c) DQST density matrix with the tape, (d) IQST density matrix with the tape.
Applsci 12 02027 g002
Figure 3. (a) 3M scotch tape, (b) tape between cross-polarizers, (c) DQST concurrence image, (d) IQST concurrence image, (e) DQST entanglement image, (f) IQST entanglement image.
Applsci 12 02027 g003
Figure 4. The cross-section of entanglement image, Figure 3e,f, taken at position of the small double-sided arrow.
Applsci 12 02027 g004
Publisher’s Note: MDPI stays neutral with regard to jurisdictional claims in published maps and institutional affiliations.

