
Short-Term Treatment of Metformin and Glipizide on Oxidative Stress, Lipid Profile and Renal Function in a Rat Model with Diabetes Mellitus

 ,
,  ,
,  , , ,
, , ,  and
and 
Abstract
:1. Introduction
2. Materials and Methods
2.1. Materials
2.2. Ethics
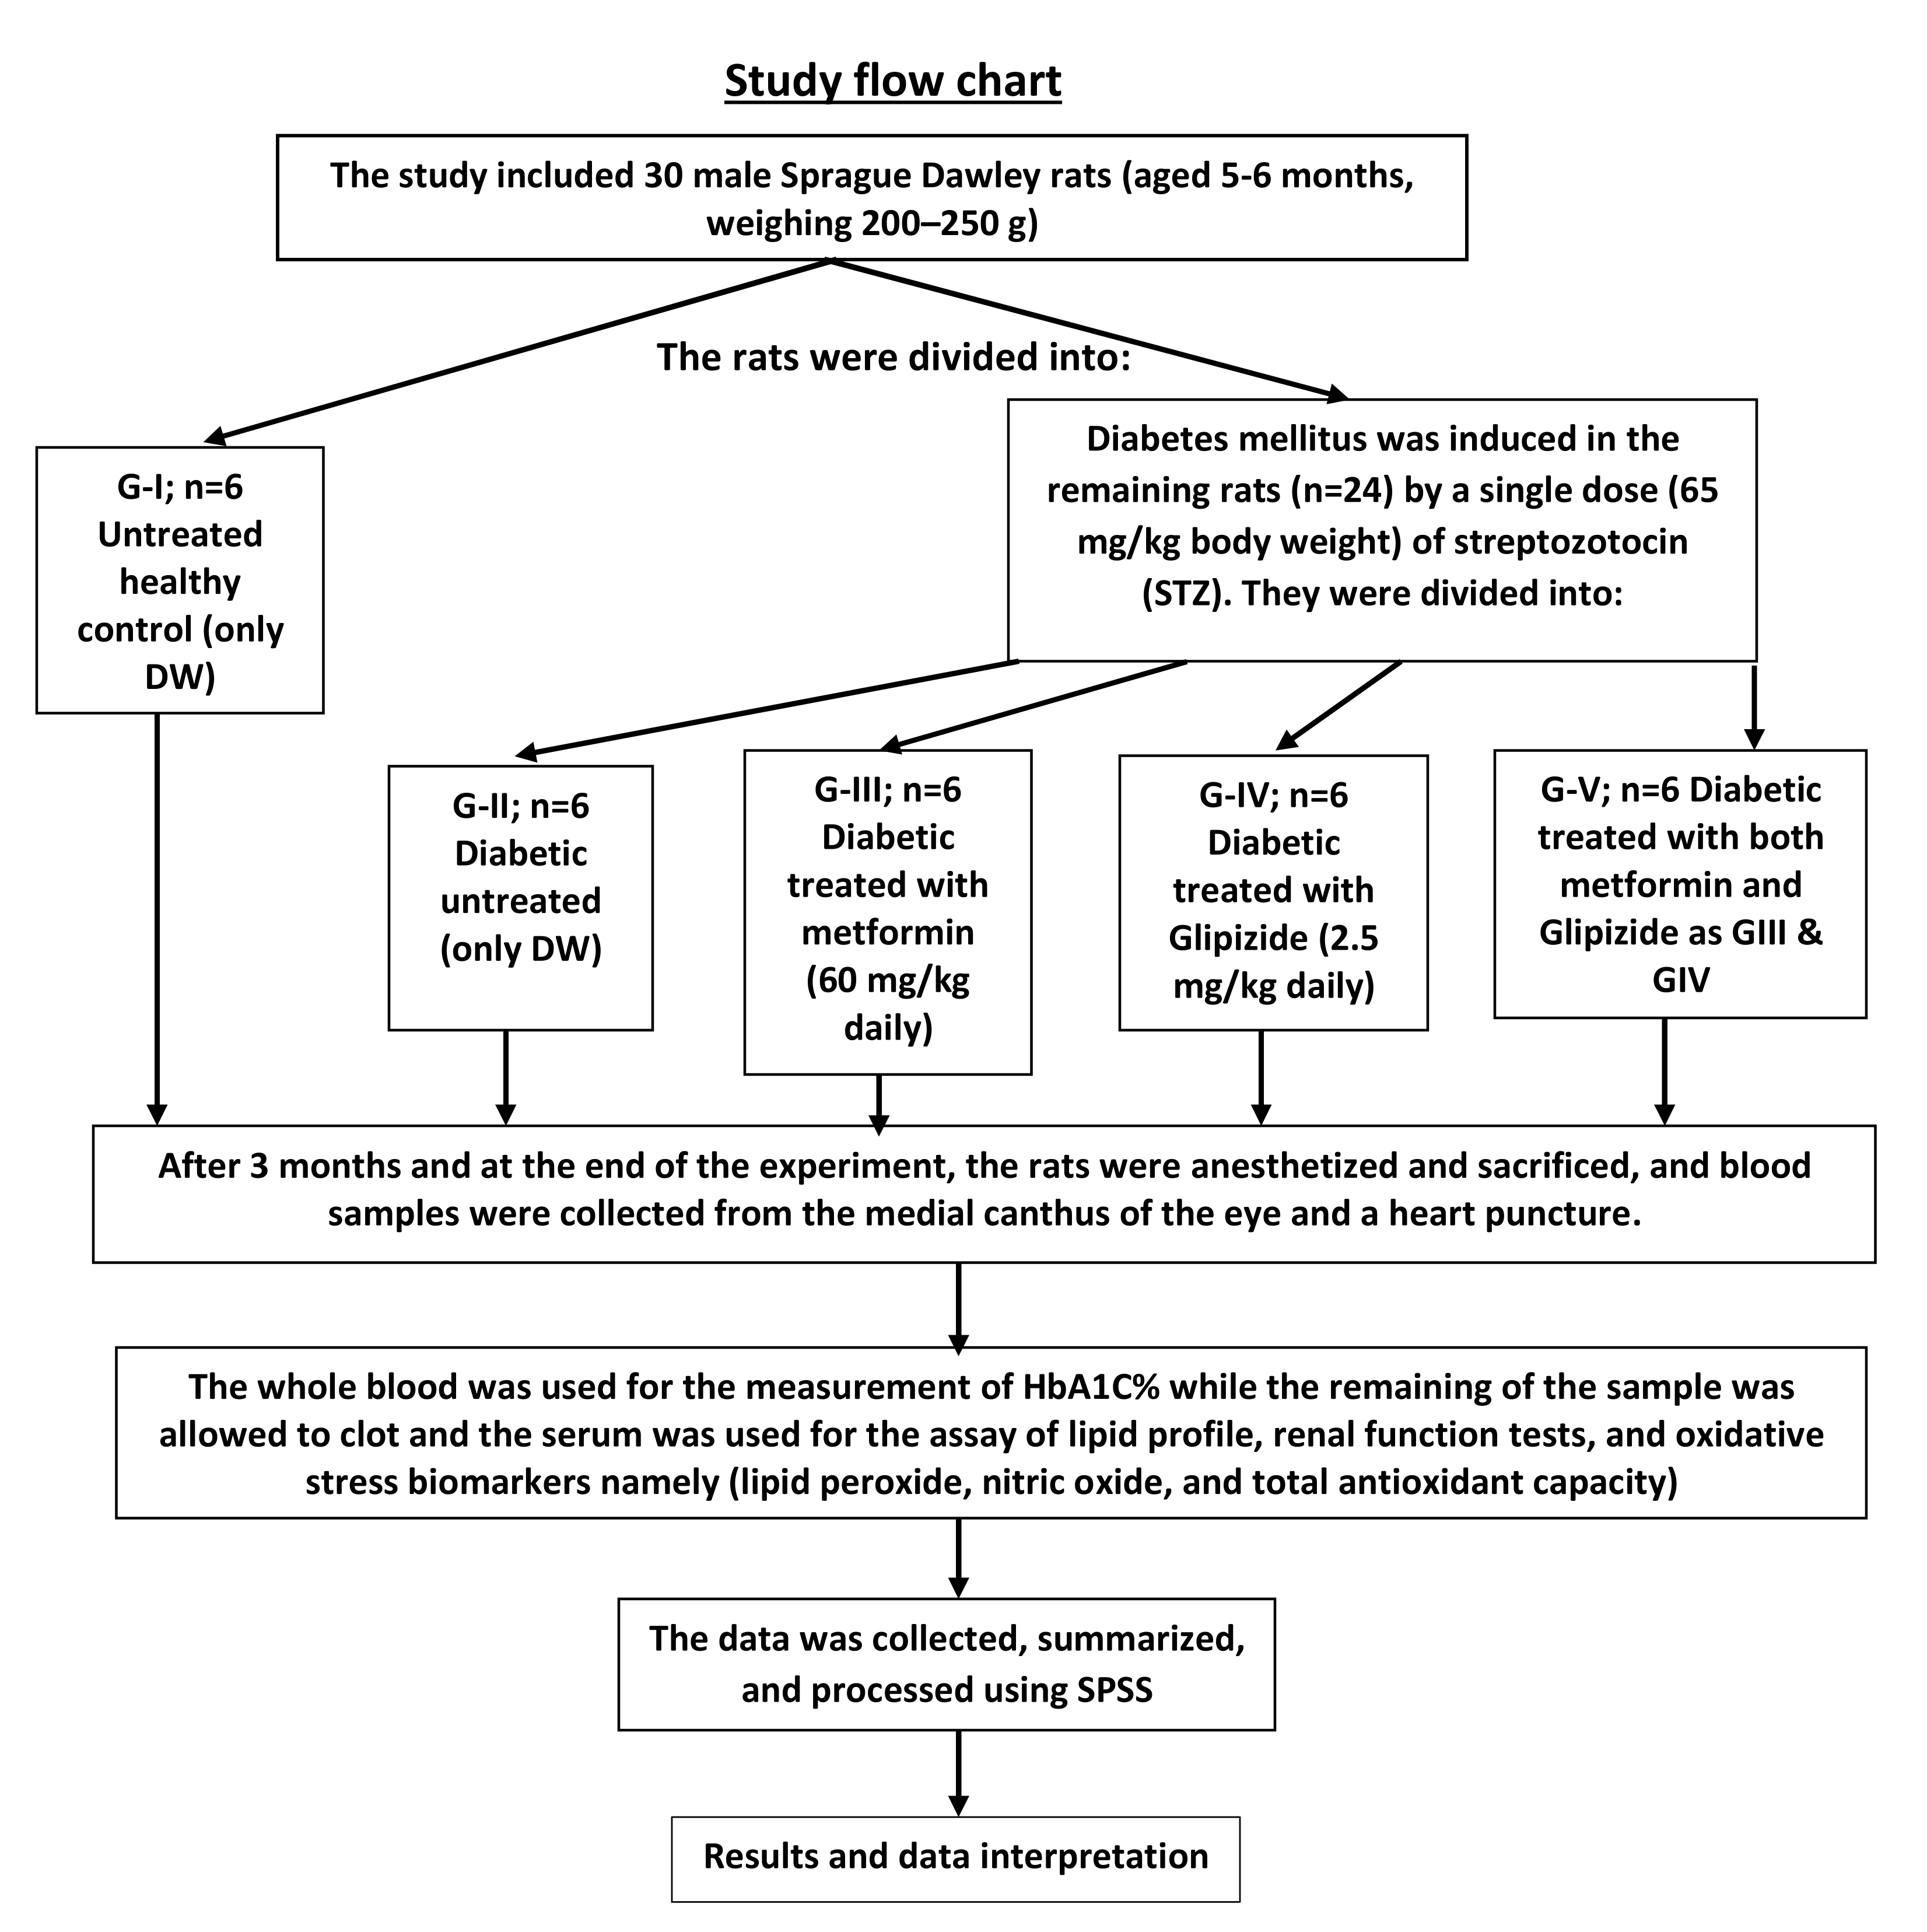
2.3. Animals
2.4. Experimental Groups
2.5. Induction of Diabetes
2.6. Medications
2.7. Biochemical Assays
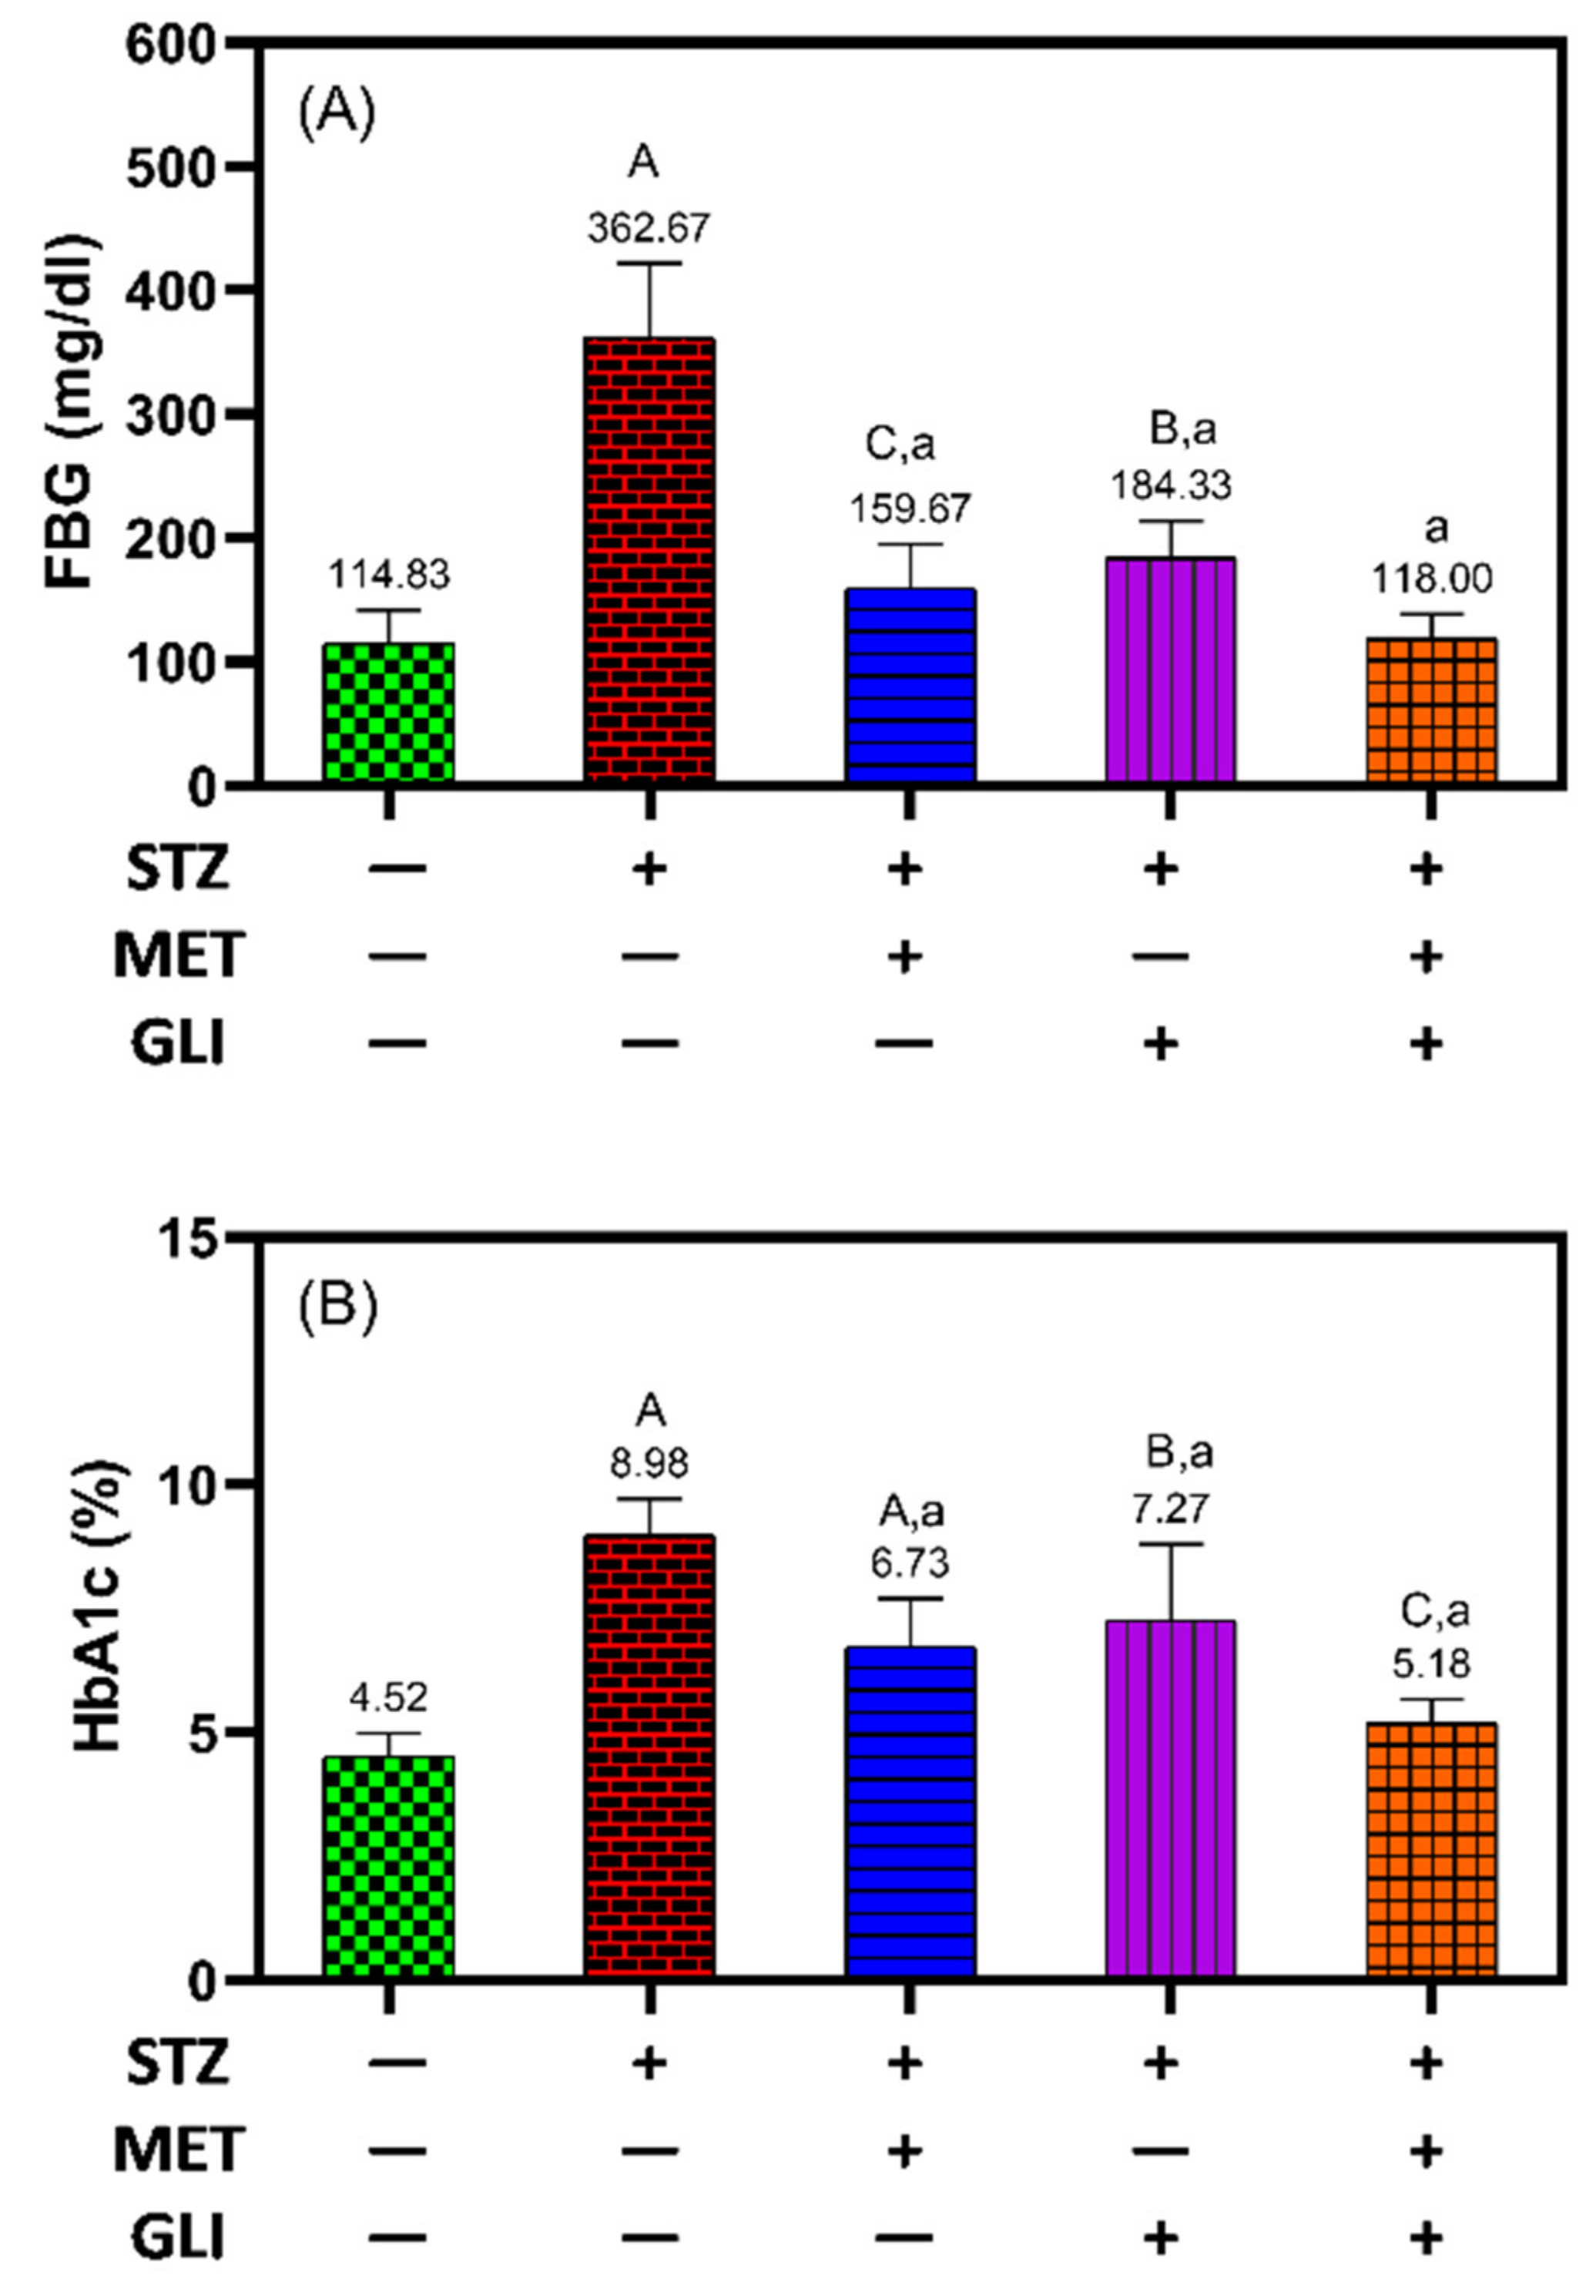
2.7.1. Glycemic Control for Total Glycated HbA1c Assay
2.7.2. Oxidative Stress
2.7.3. Lipid Profile Assays
2.7.4. Renal Function Assay
2.8. Statistics
3. Results
3.1. Glycaemic Control Assays
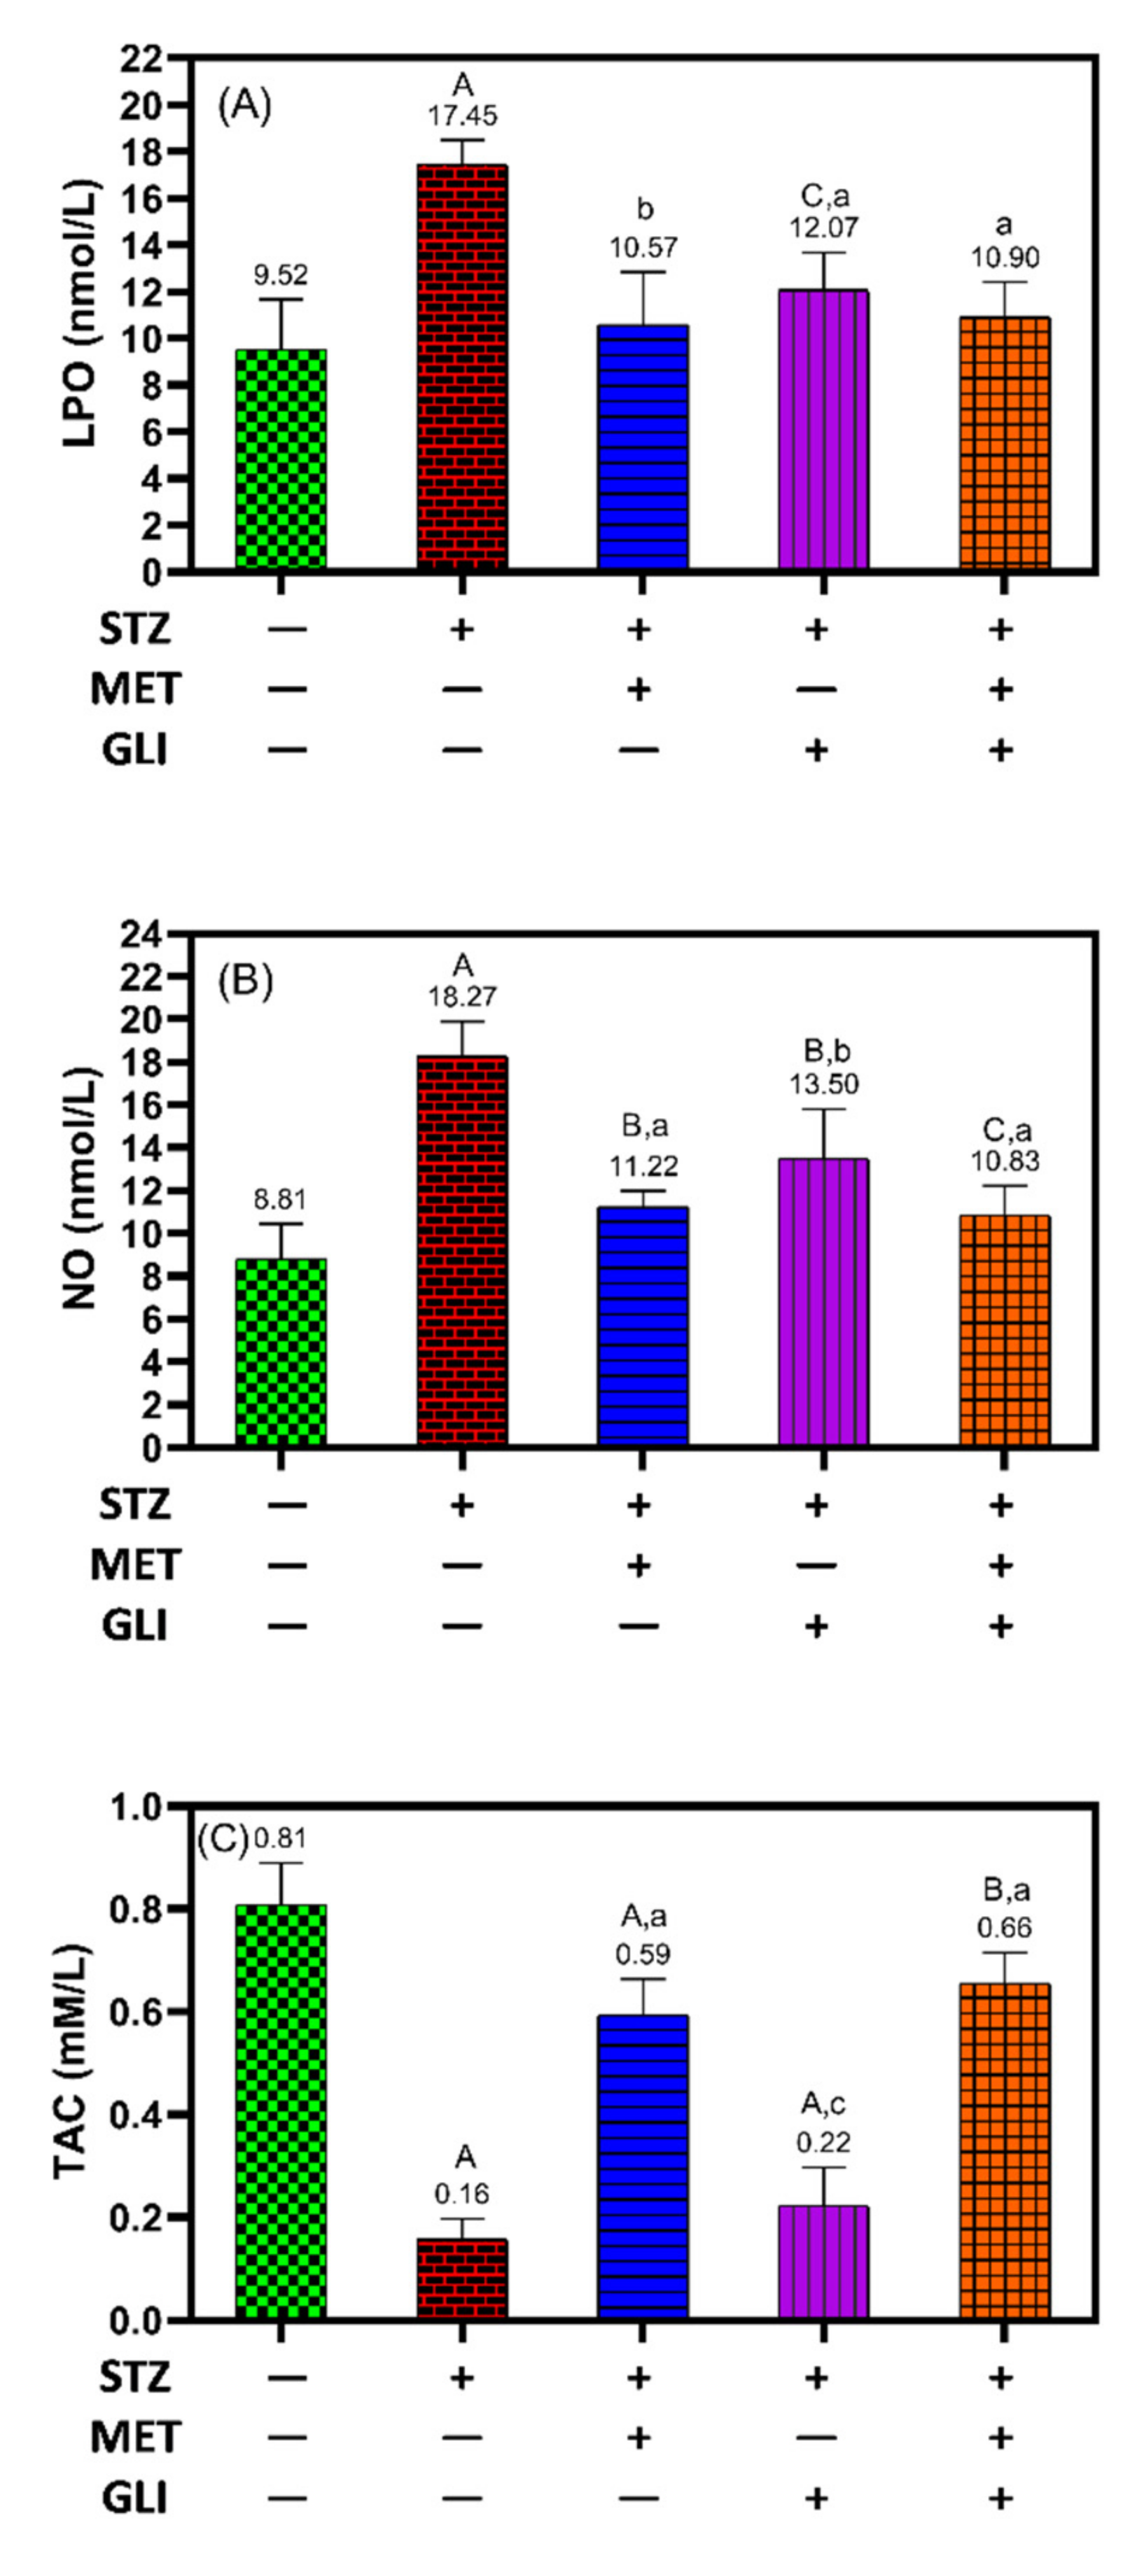
3.2. Oxidative Stress Assays
3.3. Lipid Profile Assays
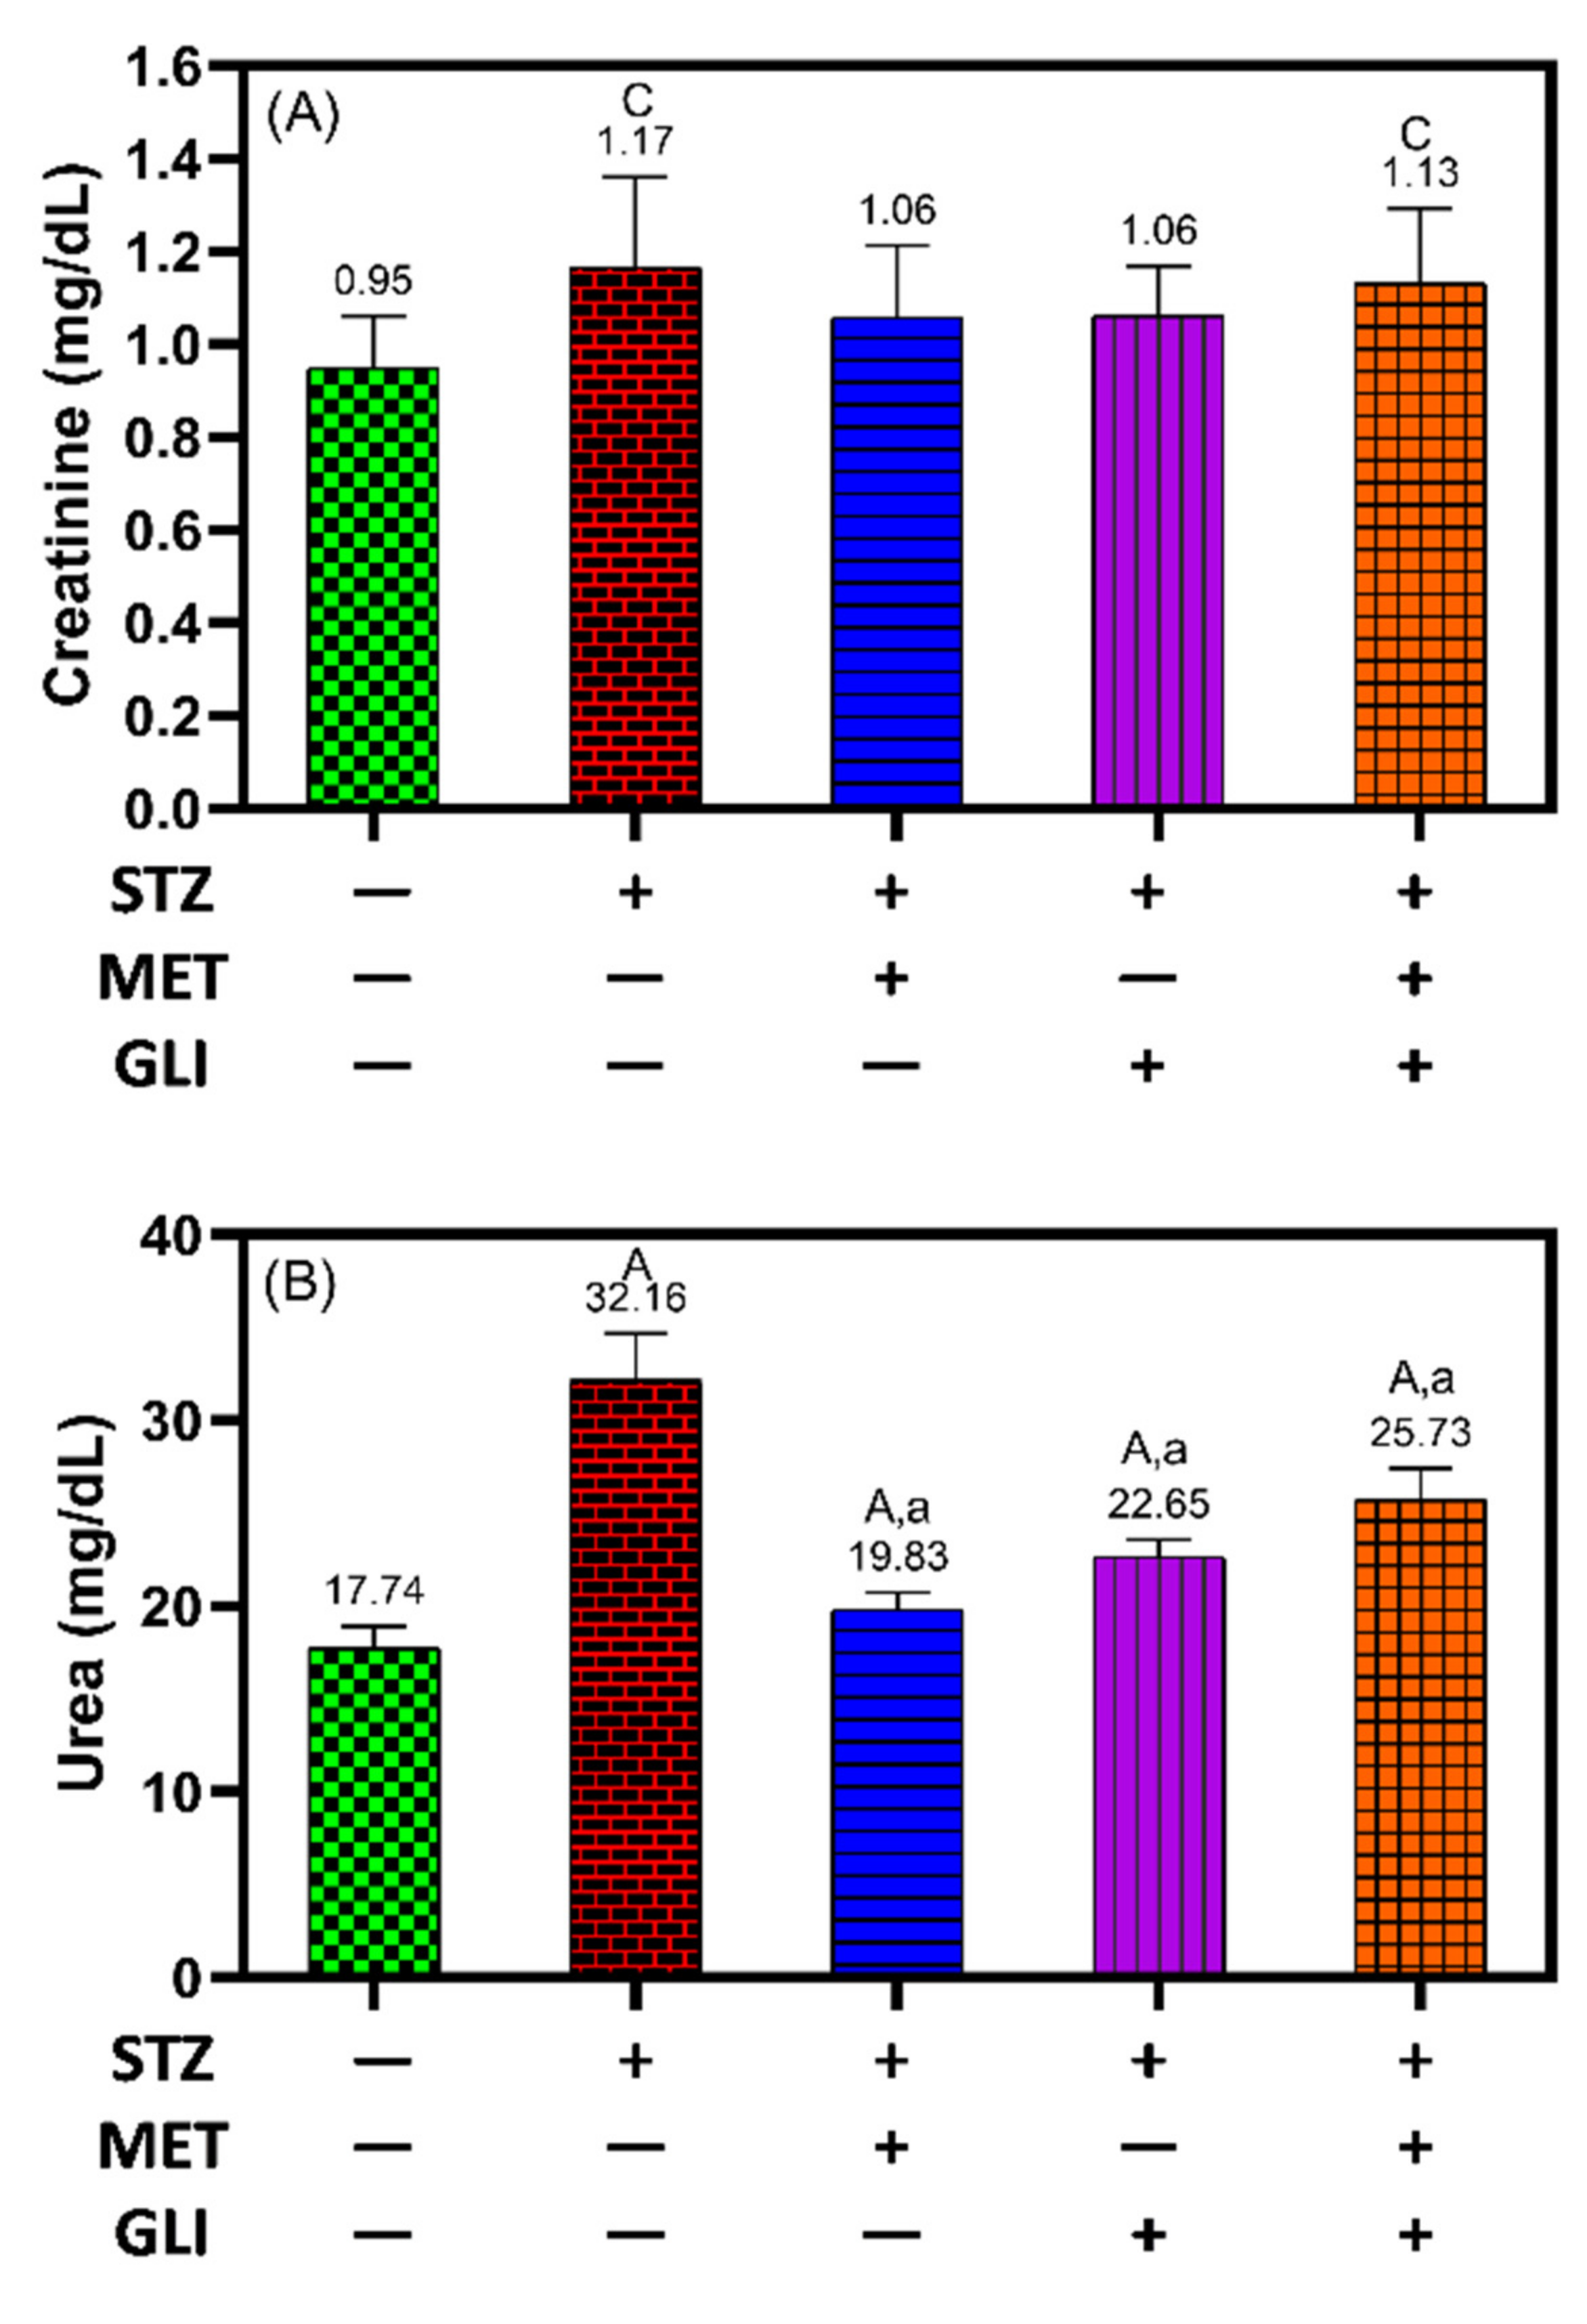
3.4. Renal Function Assay
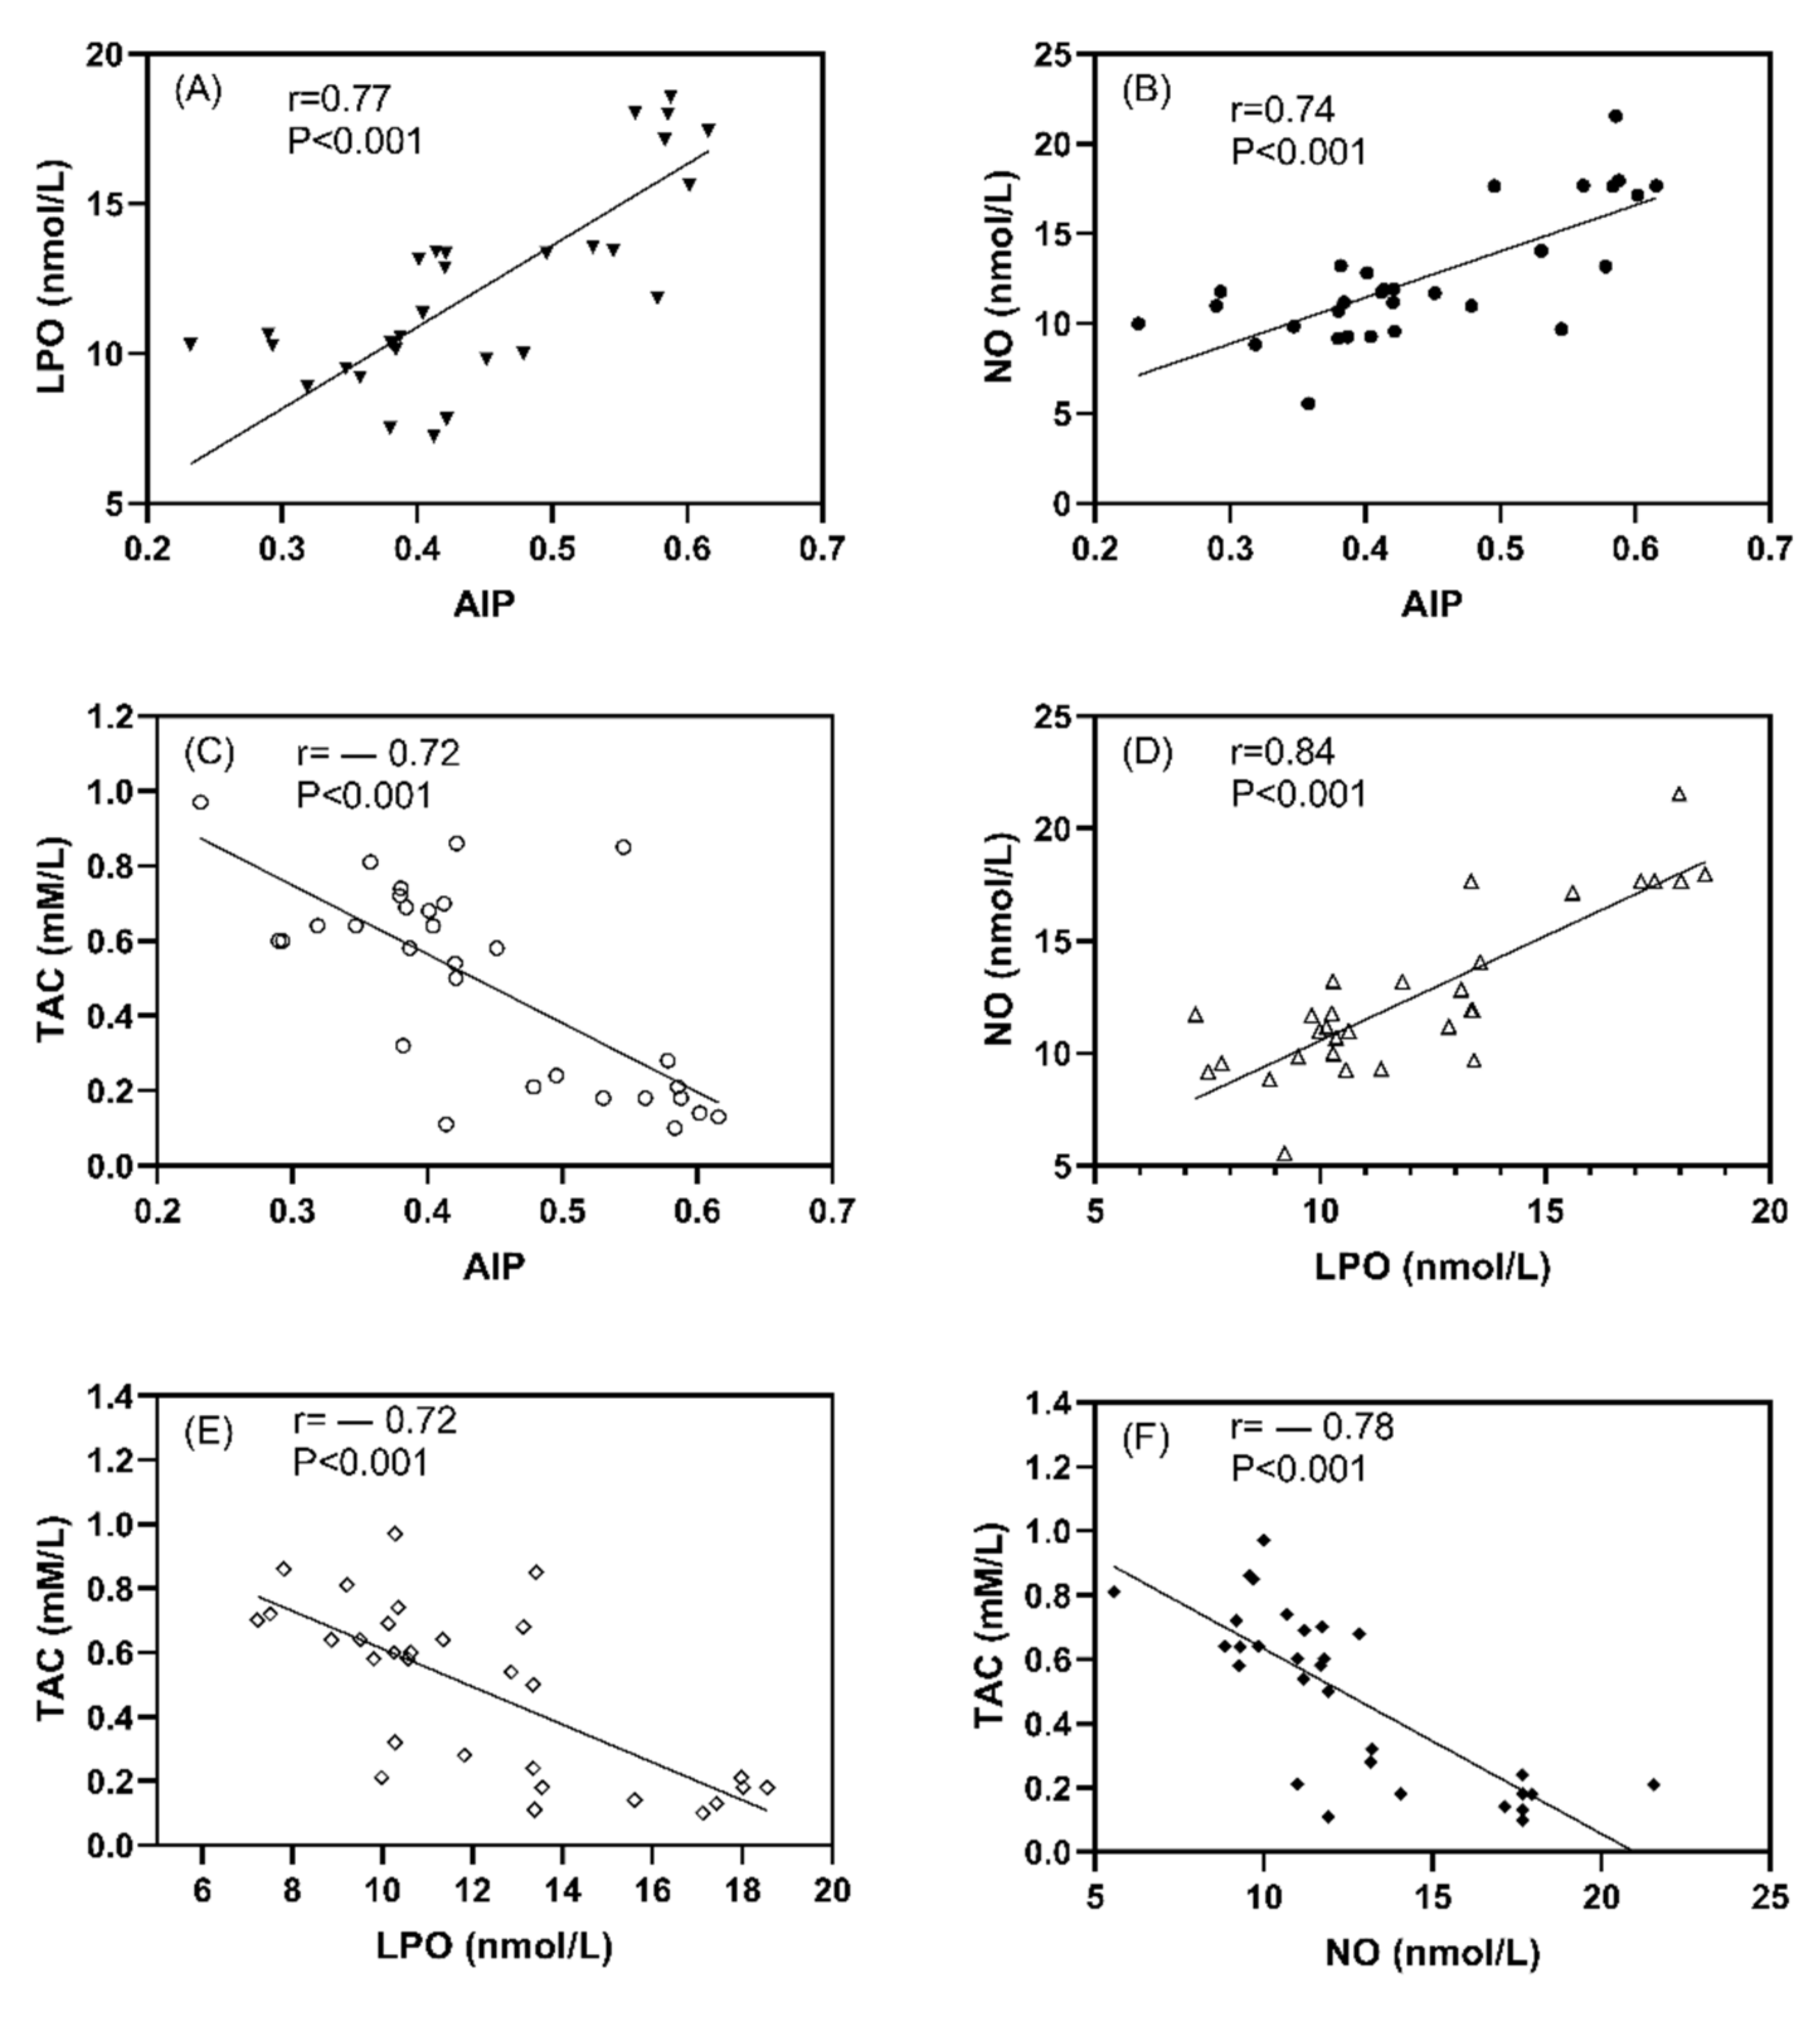
3.5. The Association between Oxidative Stress Markers and Atherogenic Index
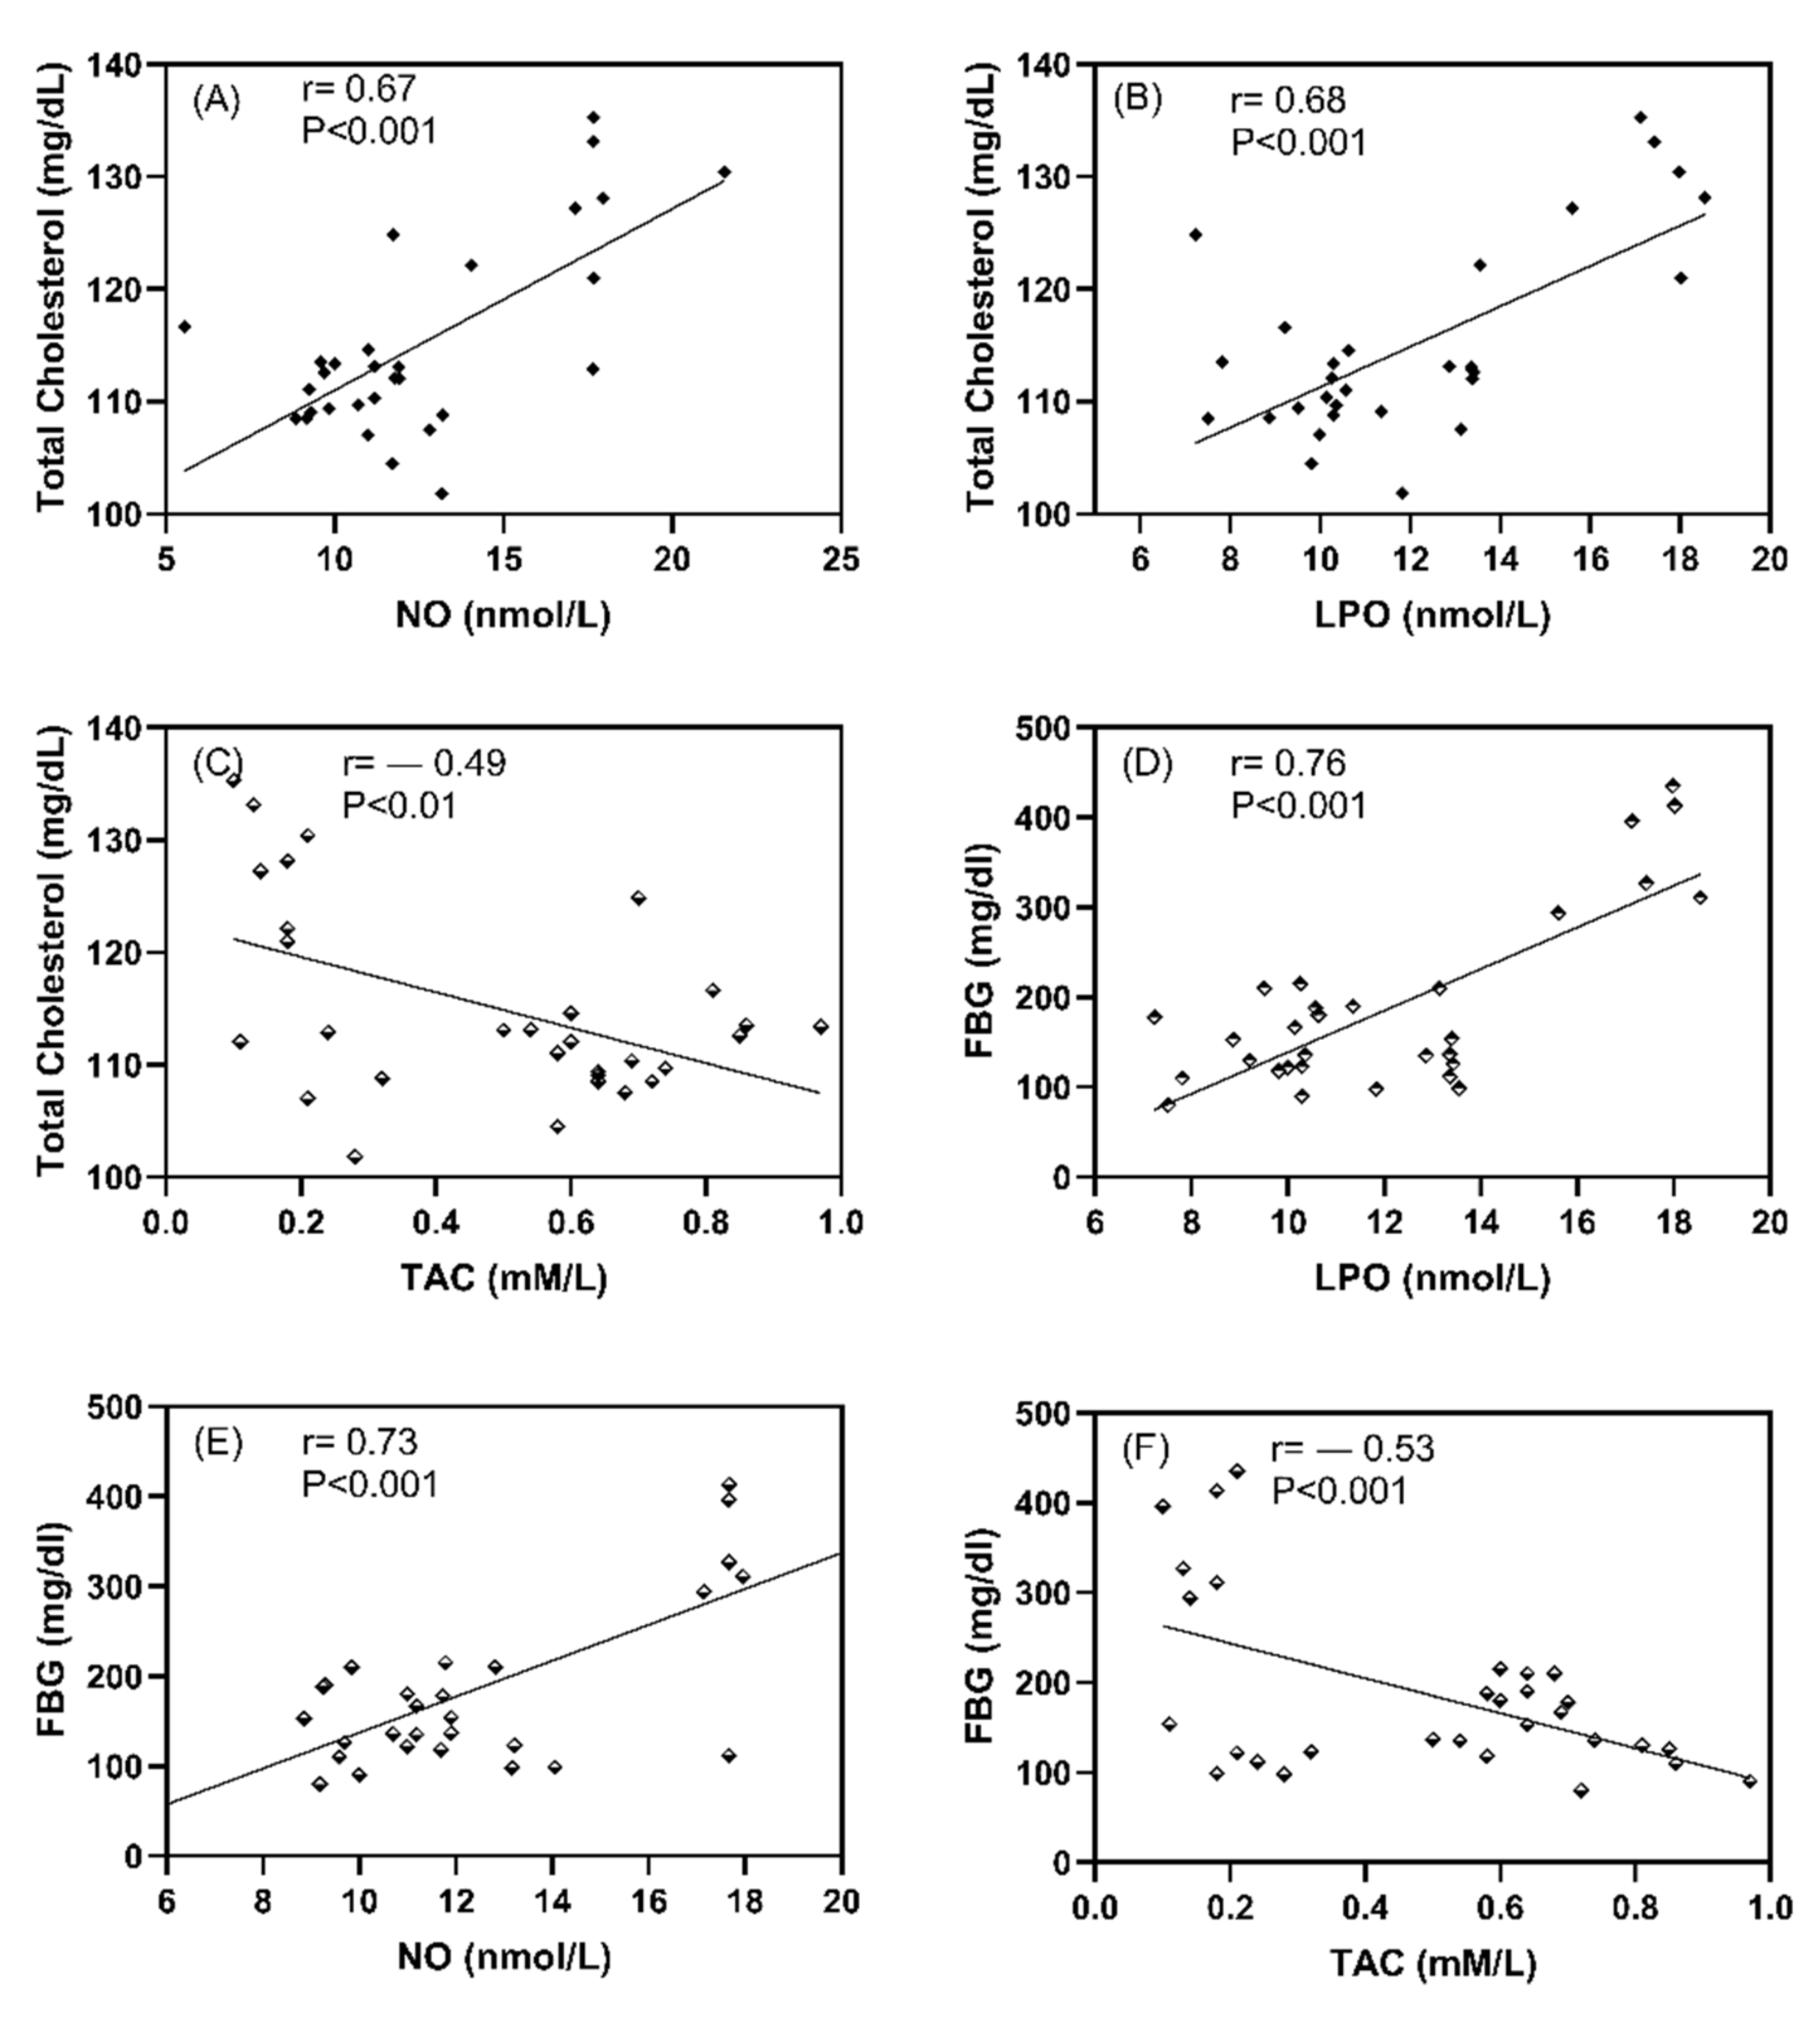
3.6. The Association between Oxidative Stress Markers and FBG and Cholesterol Levels
4. Discussion
5. Conclusions
Author Contributions
Funding
Institutional Review Board Statement
Informed Consent Statement
Data Availability Statement
Acknowledgments
Conflicts of Interest
References
- Kitabchi, A.E.; Umpierrez, G.E.; Miles, J.M.; Fisher, J.N. Hyperglycemic Crises in Adult Patients with Diabetes. Diabetes Care 2009, 32, 1335–1343. [Google Scholar] [CrossRef] [PubMed] [Green Version]
- Grindel, A.; Guggenberger, B.; Eichberger, L.; Pöppelmeyer, C.; Gschaider, M.; Tosevska, A.; Mare, G.; Briskey, D.; Brath, H.; Wagner, K.-H. Oxidative Stress, DNA Damage and DNA Repair in Female Patients with Diabetes Mellitus Type 2. PLoS ONE 2016, 11, e0162082. [Google Scholar] [CrossRef] [PubMed] [Green Version]
- Groeneveld, O.N.; Kappelle, L.J.; Biessels, G.J. Potentials of incretin-based therapies in dementia and stroke in type 2 diabetes mellitus. J. Diabetes Investig. 2016, 7, 5–16. [Google Scholar] [CrossRef] [PubMed]
- Henry, D.H.L. Hormones; Elsevier Science Publishing Company: Amsterdam, The Netherlands, 2014. [Google Scholar]
- Li, Z.; Cheng, Y.; Wang, D.; Chen, H.; Chen, H.; Ming, W.-K.; Wang, Z. Incidence Rate of Type 2 Diabetes Mellitus after Gestational Diabetes Mellitus: A Systematic Review and Meta-Analysis of 170,139 Women. J. Diabetes Res. 2020, 2020, 3076463. [Google Scholar] [CrossRef]
- Birnboim, H.C. DNA strand breaks in human leukocytes induced by superoxide anion, hydrogen peroxide and tumor promoters are repaired slowly compared to breaks induced by ionizing radiation. Carcinogenesis 1986, 7, 1511–1517. [Google Scholar] [CrossRef]
- Hueper, K.; Hartung, D.; Gutberlet, M.; Gueler, F.; Sann, H.; Husen, B.; Wacker, F.; Reiche, D. Assessment of impaired vascular reactivity in a rat model of diabetic nephropathy: Effect of nitric oxide synthesis inhibition on intrarenal diffusion and oxygenation measured by magnetic resonance imaging. Am. J. Physiol. Physiol. 2013, 305, F1428–F1435. [Google Scholar] [CrossRef] [Green Version]
- Small, D.M.; Morais, C.; Coombes, J.S.; Bennett, N.C.; Johnson, D.W.; Gobe, G.C. Oxidative stress-induced alterations in PPAR-gamma and associated mitochondrial destabilization contribute to kidney cell apoptosis. Am. J. Physiol. Renal. Physiol. 2014, 307, F814–F822. [Google Scholar] [CrossRef]
- Rahimi, R.; Nikfar, S.; Larijani, B.; Abdollahi, M. A review on the role of antioxidants in the management of diabetes and its complications. Biomed. Pharmacother. 2005, 59, 365–373. [Google Scholar] [CrossRef]
- Mooradian, A.D. Dyslipidemia in type 2 diabetes mellitus. Nat. Rev. Endocrinol. 2009, 5, 150–159. [Google Scholar] [CrossRef]
- Yuan, C.; Lai, C.W.K.; Chan, L.W.C.; Chow, M.; Law, H.K.W.; Ying, M. Cumulative Effects of Hypertension, Dyslipidemia, and Chronic Kidney Disease on Carotid Atherosclerosis in Chinese Patients with Type 2 Diabetes Mellitus. J. Diabetes Res. 2014, 2014, 179686. [Google Scholar] [CrossRef]
- Jani, Y.; Kamberi, A.; Ferati, F.; Rexhepi, A.; Pocesta, B.; Orovcanec, N.; Lala, D.; Polisi, G.; Iseni, M.; Mirto, A.; et al. Influence of dyslipidemia in control of arterial hypertension among type-2 diabetics in the western region of the Republic of Macedonia. Am. J. Cardiovasc. Dis. 2014, 4, 58–69. [Google Scholar] [PubMed]
- Farmer, J.A. Diabetic dyslipidemia and atherosclerosis: Evidence from clinical trials. Curr. Atheroscler. Rep. 2007, 9, 162–168. [Google Scholar] [CrossRef] [PubMed]
- Bajaj, S.; Khan, A. Antioxidants and diabetes. Indian J. Endocrinol. Metab 2012, 16 (Suppl. S2), S267–S271. [Google Scholar]
- Laight, D.; Carrier, M.; Änggård, E. Antioxidants, diabetes and endothelial dysfunction. Cardiovasc. Res. 2000, 47, 457–464. [Google Scholar] [CrossRef] [Green Version]
- Diwan, V.; Gobe, G.; Brown, L. Glibenclamide improves kidney and heart structure and function in the adenine-diet model of chronic kidney disease. Pharmacol. Res. 2014, 79, 104–110. [Google Scholar] [CrossRef]
- Hong, J.; Zhang, Y.; Lai, S.; Lv, A.; Su, Q.; Dong, Y.; Zhou, Z.; Tang, W.; Zhao, J.; Cui, L.; et al. Effects of Metformin Versus Glipizide on Cardiovascular Outcomes in Patients with Type 2 Diabetes and Coronary Artery Disease. Diabetes Care 2013, 36, 1304–1311. [Google Scholar] [CrossRef] [Green Version]
- Fararh, K.M.; Ibrahim, A.K.; Elsonosy, Y.A. Thymoquinone enhances the activities of enzymes related to energy metabolism in peripheral leukocytes of diabetic rats. Res. Vet. Sci. 2010, 88, 400–404. [Google Scholar] [CrossRef] [PubMed]
- Drury, P.L.; Ting, R.; Zannino, D.; Ehnholm, C.; Flack, J.R.; Whiting, M.J.; Fassett, R.G.; Ansquer, J.-C.; Dixon, P.H.; E Davis, T.M.; et al. Estimated glomerular filtration rate and albuminuria are independent predictors of cardiovascular events and death in type 2 diabetes mellitus: The Fenofibrate Intervention and Event Lowering in Diabetes (FIELD) study. Diabetologia 2011, 54, 32–43. [Google Scholar] [CrossRef]
- Tsai, S.-F.; Chen, C.-H. Management of Diabetes Mellitus in Normal Renal Function, Renal Dysfunction and Renal Transplant Recipients, Focusing on Glucagon-Like Peptide-1 Agonist: A Review Based upon Current Evidence. Int. J. Mol. Sci. 2019, 20, 3152. [Google Scholar] [CrossRef] [PubMed] [Green Version]
- Farmer, A.J.; Stevens, R.; Hirst, J.; Lung, T.; Oke, J.; Clarke, P.; Glasziou, P.; Neil, A.; Dunger, P.D.; Colhoun, H.; et al. Optimal strategies for identifying kidney disease in diabetes: Properties of screening tests, progression of renal dysfunction and impact of treatment—Systematic review and modelling of progression and cost-effectiveness. Heal. Technol. Assess. 2014, 18, 1–128. [Google Scholar] [CrossRef] [Green Version]
- de Boer, I.H.; Rue, T.C.; Cleary, P.A.; Lachin, J.M.; Molitch, M.E.; Steffes, M.W.; Sun, W.; Zinman, B.; Brunzell, J.D.; Diabetes Control and Complications Trial/Epidemiology of Diabetes Interventions and Complications Study Research Group. Long-term renal outcomes of patients with type 1 diabetes mellitus and microalbuminuria: An analysis of the Diabetes Control and Complications Trial/Epidemiology of Diabetes Interventions and Complications cohort. Arch. Intern. Med. 2011, 171, 412–420. [Google Scholar]
- Chakraborty, A.; Chowdhury, S.; Bhattacharyya, M. Effect of metformin on oxidative stress, nitrosative stress and inflammatory biomarkers in type 2 diabetes patients. Diabetes Res. Clin. Pr. 2011, 93, 56–62. [Google Scholar] [CrossRef] [PubMed]
- Kim, H.-S.; Shin, J.-A.; Lee, S.-H.; Kim, E.-S.; Cho, J.-H.; Son, H.-Y.; Yoon, K.-H. A Comparative Study of the Effects of a Dipeptidyl Peptidase-IV Inhibitor and Sulfonylurea on Glucose Variability in Patients with Type 2 Diabetes with Inadequate Glycemic Control on Metformin. Diabetes Technol. Ther. 2013, 15, 810–816. [Google Scholar] [CrossRef] [PubMed]
- Al-Gareeb, A.I.; Alrubai, H.F.; Suliaman, S.M. Effects of gliclazide add on metformin on serum omentin-1 levels in patients with type 2 diabetes mellitus. Indian J. Endocrinol. Metab. 2016, 20, 195–198. [Google Scholar] [CrossRef]
- Alsharidah, M.; Algeffari, M.; Abdel-Moneim, A.-M.H.; Lutfi, M.F.; Alshelowi, H. Effect of combined gliclazide/metformin treatment on oxidative stress, lipid profile, and hepatorenal functions in type 2 diabetic patients. Saudi Pharm. J. 2018, 26, 1–6. [Google Scholar] [CrossRef]
- Sutter, J. Maget M-Guide d’étude directe des comportements culturels. Population 1953, 8, 805. [Google Scholar]
- Futfi, M.F.; Abdel-Moneim, A.-M.; Alsharidah, A.; Mobark, M.; Abdellatif, A.; Saleem, I.; Al Rugaie, O.; Mohany, K.; Alsharidah, M. Thymoquinone Lowers Blood Glucose and Reduces Oxidative Stress in a Rat Model of Diabetes. Molecules 2021, 26, 2348. [Google Scholar]
- Alsharidah, M.; Abdel-Moneim, A.-M.; Alsharidah, A.; Mobark, M.; Rahmani, A.; Shata, A.; Abdellatif, A.; El-Readi, M.; Mohany, K.; Al Rugaie, O. Thymoquinone, but Not Metformin, Protects against Gentamicin-Induced Nephrotoxicity and Renal Dysfunction in Rats. Appl. Sci. 2021, 11, 3981. [Google Scholar] [CrossRef]
- Faul, F.; Erdfelder, E.; Lang, A.-G.; Buchner, A. G*Power 3: A flexible statistical power analysis program for the social, behavioral, and biomedical sciences. Behav. Res. Methods 2007, 39, 175–191. [Google Scholar] [CrossRef]
- Molehin, O.R.; Oloyede, O.I.; Adefegha, S.A. Streptozotocin-induced diabetes in rats: Effects of White Butterfly (Clerodendrum volubile) leaves on blood glucose levels, lipid profile and antioxidant status. Toxicol. Mech. Methods 2018, 28, 573–586. [Google Scholar] [CrossRef]
- Masiello, P.; Broca, C.; Gross, R.; Roye, M.; Manteghetti, M.; Hillaire-Buys, D.; Novelli, M.; Ribes, G. Experimental NIDDM: Development of a new model in adult rats administered streptozotocin and nicotinamide. Diabetes 1998, 47, 224–229. [Google Scholar] [CrossRef] [PubMed]
- Furman, B.L. Streptozotocin-Induced Diabetic Models in Mice and Rats. Curr. Protoc. Pharmacol. 2015, 70, 5.47.1–5.47.20. [Google Scholar] [CrossRef] [PubMed]
- Manabe, Y.; Tochigi, M.; Moriwaki, A.; Takeuchi, S.; Takahashi, S. Insulin-like Growth Factor 1 mRNA Expression in the Uterus of Streptozotocin-treated Diabetic Mice. J. Reprod. Dev. 2013, 59, 398–404. [Google Scholar] [CrossRef] [PubMed] [Green Version]
- Tanaka, Y.; Uchino, H.; Shimizu, T.; Yoshii, H.; Niwa, M.; Ohmura, C.; Mitsuhashi, N.; Onuma, T.; Kawamori, R. Effect of metformin on advanced glycation endproduct formation and peripheral nerve function in streptozotocin-induced diabetic rats. Eur. J. Pharmacol. 1999, 376, 17–22. [Google Scholar] [CrossRef]
- Dagchi, C.; Das, S.; Mitra, A.; De Pati, A.; Tripathi, S.K.; Datta, A. Antidiabetic and antihyperlipidemic activity of hydroalcoholic extract of Withania coagulans Dunal dried fruit in experimental rat models. J. Ayurveda Integr. Med. 2013, 4, 99–106. [Google Scholar]
- Riley, V. Adaptation of Orbital Bleeding Technic to Rapid Serial Blood Studies. Exp. Biol. Med. 1960, 104, 751–754. [Google Scholar] [CrossRef] [PubMed]
- Bunn, H.F.; Haney, D.N.; Kamin, S.; Gabbay, K.H.; Gallop, P.M. The biosynthesis of human hemoglobin A1c. Slow glycosylation of hemoglobin in vivo. J. Clin. Investig. 1976, 57, 1652–1659. [Google Scholar] [CrossRef] [Green Version]
- Ohkawa, H.; Ohishi, N.; Yagi, K. Assay for lipid peroxides in animal tissues by thiobarbituric acid reaction. Anal. Biochem. 1979, 95, 351–358. [Google Scholar] [CrossRef]
- Miranda, K.M.; Espey, M.G.; Wink, D.A. A Rapid, Simple Spectrophotometric Method for Simultaneous Detection of Nitrate and Nitrite. Nitric Oxide 2001, 5, 62–71. [Google Scholar] [CrossRef] [PubMed]
- Koracevic, D.; Harris, G.; Rayner, A.; Blair, J.; Watt, B. Method for the measurement of antioxidant activity in human fluids. J. Clin. Pathol. 2001, 54, 356–361. [Google Scholar] [CrossRef] [Green Version]
- Fossati, P.; Prencipe, L. Serum triglycerides determined colorimetrically with an enzyme that produces hydrogen peroxide. Clin. Chem. 1982, 28, 2077–2080. [Google Scholar] [CrossRef]
- Allain, C.C.; Poon, L.S.; Chan, C.S.; Richmond, W.; Fu, P.C. Enzymatic determination of total serum cholesterol. Clin. Chem. 1974, 20, 470–475. [Google Scholar] [CrossRef]
- Warnick, G.R.; Albers, J.J. A comprehensive evaluation of the heparin–manganese precipitation procedure for estimating high density lipoprotein cholesterol. J. Lipid Res. 1978, 19, 65–76. [Google Scholar] [CrossRef]
- Nauck, M.; Warnick, G.R.; Rifai, N. Methods for measurement of LDL-cholesterol: A critical assessment of direct measurement by homogeneous assays versus calculation. Clin. Chem. 2002, 48, 236–254. [Google Scholar] [CrossRef] [PubMed]
- Crook, M.A. Plasma Lipids and Lipoproteins; Medicine, C.C.a.M., Ed.; Edwarld Arnold publishers Ltd.: London, UK, 2006. [Google Scholar]
- Dobiasova, M.; Frohlich, J. The plasma parameter log (TG/HDL-C) as an atherogenic index: Correlation with lipoprotein particle size and esterification rate in apoB-lipoprotein-depleted plasma (FER(HDL)). Clin. Biochem. 2001, 34, 583–588. [Google Scholar] [CrossRef]
- Fabiny, D.L.; Ertingshausen, G. Automated Reaction-Rate Method for Determination of Serum Creatinine with the CentrifiChem. Clin. Chem. 1971, 17, 696–700. [Google Scholar] [CrossRef] [PubMed]
- Tabacco, A.; Meiattini, F.; Moda, E.; Tarli, P. Simplified enzymic/colorimetric serum urea nitrogen determination. Clin. Chem. 1979, 25, 336–337. [Google Scholar] [CrossRef] [PubMed]
- Gili-Ahmadabadi, A.; Ghobadi, S.; Dastan, D.; Soleimani, M. Hepatoprotective potential and antioxidant activity of Allium tripedale in acetaminophen-induced oxidative damage. Res. Pharm. Sci. 2019, 14, 488–495. [Google Scholar] [CrossRef]
- Valente, T.; Arbex, A.K. Glycemic Variability, Oxidative Stress, and Impact on Complications Related to Type 2 Diabetes Mellitus. Curr. Diabetes Rev. 2021, 17, e071620183816. [Google Scholar] [CrossRef] [PubMed]
- França, C.N.; Mendes, C.; Ferreira, C. Time collection and storage conditions of lipid profile. Braz. J. Med. Biol. Res. 2018, 51, e6955. [Google Scholar] [CrossRef] [PubMed] [Green Version]
- Erem, C.İ.; Ozbas, H.M.; Nuhoglu, I.; Deger, O.R.; Civan, N.A.; Ersoz, H.O. Comparison of effects of gliclazide, metformin and pioglitazone monotherapies on glycemic control and cardiovascular risk factors in patients with newly diagnosed uncontrolled type 2 diabetes mellitus. Exp. Clin. Endocrinol. Diabetes. 2014, 122, 295–302. [Google Scholar] [CrossRef] [PubMed]
- Banik, S.; Hossain, M.S.; Bhatta, R.; Akter, M. Attenuation of lipid peroxidation and atherogenic factors in diabetic patients treated with gliclazide and metformin. J. Res. Med. Sci. 2018, 23, 77. [Google Scholar] [CrossRef]
- Hassan, M.; Abd-Allah, G.M. Effects of metformin plus gliclazide versus metformin plus glimepiride on cardiovascular risk factors in patients with type 2 diabetes mellitus. Pak. J. Pharm. Sci. 2015, 28, 1723–1730. [Google Scholar] [PubMed]
- Tessier, D.; Maheux, P.; Khalil, A.; Fülöp, T. Effects of gliclazide versus metformin on the clinical profile and lipid peroxidation markers in type 2 diabetes. Metabolism 1999, 48, 897–903. [Google Scholar] [CrossRef]
- Agarwal, R. Anti-inflammatory effects of short-term pioglitazone therapy in men with advanced diabetic nephropathy. Am. J. Physiol. Physiol. 2006, 290, F600–F605. [Google Scholar] [CrossRef] [PubMed]
- Esteghamati, A.; Eskandari, D.; Mirmiranpour, H.; Noshad, S.; Mousavizadeh, K.; Hedayati, M.; Nakhjavani, M. Effects of metformin on markers of oxidative stress and antioxidant reserve in patients with newly diagnosed type 2 diabetes: A randomized clinical trial. Clin. Nutr. 2013, 32, 179–185. [Google Scholar] [CrossRef] [PubMed]
- Zhang, Y.; Hu, C.; Hong, J.; Zeng, J.; Lai, S.; Lv, A.; Su, Q.; Dong, Y.; Zhou, Z.; Tang, W.; et al. Lipid Profiling Reveals Different Therapeutic Effects of Metformin and Glipizide in Patients With Type 2 Diabetes and Coronary Artery Disease. Diabetes Care 2014, 37, 2804–2812. [Google Scholar] [CrossRef] [PubMed] [Green Version]
- Liu, X.-H.; Li, X.-M.; Han, C.-C.; Fang, X.-F.; Ma, L. Effects of combined therapy with glipizide and Aralia root bark extract on glycemic control and lipid profiles in patients with type 2 diabetes mellitus. J. Sci. Food Agric. 2015, 95, 739–744. [Google Scholar] [CrossRef]
- Rosenstock, J.; Wilson, C.; Fleck, P. Alogliptin versus glipizide monotherapy in elderly type 2 diabetes mellitus patients with mild hyperglycaemia: A prospective, double-blind, randomized, 1-year study. Diabetes Obes. Metab. 2013, 15, 906–914. [Google Scholar] [CrossRef]
- Taskinen, M.-R.; Nikkilä, E.A. Lipoprotein lipase of adipose tissue and skeletal muscle in human obesity: Response to glucose and to semistarvation. Metabolism 1981, 30, 810–817. [Google Scholar] [CrossRef]
- Okoro, R.N.; Farate, V.T. The use of nephrotoxic drugs in patients with chronic kidney disease. Int. J. Clin. Pharm. 2019, 41, 767–775. [Google Scholar] [CrossRef] [PubMed]


Publisher’s Note: MDPI stays neutral with regard to jurisdictional claims in published maps and institutional affiliations. |
© 2022 by the authors. Licensee MDPI, Basel, Switzerland. This article is an open access article distributed under the terms and conditions of the Creative Commons Attribution (CC BY) license (https://creativecommons.org/licenses/by/4.0/).
Share and Cite
Abdel-Moneim, A.-M.H.; Lutfi, M.F.; Alsharidah, A.S.; Shaker, G.; Faisal, W.; Abdellatif, A.A.H.; Rugaie, O.A.; Mohany, K.M.; Eid, S.Y.; El-Readi, M.Z.; et al. Short-Term Treatment of Metformin and Glipizide on Oxidative Stress, Lipid Profile and Renal Function in a Rat Model with Diabetes Mellitus. Appl. Sci. 2022, 12, 2019. https://doi.org/10.3390/app12042019
Abdel-Moneim A-MH, Lutfi MF, Alsharidah AS, Shaker G, Faisal W, Abdellatif AAH, Rugaie OA, Mohany KM, Eid SY, El-Readi MZ, et al. Short-Term Treatment of Metformin and Glipizide on Oxidative Stress, Lipid Profile and Renal Function in a Rat Model with Diabetes Mellitus. Applied Sciences. 2022; 12(4):2019. https://doi.org/10.3390/app12042019
Chicago/Turabian StyleAbdel-Moneim, Abdel-Moneim Hafez, Mohamed Faisal Lutfi, Ashwag Saleh Alsharidah, Gehan Shaker, Waleed Faisal, Ahmed A. H. Abdellatif, Osamah Al Rugaie, Khalid M. Mohany, Safaa Yehia Eid, Mahmoud Zaki El-Readi, and et al. 2022. "Short-Term Treatment of Metformin and Glipizide on Oxidative Stress, Lipid Profile and Renal Function in a Rat Model with Diabetes Mellitus" Applied Sciences 12, no. 4: 2019. https://doi.org/10.3390/app12042019
APA StyleAbdel-Moneim, A.-M. H., Lutfi, M. F., Alsharidah, A. S., Shaker, G., Faisal, W., Abdellatif, A. A. H., Rugaie, O. A., Mohany, K. M., Eid, S. Y., El-Readi, M. Z., & Alsharidah, M. (2022). Short-Term Treatment of Metformin and Glipizide on Oxidative Stress, Lipid Profile and Renal Function in a Rat Model with Diabetes Mellitus. Applied Sciences, 12(4), 2019. https://doi.org/10.3390/app12042019