Article

Automatic Identification of Emotional Information in Spanish TV Debates and Human–Machine Interactions

Iniversidad del País Vasco UPV/EHU, Department of Electrical and Electronics, Faculty of Science and Technology, 48940 Leioa, Spain
*
Author to whom correspondence should be addressed.
Appl. Sci. 2022, 12(4), 1902; https://doi.org/10.3390/app12041902
Submission received: 30 December 2021 / Revised: 31 January 2022 / Accepted: 4 February 2022 / Published: 11 February 2022

Abstract

:
Automatic emotion detection is a very attractive field of research that can help build more natural human–machine interaction systems. However, several issues arise when real scenarios are considered, such as the tendency toward neutrality, which makes it difficult to obtain balanced datasets, or the lack of standards for the annotation of emotional categories. Moreover, the intrinsic subjectivity of emotional information increases the difficulty of obtaining valuable data to train machine learning-based algorithms. In this work, two different real scenarios were tackled: human–human interactions in TV debates and human–machine interactions with a virtual agent. For comparison purposes, an analysis of the emotional information was conducted in both. Thus, a profiling of the speakers associated with each task was carried out. Furthermore, different classification experiments show that deep learning approaches can be useful for detecting speakers’ emotional information, mainly for arousal, valence, and dominance levels, reaching a 0.7 F 1 -score.

1. Introduction

Emotion expression and perception is a very important issue in human interactions and is one of the bases upon which the communication between humans is established. Therefore, the automatic detection of emotions by a computer has become a very attractive topic due to its impact on the effort towards more natural and empathic human–machine interaction systems. Emotions can be expressed in different ways, including facial expression, speech, gestures, etc. In this work, we focus on speech and its ability to provide diverse information.
In addition to the message communicated, speech signals can provide information related to different aspects of the speaker. In fact, speech signals can give insights into the emotional state of the speaker or even their baseline mood, as shown in many studies about this issue [1,2]. The probability of suffering from a disease, such as depression, Alzheimer’s disease [3,4,5], or even COVID-19 [6], can also be extracted from speech. However, speech may also be influenced by several other variables, such as the speaker’s habits, personality, culture, or specific objective [7,8].
Human–human interactions take place in specific contexts where, to some extent, people know each other. However, current artificial agents have little capacity to imitate a real user, resulting in shallow interactions [9]. In fact, users find it hard to interact with agents with rudimentary visual and speech capacities [10]. The literature suggests that human behavior in human–human interactions is guided by the other human’s behavior and is, thus, reactionary behavior [11]. However, comparisons between these two scenarios have almost only been carried out at the interaction and dialogue levels [9,11]. The emotional exchange in both scenarios is completely different due the rudimentary emotional capacity of the agent, which results in very subtle emotions. This work aims to contrast the similarities and differences for emotions identified in two very different scenarios: human–human interactions on Spanish TV debates (TV Debates) and human–machine interactions with a virtual agent developed by the H2020 EMPATHIC project (http://www.empathic-project.eu, accessed on 3 February 2022) (Empathic VA), also in Spanish. Thus, we profile the task in each scenario or, more specifically, the speakers involved in each task. Although they are quite different, they both share the spontaneity of speech, as well as the spontaneity of the expression of emotions in real scenarios [12].
Disfluencies or spontaneous speech events, such as filled pauses or speech repairs, enrich spontaneous communication [13] with paralinguistic information that depends on the context, on the speaker profile, and on emotional state. In recent years, research on spontaneously expressed emotions in everyday tasks has gained interest in the scientific community [14,15]. However, this research has typically been conducted on emotions simulated by professional actors in artificially designed databases such as EMODB [16] or IEMOCAP [17]. The six basic emotions defined by Eckman [18] (anger, surprise, disgust, enjoyment, fear, and sadness) can be represented by facial expressions that typically characterize these emotions and thus can be used in the automatic identification of emotions on a face [19]. However, spontaneous emotions are more varied and complex. Furthermore, emotions expressed during acting or during a real-life scenario show significant differences [20]. In fact, only a small set of complex and compound emotions [21] can be found in real scenarios [2,15,
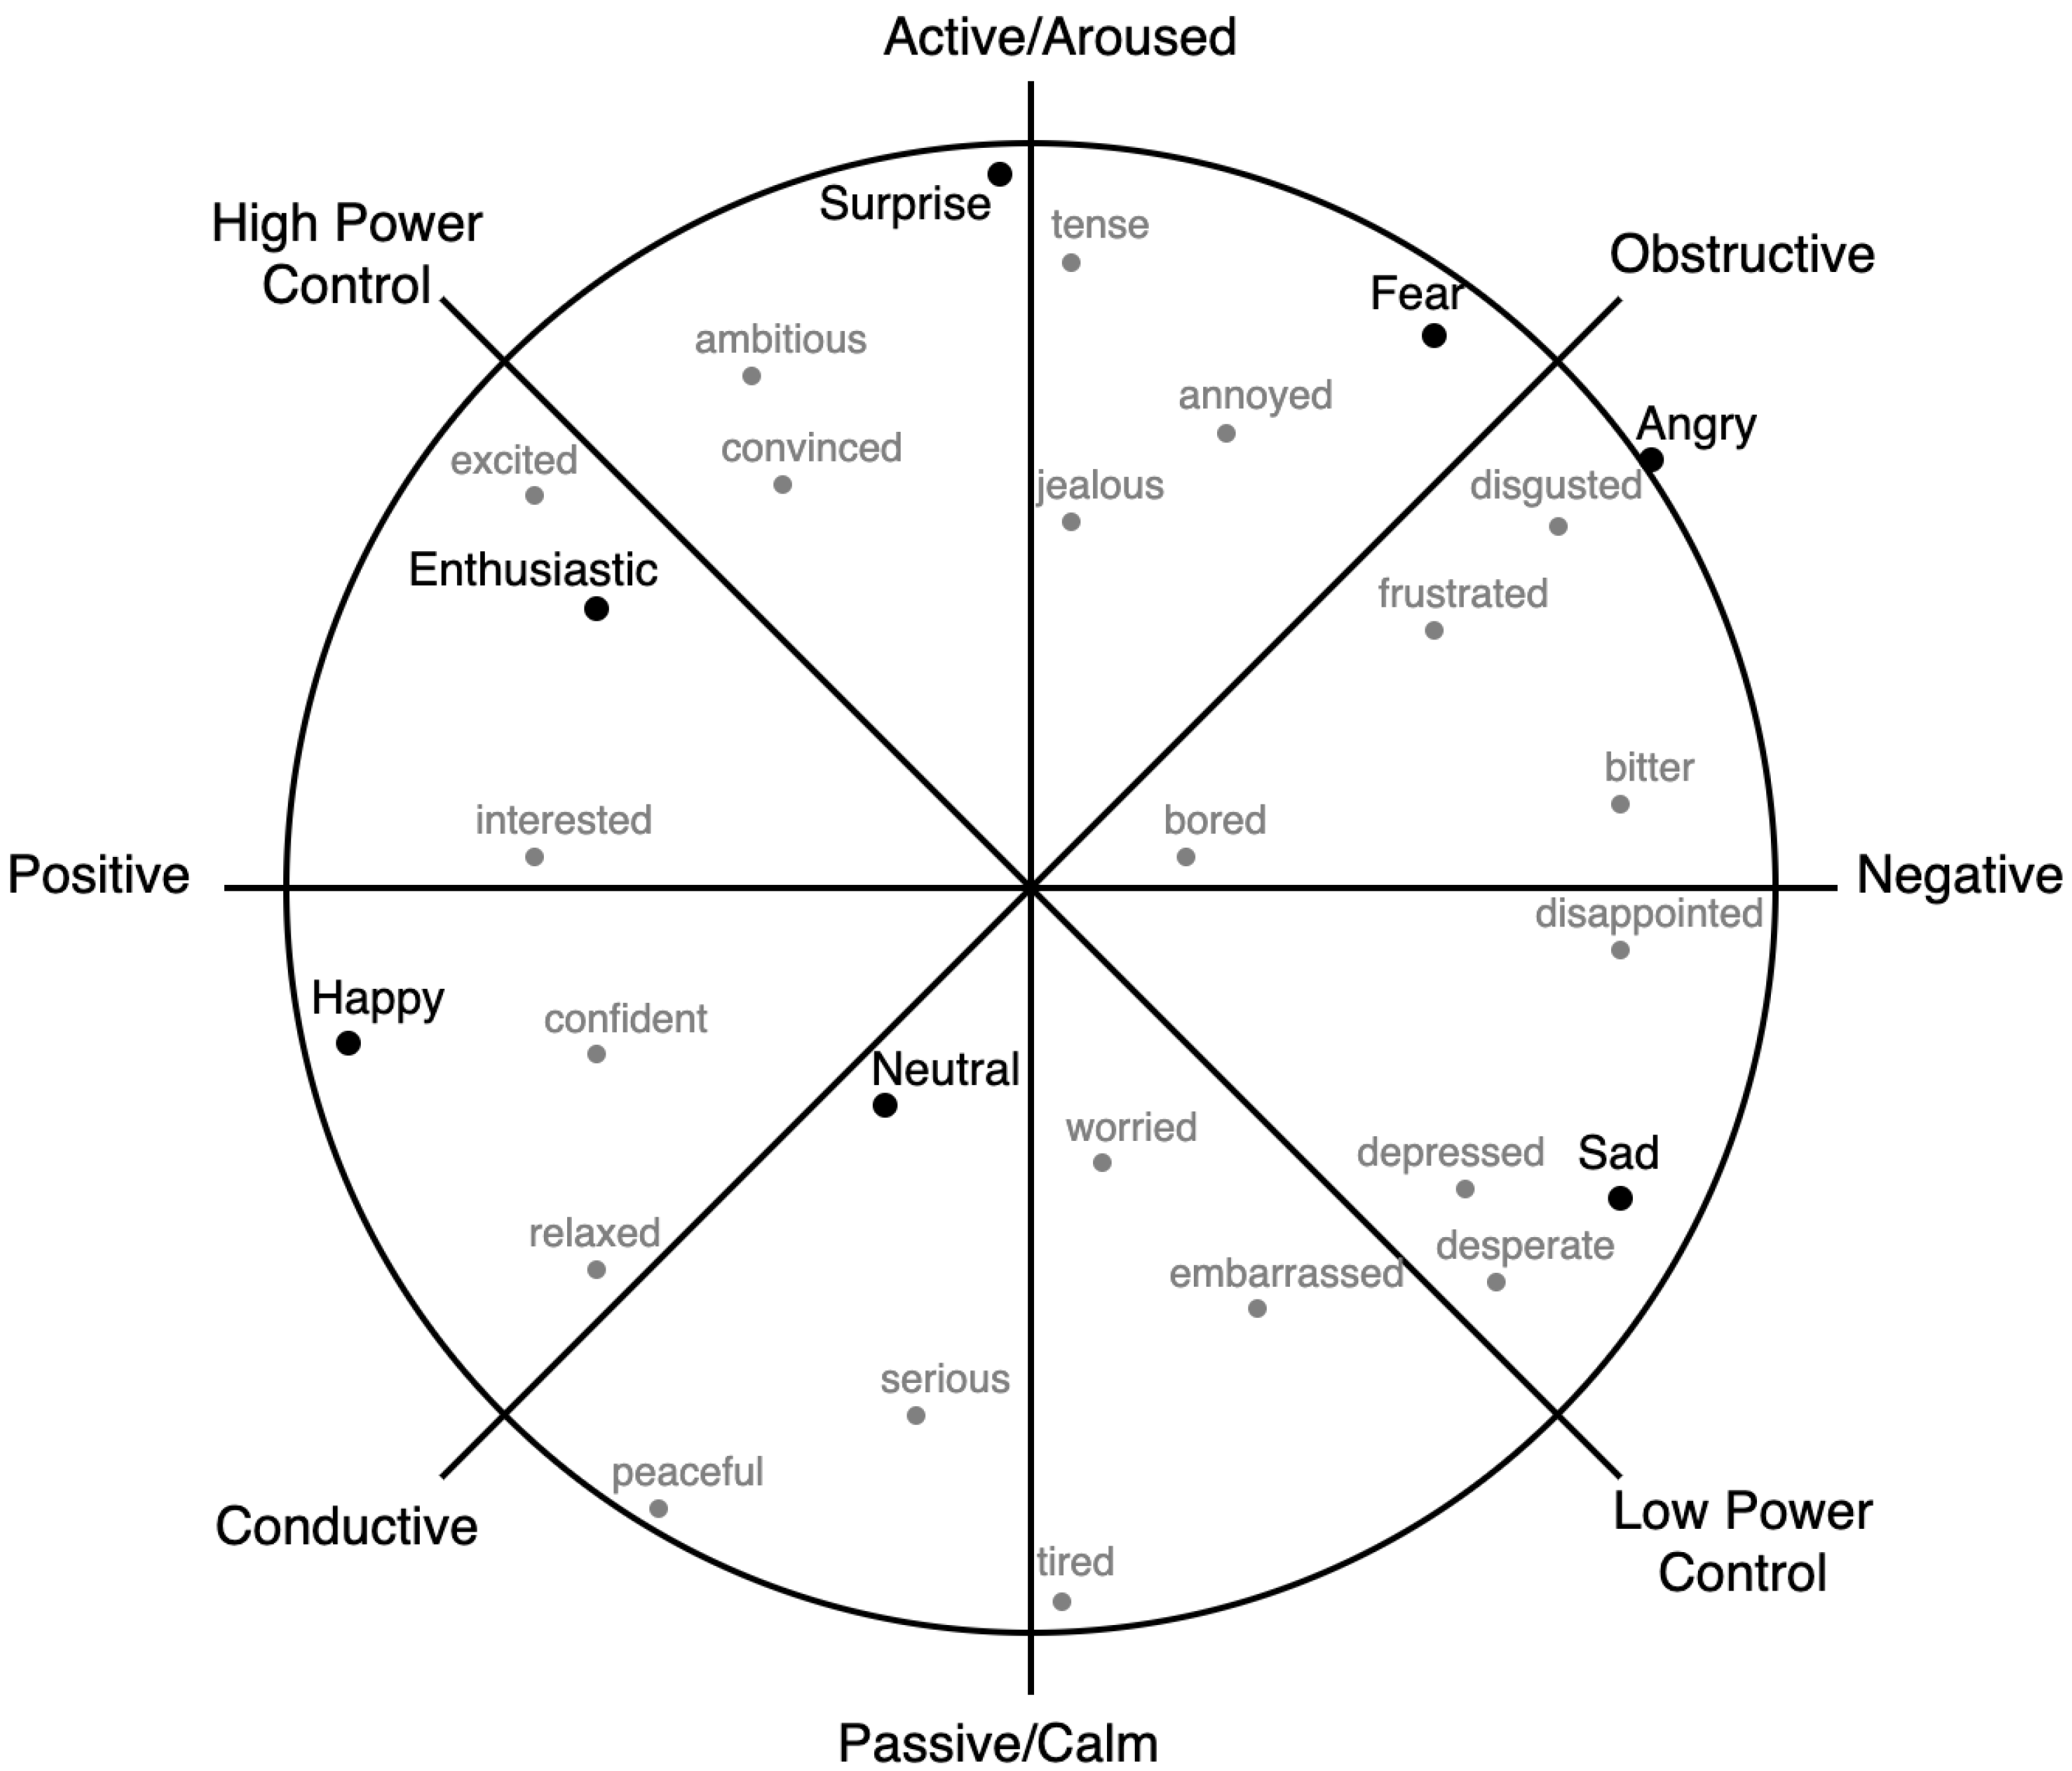
22], and this subset is strongly dependent on the situation. Therefore, a set of categories including the emotions that arise in each specific task has to be defined. To this end, some perception experiments have to be conducted to specify the set of emotions of interest. However, this process is expensive; time consuming; and sometimes, not viable. Alternatively, and assuming that ordinary communication involves a variety of complex feelings that cannot be characterized by a reduced set of categories, a number of researchers [23,24] proposed a dimensional representation [25] of the emotional space. Thus, each affective state is represented by a point in a two-dimensional space, namely valence and arousal, which space some authors extend to three dimensions by also considering dominance (also known as the VAD model). This work employs both approaches to analyze emotional information.
Additionally, spontaneous emotions cannot be unambiguously perceived, not even by experts. In fact, the emotional label assigned by a speaker to their own utterances might differ from those assigned by a listener, with the former being, of course, more accurate [26]. In this work, we draw from some works dealing with the annotation of a virtual agent [22,27] that provide insights into the problems associated with this kind of annotation. The intrinsic subjectivity of this task makes obtaining a ground truth for emotional states associated with an audio signal using either the categorical or the dimensional model difficult. According to some work, such as the one presented in [28], this subjectivity cannot be properly gathered when experts label emotions; therefore, a more useful representation based on the interpretation of emotions across a crowd should be used. In this work, crowd annotations, using a crowdsourcing platform [29], was carried out to obtain emotional labels for both the VAD and categorical models. This methodology led to two corpora for each task: (a) TV debates labeled in terms of discrete categories, (b) TV debates labeled in terms of the VAD model, (c) empathic VAs labeled in terms of discrete categories, and (d) empathic VAs labeled in terms of the VAD model.
In the context of interactions, annotations are usually carried at the turn or dialogue levels [9]. However, the debate on the minimum temporal length of the audio for which the emotions can be extracted reliably remain open. This length has usually been set in tuning experiments for a particular situation [26]. In contrast, in this work, we propose utterances compatible with clauses as segments to be annotated and develop an algorithm to obtain them from speech signal.
Once a labeled corpus is designed, a machine learning-based system can be built to carry out automatic emotion detection. One of the first steps in creating such a system is to identify which acoustic features are the most suitable for detecting emotions. In recent years, promoted by challenges such as the INTERSPEECH Computational Paralinguistic Challenge [30], several attempts have been made to obtain such a set, such as the minimalist set of GeMAPS speech features proposed in [31]. However, several studies [32,33] suggested that no universal acoustic features that extract emotional content and work well in all contexts exist. Low-level descriptors (LLD) [33,
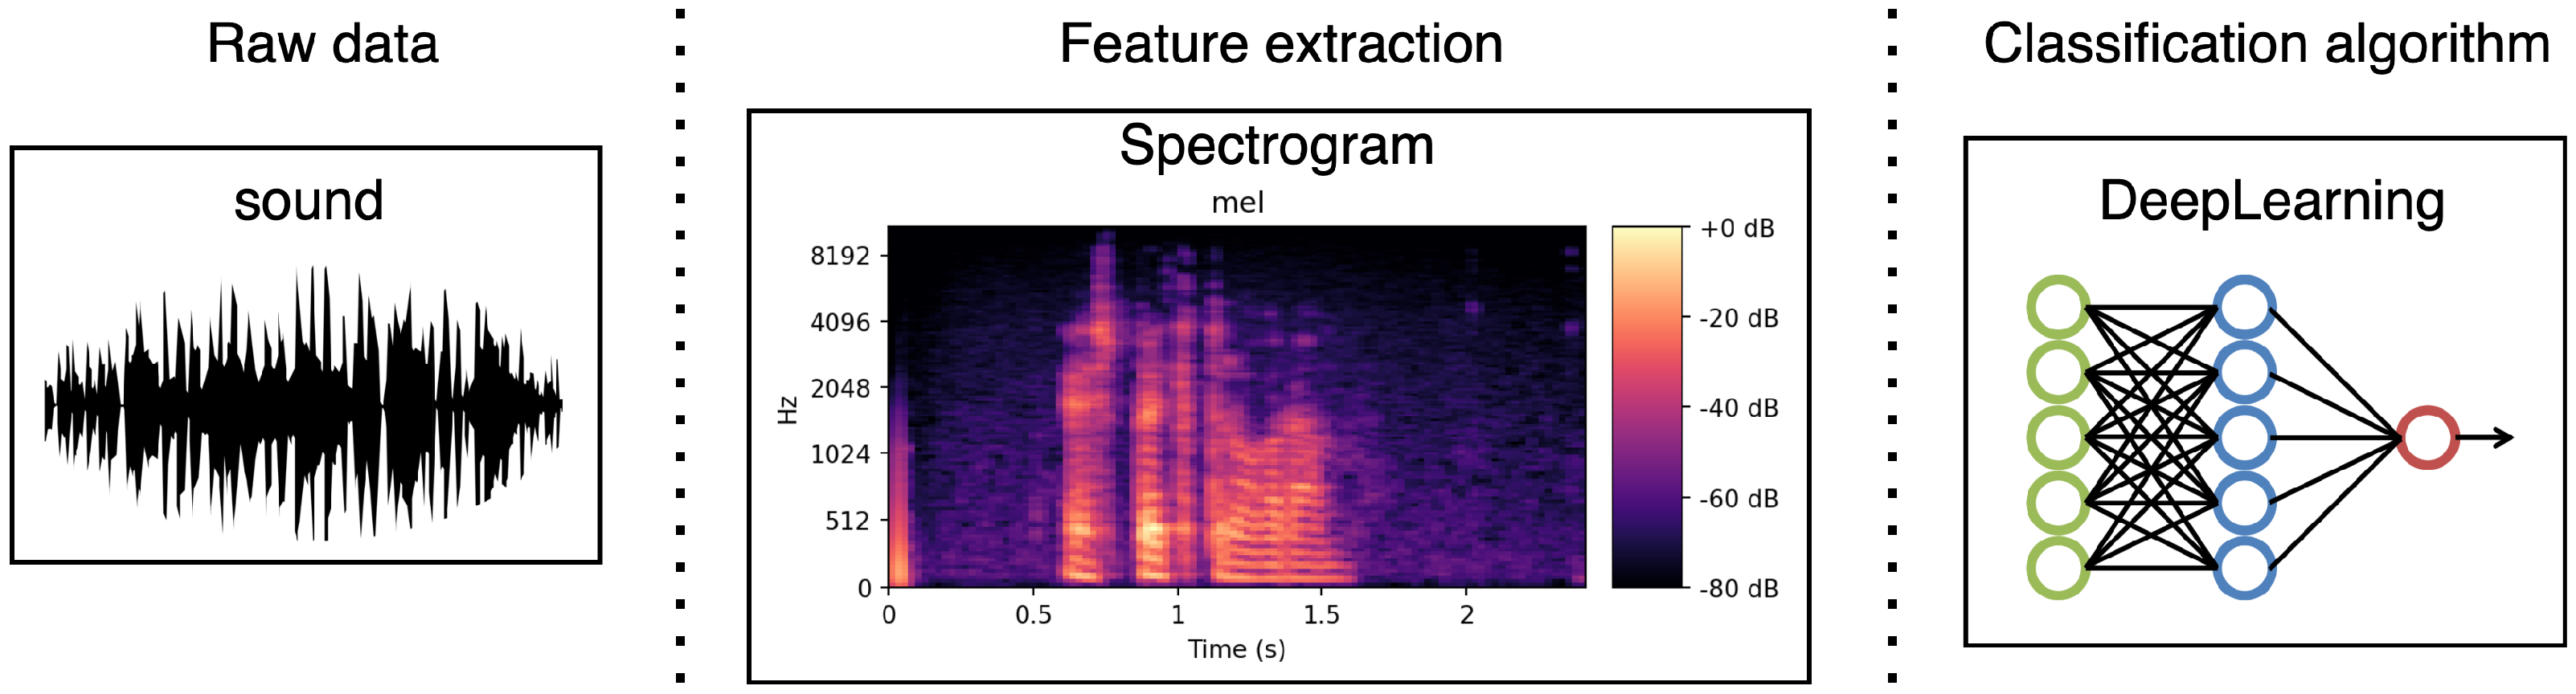
34] based on characteristics related to prosody (pitch, formants, energy, jitter, and shimmer) or to the spectrum (centroid, flux, and entropy), and its functionals (mean, std, quartiles 1–3, delta, etc.) have been widely used. Alternatively, some authors avoided LLD features and let a neural network extract the emotional features in the first layers using other speech representations, such as a spectrogram [35,36,37] or a raw audio signal [
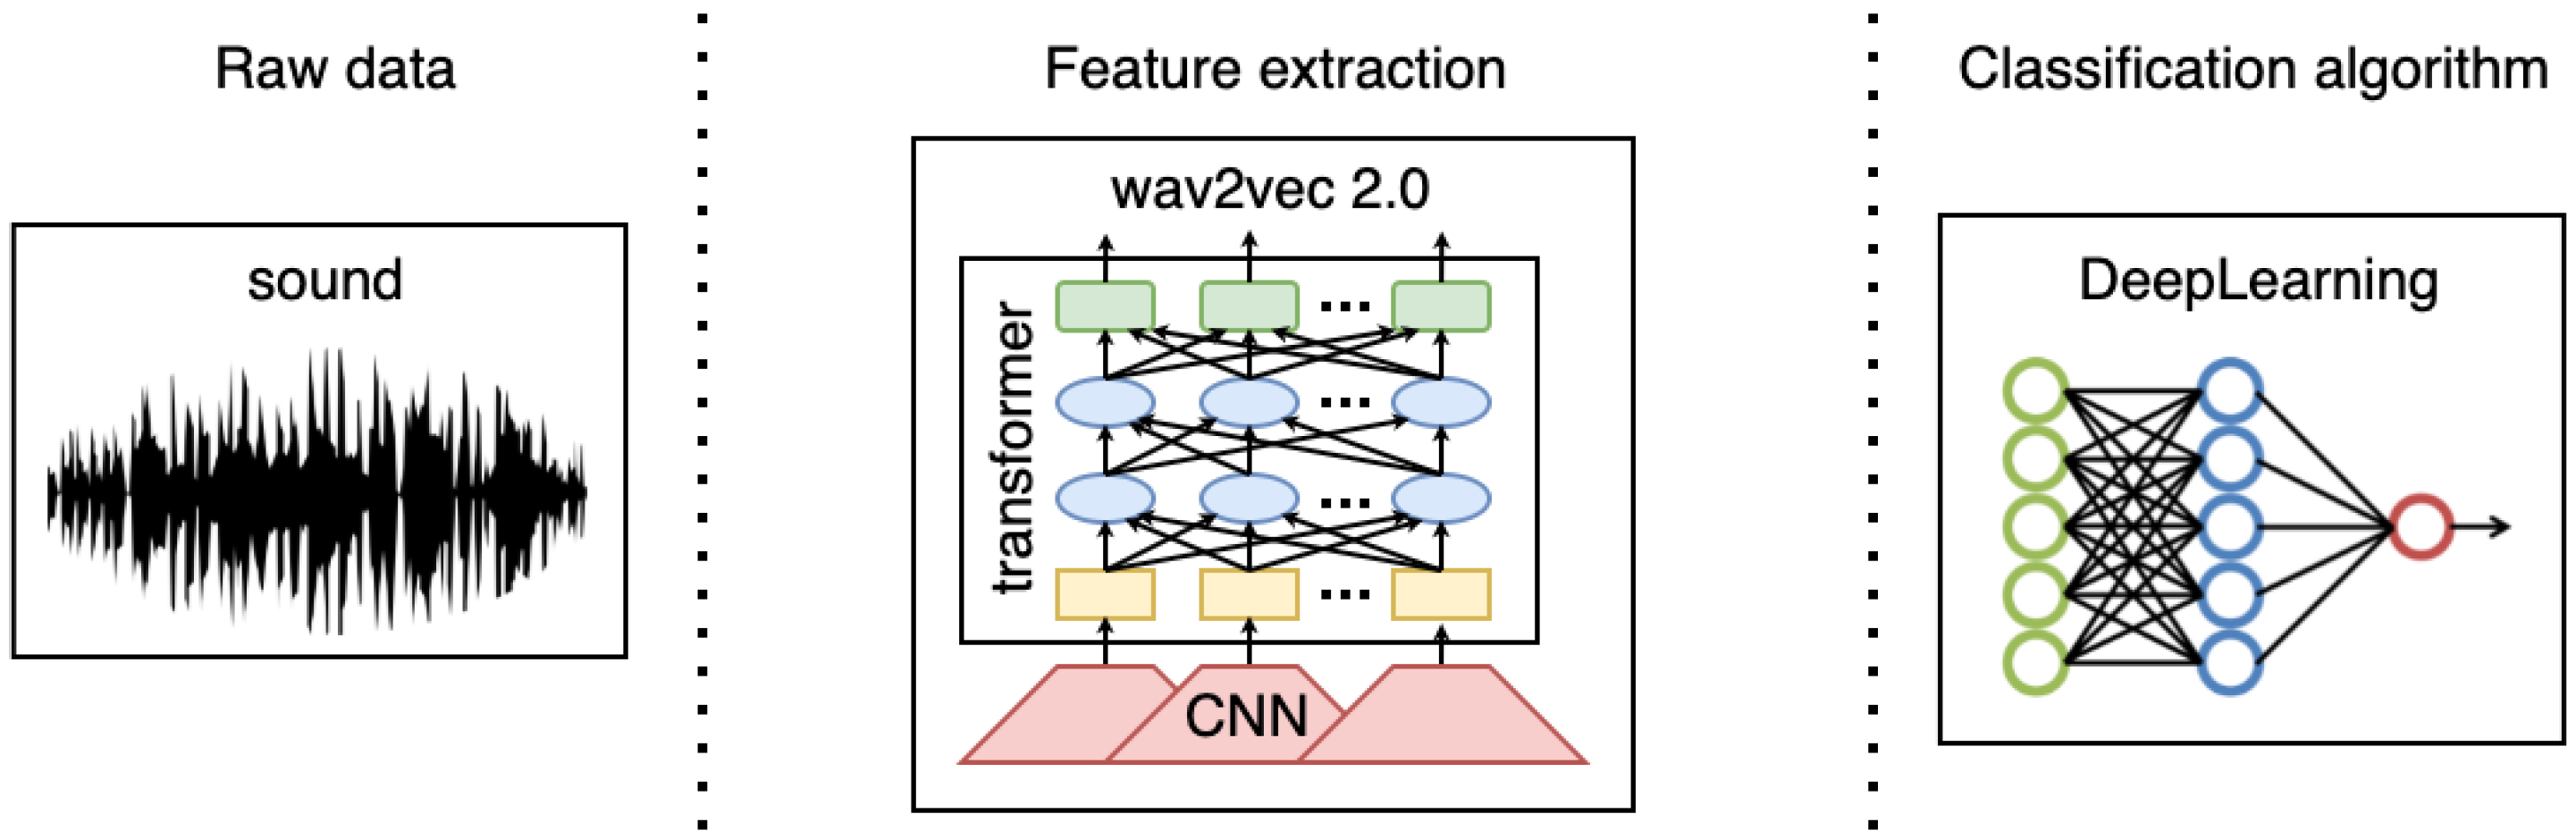
38]. Moreover, the rise in the self-supervised learning paradigm and the recently proposed transformer architecture [39], have led to novel speech representations, such as wav2vec [40,41] or HuBERT [42]. These representations were extracted from raw audio and can be used to feed a neural network. In this work, we primarily design and build a deep neural network architecture fed with a spectrogram. Furthermore, we also provide some preliminary experiments for which the network is fed with the wav2vec model to obtain preliminary insights into such an approach to working with the tasks tackled in this work.
Within this framework in which the perception, modeling, and detection of emotions constitute a challenge, the main contributions of this work can be summarized as follows:
  • An in depth analysis of the emotions arising in two different scenarios as a way of profiling the speakers associated with a task using both the categorical and the VAD model to represent the emotional state.
  • Two Spanish corpora are emotionally labeled by the crowd, where spontaneous emotions can be found instead of acted ones.
  • An emotion-detection system based on deep learning is specifically designed to the tasks considered. In this framework, this paper discusses the issues derived from the detection of realistic emotions in Spanish tasks as an attempt to progress research on emotion detection.
  • The preliminary experiments aimed to evaluate the convenience of the recent wav2vec representation of speech for the automatic detection of spontaneous emotions in Spanish Language.
This paper is structured as follows: Section 2 describes the tasks and the associated corpora tackled in this work (Section 2.1) and provides insights into the annotation procedure (Section 2.2) as well as insights into the design of the automatic detection system including the neural network architecture (Section 2.3). In Section 3, the results obtained in terms of both an analysis of emotions (Section 3.1) and the classification performance (Section 3.2) are given. Finally, Section 4 provides a discussion of the results.

2. Materials and Methods

2.1. Task and Corpus

This section describes the two tasks tackled in this work.

2.1.1. TV Debates

First, a set of real human–human conversations was gathered from TV debates. Specifically, the Spanish TV program “La Sexta Noche” was selected. In this weekly broadcast show, news about hot topics from the week are addressed by social and political debate panels led by two moderators. A very wide range of talk-show guests (politicians, journalists, etc.) analyze social topics from their perspectives. Given that the topics under discussion are usually controversial, emotionally rich interactions can be expected. However, the participants are used to speaking in public so they do not lose control of the situation. Thus, even if they might overreact sometimes, this is a real scenario, where emotions are subtle. The spontaneity in this situation is vastly different from scenarios with acted emotions, as shown in [15]. The selected programs were broadcast during the electoral campaign of the Spanish general elections in December 2015. Table 1 shows a small excerpt of a dialogue taken from the TV Debates corpus.
To start building the corpus, the whole audio signal was separated into shorter segments or chunks useful for crowd annotation. The segments have to be short enough to avoid variations in emotional information but long enough to allow for their identification. Thus, the audio signal was divided into clauses. A clause was defined as “a sequence of words grouped together on semantic or functional basis” [43], and it can be hypothesized that the emotional state does not change inside a clause. An algorithm that considered silences and pauses as well as the text transcriptions was designed to identify the utterances compatible with the clauses [2]. This procedure provided a set of 4118 audio chunks from two- to five-seconds long that comprises our working corpus. Regarding the speaker’s features, the gender distribution in this set was 30% females and 70% male, with a total of 238 different speakers within the age range from 35 to 65.
This corpus was developed by a consortium of Spanish Universities under the umbrella of AMIC, “Affective Multimedia Analytics with Inclusive and Natural Communication” project [44].

2.1.2. Empathic VA

The Empathic VA is a European Research and Innovation project [45,46] that implements personalized virtual coaching interactions to promote healthy and independent aging. As a part of the project, a series of spontaneous conversations between people who are older and a Wizard of OZ (WoZ) were recorded in three languages: Spanish, French, and Norwegian. The WoZ technique allows users to believe that they are communicating with a machine (and not a human), which makes their reaction more similar to one they have when interacting with a fully automatic virtual agent [8,45]. The conversations are related to four main topics: leisure, nutrition, physical activity, and social and family relationships [8,45]. Table 2 presents an example of a conversation about nutrition between a user and the WoZ, where some emotional content can be found. In this work, we focused on Spanish dialogues that were recorded by 31 speakers with an average age of 71.6 years. The gender distribution was 45% female and 55% male. After applying the algorithm to extract chunks that matched clauses, a corpus of 4525 audios from two to five seconds long was achieved.

2.2. Annotation Procedure

The TV Debates and Spanish Empathic VA datasets were labeled by emotion to achieve two useful and very valuable corpora to model emotions in Spanish.
Emotions are traditionally represented by two models: a categorical representation, in which emotions consist of discrete labels, such as happiness, anger, etc. [47,48], or an alternative approach that emphasizes the importance of the fundamental dimensions of valence and arousal in understanding emotional experience [49]. They are postulated as universal primitives in [49], and a feeling at any point on this two-dimensional space is called a core affect. A representation of the core affect is shown in Figure 1, where an emotion such as sad is represented with a very low value of arousal and a neutral valence slightly shifted to the negative side. Other researchers have found a third dimension, dominance, to be important in representing emotional phenomena [50], particularly in social situations. In this work, we use both representations, the categorical one and the dimensional one. A set of categories of interest based on the selection provided in [51] was first considered. Then, the set was adapted to the specific features of each of the tasks presented above. For instance, sad was not included in the TV Debates set, since sad emotions were not expected to appear in political debates. For the Empathic VA, a study was conducted to identify the emotions that were perceived by the users. In addition, the dimensional VAD model was also considered for both datasets.
The intrinsic subjectivity of the tasks makes obtaining a ground truth for the emotional status associated with an audio chunk difficult. One way to deal with this problem is to use the crowd truth [28], which is based on the intuition that human interpretation is subjective. Thus, measuring annotations on the same objects of interpretation across a crowd provides a useful representation of their subjectivity and the range of reasonable interpretations. In this work, crowd annotations was carried out through a crowdsourcing platform [29] to obtain emotional labels for both the VAD and categorical models. To this end, the annotation work was divided in micro-tasks that were performed by a large number of untrained annotators who did not speak to each other. This division in tasks made the annotations diverse, which is a plus for our dataset [53] and was made possible by the wide variety of different annotators. In this work, each audio chunk was annotated by five different annotators who were asked to fill in the following questionnaire for each audio clip.
Some categories have two or three names as a result of the preliminary task adaptation carried out over the categories selected from [51].
  • How do you perceive the speaker?
    Excited
    Slightly Excited
    Neutral
  • His/her mood is
    Rather Positive
    Neither Positive nor Negative
    Rather Negative
  • How do you perceive the speaker in relation to the situation which he/she is in?
    Rather dominant/controlling the situation
    Rather intimidated/defensive
    Neither dominant nor intimidated
  • Select the emotion that you think best describes the speaker’s mood:
    (TV Debates)(Empathic VA)
    Calm/Indifferent
    Annoyed/Tense
    Puzzled
    Angry
    Interested
    Satisfied/Pleased
    Worried
    Enthusiastic
    Embarrassed
    Bored/Tired
    Calm/Bored/Tired
    Sad
    Happy/Amused
    Puzzled
    Annoyed/Tense

Annotators Agreement

Given that each audio chunk was labeled by five different annotators, an analysis of the agreement among the annotators was carried out. Table 3 gathers the statistics of agreement per audio chunk for the categorical model. This table shows that, for about 70% of the data in the TV Debates dataset, the agreement was 2/5 or lower. For the Empathic VA dataset, a higher agreement was achieved due to the lower number of categories that were selected. However, almost 50% of the samples still showed an agreement of lower than 4/5. This confirms the ambiguity and subjectivity of the task. Moreover, Krippendorff’s a l p h a coefficient [54] was also low for both tasks, resulting in values of 0.11 and 0.2, respectively. This coefficient reflects the degree of agreement but is very dependent on the number of labels.
In the rest of the document, we do not consider samples with an agreement below 3/5 for the categorical model, which means that we used 30.74% of the annotated audio files of the TV Debates dataset and 88.81% of the Empathic VA for the experiments with emotional categories. Then, the majority voting method was used to establish the ground truth for these sets.
The answers to the questionnaires related to the VAD model were transformed into real values, ranging from 0 to 1, by applying the rules of Table 4 to each response. Then, these values were averaged per sample over all five annotators to obtain a real value in the 3D space. In this case, carrying out majority voting and thus obtaining a minimum agreement level were not required. The average was computed due to the vast diversity derived from the subjectivity of this task, which was reflected in the different answers provided by the diverse labels generated by the annotators. The size of the resulting labeled corpus (100% of the audio clips shown in Table 3) was bigger than the corpus labeled in terms of the categorical model.

2.3. Classification Framework

The automatic detection of emotions was carried out within the machine learning paradigm using the aforementioned corpora for training and test purposes. To this end, the usual pipeline includes a first procedural stage to extract features from a speech signal that feeds a classifier in a second stage. The feature set can make a difference in the resulting performance. However, no standard audio feature set seems to work well for all emotion recognition corpora [32,33,55]. The audio Mel-frequency spectrogram was considered in this work given that it demonstrated an efficient method to encode the information extracted from audio clips, as shown in [56,57]. Thus, each audio chunk in the aforementioned corpora was transformed into its corresponding spectrogram using the librosa toolkit [58]. This decision led us to the pipeline described in Figure 2.
Furthermore, one of the challenges to be addressed in both datasets was the difference in the audio sample lengths. Recurrent neural networks (RNNs), such as LSTMs, are specifically well suited to dealing with this problem [59,60] in the framework of neural networks (NN). However, convolutional architectures can outperform recurrent networks on tasks related to sequence modeling, as shown in [61]. Moreover, the training of convolutional neural networks (CNNs) is a simpler process that neither requires as many computational resources as RNNs nor suffers from a vanishing gradient [62]. Nevertheless, a common approach allowing for the use of CNNs is to pad all samples in such a way that all of them have the same input length [63,64], which also allows the network to learn which parts are relevant for the task.
The network architecture proposed in this work (Figure 3) takes the padded mel-spectrogram input and reduces both the mel-frequency and the time dimensions using 2D convolutions and max-poolings. This sub-network reduces the time dimension but creates a richer audio representation. Then, the network takes the new representation and tries to classify each time step using a multi-layer perceptron of three layers. After classifying all of the time steps, the network averages it to provide a single output for the input audio. The same architecture is employed for classification in terms of the categorical and VAD models. In the latter, the annotation values were discretized as described in Section 3.2.
In the training process, several decisions were made. On the one hand, all samples were padded to obtain the same time dimension, as mentioned above. Thus, the training process is easier when all of the batches have the same input length. On the other hand, an ADAM optimizer with stochastic weight averaging (SWA) [65] procedure was used as the optimization method. SWA can be used with a learning rate schedule that encourages exploration of the flat region of solutions. To this end, a cyclical learning rate schedule was used (see Figure 4). First, 60,000 batch updates were performed with a constant learning rate of 10 4 . Second, a decaying schedule with a learning rate of 10 5 over 1000 batch updates was applied. Finally, cyclical learning rates were adopted over five cycles, with a decaying learning rate schedule from 10 3 to 10 5 . The models for averaging were collected at the end of each cycle, corresponding to the lowest values of the learning rate.
The imbalance in classes of the training corpora can negatively influence the performance of the machine learning algorithms [22]. In some cases, this imbalance can even lead to completely ignoring the minority class, which is often the class with which we are more interested. An approach to dealing with this challenge is the use of oversampling/undersampling methodologies to duplicate/delete samples from the minority/majority class, respectively. In this work, a repetition oversampling method was chosen, where all of the non-majority class samples were duplicated. This procedure helped the network alleviate the problem of exclusively predicting the majority class. Finally, the experiments were carried out over a 10-fold cross-validation procedure.
In addition to the architecture mentioned above, a preliminary work that deals with a novel methodology based on pretrained networks was also considered. The wav2vec 2.0 [41] speech representation was used, which is a pretrained end2end network for speech feature extraction (https://github.com/pytorch/fairseq/blob/main/examples/wav2vec/README.md (accessed on 3 February 2022)). Specifically, xlsr_53 was considered, a multilingual model that was trained on the MLS, CommonVoice, and BABEL databases. MLS [66] is a multilingual dataset derived from audiobooks. The Common Voice corpus [67] is a massive multilingual collection of transcribed speech built using crowdsourcing for both data collection and data validation. Crowd contributors record their voice by reading sentences displayed on the screen. The goal of the BABEL project [68] is to produce a multi-language database of speech for five of the most widely differing Eastern European languages. We note that, in these datasets, the amount of Spanish speech is not significant. In fact, BABEL does not include it at all. Moreover, some parts do not include European Spanish but, rather, American Spanish, which makes a great difference. Furthermore, the datasets include non-spontaneous speech, and as a consequence, emotional content is not expected. The wav2vec 2.0 representation has been recently proposed for speech emotion recognition in English, for which specific pretrained networks can be found [69].
The pipeline used for these preliminary experiments is similar to the previous one. Only the feature extraction module differs and is now implemented by the pretrained network that transforms the speech signal into sequences of vectors. This pipeline is shown in Figure 5.
In the wav2vec architecture, the output of the last layer of the pretrained wav2vec 2.0 model was chosen to feed the network as audio representations. This representation has a dimension of 1024 features plus the time dimension (250 time samples for 5 s). The network architecture implemented for the wav2vec 2.0 input reduces the time dimension over several 1D convolutions and max-poolings and then takes the new representation and tries to classify each time step using a multi-layer perceptron of three layers. Finally, once all time steps are classified, the network averages the logits in the same way as the network when using the spectrogram, as the input in Figure 3 shows.
The training process used in the wav2vec network architecture was the same as the one used with the spectrogram network architecture, explained above.

3. Analysis of Emotions and Classification Results

For this section, we conducted an analysis of the emotions perceived by the annotators in the different tasks, and then, different series of classification experiments were carried out.

3.1. Analysis of Emotions

First, the categorical model annotation was analyzed. Table 5 shows the list of categories for each task along with the percentage of samples in each category in descending order. A minimum agreement of 0.6 (3/5) was requested to consider a sample to be valid, as mentioned above. Moreover, a minimum number of samples (1% of the total) was required in each class. These requirements led to a reduction in the valid samples, resulting in a set of 1266 samples for the TV Debates dataset and 4023 for the Empathic VA dataset when considering the categorical model. This table shows that different categories are predominant in each of the corpora. Some of them could be considered equivalent, such as calm/indifferent and calm/bored/tired, which are the most frequent categories in both sets. However, annoyed/tense, for instance, is the second most frequent class in the TV Debates dataset but was almost last in the Empathic VA dataset. In the same way, puzzled is almost absent (included in others) in the list for the TV Debates dataset.
Table 5 also shows that both datasets are imbalanced, with the calm category being the majority class, with more than 70% of the samples. This reflects the spontaneous nature of the data, showing that, most of the time, people do not show extreme emotions. Moreover, more positive emotions, such as happy/amused, appear in the Empathic VA annotations and more negative emotions, such as annoyed/tense, appear in the TV Debates set. This difference comes from the specific nature of the tasks. During political debates (human–human interactions), people try to convince or even impose their opinions on other interlocutors. However, during coaching sessions (human–machine interaction), speakers are quiet and pay attention to the virtual agent while preparing their next exchange.
As mentioned above, all of the samples were considered for the VAD model. 
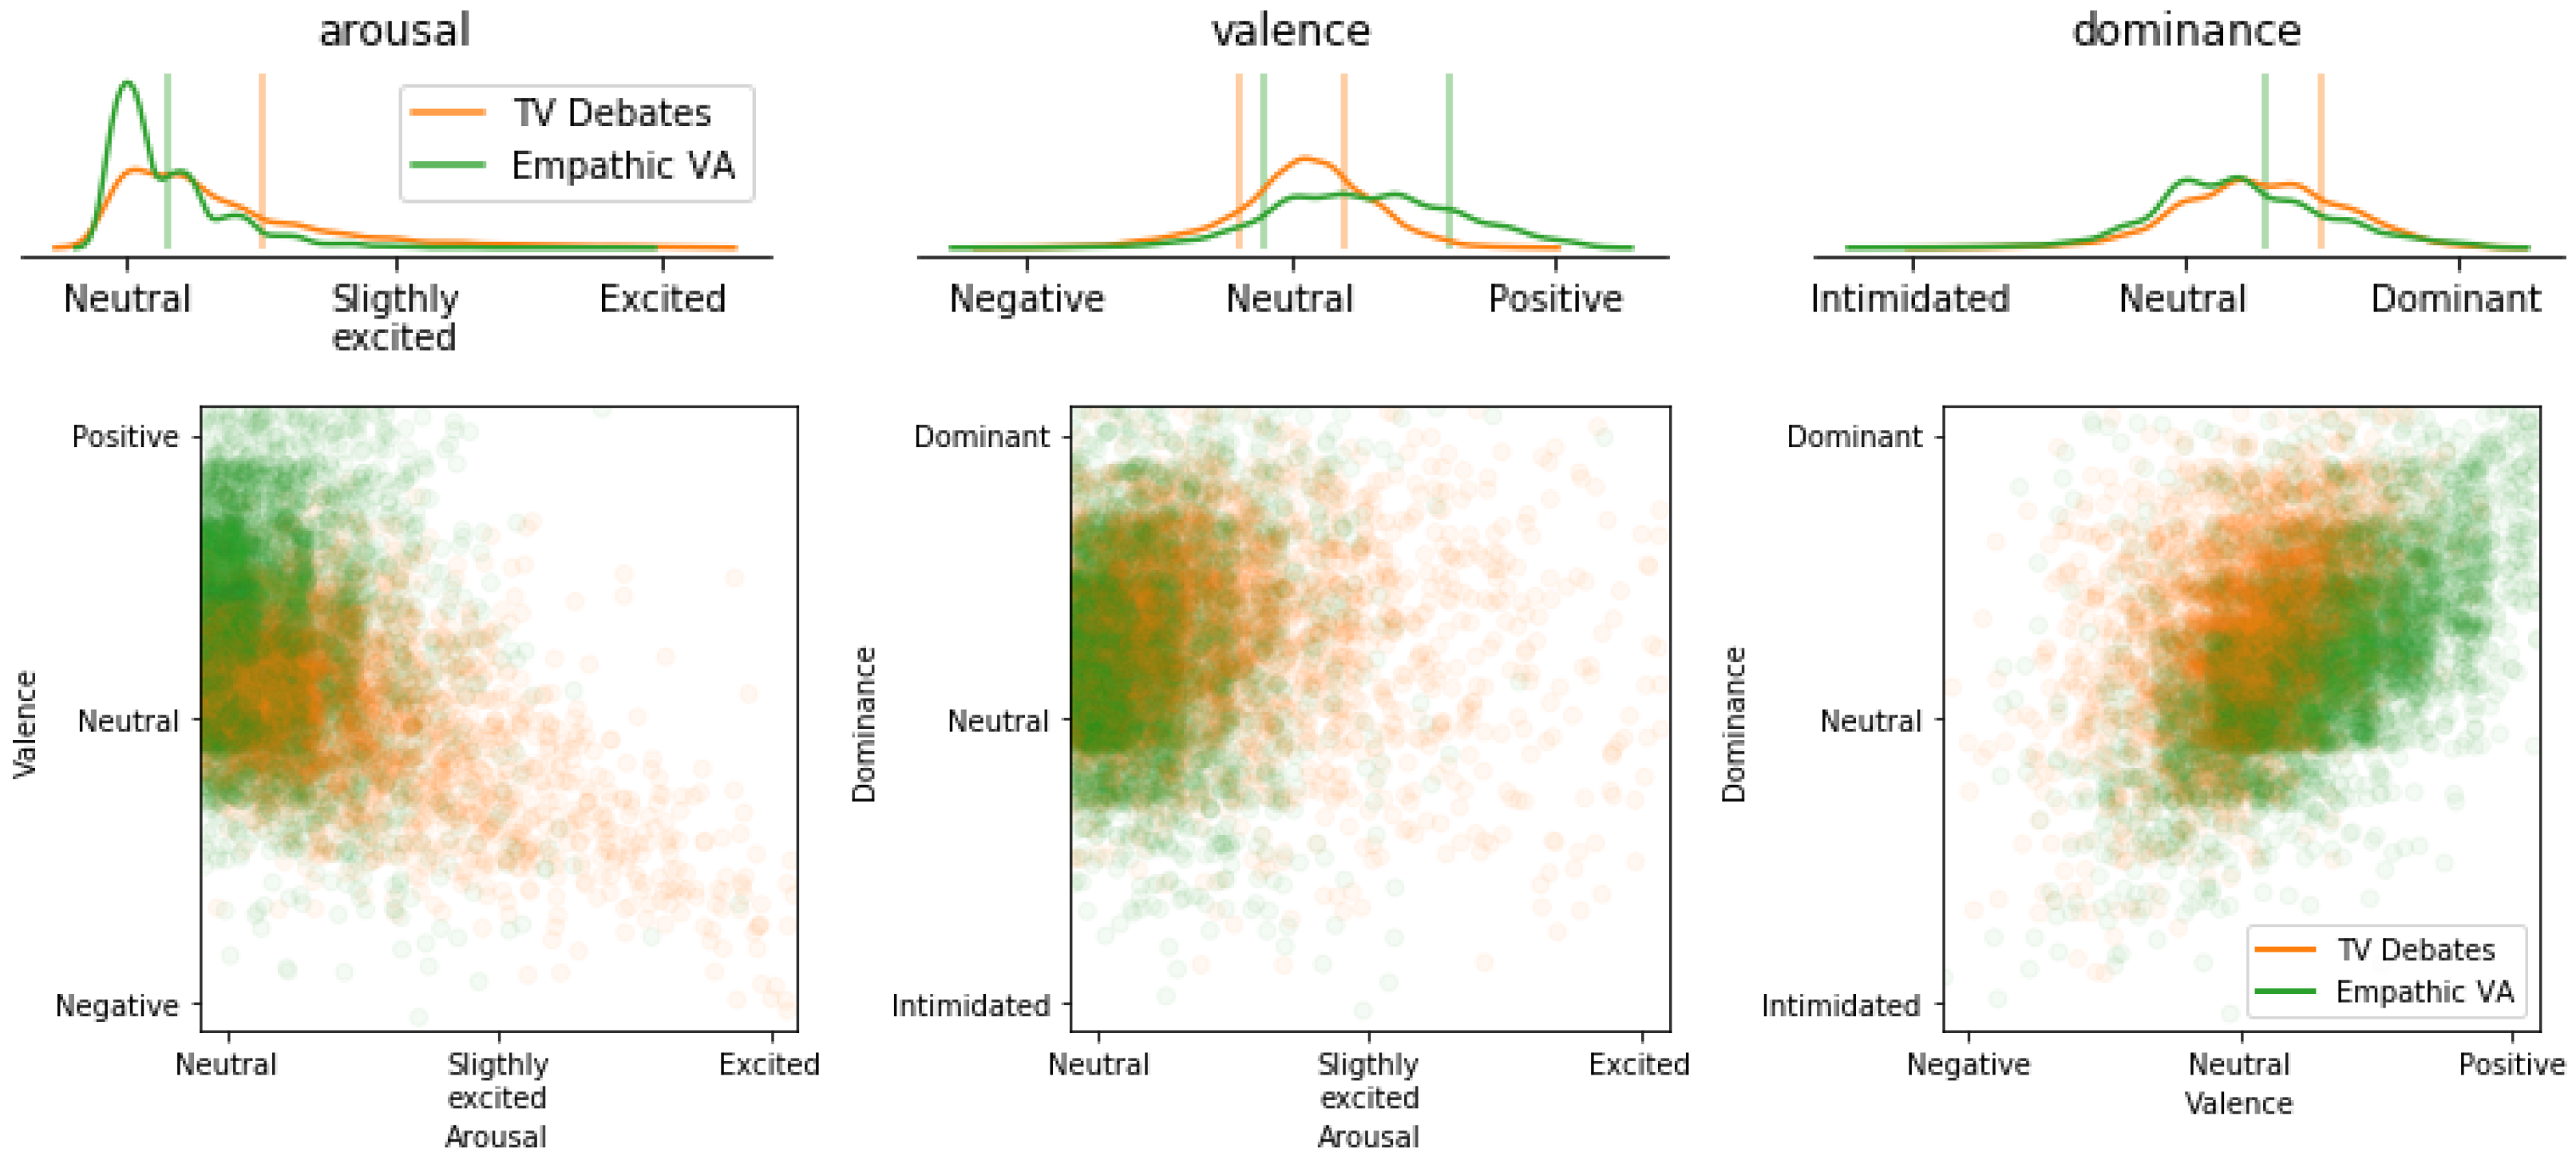
Figure 6 shows the probability density function of each variable (valence, arousal, and dominance) that was obtained by a Gaussian kernel density estimator (upper row). Figure 6 also shows different 2D projections of the sample distribution in the 3D space (row below), representing each scenario in a different color. When regarding arousal, the Empathic VA dataset works in a very neutral scenario, where excitement is almost absent. In TV debates, although neutrality is also predominant, some excitement is perceived due to the nature of debates. The distribution of valence also shows a clear deviation towards positive values for the Empathic VA scenario, which is an indicator of the good acceptance of the system among users, whereas in TV debates, neutrality is predominant, with only a slight nuance towards positiveness. On the contrary, dominance is shifted towards dominant values in TV debates but remains neutral when users interact with the Empathic VA case. These results correlate well with the types of audio we deal with in the two scenarios. In the TV debates, people express themselves without becoming angry (low levels of excitement) but in a very assertive way (quite high dominance levels). Additionally, they appear to be neutral when communicating their opinions (valence tends to be neutral or slightly positive). In the Empathic VA scenario, the users are volunteers with a good predisposition and seem to be pleased with the system (positive valence values). They are relaxed while talking to the agent (levels of excitement tend toward neutrality) and are not intimidated (dominance values are around neutrality, with a slight shift to the right). The differences between human–human and human–machine interactions are also noticeable in the specific tasks we are dealing with. Human–human communication appears to be more intense and emotional, with higher arousal and dominance values. During communication with a machine, on the contrary, people are not confident and they tend to be expectant, which might be translated into low values of arousal/dominance and higher values of valence.
The two models, categorical and VAD, were also considered together. Each category was represented in the 3D VAD space for comparison purposes. Specifically, the average of the valence, arousal, and dominance values of all of the audios labeled within a specific category was computed, and the resulting value was represented as a point in the 3D space. Figure 7 shows a 2D projection of the resulting representation. If we focus on the TV Debates dataset, we notice that interested and worried, the least representative categories, according to Table 5, are very close to the category with the highest number of samples, calm/indifferent, in all of the 2D projections (the purple, orange, and deep-blue points), so they were merged into only one category. The same happens with enthusiastic and satisfied (light-blue and green points). Overall, three different categories were finally considered for the TV Debates dataset. With regard to the Empathic VA scenario, puzzled and sad were merged into a single category because they are extremely close in all three projections, as shown in Figure 7. Thus, the final set of categories used for the classification experiments reported in this work are shown in Table 6.
The distribution of categories is quite different for both sets due to the nature of the scenarios (see Table 6). For instance, annoyed/tense, although present in both tasks, has a very different significance in the TV Debates dataset (almost 15%) and in the Empathic VA dataset (less than 3%). Puzzled was not considered in the TV Debates dataset due to the low number of samples labeled with that emotion, but it entails 3% of the samples in the Empathic VA dataset. Moreover, the final category, puzzled + sad, represented by the union of brown and purple points (low levels of valence and dominance) is not represented in the TV Debates dataset and is slightly separated from the other categories in the Empathic VA scenario. Moreover, Figure 7 shows that the location of annoyed/tense (red point, which is in fact quite separated from the other categories) is closer to neutrality in the Empathic VA scenario (lower excitement levels and lower negative values of valence) than in the TV Debates dataset, meaning that this negative feeling is softer when interacting with the machine and within this specific scenario.
This correlates well with the idea that people interacting with the Empathic VA scenario are not angry with the system, and if they experience any anger, their feelings are more related to annoyance, which is quite common during debates. Furthermore, speakers in debates do not usually show that they are in an unexpected situation (puzzled), since this emotion can be interpreted as weakness, while it is often shown in interactions with machines. In fact, puzzled was detected in the Empathic VA scenario. Categories such as calm also had a similar location in both scenarios, but with higher values of valence for the Empathic VA interactions; what the annotators perceived as calm tend to be more positive in the Empathic VA scenario than in the TV Debates scenario. The same occurs with enthusiastic + satisfied from the TV Debates scenario and with happy/pleased from the Empathic VA scenario, which although are very close in location in both scenarios (with very similar meanings), happy/pleased seems to have more positive valence values than enthusiastic + satisfied but a bit lower dominance and arousal values.

3.2. Classification Results

Some classification experiments were carried out for the tasks described in Section 2.1. In the TV Debates dataset, 1266 chunks were selected and distributed into the three categories mentioned above (CALM, ANN, and ENT), and for the Empathic VA, 4023 samples were selected and divided into four categories (CALM, HAPPY, ANN, and PUZZ).
When using the dimensional model, previous studies showed that trying to predict a specific value in 3D space (as a regression problem) leads to very poor results [2,15] due to the scarcity of data and the tendency toward neutrality. To solve this problem, a discretization of each dimension was carried out and the regression problem was converted into a classification one. The discrete levels were selected according to the distributions of the annotated data in Figure 6, with orange lines as selected frontiers for the TV Debates dataset and green lines selected for the Empathic VA dataset.
According to the top row displayed in Figure 6, arousal can be approximated by a log-normal distribution with a longer tail towards higher values of excitement. Thus, we decided to discern between only two values: neutral and excited. The thresholds (0.25 for TV Debates and 0.075 for Empathic VA) were selected to keep the classes as balanced as possible without distorting the limits imposed by the density function form.
In the case of valence, three categories were kept because of their similarity to a Gaussian distribution. The decisions related to these thresholds also avoided the imbalance problem. In the TV Debates set, since many of the samples are neutral, the values outside the limits [0.4, 0.6] were considered negative or positive samples respectively. The Empathic VA corpus was slightly more positive, and as a consequence, the limits were shifted towards the more positive values 0.45 and 0.8, respectively.
Finally, the dominance distribution was similar to a Gaussian distribution. However, it shifted towards dominant values; intimidated samples were almost absent. Consequently, only two categories were considered: dominant and neutral. The cutoff limit between neutral samples and dominant ones was set to 0.75 for the TV Debates dataset and to 0.65 for the Empathic VA dataset, which was the less dominant corpus.
Once the aforementioned discretization was applied, the distribution of samples in the different classes remained, as Table 7 shows.
The classification results for the TV Debates and Empathic VA datasets are given in Table 8. The experiments were carried out by considering the categorical and VAD models in an independent way. In both series, the spectrogram represented the speech signal. Different evaluation metrics were given to provide better insight into the capabilities of the neural network in predicting: the accuracy (ACC), precision (P), recall (R), and F 1 -score ( F 1 ). Since we dealt with a multi-class classification problem, weighted and macro averages were considered. Macro F 1 is the average of the F 1 -scores for all classes; thus, it penalizes imbalanced datasets, which was the case in this work. It was computed as shown in Equation (1):
F 1 = i = 1 N c F 1 i N c
where N c is the number of classes and F 1 i is the F 1 -score computed assuming that the i-th class is the positive one and that the negative one is composed by the remaining classes.
In weighted F 1 ( F 1 W ) (Equation (2)) instead, the F 1 -scores were calculated for each label, and then, their average is weighted with the number of true instances for each label.
F 1 W = i = 1 N c n C i F 1 i n
where n C i is the number of samples in C i class and n is the total number of samples in the test set.
Note that, hereafter, macro averages are denoted as P, R, and F 1 , whereas weighted averages are denoted as P W , R W , and F 1 W .
In the results associated with the TV Debates experiments, a macro F 1 -score of 0.56 was achieved in the categorical model. Interestingly, all of the evaluation metrics (P, R, and F 1 ) provided results in the same range and were quite compensated for. Weighted F 1 ( F 1 W ) provided better results (about 0.65) than macro F 1 due to the imbalance that could be appreciated in the dataset (the minority class comprises only 8% of the corpus, as seen in Table 6). If we focus on the specific categories, the best results were achieved for the most frequent one (CALM), but the F 1 scores for the rest were still acceptable. Focusing on the VAD model, we notice that arousal provideds a much better F 1 -score, reaching 0.7; the F 1 -score dropped again for valence (0.47) and, then, increased a bit for dominance (0.58). Let us note that three different labels were provided for valence, which made the classification task more difficult, while only two were provided for arousal and dominance. Dominance was the most difficult dimension to perceive for the annotators and the most ambiguous one. Nevertheless, in this dataset, dominance had a significant presence and was efficiently perceived and classified.
The experiments in the Empathic VA task resulted in lower performances. The categorical model provided a much lower F 1 -score when compared with those obtained in the TV Debates dataset, which may be due to the imbalance being even higher in this dataset. The minority class comprised 2.8% of the whole corpus, which was lower than that found in the TV Debates dataset (8%), as shown in Table 6. In fact, looking at the independent categories, the evaluation metrics were very low for less-frequent classes, such as PUZZ or ANN. Moreover, in this set, the number of labels was higher (four instead of three), which also leads, in general, to more confusion and lower performance. The VAD model followed the same tendency observed in the TV Debates dataset, with the highest performance for arousal and lower values for valence and dominance. However, in this case, the results achieved in the previous corpus were not reached, either, because it was a more neutral dataset and little emotional information could be learned.

Preliminary Classification Results Using wav2vec Model

Some preliminary experiments were also carried out using the wav2vec model, as shown in Table 9. The performance achieved was significantly lower. Minority categories, such as HAPPY and PUZZ, were almost never recognized. However, the same tendency observed with the spectrogram was also perceived, here: the VAD model performed better than the categorical one, where arousal was the best recognized dimension and weighted averages provided better results due to the imbalanced nature of these scenarios. Thus, the results achieved were promising, considering the pretrained nature of the model and the specific datasets employed in the training process. These datasets were based on speech that is quite far from the conversational nature of the scenarios we deal with in this work. Their contents were mostly neutral, and Spanish was scarcely included. A fine-tuning process would be needed, in this case, to adapt the model to specific features of the task and language. However, the aforementioned corpora might not be large enough to robustly perform such an adaptation, which, currently, makes the use of pretrained representations of the speech signal to model emotions in Spanish really difficult.

4. Discussion

4.1. Analysis of Emotions

The perceived emotions provide very valuable information to profile the specific features of the speakers in a scenario. The analyses carried out showed, for instance, the predominant neutrality in scenarios where spontaneous speech was considered. As mentioned above, most of the time, conversational speech does not show extreme emotions and tends to be calm. However, some differences are found when analyzing different scenarios such as the ones tackled in this work. Quite noticeable was that human–human interactions in a TV Debate format showed higher levels of excitement and dominance and more negativeness, whereas human–machine interactions in the Empathic VA task showed more positive feelings and lower values of excitement and dominance. These observations could be easily reflected using the VAD model. However, when trying to translate it to categories, finding appropriate ones is difficult without a previous perception study. This fact makes the VAD model very appropriate when dealing with a new real task that is not an artificial database specially designed for carrying out machine learning studies (with all five basic emotions equally distributed).
When focusing on a speaker, their emotions can also help profile them. Looking at their dominance, for instance, provides good insight into the kind of person they are when taking part in a conversation (speaking in public to convince others vs. talking in a relaxed environment an interest). Valence can also provide information about the speaker’s interest during a conversation.
The experiments conducted also showed that the location of a specific category in the 3D VAD space could vary depending on the scenario considered. As shown above, the category CALM in the Empathic VA dataset was more positive than in TV Debates, showing the ambiguity in the definition of the categories and the relevance of the VAD model, which might consider more general definitions.

4.2. Classification Results

The classification experiments carried out show that the system performance was significantly better in the TV Debates scenario than in Empathic VA one when using the categorical model, which may be due to the specific composition of the tasks. In fact, even though the TV Debates scenario is a heavily imbalanced task, the percentage of minority classes was higher than in the Empathic VA one. This deviation towards only one category is very difficult to tackle, even using oversampling methods. In future work, the use of a data-augmentation technique, such as SMOTE algorithm [22,70] may be useful. Moreover, the analysis of emotions in the Empathic VA dataset revealed that the dataset is a very neutral corpus (much more than the TV Debates one), which complicates the detection of emotional information. This fact is a major challenge when designing emotionally conscious human–machine interaction systems. However, the differences among each value of the VAD dimensions (excited/neutral for arousal, negative/neutral/positive for valence, or dominant/neutral for dominance) were not very significant. Thus, we can hypothesize that the VAD model might helped extract more precise and valuable information when considering spontaneous emotions that tended toward neutrality. Finally, the preliminary experiments conducted with the wav2vec model showed that these kinds of representations, although very powerful, would require a tuning and adaptation process specific for the task and language under consideration.

5. Conclusions

This work analyzed the emotional features found in two very different spontaneous speech scenarios: human interactions during TV debates and human–machine conversations with a virtual agent. In both scenarios, a very reduced set of emotions was perceived by a large number of annotators. Moreover, the emotional information had a high tendency to be neutral, with the rest of the emotions being of a clear minority. This fact raised a difficult pattern recognition problem, which was the imbalance in the data. Overall, the automatic identification of spontaneous speech and related emotional content is still a difficult problem to address. However, this work also showed that human interactions could be more emotional and, thus, easier to tackle than human–machine interactions. Thus, the design of human–machine conversational systems, aimed at integrating a user’s emotional state, are still challenging tasks.
In this framework, the VAD model was demonstrated to be more adequate in representing emotional information. The dimensional VAD space, in fact, could be better managed than categories in terms of annotation and automatic identification. The classification experiments carried out in this work showed that deep learning approaches are useful for detecting speakers’ emotional information, reaching a 0.7 F 1 -score for arousal. The preliminary experiments with the novel wav2vec2.0 representation of speech signals seem to be promising. However, this representation needs large sets of spontaneous emotional speech in the target language, i.e., Spanish, which are not currently found.

Author Contributions

Conceptualization, M.d.V., R.J. and M.I.T.; methodology, M.d.V. and R.J.; software, M.d.V.; validation, M.d.V. and R.J.; formal analysis, M.d.V., R.J. and M.I.T.; investigation, M.d.V. and R.J.; resources, M.d.V., R.J. and M.I.T.; data curation, M.d.V., R.J. and M.I.T.; writing—original draft preparation, M.d.V. and R.J.; writing—review and editing, M.d.V., R.J. and M.I.T.; visualization, M.d.V. and R.J.; supervision, R.J. and M.I.T.; project administration, R.J. and M.I.T.; funding acquisition, R.J. and M.I.T. All authors have read and agreed to the published version of the manuscript.

Funding

The research presented in this paper was conducted as part of the AMIC and EMPATHIC projects, which received funding from the Spanish Minister of Science under grants TIN2017-85854-C4-3-R and PDC2021-120846-C43 and from the European Union’s Horizon 2020 research and innovation program under grant agreement No. 769872. The first author also received a PhD scholarship from the University of the Basque Country UPV/EHU, PIF17/310.
Applsci 12 01902 i001

Institutional Review Board Statement

The experiments recorded conversations between seniors and a WoZ (the Empathic VA corpus) in Basque Country, Spain. The study was conducted according to the guidelines of the Declaration of Helsinki and approved by the Ethics Committee for Research involving Human Beings of the University of the Basque Country and the Basque Ethical Committee for the Clinical Research (Comité de ética de la investigación clínica (CEIC) de Euskadi).

Informed Consent Statement

Informed consent was obtained from all subjects involved in the study resulting in the Empathic VA corpus.

Data Availability Statement

The Empathic VA corpus is distributed for research purposes by the European Language Resources Association (ELRA http://www.elra.info/en/about/ (accessed on 3 February 2022)) at a very low price for academic and research institutions, as well as for small companies. The TV Debates corpus will be made available upon request only for research purposes.

Conflicts of Interest

The authors declare no conflict of interest. The funders had no role in the design of the study; in the collection, analyses, or interpretation of data; in the writing of the manuscript; or in the decision to publish the results.

References

  1. Lalitha, S.; Tripathi, S.; Gupta, D. Enhanced speech emotion detection using deep neural networks. Int. J. Speech Technol. 2019, 22, 497–510. [Google Scholar] [CrossRef]
  2. deVelasco, M.; Justo, R.; López-Zorrilla, A.; Torres, M.I. Automatic analysis of emotions from speech in Spanish TV debates. Acta Polytech. Hung. 2022, in press. [Google Scholar]
  3. Kiss, G.; Vicsi, K. Comparison of read and spontaneous speech in case of automatic detection of depression. In Proceedings of the 2017 8th IEEE International Conference on Cognitive Infocommunications (CogInfoCom), Debrecen, Hungary, 11–14 September 2017; pp. 213–218. [Google Scholar] [CrossRef]
  4. He, L.; Cao, C. Automated depression analysis using convolutional neural networks from speech. J. Biomed. Inform. 2018, 83, 103–111. [Google Scholar] [CrossRef] [PubMed]
  5. Balagopalan, A.; Eyre, B.; Rudzicz, F.; Novikova, J. To BERT or not to BERT: Comparing speech and language-based approaches for Alzheimer’s disease detection. arXiv 2020, arXiv:2008.01551. [Google Scholar]
  6. Han, J.; Qian, K.; Song, M.; Yang, Z.; Ren, Z.; Liu, S.; Liu, J.; Zheng, H.; Ji, W.; Koike, T.; et al. An Early Study on Intelligent Analysis of Speech under COVID-19: Severity, Sleep Quality, Fatigue, and Anxiety. arXiv 2020, arXiv:2005.00096. [Google Scholar]
  7. Schuller, B.; Weninger, F.; Zhang, Y.; Ringeval, F.; Batliner, A.; Steidl, S.; Eyben, F.; Marchi, E.; Vinciarelli, A.; Scherer, K.R.; et al. Affective and Behavioural Computing: Lessons Learnt from the First Computational Paralinguistics Challenge. Comput. Speech Lang. 2019, 53, 156–180. [Google Scholar] [CrossRef] [Green Version]
  8. Justo, R.; Letaifa, L.B.; Palmero, C.; Fraile, E.G.; Johansen, A.; Vazquez, A.; Cordasco, G.; Schlogl, S.; Ruanova, B.F.; Silva, M.; et al. Analysis of the Interaction between Elderly People and a Simulated Virtual Coach. J. Ambient. Intell. Humaniz. Comput. 2020, 11, 6125–6140. [Google Scholar] [CrossRef]
  9. Vinciarelli, A.; Esposito, A.; André, E.; Bonin, F.; Chetouani, M.; Cohn, J.F.; Cristani, M.; Fuhrmann, F.; Gilmartin, E.; Hammal, Z.; et al. Open Challenges in Modelling, Analysis and Synthesis of Human Behaviour in Human–Human and Human–Machine Interactions. Cogn. Comput. 2015, 7, 397–413. [Google Scholar] [CrossRef] [Green Version]
  10. Chiba, Y.; Nose, T.; Ito, A. Analysis of efficient multimodal features for estimating user’s willingness to talk: Comparison of human-machine and human-human dialog. In Proceedings of the 2017 Asia-Pacific Signal and Information Processing Association Annual Summit and Conference (APSIPA ASC), Kuala Lumpur, Malaysia, 12–15 December 2017; pp. 428–431. [Google Scholar]
  11. Aïsha, S.; Elisabeth, P.; Ouriel, G.; Bruno, B. Predictive Mechanisms Are Not Involved the Same Way during Human-Human vs. Human-Machine Interactions: A Review. Front. Neurorobot. 2017, 11, 52. [Google Scholar]
  12. deVelasco, M.; Justo, R.; Letaifa, L.B.; Torres, M. Contrasting the emotions identified in spanish tv debates and in human-machine interactions. In Proceedings of the IberSPEECH, Valladolid, Spain, 24–25 March 2021. [Google Scholar]
  13. Rodríguez, L.J.; Torres, M.I. Spontaneous Speech Events in Two Speech Databases of Human-Computer and Human-Human Dialogs in Spanish. Lang. Speech 2006, 49, 333–366. [Google Scholar] [CrossRef] [Green Version]
  14. Schuller, B.; Valster, M.; Eyben, F.; Cowie, R.; Pantic, M. AVEC 2012: The continuous audio/visual emotion challenge. In Proceedings of the 14th ACM International conference on Multimodal Interaction, Santa Monica, CA, USA, 22–26 October 2012; pp. 449–456. [Google Scholar]
  15. deVelasco, M.; Justo, R.; López-Zorrilla, A.; Torres, M. Can Spontaneous Emotions be Detected from Speech on TV Political Debates? In Proceedings of the 10th IEEE International Conference on Cognitive Infocommunications, Naples, Italy, 23–25 October 2019.
  16. Burkhardt, F.; Paeschke, A.; Rolfes, M.; Sendlmeier, W.F.; Weiss, B. A database of German emotional speech. In Proceedings of the Ninth European Conference on Speech Communication and Technology, Lisboa, Portugal, 4–8 September 2005. [Google Scholar]
  17. Busso, C.; Bulut, M.; Lee, C.C.; Kazemzadeh, A.; Mower, E.; Kim, S.; Chang, J.N.; Lee, S.; Narayanan, S.S. IEMOCAP: Interactive emotional dyadic motion capture database. Lang. Resour. Eval. 2008, 42, 335. [Google Scholar] [CrossRef]
  18. Davidson, R.J.; Ekman, P.A. Nature of Emotion: Fundamental Questions; Oxford University Press: New York, NY, USA; Springer: New York, NY, USA, 1994. [Google Scholar]
  19. Nasri, M.A.; Hmani, M.A.; Mtibaa, A.; Petrovska-Delacrétaz, D.; Slima, M.B.; Hamida, A.B. Face Emotion Recognition From Static Image Based on Convolution Neural Networks. In Proceedings of the 5th International Conference on Advanced Technologies for Signal and Image Processing, ATSIP 2020, Sousse, Tunisia, 2–5 September 2020; pp. 1–6. [Google Scholar] [CrossRef]
  20. Vogt, T.; Andre, E. Comparing Feature Sets for Acted and Spontaneous Speech in View of Automatic Emotion Recognition. In Proceedings of the IEEE International Conference on Multimedia and Expo, Amsterdam, The Netherlands, 6 July 2005; pp. 474–477. [Google Scholar] [CrossRef]
  21. Scherer, K.R. Approaches To Emotion. Chapter: On the Nature and Function of Emotion: A Component Process Approach; Scherer, K.R., Ekman, P., Eds.; Taylor and Francis Group: New York, NY, USA, 1984. [Google Scholar]
  22. Letaifa, L.B.; Torres, M.I. Perceptual Borderline for Balancing Multi-Class Spontaneous Emotional Data. IEEE Access 2021, 9, 55939–55954. [Google Scholar] [CrossRef]
  23. Gunes, H.; Pantic, M. Automatic, Dimensional and Continuous Emotion Recognition. Int. J. Synth. Emot. 2010, 1, 68–99. [Google Scholar] [CrossRef] [Green Version]
  24. Schuller, B.; Batliner, A.; Steidl, S.; Seppi, D. Recognising realistic emotions and affect in speech: State of the art and lessons learnt from the first challenge. Speech Commun. 2011, 53, 1062–1087. [Google Scholar] [CrossRef] [Green Version]
  25. Russell, J. A circumplex model of affect. J. Personal. Soc. Psychol. 1980, 39, 1161–1178. [Google Scholar] [CrossRef]
  26. Chakraborty, R.; Pandharipande, M.; Kopparapu, S.K. Analyzing Emotion in Spontaneous Speech; Springer: Berlin/Heidelberg, Germany, 2017. [Google Scholar]
  27. Greco, C.; Buono, C.; Buch-Cardona, P.; Cordasco, G.; Escalera, S.; Esposito, A.; Fernandez, A.; Kyslitska, D.; Kornes, M.S.; Palmero, C.; et al. Emotional Features of Interactions with Empathic Agents. In Proceedings of the 2021 IEEE/CVF International Conference on Computer Vision Workshops (ICCVW), Montreal, BC, Canada, 11–17 October 2021; pp. 2168–2176. [Google Scholar] [CrossRef]
  28. Aroyo, L.; Welty, C. Truth Is a Lie: Crowd Truth and the Seven Myths of Human Annotation. AI Mag. 2015, 36, 15–24. [Google Scholar] [CrossRef] [Green Version]
  29. Justo, R.; Alcaide, J.M.; Torresn, M.I. CrowdScience: Crowdsourcing for research and development. In Proceedings of the IberSpeech 2016, Lisbon, Portugal, 23–25 November 2016; pp. 403–410. [Google Scholar]
  30. Schuller, B.; Steidl, S.; Batliner, A.; Vinciarelli, A.; Scherer, K.; Ringeval, F.; Chetouani, M.; Weninger, F.; Eyben, F.; Marchi, E.; et al. The INTERSPEECH 2013 computational paralinguistics challenge: Social signals, conflict, emotion, autism. In Proceedings of the INTERSPEECH 2013, 14th Annual Conference of the International Speech Communication Association, Lyon, France, 25–29 August 2013. [Google Scholar]
  31. Eyben, F.; Scherer, K.R.; Schuller, B.W.; Sundberg, J.; André, E.; Busso, C.; Devillers, L.Y.; Epps, J.; Laukka, P.; Narayanan, S.S.; et al. The Geneva Minimalistic Acoustic Parameter Set (GeMAPS) for Voice Research and Affective Computing. IEEE Trans. Affect. Comput. 2016, 7, 190–202. [Google Scholar] [CrossRef] [Green Version]
  32. Neumann, M.; Vu, N.T. Attentive Convolutional Neural Network based Speech Emotion Recognition: A Study on the Impact of Input Features, Signal Length, and Acted Speech. arXiv 2017, arXiv:1706.00612. [Google Scholar]
  33. Parthasarathy, S.; Tashev, I. Convolutional Neural Network Techniques for Speech Emotion Recognition. In Proceedings of the 2018 16th International Workshop on Acoustic Signal Enhancement (IWAENC), Tokyo, Japan, 17–20 September 2018; pp. 121–125. [Google Scholar] [CrossRef]
  34. Huang, K.; Wu, C.; Hong, Q.; Su, M.; Chen, Y. Speech Emotion Recognition Using Deep Neural Network Considering Verbal and Nonverbal Speech Sounds. In Proceedings of the ICASSP 2019—2019 IEEE International Conference on Acoustics, Speech and Signal Processing (ICASSP), Brighton, UK, 12–17 May 2019; pp. 5866–5870. [Google Scholar] [CrossRef]
  35. Marazakis, M.; Papadakis, D.; Nikolaou, C.; Constanta, P. System-level infrastructure issues for controlled interactions among autonomous participants in electronic commerce processes. In Proceedings of the Tenth International Workshop on Database and Expert Systems Applications. DEXA 99, Florence, Italy, 3 September 1999; pp. 613–617. [Google Scholar] [CrossRef]
  36. Cummins, N.; Amiriparian, S.; Hagerer, G.; Batliner, A.; Steidl, S.; Schuller, B.W. An Image-Based Deep Spectrum Feature Representation for the Recognition of Emotional Speech. In Proceedings of the MM ′17: 25th ACM International Conference on Multimedia, Mountain View, CA, USA, 23–27 October 2017; Association for Computing Machinery: New York, NY, USA, 2017; pp. 478–484. [Google Scholar] [CrossRef]
  37. Ocquaye, E.N.N.; Mao, Q.; Xue, Y.; Song, H. Cross lingual speech emotion recognition via triple attentive asymmetric convolutional neural network. Int. J. Intell. Syst. 2021, 36, 53–71. [Google Scholar] [CrossRef]
  38. Tzirakis, P.; Zhang, J.; Schuller, B.W. End-to-End Speech Emotion Recognition Using Deep Neural Networks. In Proceedings of the 2018 IEEE International Conference on Acoustics, Speech and Signal Processing (ICASSP), Calgary, AB, Canada, 13 September 2018; pp. 5089–5093. [Google Scholar] [CrossRef]
  39. Vaswani, A.; Shazeer, N.; Parmar, N.; Uszkoreit, J.; Jones, L.; Gomez, A.N.; Kaiser, L.; Polosukhin, I. Attention is All You Need. arXiv 2017, arXiv:1706.03762. [Google Scholar]
  40. Schneider, S.; Baevski, A.; Collobert, R.; Auli, M. wav2vec: Unsupervised pre-training for speech recognition. arXiv 2019, arXiv:1904.05862. [Google Scholar]
  41. Baevski, A.; Zhou, H.; Mohamed, A.; Auli, M. wav2vec 2.0: A Framework for Self-Supervised Learning of Speech Representations. arXiv 2020, arXiv:2006.11477. [Google Scholar]
  42. Hsu, W.; Bolte, B.; Tsai, Y.H.; Lakhotia, K.; Salakhutdinov, R.; Mohamed, A. HuBERT: Self-Supervised Speech Representation Learning by Masked Prediction of Hidden Units. arXiv 2021, arXiv:2106.07447. [Google Scholar] [CrossRef]
  43. Esposito, A.; Stejskal, V.; Smékal, Z. Cognitive Role of Speech Pauses and Algorithmic Considerations for their Processing. Int. J. Pattern Recognit. Artif. Intell. 2008, 22, 1073–1088. [Google Scholar] [CrossRef]
  44. Ortega, A.; Lleida, E.; Segundo, R.S.; Ferreiros, J.; Hurtado, L.F.; Arnal, E.S.; Torres, M.I.; Justo, R. AMIC: Affective multimedia analytics with inclusive and natural communication. Proces. Leng. Natural 2018, 61, 147–150. [Google Scholar]
  45. Torres, M.I.; Olaso, J.M.; Montenegro, C.; Santana, R.; Vázquez, A.; Justo, R.; Lozano, J.A.; Schlögl, S.; Chollet, G.; Dugan, N.; et al. The EMPATHIC Project: Mid-Term Achievements. In Proceedings of the PETRA ′19: 12th ACM International Conference on PErvasive Technologies Related to Assistive Environments, Rhodes, Greece, 5–7 June 2019; Association for Computing Machinery: New York, NY, USA, 2019; pp. 629–638. [Google Scholar]
  46. Brinkschulte, L.; Mariacher, N.; Schlögl, S.; Torres, M.I.; Justo, R.; Olaso, J.M.; Esposito, A.; Cordasco, G.; Chollet, G.; Glackin, C.; et al. The EMPATHIC Project: Building an Expressive, Advanced Virtual Coach to Improve Independent Healthy-Life-Years of the Elderly. arXiv 2021, arXiv:2104.13836. [Google Scholar]
  47. Calvo, R.; D’Mello, S. Affect Detection: An Interdisciplinary Review of Models, Methods, and Their Applications. IEEE Trans. Affect. Comput. 2010, 1, 18–37. [Google Scholar] [CrossRef]
  48. Calvo, R.; Kim, S. Emotions in text: Dimensional and categorical models. Comput. Intell. 2012, 29, 527–543. [Google Scholar] [CrossRef]
  49. Russell, J.A. Core affect and the psychological construction of emotion. Psychol. Rev. 2003, 110, 145–172. [Google Scholar] [CrossRef]
  50. Bradley, M.M.; Lang, P.J. Measuring emotion: The self-assessment manikin and the semantic differential. J. Behav. Ther. Exp. Psychiatry 1994, 25, 49–59. [Google Scholar] [CrossRef]
  51. Cowen, A.S.; Keltner, D. Self-report captures 27 distinct categories of emotion bridged by continuous gradients. Proc. Natl. Acad. Sci. USA 2017, 114, E7900–E7909. [Google Scholar] [CrossRef] [Green Version]
  52. Scherer, K.R. What are emotions? And how can they be measured? Soc. Sci. Inf. 2005, 44, 695–729. [Google Scholar] [CrossRef]
  53. Justo, R.; Torres, M.; Alcaide, J. Measuring the Quality of Annotations for a Subjective Crowdsourcing Task. In Iberian Conference on Pattern Recognition and Image Analysis; Lecture Notes in Computer Science; Springer: Cham, Switzerland, 2017; pp. 58–68. [Google Scholar] [CrossRef]
  54. Wester, F.; Krippendorff, K. Content Analysis: An Introduction to Its Methodology; Communications 2005; Sage: Thousand Oaks, CA, USA, 2004; pp. 124–126. [Google Scholar]
  55. Tian, L.; Moore, J.D.; Lai, C. Emotion recognition in spontaneous and acted dialogues. In Proceedings of the 2015 International Conference on Affective Computing and Intelligent Interaction (ACII), Xi’an, China, 21–24 September 2015; pp. 698–704. [Google Scholar]
  56. Badshah, A.M.; Ahmad, J.; Rahim, N.; Baik, S.W. Speech emotion recognition from spectrograms with deep convolutional neural network. In Proceedings of the 2017 International Conference on Platform Technology and Service (PlatCon), Busan, Korea, 13–15 February 2017; pp. 1–5. [Google Scholar]
  57. Yenigalla, P.; Kumar, A.; Tripathi, S.; Singh, C.; Kar, S.; Vepa, J. Speech Emotion Recognition Using Spectrogram & Phoneme Embedding. In Proceedings of the Interspeech 2018, 19th Annual Conference of the International Speech Communication Association, Hyderabad, India, 6 September 2018; pp. 3688–3692. [Google Scholar]
  58. McFee, B.; Raffel, C.; Liang, D.; Ellis, D.P.; McVicar, M.; Battenberg, E.; Nieto, O. librosa: Audio and music signal analysis in python. In Proceedings of the 14th Python in Science Conference, Austin, TX, USA, 6–12 July 2015; Volume 8, pp. 18–25. [Google Scholar]
  59. Tao, F.; Liu, G. Advanced LSTM: A Study about Better Time Dependency Modeling in Emotion Recognition. In Proceedings of the 2018 IEEE International Conference on Acoustics, Speech and Signal Processing (ICASSP), Calgary, AB, Canada, 13 September 2018; pp. 2906–2910. [Google Scholar] [CrossRef] [Green Version]
  60. Wang, J.; Xue, M.; Culhane, R.; Diao, E.; Ding, J.; Tarokh, V. Speech Emotion Recognition with Dual-Sequence LSTM Architecture. In Proceedings of the ICASSP 2020—2020 IEEE International Conference on Acoustics, Speech and Signal Processing (ICASSP), Barcelona, Spain, 4–8 May 2020; pp. 6474–6478. [Google Scholar] [CrossRef] [Green Version]
  61. Bai, S.; Kolter, J.Z.; Koltun, V. An Empirical Evaluation of Generic Convolutional and Recurrent Networks for Sequence Modeling. arXiv 2018, arXiv:1803.01271. [Google Scholar]
  62. Hochreiter, S. The vanishing gradient problem during learning recurrent neural nets and problem solutions. Int. J. Uncertain. Fuzziness-Knowl.-Based Syst. 1998, 6, 107–116. [Google Scholar] [CrossRef] [Green Version]
  63. Jin, Z.; Finkelstein, A.; Mysore, G.J.; Lu, J. FFTNet: A real-time speaker-dependent neural vocoder. In Proceedings of the 2018 IEEE International Conference on Acoustics, Speech and Signal Processing (ICASSP), Calgary, AB, Canada, 13 September 2018; pp. 2251–2255. [Google Scholar]
  64. Akiyama, O.; Sato, J. Multitask learning and semisupervised learning with noisy data for audio tagging. In Proceedings of the 4th Workshop on Detection and Classification of Acoustic Scenes and Events (DCASE 2019), New York, NY, USA, 25–26 October 2019. [Google Scholar]
  65. Izmailov, P.; Podoprikhin, D.; Garipov, T.; Vetrov, D.; Wilson, A.G. Averaging weights leads to wider optima and better generalization. arXiv 2018, arXiv:1803.05407. [Google Scholar]
  66. Pratap, V.; Xu, Q.; Sriram, A.; Synnaeve, G.; Collobert, R. MLS: A Large-Scale Multilingual Dataset for Speech Research. Interspeech 2020, 2020, 2757–2761. [Google Scholar] [CrossRef]
  67. Ardila, R.; Branson, M.; Davis, K.; Henretty, M.; Kohler, M.; Meyer, J.; Morais, R.; Saunders, L.; Tyers, F.M.; Weber, G. Common voice: A massively-multilingual speech corpus. arXiv 2019, arXiv:1912.06670. [Google Scholar]
  68. Cui, J.; Cui, X.; Ramabhadran, B.; Kim, J.; Kingsbury, B.; Mamou, J.; Mangu, L.; Picheny, M.; Sainath, T.N.; Sethy, A. Developing speech recognition systems for corpus indexing under the IARPA Babel program. In Proceedings of the 2013 IEEE International Conference on Acoustics, Speech and Signal Processing, Vancouver, BC, Canada, 26–31 May 2013; pp. 6753–6757. [Google Scholar]
  69. Luna-Jiménez, C.; Kleinlein, R.; Griol, D.; Callejas, Z.; Montero, J.M.; Fernández-Martínez, F. A Proposal for Multimodal Emotion Recognition Using Aural Transformers and Action Units on RAVDESS Dataset. Appl. Sci. 2022, 12, 327. [Google Scholar] [CrossRef]
  70. Chawla, N.V.; Bowyer, K.W.; Hall, L.O.; Kegelmeyer, W.P. SMOTE: Synthetic minority over-sampling technique. J. Artif. Intell. Res. 2002, 16, 321–357. [Google Scholar] [CrossRef]
Figure 1. Illustration of Scherer’s circumplex [52], which shows categories represented by the dimensions arousal and valence.
Applsci 12 01902 g001
Figure 2. Pipeline of a basic procedure in audio classification problems. First, raw data are identified, i.e., the wav audio itself. Then, the characteristics are extracted with a tool, the spectrogram, through librosa [58], in this case. Finally, the classification problem is carried out, in this case, using neural networks. Color in Deep Learning diagram means input, intermediate and output layers.
Applsci 12 01902 g002
Figure 3. Neural network architecture used for classification when the spectrogram represents the speech signal. First, a succession of convolutional and maxpooling layers reduce the dimensions, obtaining a small time dimension with 110 features each (10 filters times 11 frequencies). Then, some logits are obtained for each of the features of the time dimension over three linear layers. Finally, the mean of all of the logits is computed to classify the sample.
Applsci 12 01902 g003
Figure 4. Learning rate schedule for SWA updates. Each SWA update is performed when the learning rate is at the minimum ( u 1 , u 2 , …, u 6 ).
Applsci 12 01902 g004
Figure 5. Pipeline for emotion detection from audio signals using wav2vec 2.0 [41]. First, raw data must be identified, i.e., the wav audio itself. Then, the characteristics are extracted with the pretrained wav2vec model, and finally, the classification problem is carried out, in this case, using neural networks. Colors in Deep Neural Networks means different type layers.
Applsci 12 01902 g005
Figure 6. Representation of the VAD dimensional model. In the first row, each of the dimensions is displayed independently, letting us compare each corpus. The vertical lines are the cuts that have been used for the discretization (see Section 3.2). In the second row, a representation of the same dimensions but taken two-by-two is displayed, helping to provide a better understanding of the corpora.
Applsci 12 01902 g006
Figure 7. Representation of the mean value of each of the categories in the dimensional model. The first row shows the TV Debates representations, and the second row shows the Empathic VA representations. Some emotions are very close to one another in all dimensions, which is why we considered merging them into a single category.
Applsci 12 01902 g007
Table 1. Small excerpt extracted from the TV Debates corpus. This is an emotionally rich example of a discussion between two talk-show guests debating politics. The same excerpt is shown in Spanish (the original language) above and in English below.
Spanish
Speaker 1:Yo entiendo que de España y de datos y de hechos no quieras hablar, pero resulta…
Speaker 2:Claro que puedo hablar…
Speaker 1:Que acaban de imputar también al quinto tesorero en la historia de tu partido.
Speaker 2:Y dale.
Speaker 1:De cinco…
English
Speaker 1:I understand that you do not want to talk about Spain, about neither data nor facts, but it turns out…
Speaker 2:Of course I can talk…
Speaker 1:That they have just imputed the fifth treasurer in the history of your party as well.
Speaker 2:And hit it.
Speaker 1:Five out of five…
Table 2. Small excerpt taken from the Empathic VA corpus. This sample is a segment of a conversation between a user and the WoZ. It shows that the WoZ generally asks questions and tries to obtain extensive answers from the user. The excerpt is shown in Spanish (original language) above and then in English (translation) below.
Spanish
User:Para cenar suelo tomar o huevos con… o pescado con algo de también de verdura, y luego
suelo tomar o tomo algunas frutas, suelo tener fruta. Y luego pues no tomo nada más.
System:Sueles merendar?
User:A veces sí, depende… A veces sí meriendo y suelo merendar pues un… un café
y algún dulce o algún bocadillito de jamón también suelo tomar.
Depende de la ocasión, si estoy en casa o no.
System:Entiendo, ¿Crees que comes bien?
User:Creo que sí.
System:Dime Ana, ¿Hay algo que te gustaría cambiar en tu forma de comer?
User:Pues nada porque como a gusto, no… no quiero otra cosa.
English
User:For dinner, I usually have either eggs with… or fish with some vegetables too, and then
I usually take or I take some fruits, I usually have fruit. And then, well, I do not take anything else.
System:Do you usually have a snack?
User:Sometimes, yes, it depends… Sometimes, yes, I take a snack and I use to have a snack; let us say a… a coffee
and I also used to take some sweets or some small ham sandwich.
It depends on the occasion, if I am at home or not.
System:I understand. Do you think you eat well?
User:I think so.
System:Tell me Ana, Is there anything you would like to change in the way you eat?
User:Well, nothing because I eat at ease; no, … I do not want anything else.
Table 3. Statistics of the agreement per audio chunk for each corpus. Column Agr. Level indicates the condition, i.e., the minimum inter-annotator agreement, and the next two columns (No. Audios and % audios), indicate how many samples and what percentage of them fulfilled the agreement condition.
TV DebatesEmpathic VA
Agr LevelNo. Audios% AudiosNo. Audios% Audios
⩾1/54118100.00%4525100.00%
⩾2/5303573.70%452299.93%
⩾3/5126630.74%402388.91%
⩾4/53929.52%251955.67%
⩾5/5821.99%108624.00%
Table 4. Transformation of the answers to the VAD questions into continuous values in the range [0, 1]. Later, the means of the transformed values of the five annotators were computed to obtain continuous values for the dimensional model.
ArousalValenceDominanceValue
neutralrather negativerather intimidated/defensive0.0
slightly excitedneither positive nor negativeneither intimidated/defensive0.5
excitedrather positiverather dominant/controlling the situation1.0
Table 5. Frequency of the different categories in the corpora. Both the TV Debates and Empathic VA datasets are unbalanced. The majority class is the neutral emotion (calm/indifferent and calm/bored/tired), with more than 70% of the samples.
TV DebatesEmpathic VA
Category% AudiosCategory% Audios
calm/indifferent73.64calm/bored/tired79.47
annoyed/tense14.32happy/amused13.55
enthusiastic4.72puzzled3.11
satisfied/pleased3.23annoyed/tense2.83
worried2.12sad1.04
interested.1.57
others0.40
Table 6. Composition of the final categories of each corpus with the number of samples that each category contains.
TV DebatesEmpathic VA
calm/indifferent + interested + worriedCALM983calm/bored/tiredCALM3197
enthusiastic + satisfiedENT101Happy/AmusedHAPPY545
annoyed/tenseANN182annoyed/tenseANN114
puzzled + sadPUZZ167
Table 7. Final categories for each dimension of the VAD model with the number of samples they contain in each of the corpora.
TV DebatesEmpathic VA
arousalneutral30682498
excited10502027
valencenegative682520
neutral22392811
positive11971194
dominanceneutral30392946
dominant10791579
Table 8. Classification results on the spectrogram input for each of the problems (categorical and each dimension of the VAD) and corpus (TV Debates and Empathic VA). Each problem has a row per category with the precision, recall, and F 1 -score metrics and a row of means (Overall) that shows the macro and weighted average measures of the metrics for all categories.
TV DebatesEmpathic VA
Acc P / P W R / R W F 1 / F 1 W Acc P / P W R / R W F 1 / F 1 W
overall0.650.56/0.650.57/0.650.56/0.650.730.34/0.64 0.27/0.73  0.26/0.66overall
CALM 0.750.740.75 0.760.940.84CALM
Cat.ENT 0.420.450.43 0.260.080.13HAPPY
ANN 0.510.500.51 0.200.010.03ANN
0.140.030.05PUZZ
overall0.760.69/0.770.71/0.760.70/0.770.580.58/0.580.56/0.580.54/0.55overall
Aro.neutral 0.860.820.84 0.590.810.68neutral
excited 0.530.600.56 0.570.300.40excited
overall0.510.48/0.520.47/0.510.47/0.520.550.41/0.520.39/0.550.38/0.52overall
Val.negative 0.410.360.38 0.210.210.21negative
neutral 0.600.590.59 0.630.770.69neutral
positive 0.420.470.44 0.400.180.25positive
overall0.630.58/0.690.60/0.630.58/0.650.630.59/0.620.58/0.630.59/0.63overall
Dom.neutral 0.800.660.72 0.710.740.73neutral
dominant 0.360.540.43 0.470.420.45dominant
Table 9. Classification results on wav2vec input for each of the problems (categorical and each dimension of the VAD) and corpus (TV Debates and Empathic VA). Each problem shows the accuracy, and macro and weighted average measures of the metrics (precision, recall, and F 1 -score) for all categories.
TV DebatesEmpathic VA
Acc P / P W R / R W F 1 / F 1 W Acc P / P W R / R W F 1 / F 1 W
categorical0.630.44/0.530.34/0.630.27/0.500.790.20/0.630.25/0.790.22/0.70
arousal0.750.64/0.710.56/0.750.55/0.700.530.51/0.510.51/0.530.49/0.51
valence0.380.29/0.390.35/0.380.27/0.330.620.33/0.480.33/0.620.26/0.48
dominance0.740.37/0.540.50/0.740.42/0.630.630.55/0.590.53/0.630.52/0.59
Publisher’s Note: MDPI stays neutral with regard to jurisdictional claims in published maps and institutional affiliations.

