
Correction of Field-Measured Wind Speed Affected by Deterministic Interference Factors


Abstract
:1. Introduction
2. Site Overviews and Wind Conditions
3. Wind Speed Revise
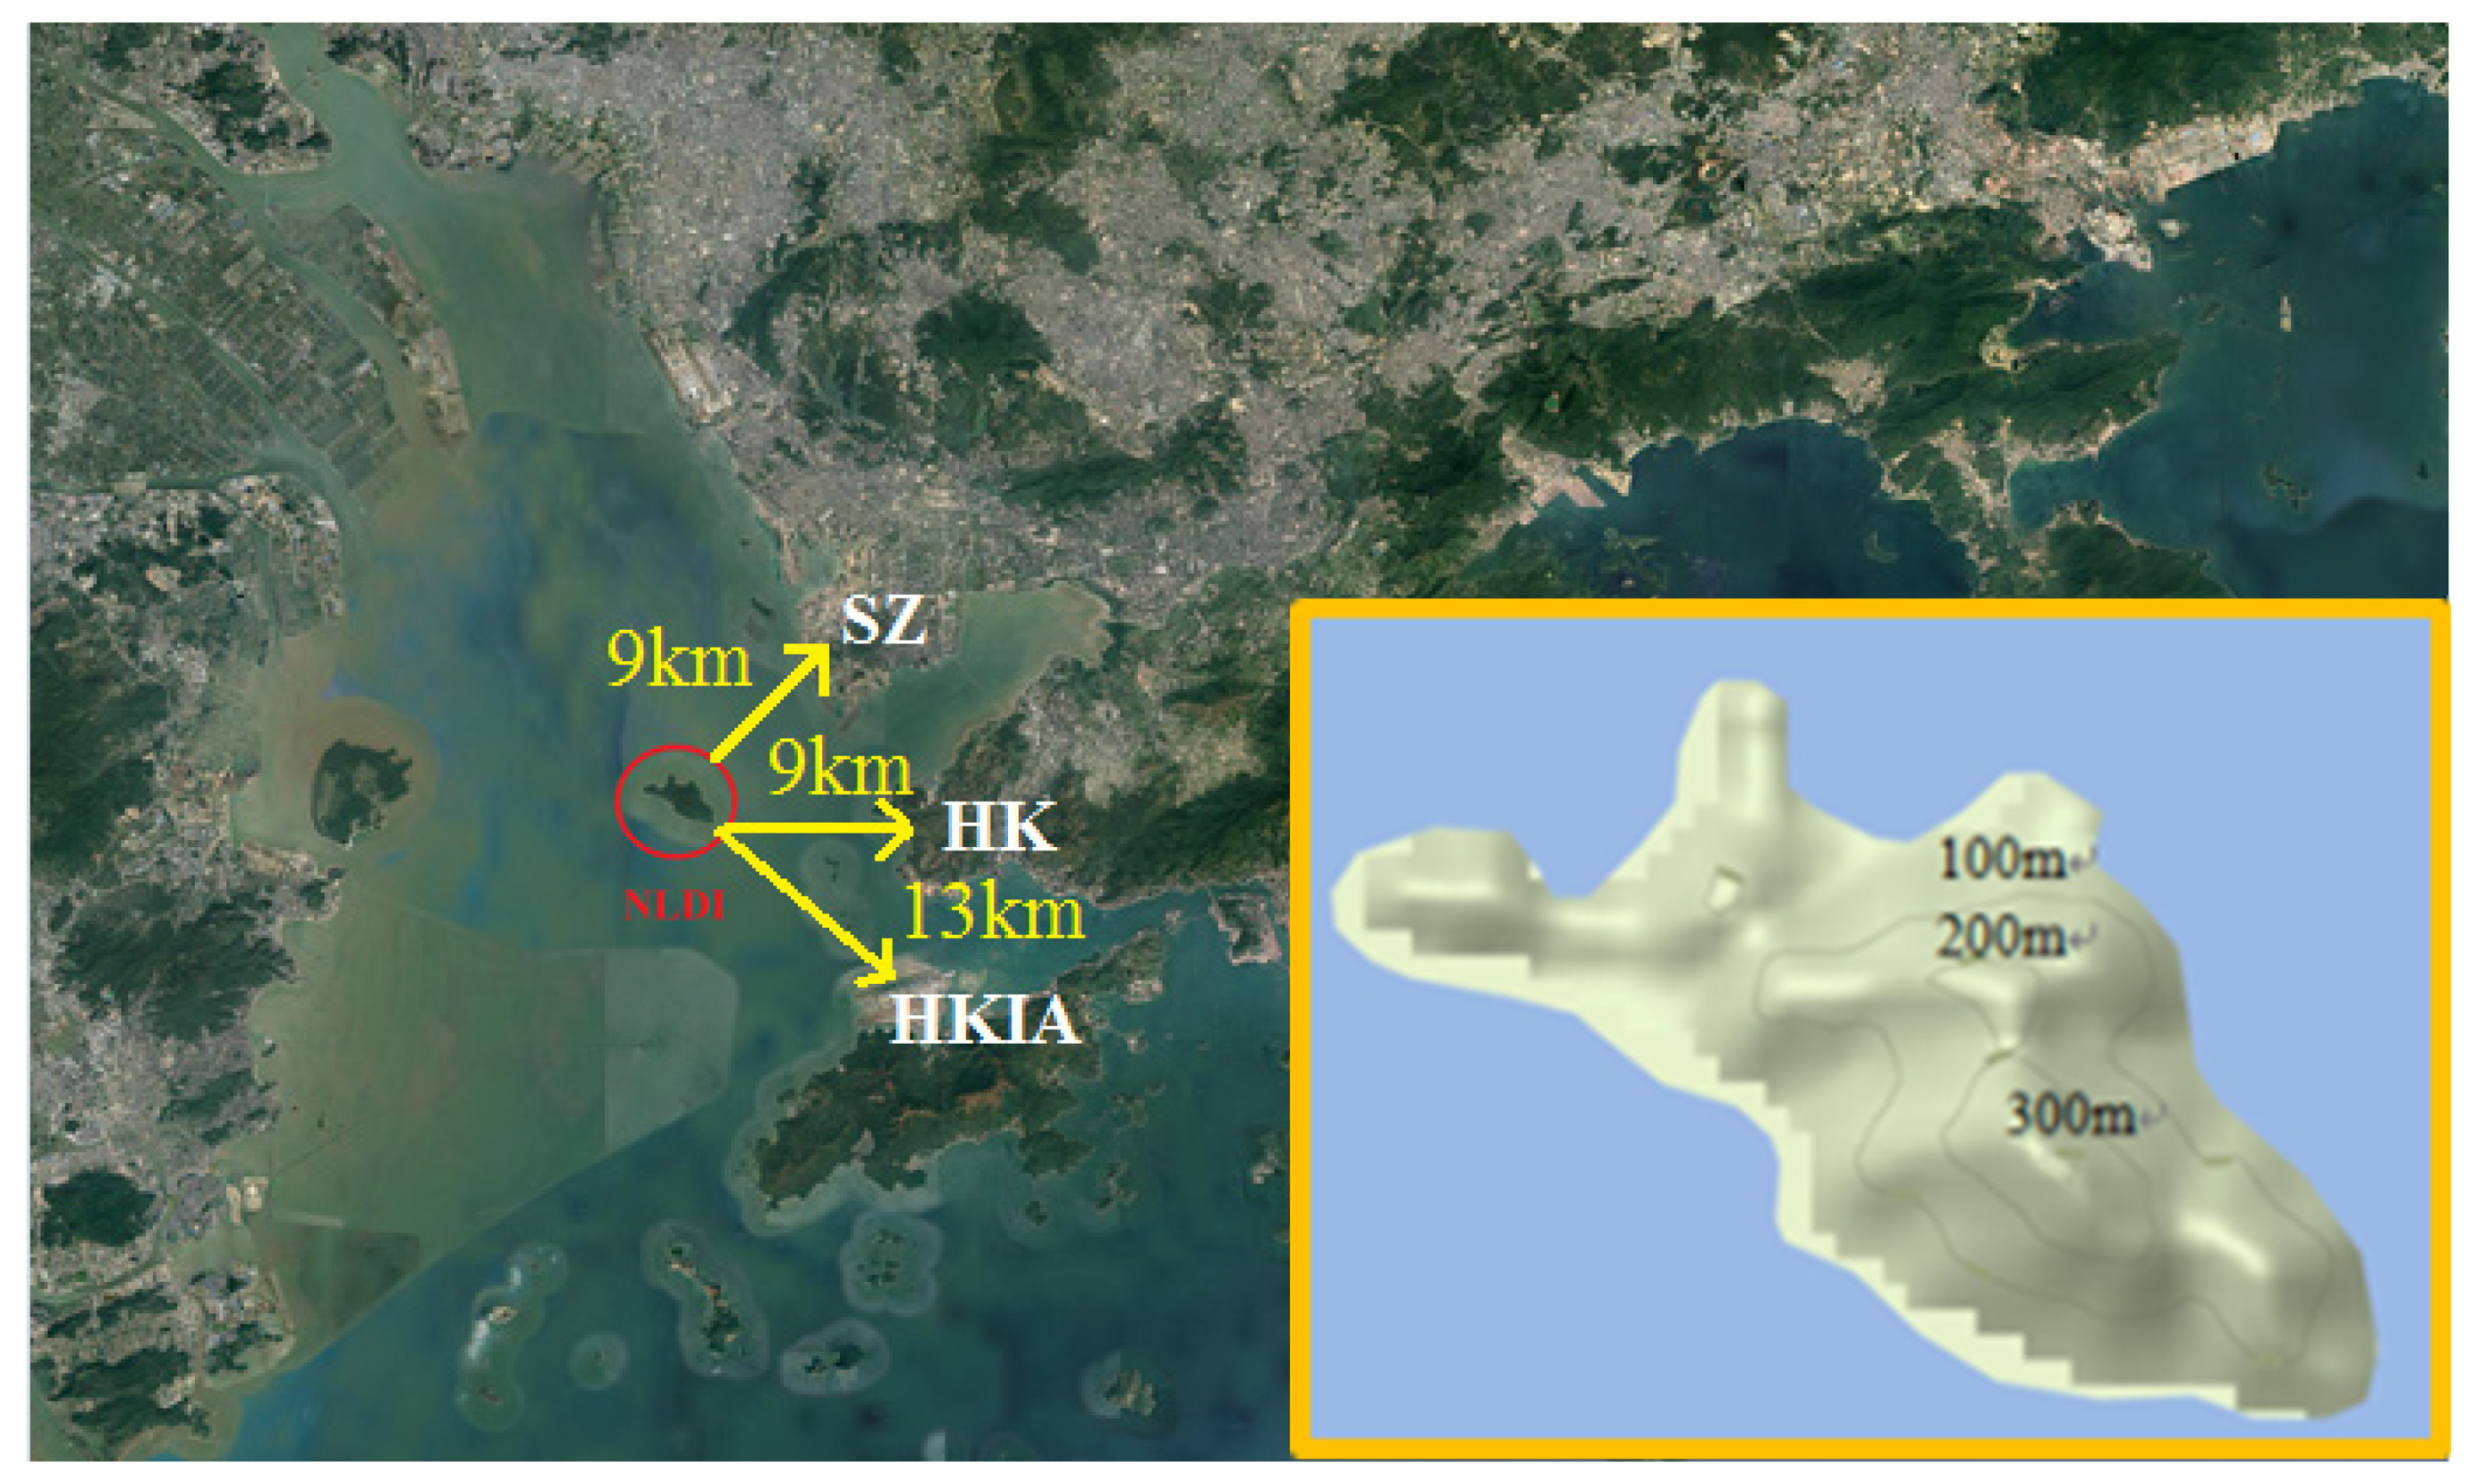
3.1. NLDI Site
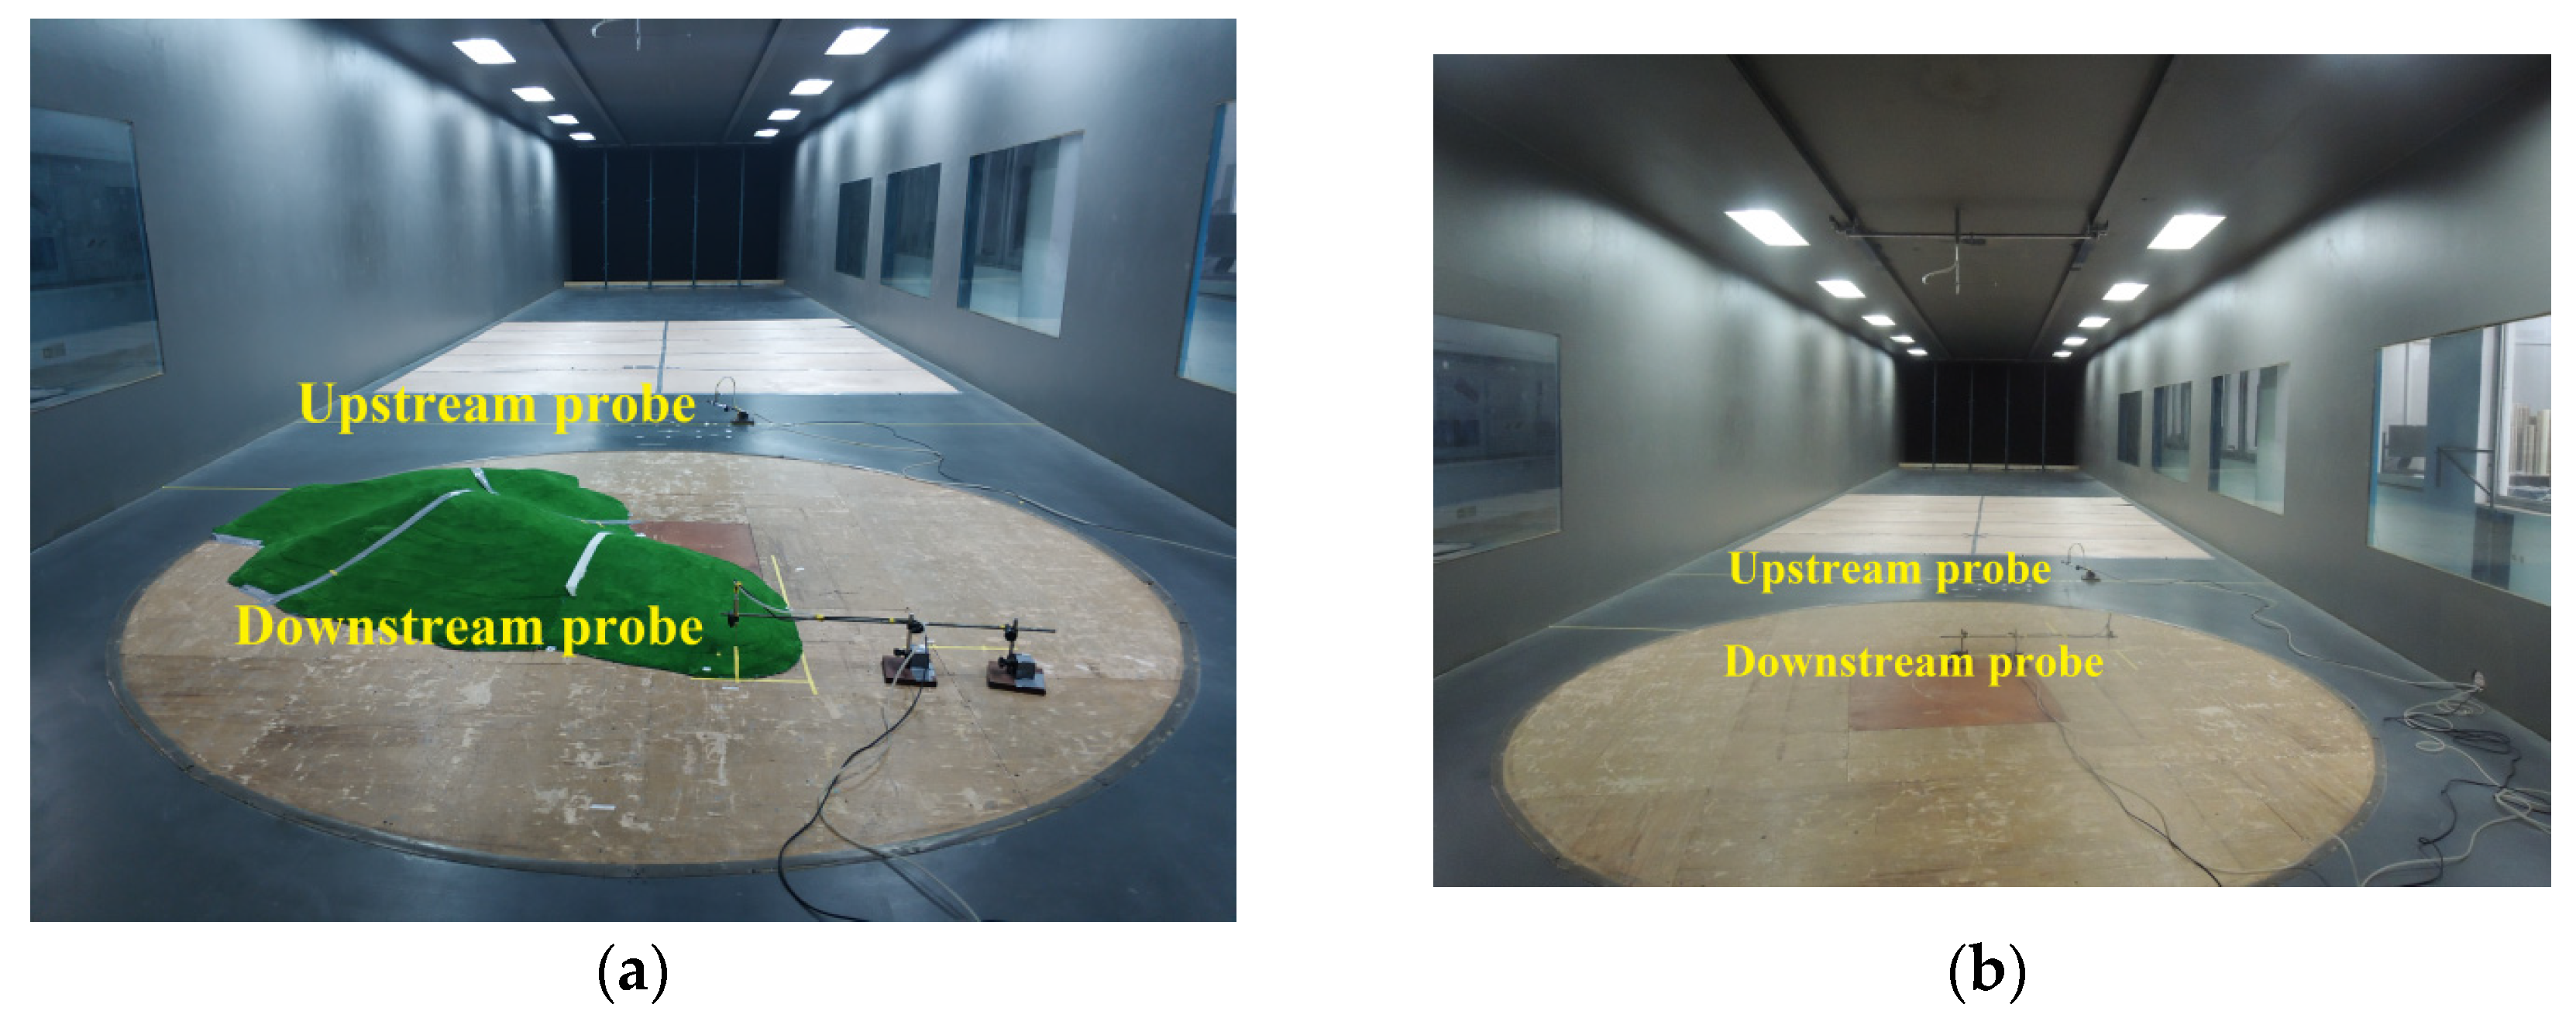
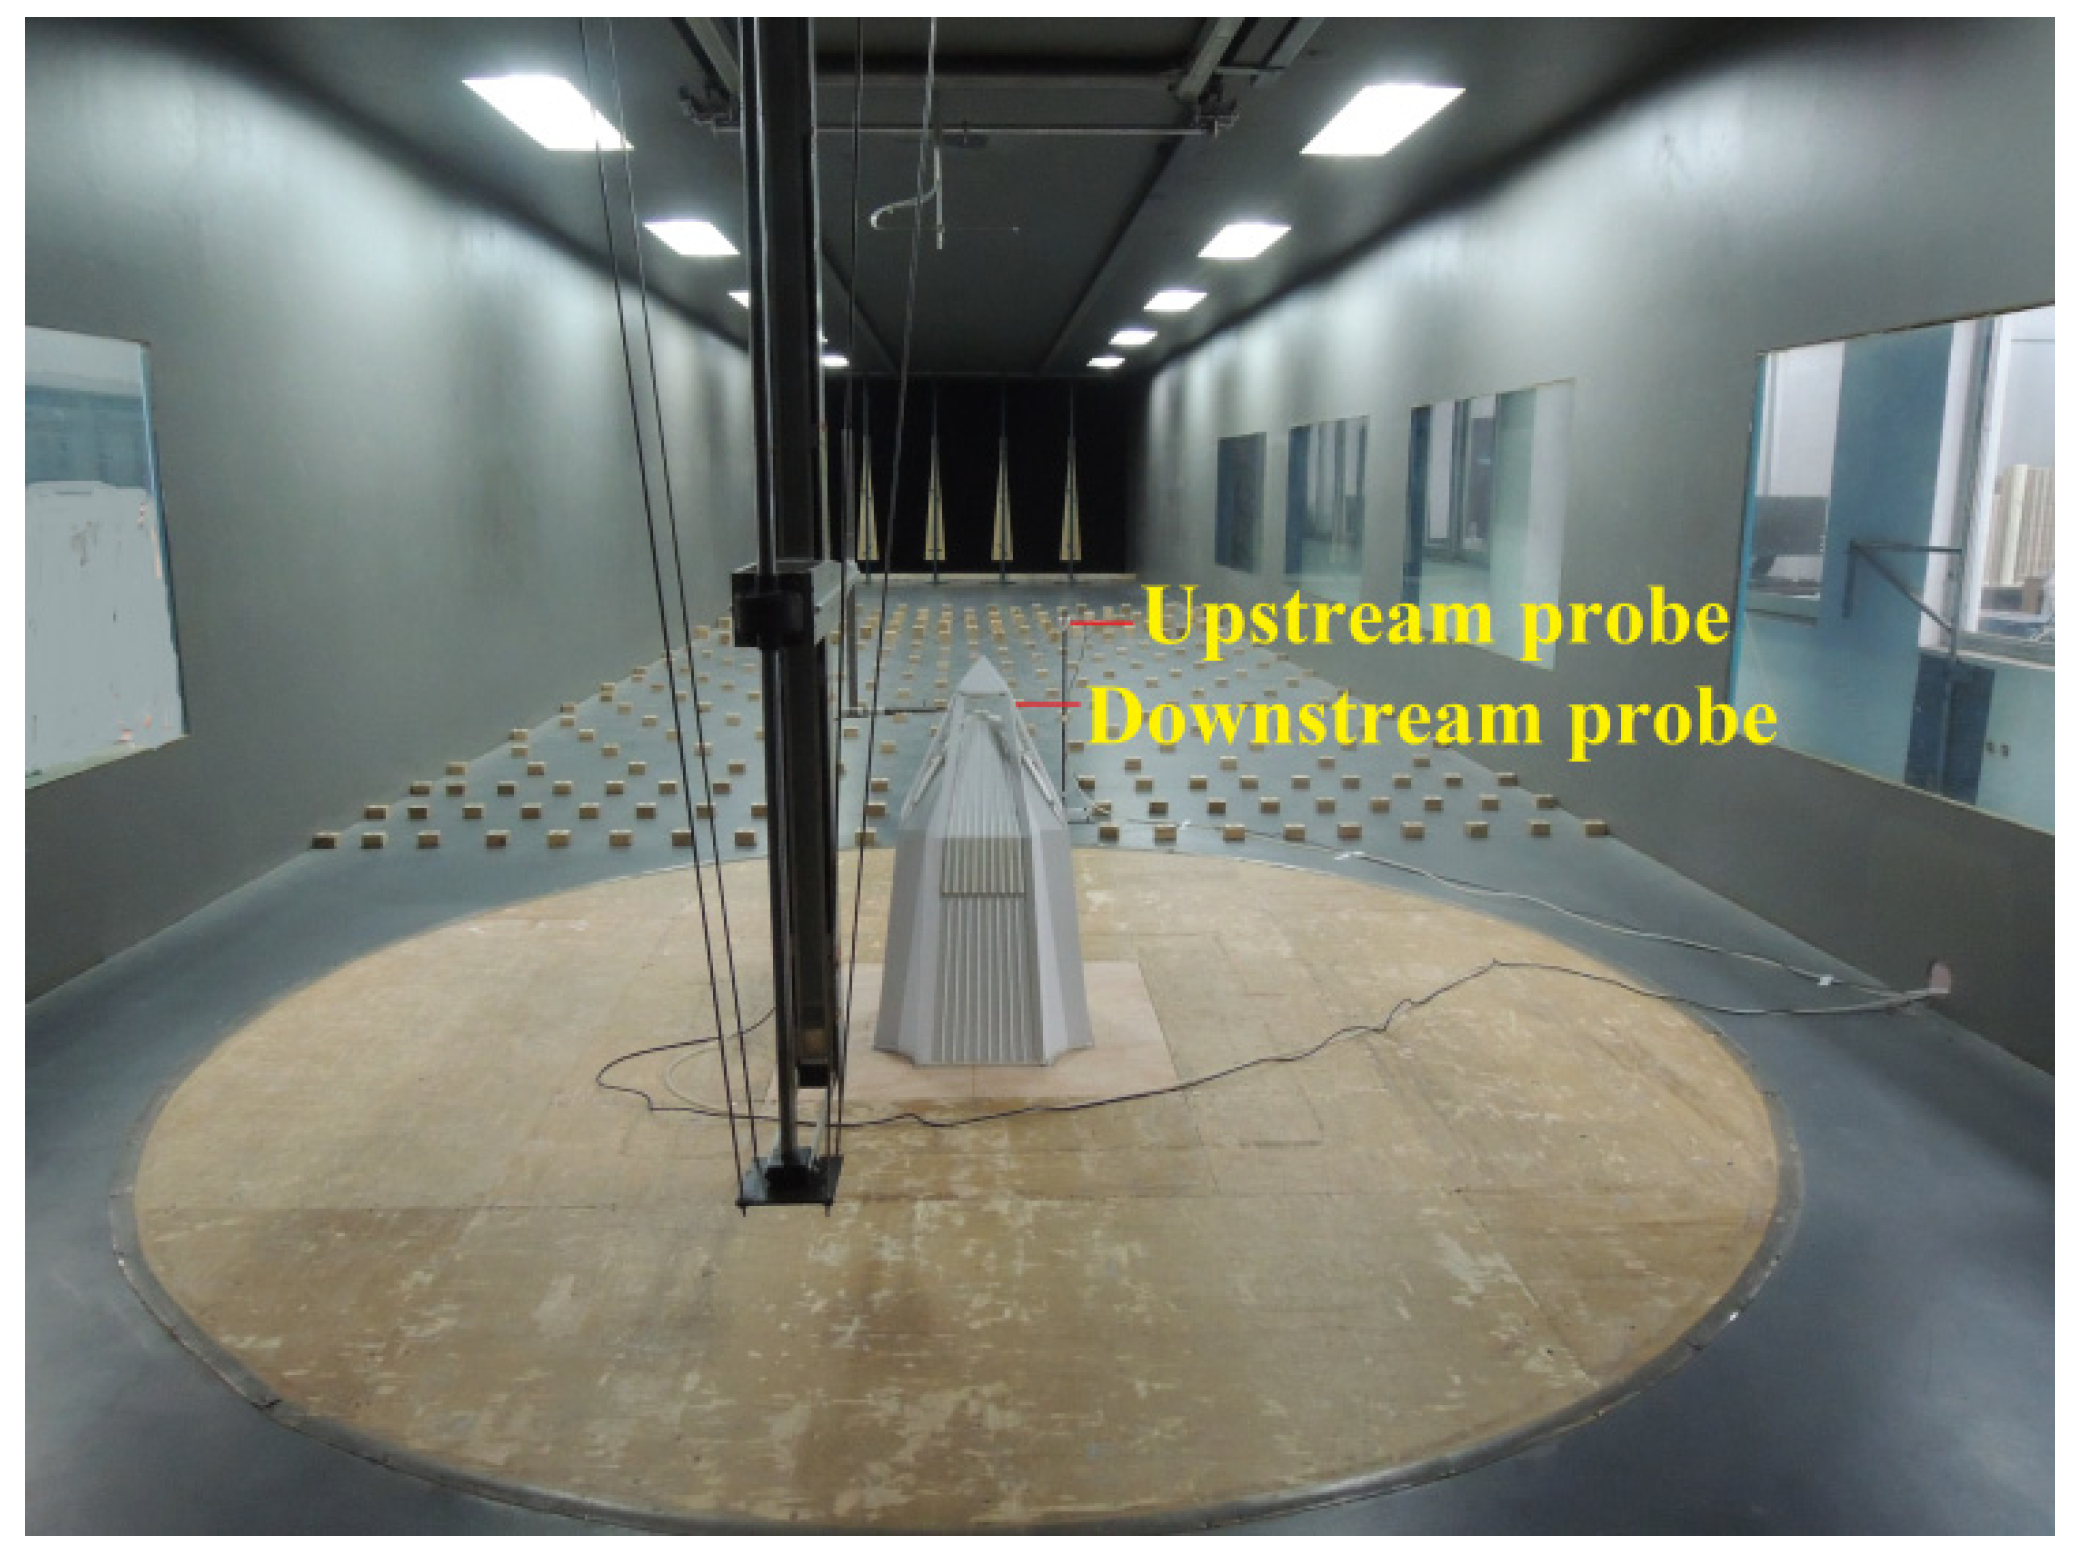
3.1.1. WTT
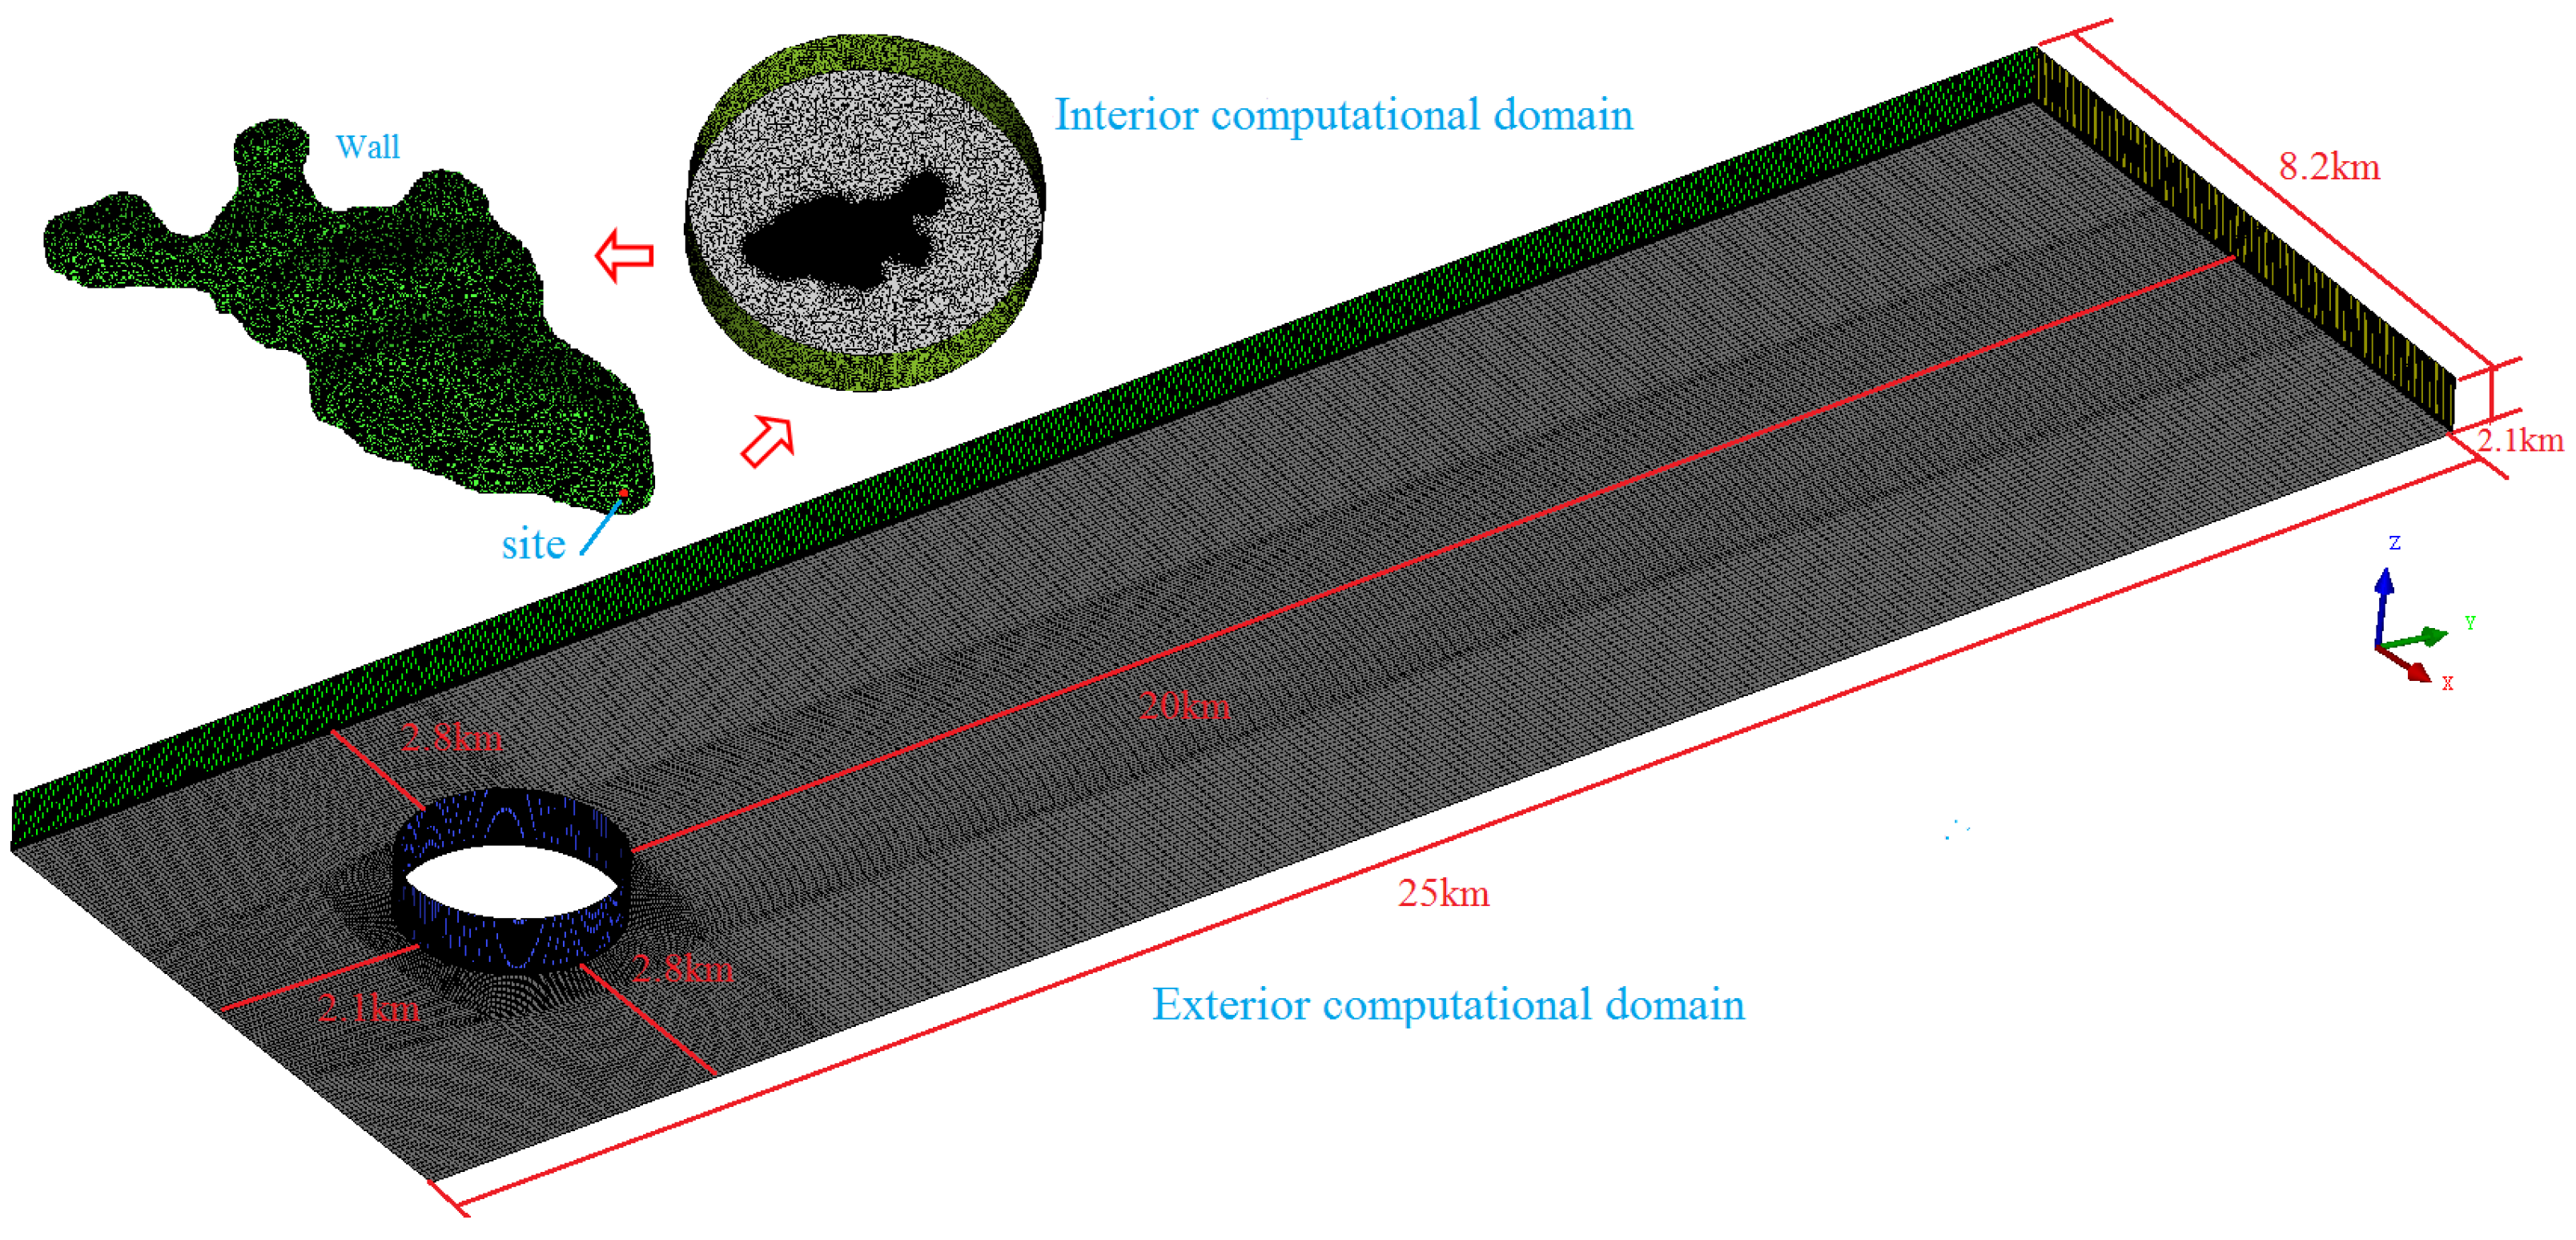
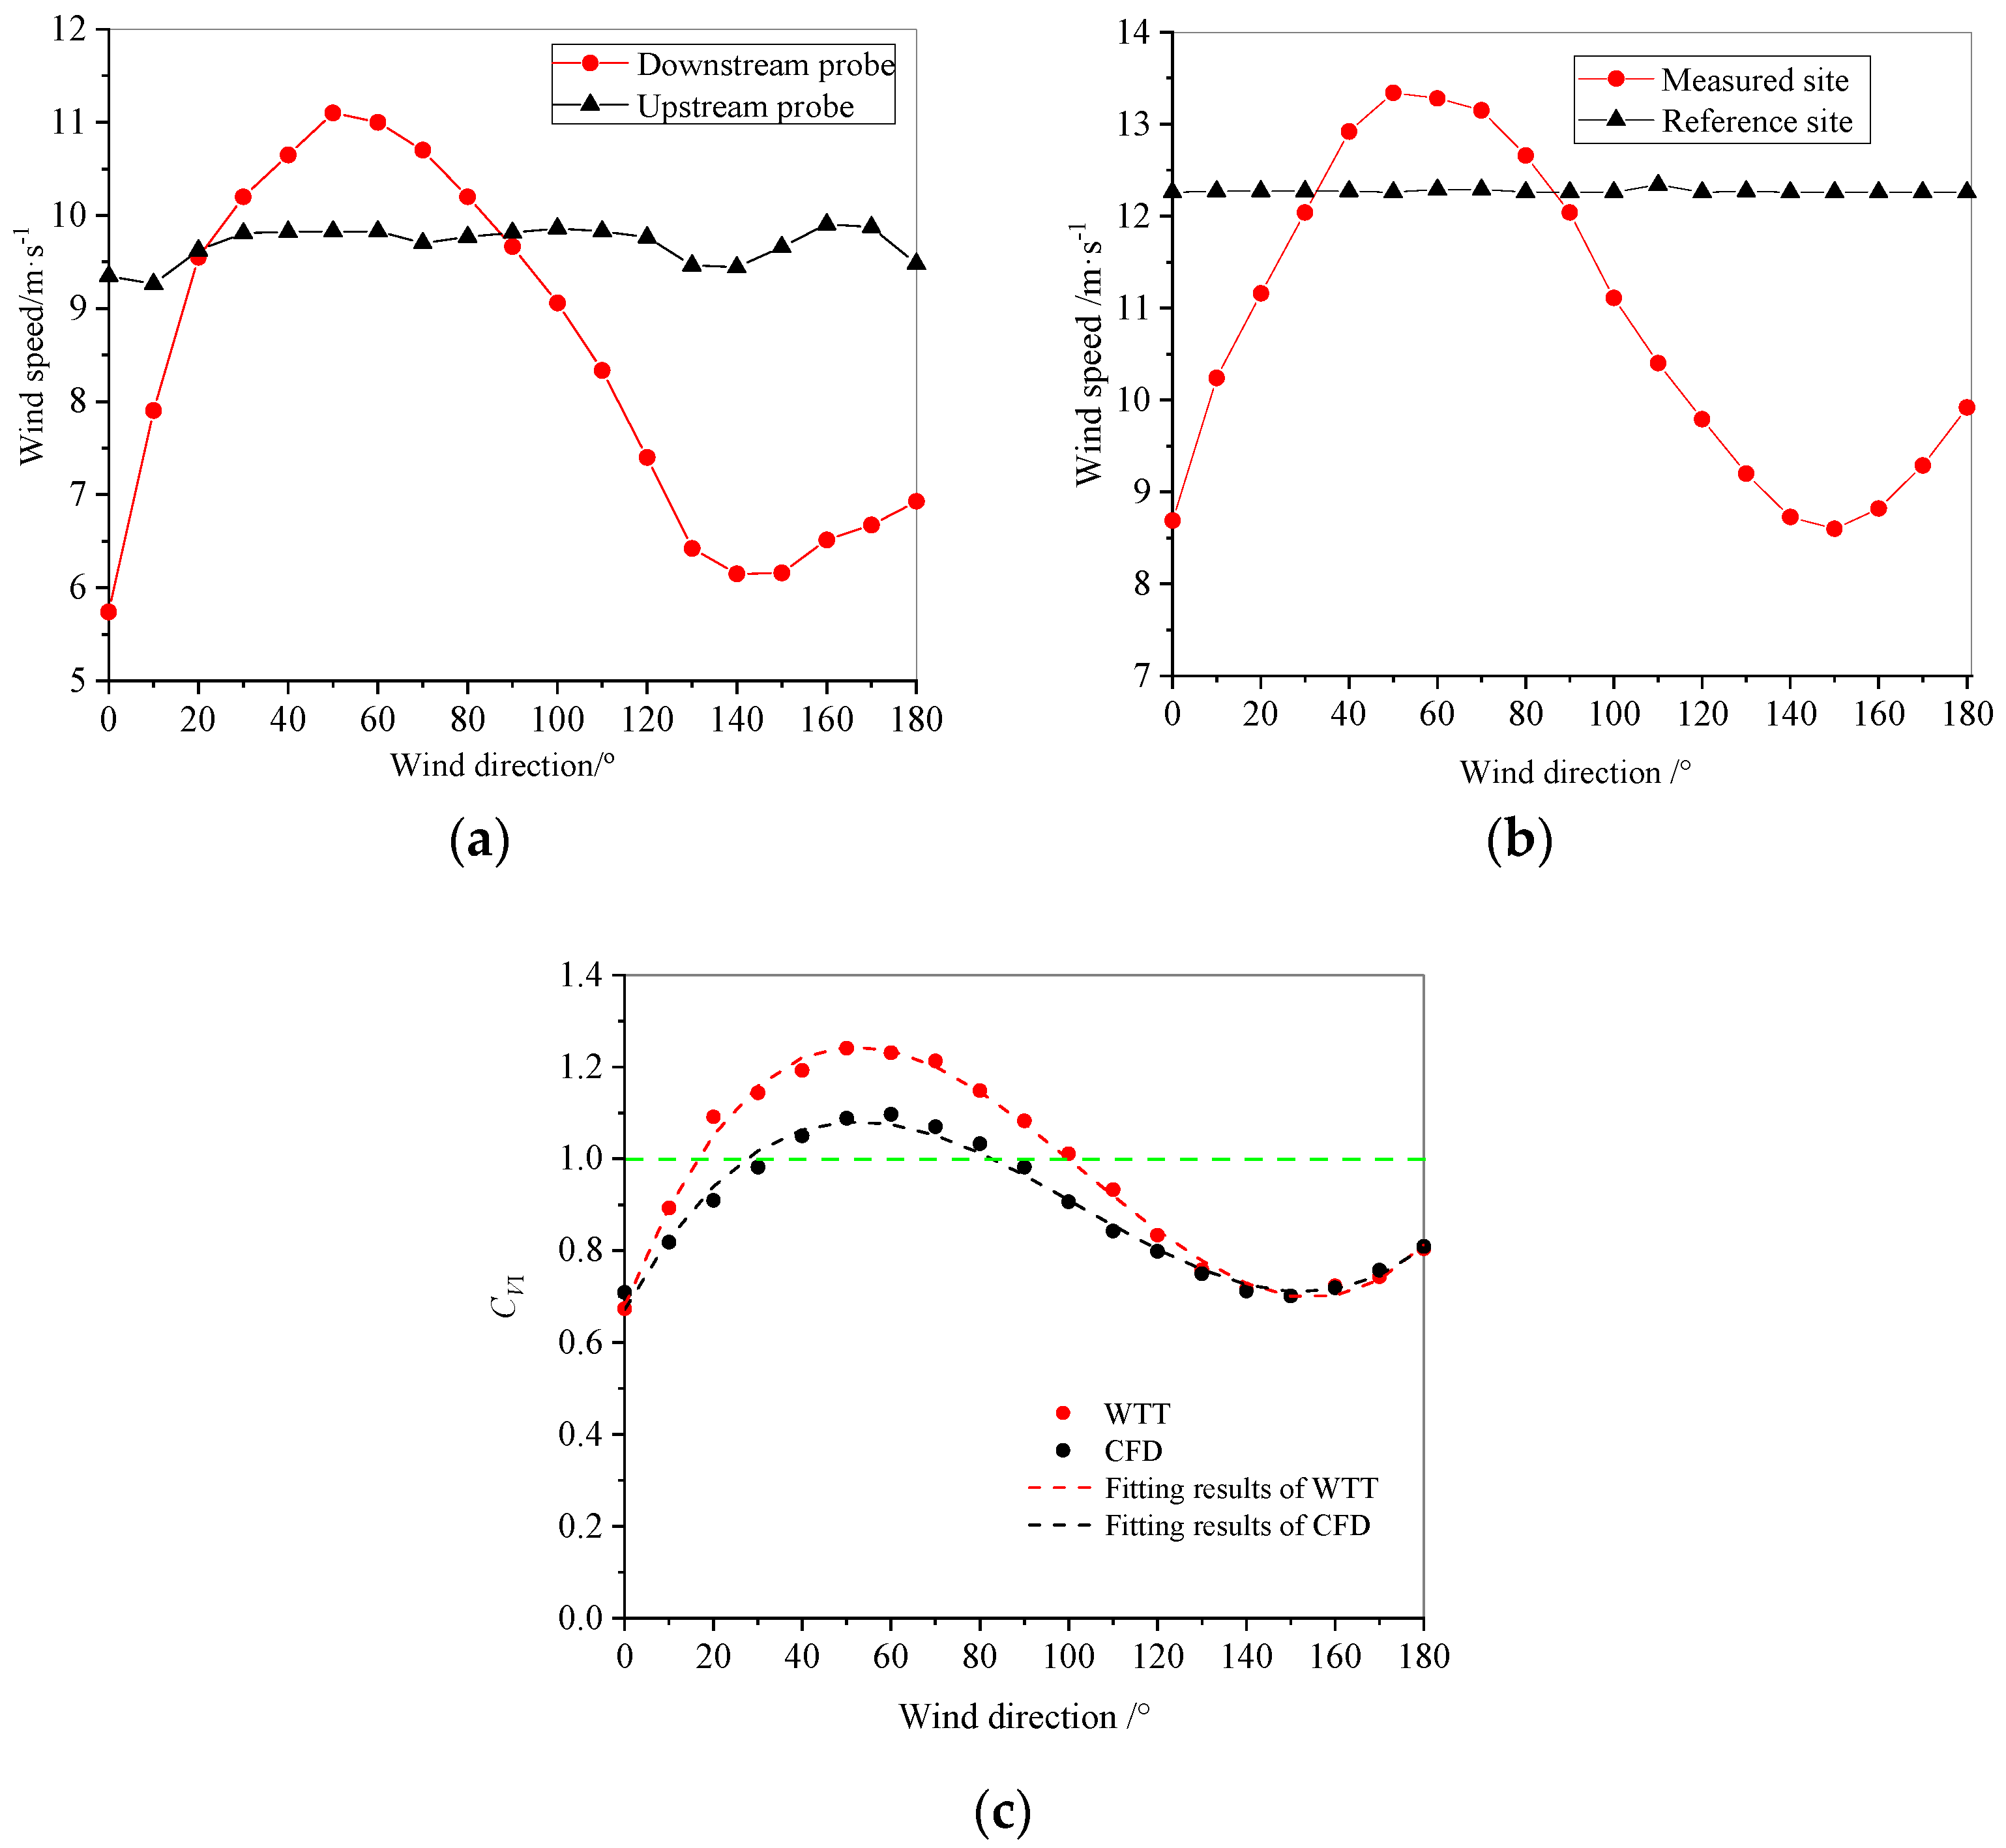
3.1.2. Numerical Simulation Verification
3.1.3. Experimental Results
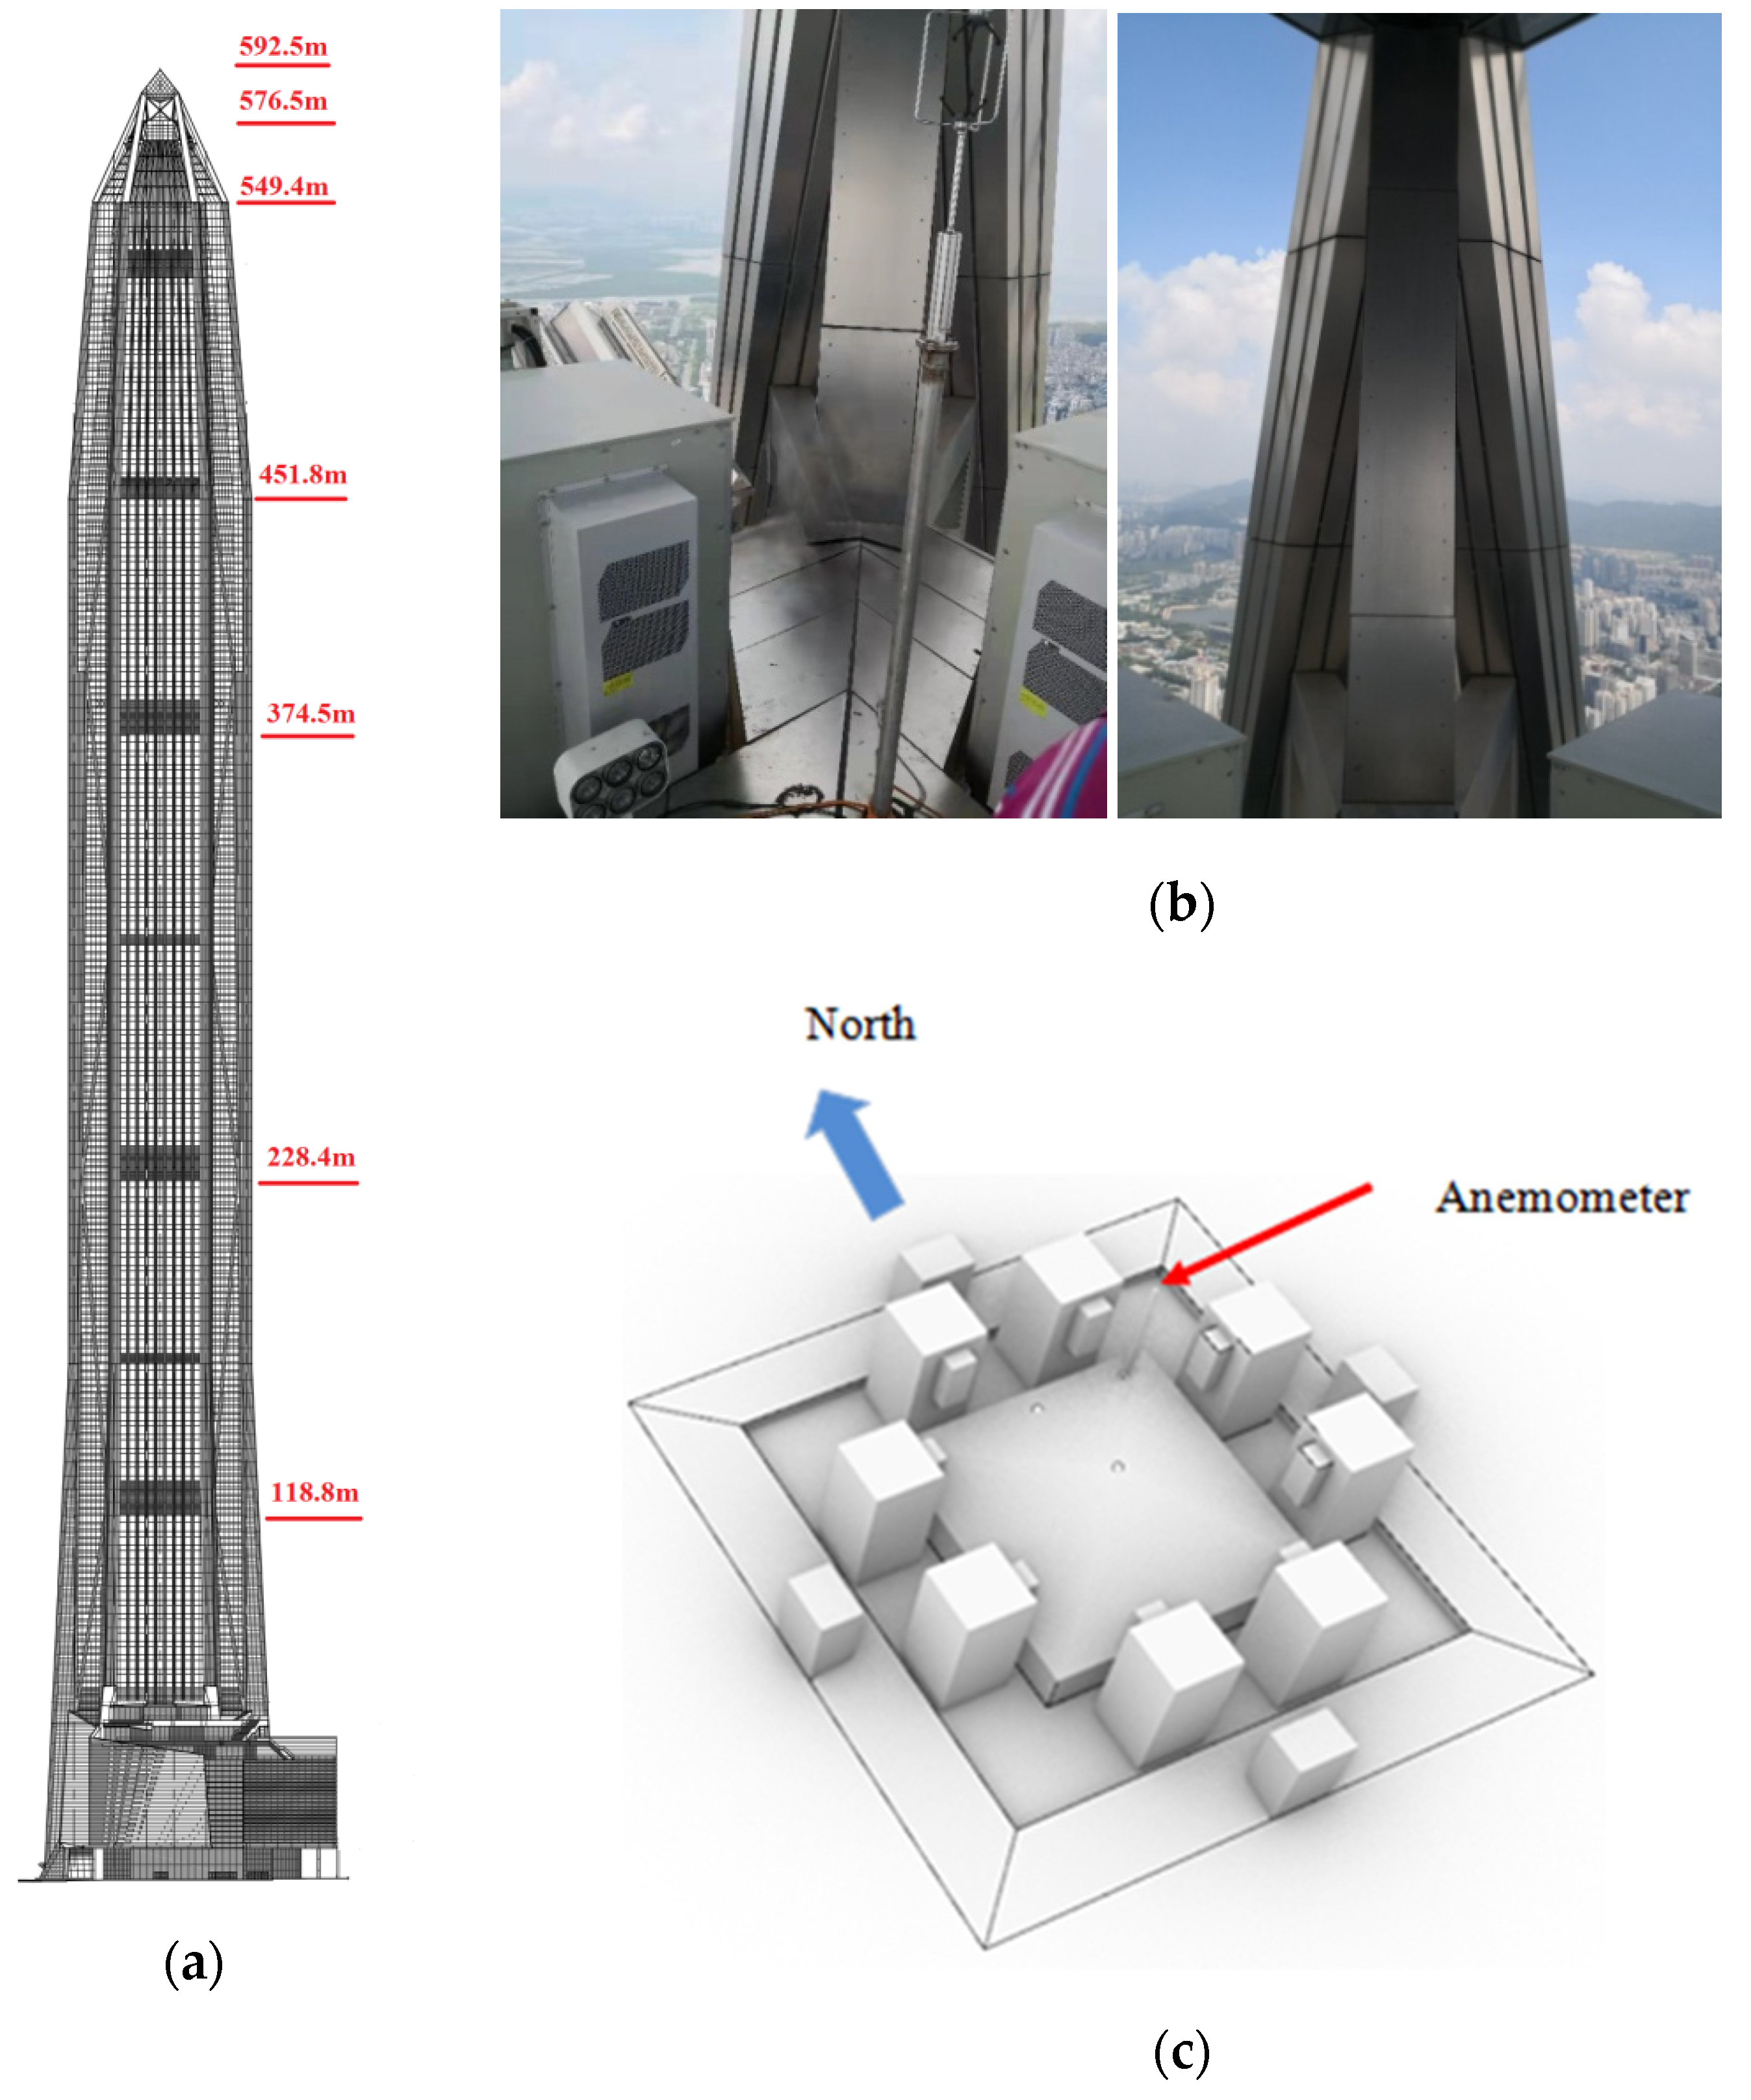
3.2. PAFC Site
4. Maximum Reference Wind Pressure of Super Typhoon Mangkhut
5. Conclusions
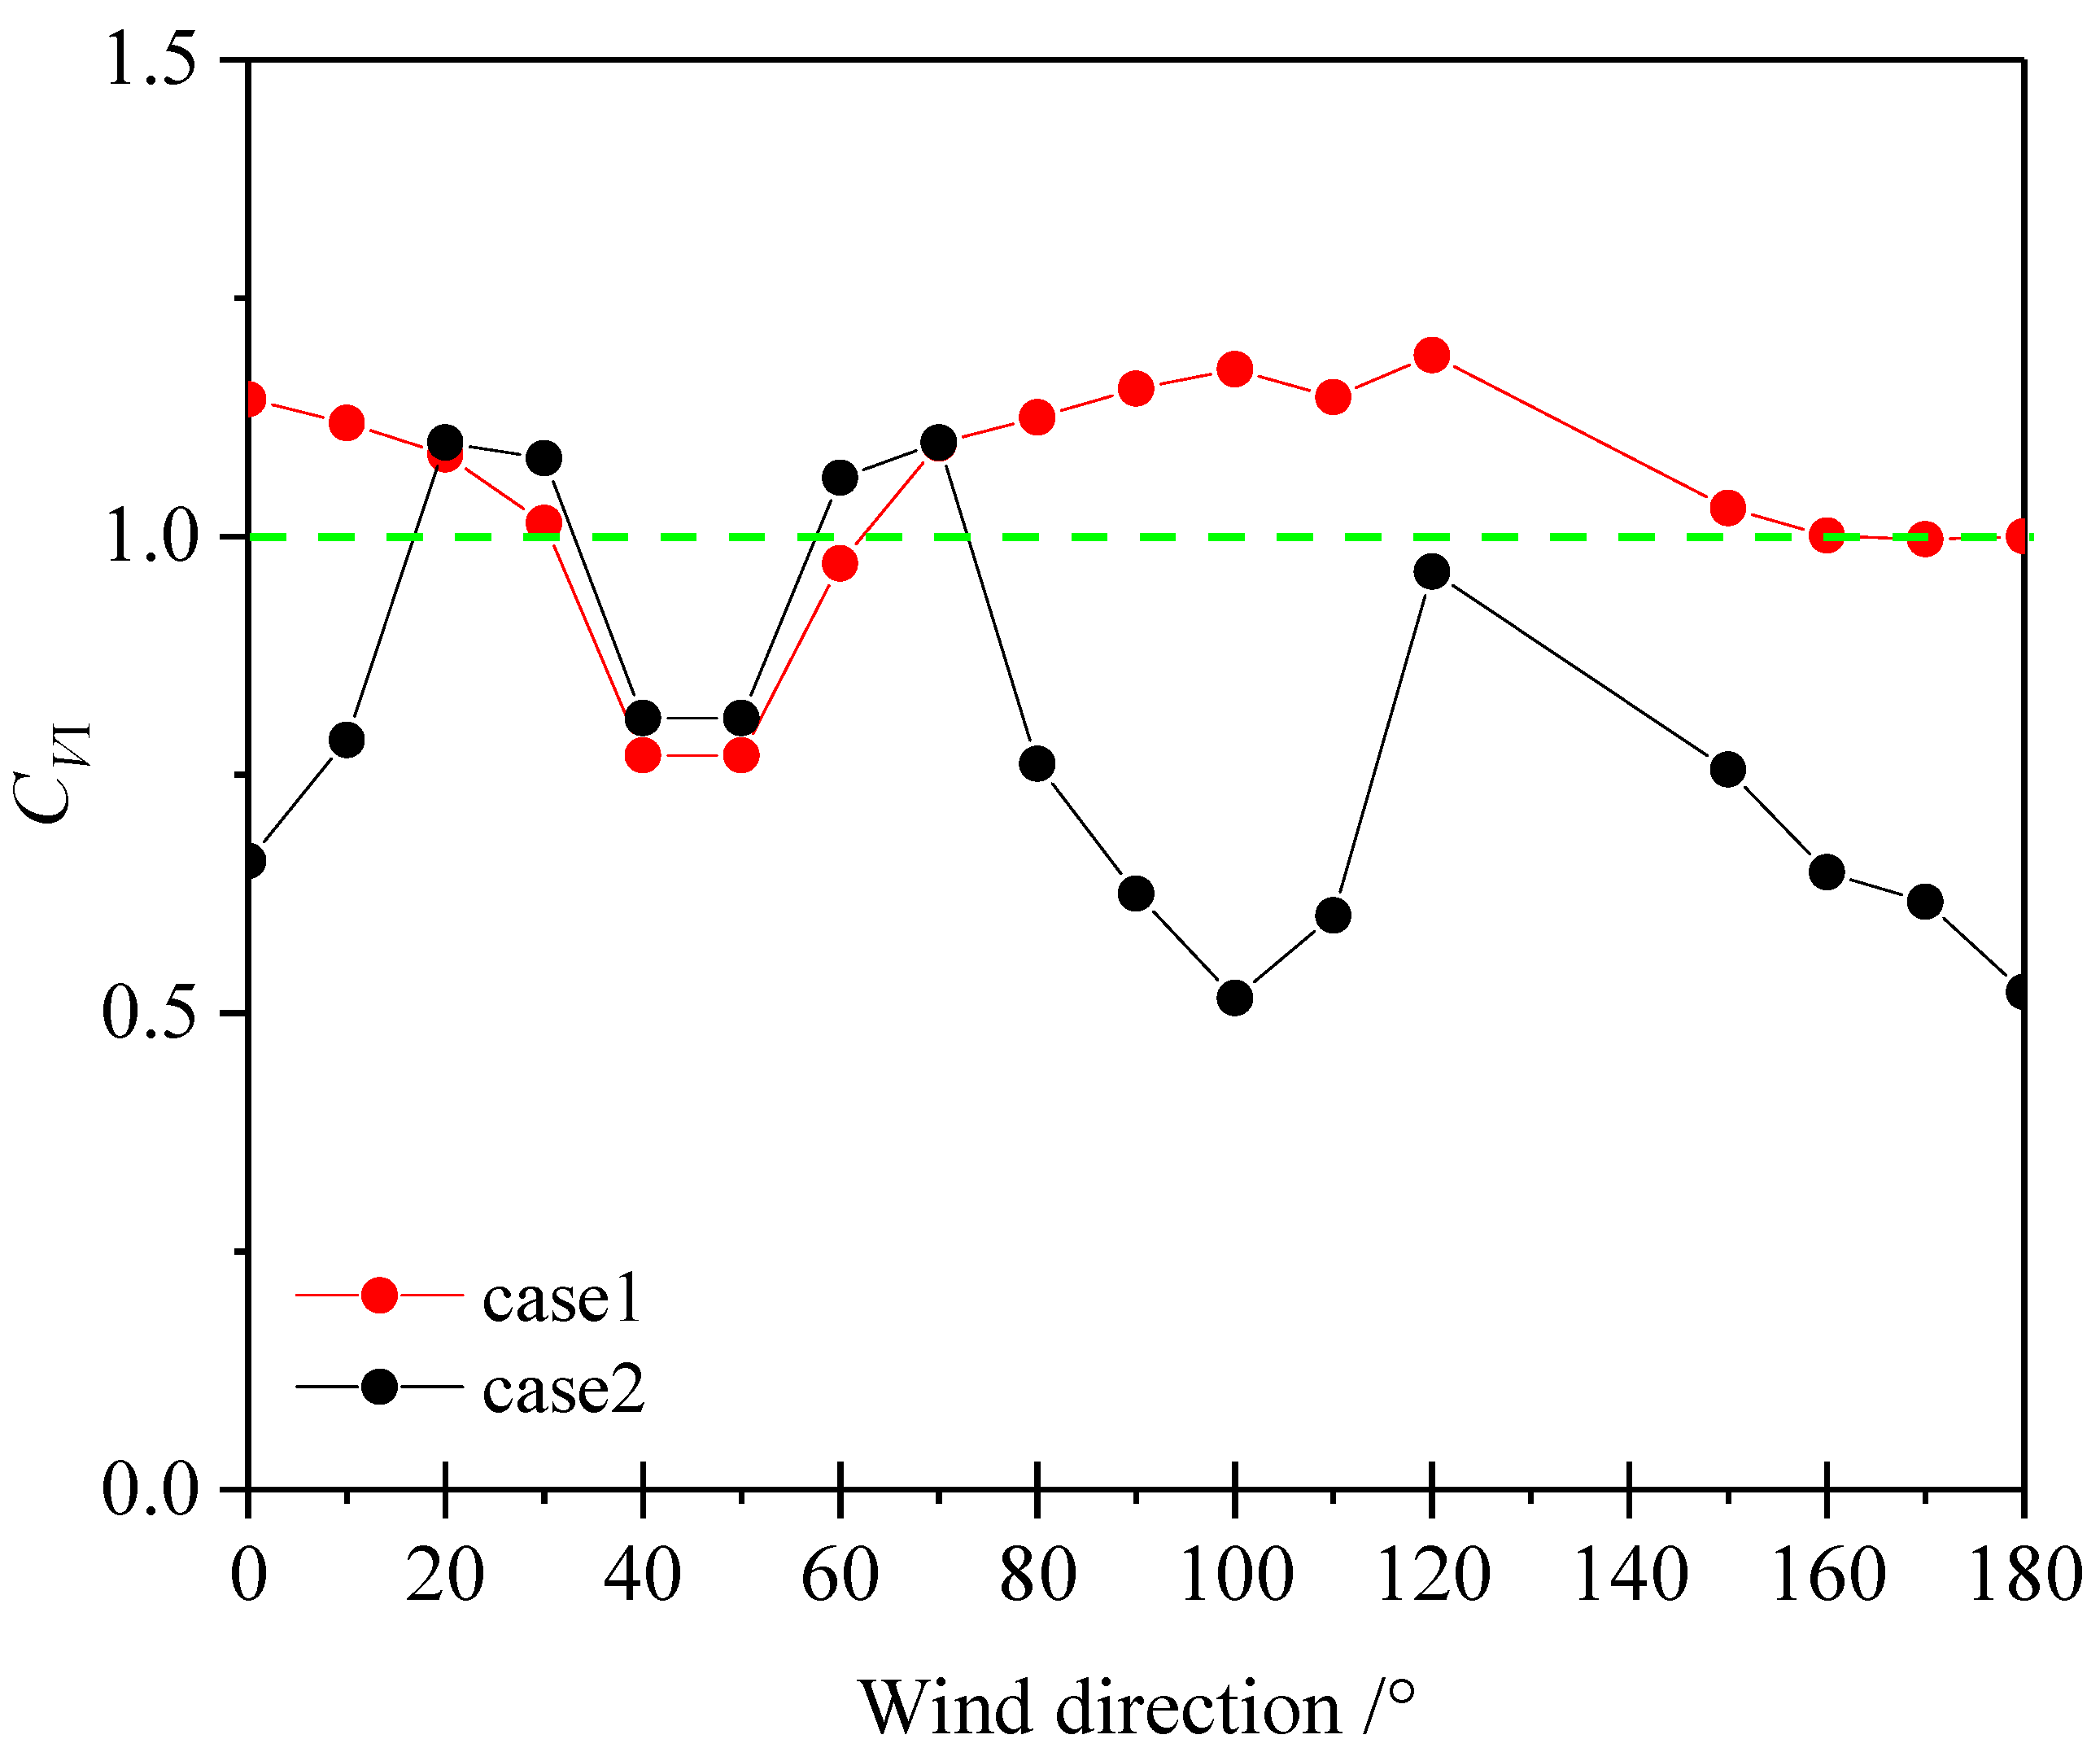
- As for NLDI, which was affected by terrain interference, the overall trend of the fitted CVI with wind direction by means of WTT and numerical simulation is the same. However, differences in CVI were found under the same wind direction, and the CVI value in the WTT was higher than that in the CFD numerical simulation. The existence of NLDI accelerated the measured wind speed by 12% in the sensitive wind direction.
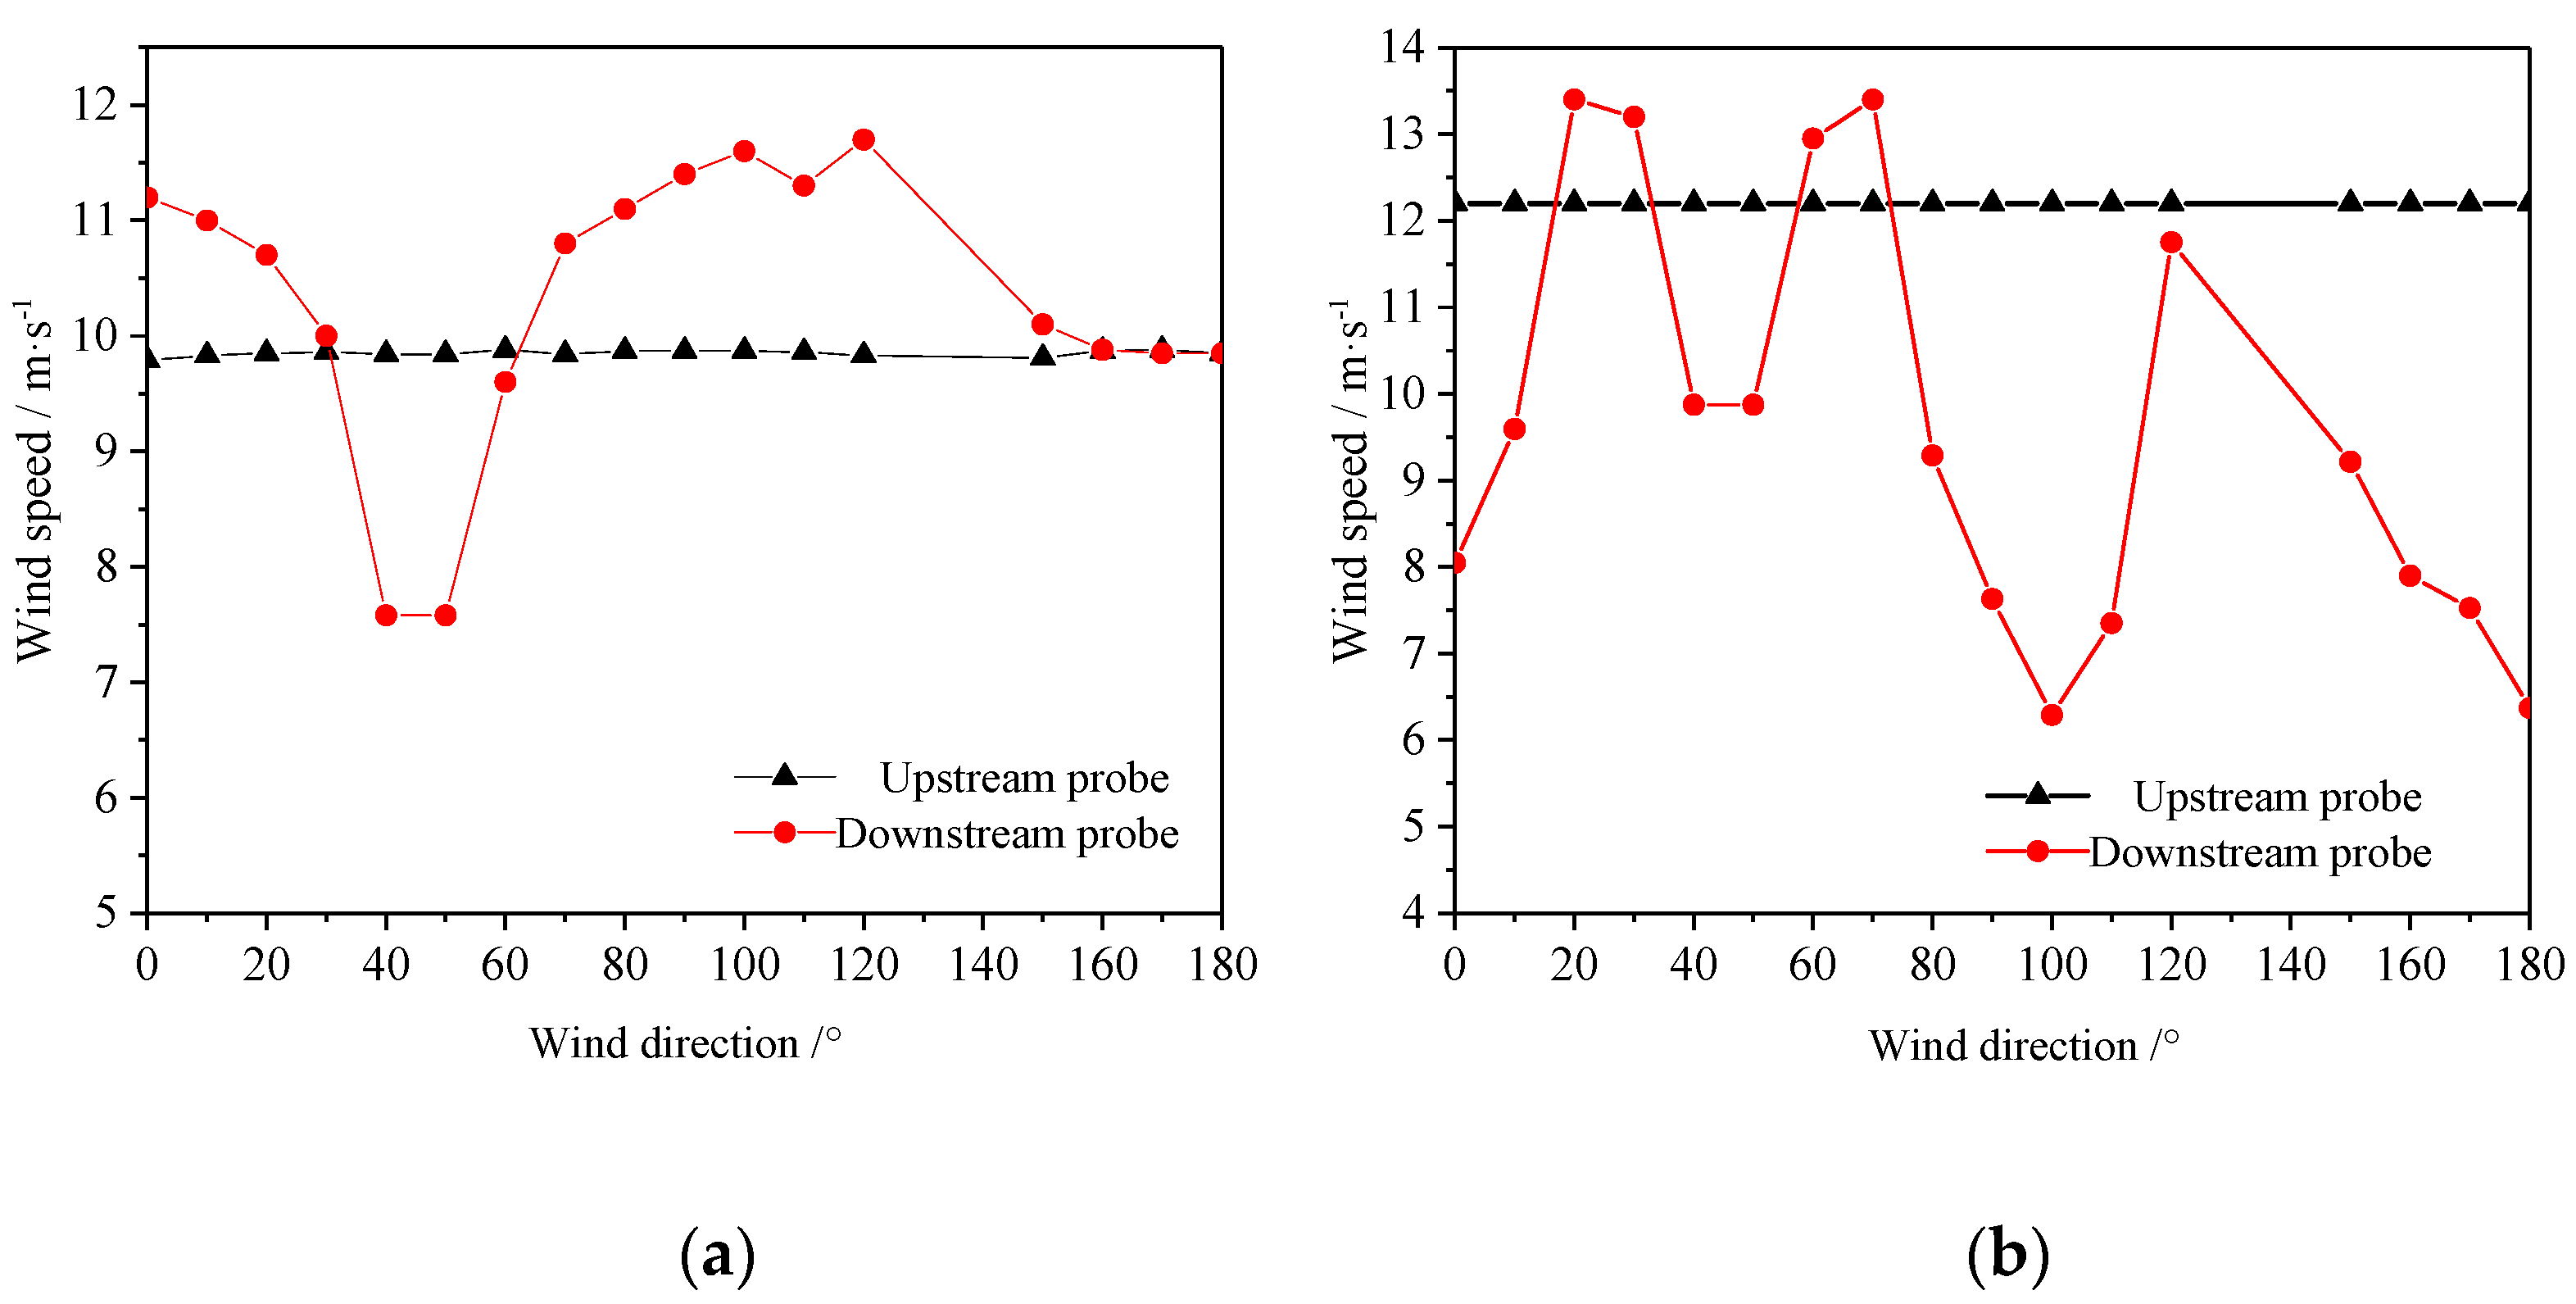
- As for PAFC, which was affected by the building and instruments, the WTT results revealed that the wind speed in directions of 45° and nearby were sheltered by the giant pillars at the corner and reduced by 20%. The wind speeds of the other wind directions were mainly affected by the instruments in the hollow-layer, and the acceleration effect was presented when the instruments were absent. In addition, the shielding effect was presented when the instruments were present. In the dominant wind direction, the wind speed influence coefficients were 1.163 and 0.593 when undisturbed and disturbed by instruments.
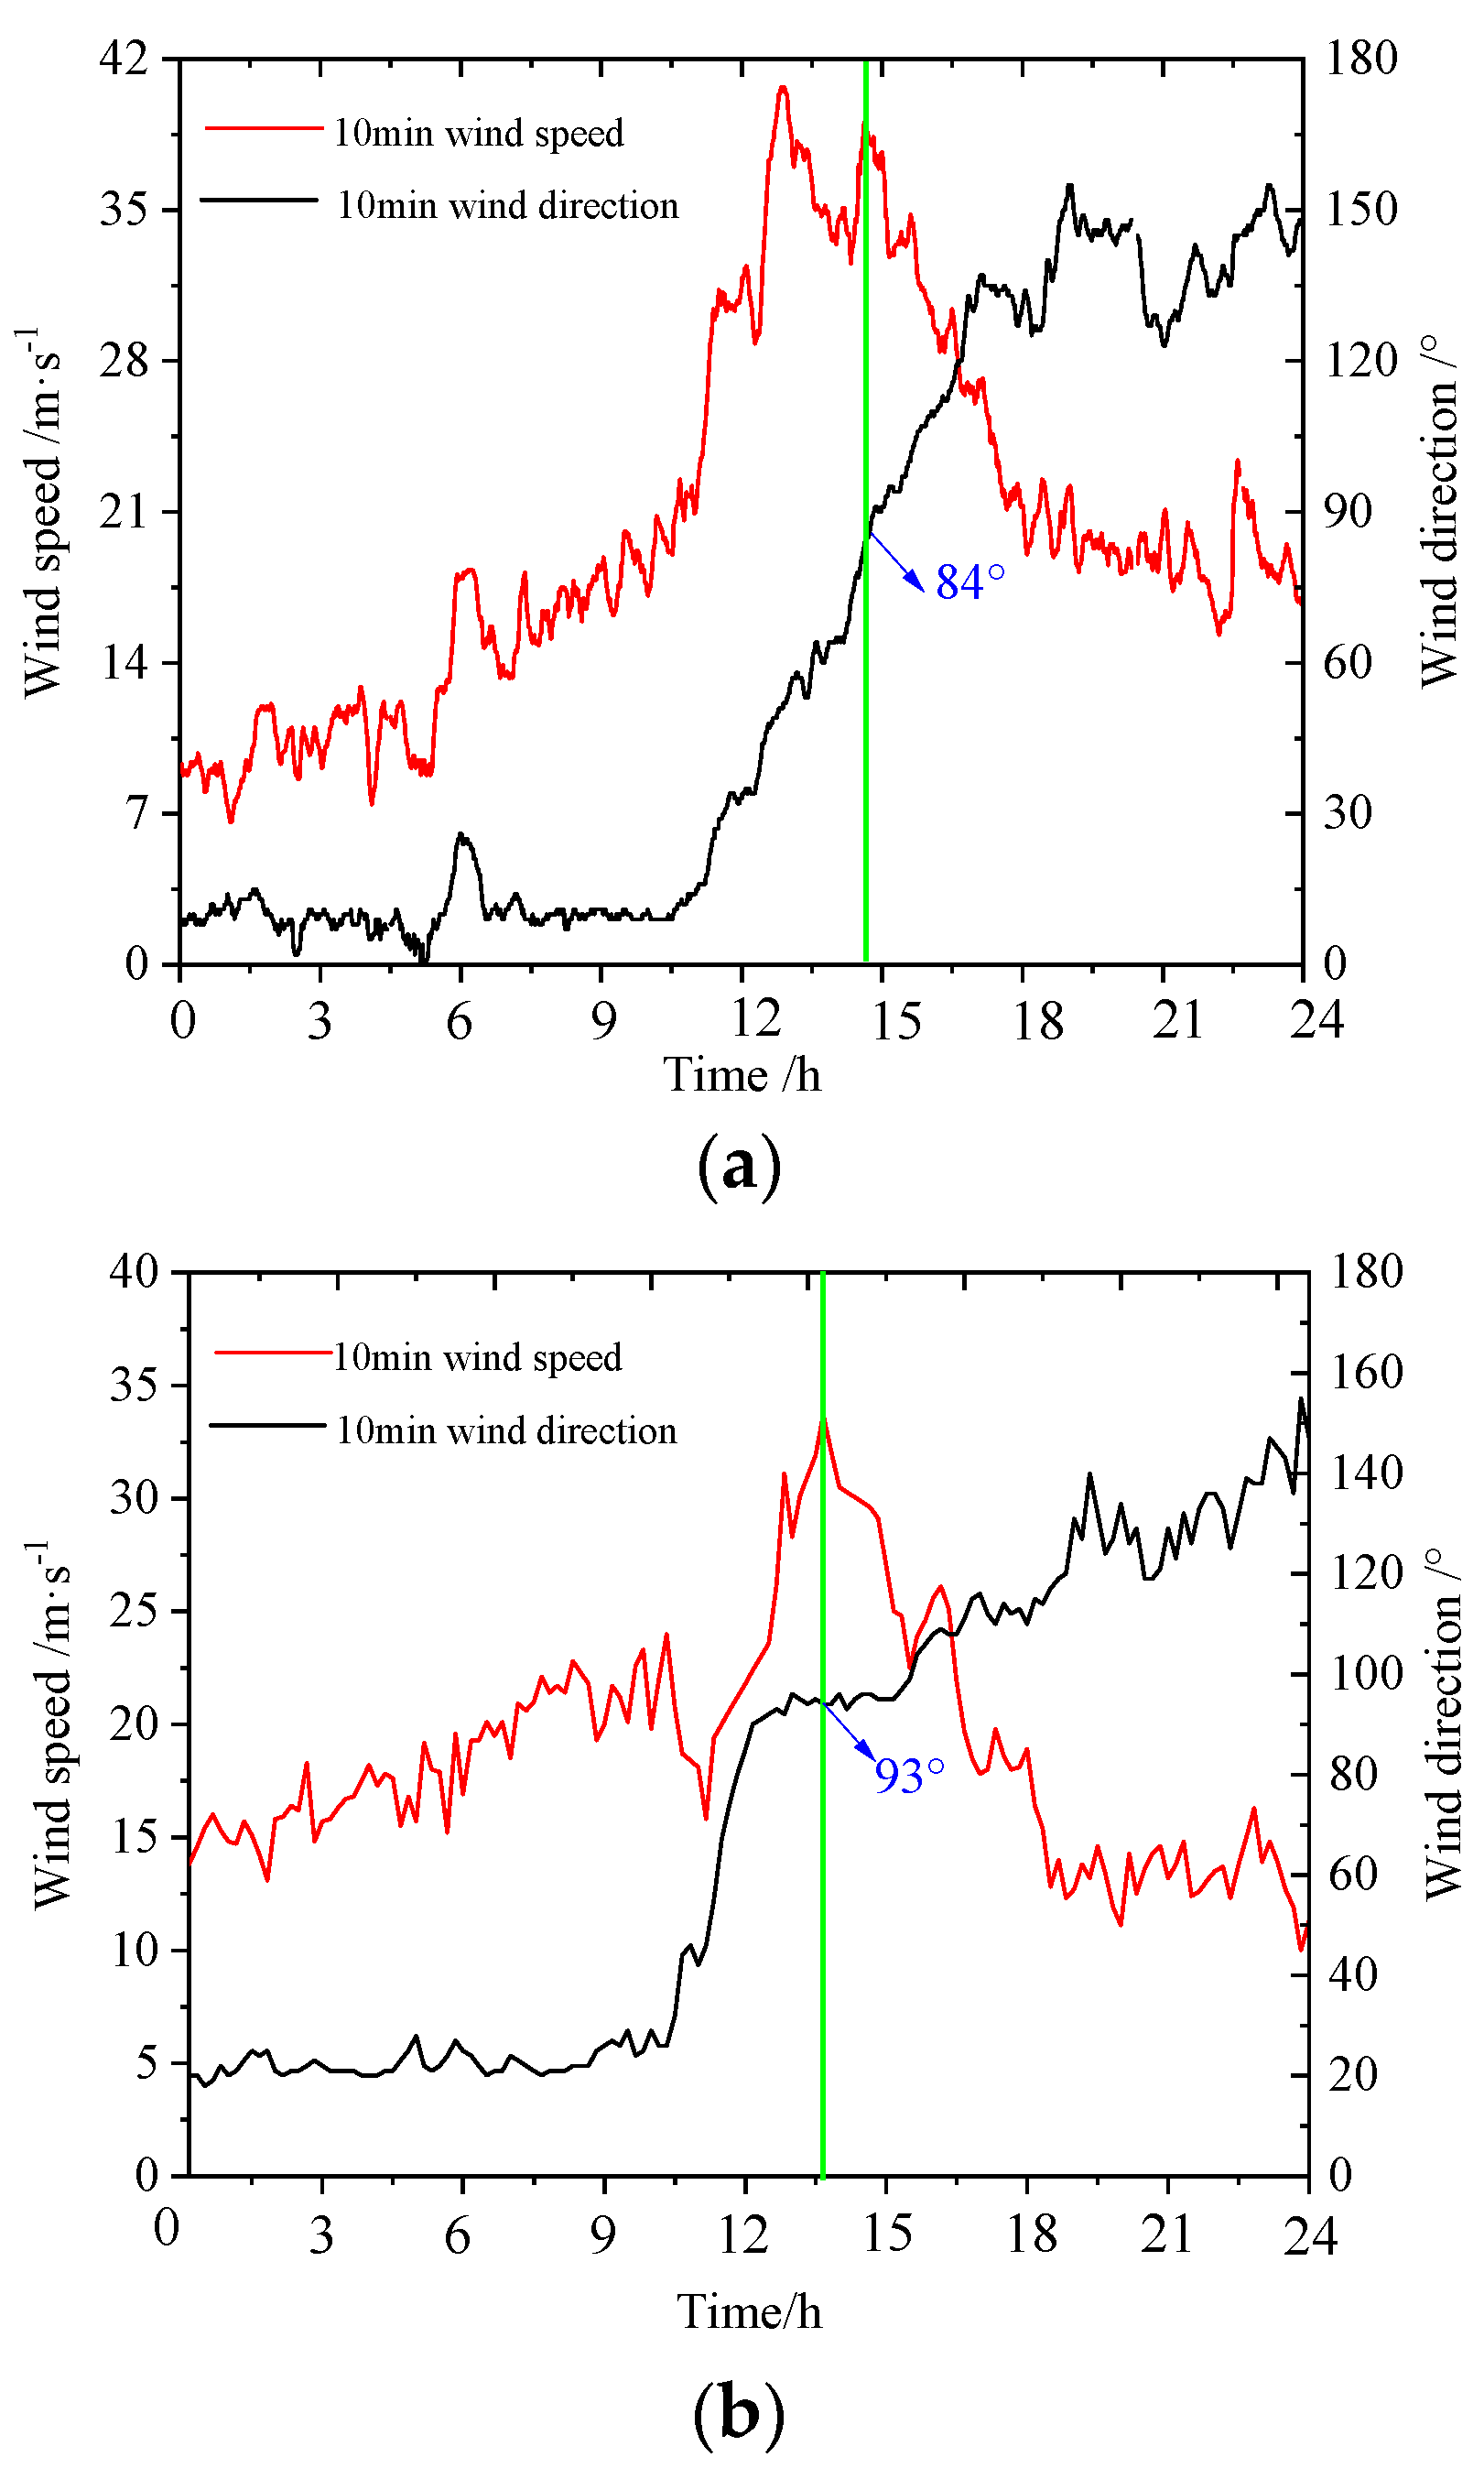
- The CVI results were used to correct the recorded wind speed at the NLDI and PAFC sites during Super Typhoon Manghut; they were converted into the 10 min mean wind pressure value at 10 m height under the standard landform. Hence, the reference wind pressure values calculated were 0.526 and 0.505 kPa. The analogous conversion values achieved the purpose of mutual verification. Meanwhile, the effectiveness and reliability of the methodologies are presented.
Author Contributions
Funding
Institutional Review Board Statement
Informed Consent Statement
Data Availability Statement
Conflicts of Interest
References
- Wang, F.; Chen, X.; He, R.; Liu, Y.; Hao, J.; Li, J. Wind Characteristics in Mountainous Valleys Obtained through Field Measurement. Appl. Sci. 2021, 11, 7717. [Google Scholar] [CrossRef]
- Wang, J.; Li, J.; Wang, F.; Hong, G.; Xing, S. Research on Wind Field Characteristics Measured by Lidar in a U-Shaped Valley at a Bridge Site. Appl. Sci. 2021, 11, 9645. [Google Scholar] [CrossRef]
- Teunissen, H.; Shokr, M.; Bowen, A.; Wood, C.; Green, D. The Askervein Hill Project: Wind-tunnel simulations at three length scales. Bound.-Layer Meteorol. 1987, 40, 1–29. [Google Scholar] [CrossRef]
- Raithby, G.; Stubley, G.; Taylor, P.A. The Askervein hill project: A finite control volume prediction of three-dimensional flows over the hill. Bound.-Layer Meteorol. 1987, 39, 247–267. [Google Scholar] [CrossRef]
- Castro, F.; Palma, J.; Lopes, A. Simulation of the Askervein flow. Part 1: Reynolds averaged Navier-Stokes equations (k-ε turbulence model). Bound.-Layer Meteorol. 2003; 107, 501–530. [Google Scholar]
- Silva Lopes, A.; Palma, J.; Castro, F. Simulation of the Askervein flow. Part 2: Large-eddy simulations. Bound.-Layer Meteorol. 2007, 125, 85–108. [Google Scholar] [CrossRef]
- Moreira, G.; Dos Santos, A.; Do Nascimento, C.; Valle, R. Numerical study of the neutral atmospheric boundary layer over complex terrain. Bound.-Layer Meteorol. 2012, 143, 393–407. [Google Scholar] [CrossRef]
- Flay, R.; King, A.; Revell, M.; Garpenter, P.; Turner, R. Wind speed measurements and predictions over Belmont Hill, Wellington, New Zealand. J. Wind. Eng. Ind. Aerodyn. 2019, 195, 104018. [Google Scholar] [CrossRef]
- AS/NZS1170.2.2011 Australia/New Zealand Standard, Structural Design Actions. Part 2: Wind Actions; Standards Australia International Ltd.: Sydney, Australia; Standards New Zealand: Wellington, New Zealand, 2011.
- Zhang, W.; Liu, M.; Wang, K.; Zhang, F.; Hou, L. Numerical Study on the Gas Leakage and Dispersion at the Street Intersection of a Building Group. Comput. Modeling Eng. Sci. 2020, 123, 1247–1266. [Google Scholar] [CrossRef]
- Janssen, W.; Blocken, B.; van Hooff, T. Pedestrian wind comfort around buildings: Comparison of wind comfort criteria based on whole-flow field data for a complex case study. Build. Environ. 2013, 59, 547–562. [Google Scholar] [CrossRef]
- Blocken, B.; Stathopoulos, T.; van Beeck, J. Pedestrian-level wind conditions around buildings: Review of wind-tunnel and CFD techniques and their accuracy for wind comfort assessment. Build. Environ. 2016, 100, 50–81. [Google Scholar] [CrossRef]
- Li, B.; Luo, Z.; Sandberg, M.; Liu, J. Revisiting the ‘Venturi effect’ in passage ventilation between two non-parallel buildings. Build. Environ. 2015, 94, 714–722. [Google Scholar] [CrossRef]
- Iqbal, Q.; Chan, A. Pedestrian level wind environment assessment around group of high-rise cross-shaped buildings: Effect of building shape, separation and orientation. Build. Environ. 2016, 101, 45–63. [Google Scholar] [CrossRef] [PubMed]
- Jamińska-Gadomska, P.; Lipecki, T.; Pieńko, M.; Podgórski, J. Wind velocity changes along the passage between two angled walls—CFD simulations and full-scale measurements. Build. Environ. 2019, 157, 391–401. [Google Scholar] [CrossRef]
- James Lo, L.; Banks, D.; Novoselac, A. Combined wind tunnel and CFD analysis for indoor airflow prediction of wind-driven cross ventilation. Build. Environ. 2013, 60, 12–23. [Google Scholar] [CrossRef]
- Ramponi, R.; Blocken, B. CFD simulation of cross-ventilation for a generic isolated building: Impact of computational parameters. Build. Environ. 2012, 53, 34–48. [Google Scholar] [CrossRef]
- Zhang, L.L.; Hu, X.Q.; Xie, Z.N.; Shi, B.Q.; Zhang, L.; Wang, R.H. Field measurement study on time-varying characteristics of modal parameters of super high-rise buildings during super typhoon. J. Wind. Eng. Ind. Aerodyn. 2020, 200, 104139. [Google Scholar] [CrossRef]
- Zhou, K.; Li, Q.S.; Li, X. Dynamic Behavior of Supertall Building with Active Control System during Super Typhoon Mangkhut. J. Struct. Eng. 2020, 146, 04020077. [Google Scholar] [CrossRef]
- Cheng, W.; Liu, C. Large-eddy simulation of turbulent transports in urban street canyons in different thermal stabilities. J. Wind. Eng. Ind. Aerodyn. 2011, 99, 434–442. [Google Scholar] [CrossRef] [Green Version]
- Huang, W.; Zhang, X. Wind field simulation over complex terrain under different inflow wind directions. Wind. Struct. 2019, 28, 239–253. [Google Scholar]
- Argyropoulos, C.D.; Markatos, N.C. Recent advances on the numerical modelling of turbulent flows. Appl. Math. Model. 2015, 39, 693–732. [Google Scholar] [CrossRef]
- Yang, Y.; Xie, Z.N.; Gu, M. Consistent inflow boundary conditions for modelling the neutral equilibrium atmospheric boundary layer for the SST k-ω model. Wind. Struct. 2017, 24, 465–480. [Google Scholar] [CrossRef]
- Load Code for the Design of Building Structures, GB 5009-2012; Ministry of Construction: Beijing, China, 2012.
- Vickery, P.; Wadhera, D.; Powell, M.; Chen, Y. A Hurricane boundary layer and wind field model for use in engineering applications. Appl. Meteorol. Climatol. 2009, 48, 381–405. [Google Scholar] [CrossRef]
- Kepert, J. The dynamics of boundary layer jets within the tropical cyclone core. Part I: Linear theory. J. Atmos. Sci. 2001, 58, 2469–2484. [Google Scholar] [CrossRef] [Green Version]
- He, J.Y.; Li, Q.S.; Chan, P.W.; Li, L.; Lu, C.; Zhang, L.; Yang, H.L. Characteristics and Vertical Profiles of Mean Wind and Turbulence for typhoon, Monsoon, and Thunderstorm Winds. J. Struct. Eng. 2021, 147, 04021188. [Google Scholar] [CrossRef]

Publisher’s Note: MDPI stays neutral with regard to jurisdictional claims in published maps and institutional affiliations. |
© 2022 by the authors. Licensee MDPI, Basel, Switzerland. This article is an open access article distributed under the terms and conditions of the Creative Commons Attribution (CC BY) license (https://creativecommons.org/licenses/by/4.0/).
Share and Cite
Duan, J.; Chen, X.; Xie, Z.; Zhang, L. Correction of Field-Measured Wind Speed Affected by Deterministic Interference Factors. Appl. Sci. 2022, 12, 1868. https://doi.org/10.3390/app12041868
Duan J, Chen X, Xie Z, Zhang L. Correction of Field-Measured Wind Speed Affected by Deterministic Interference Factors. Applied Sciences. 2022; 12(4):1868. https://doi.org/10.3390/app12041868
Chicago/Turabian StyleDuan, Jing, Xingyu Chen, Zhuangning Xie, and Lele Zhang. 2022. "Correction of Field-Measured Wind Speed Affected by Deterministic Interference Factors" Applied Sciences 12, no. 4: 1868. https://doi.org/10.3390/app12041868
APA StyleDuan, J., Chen, X., Xie, Z., & Zhang, L. (2022). Correction of Field-Measured Wind Speed Affected by Deterministic Interference Factors. Applied Sciences, 12(4), 1868. https://doi.org/10.3390/app12041868