
A Comparative Assessment of Mid-Water Trawl and Deep Vision for Investigating Fishery Resources in the Coastal Waters off Jeju Island, Korea

 ,
,
Abstract
1. Introduction
2. Materials and Methods
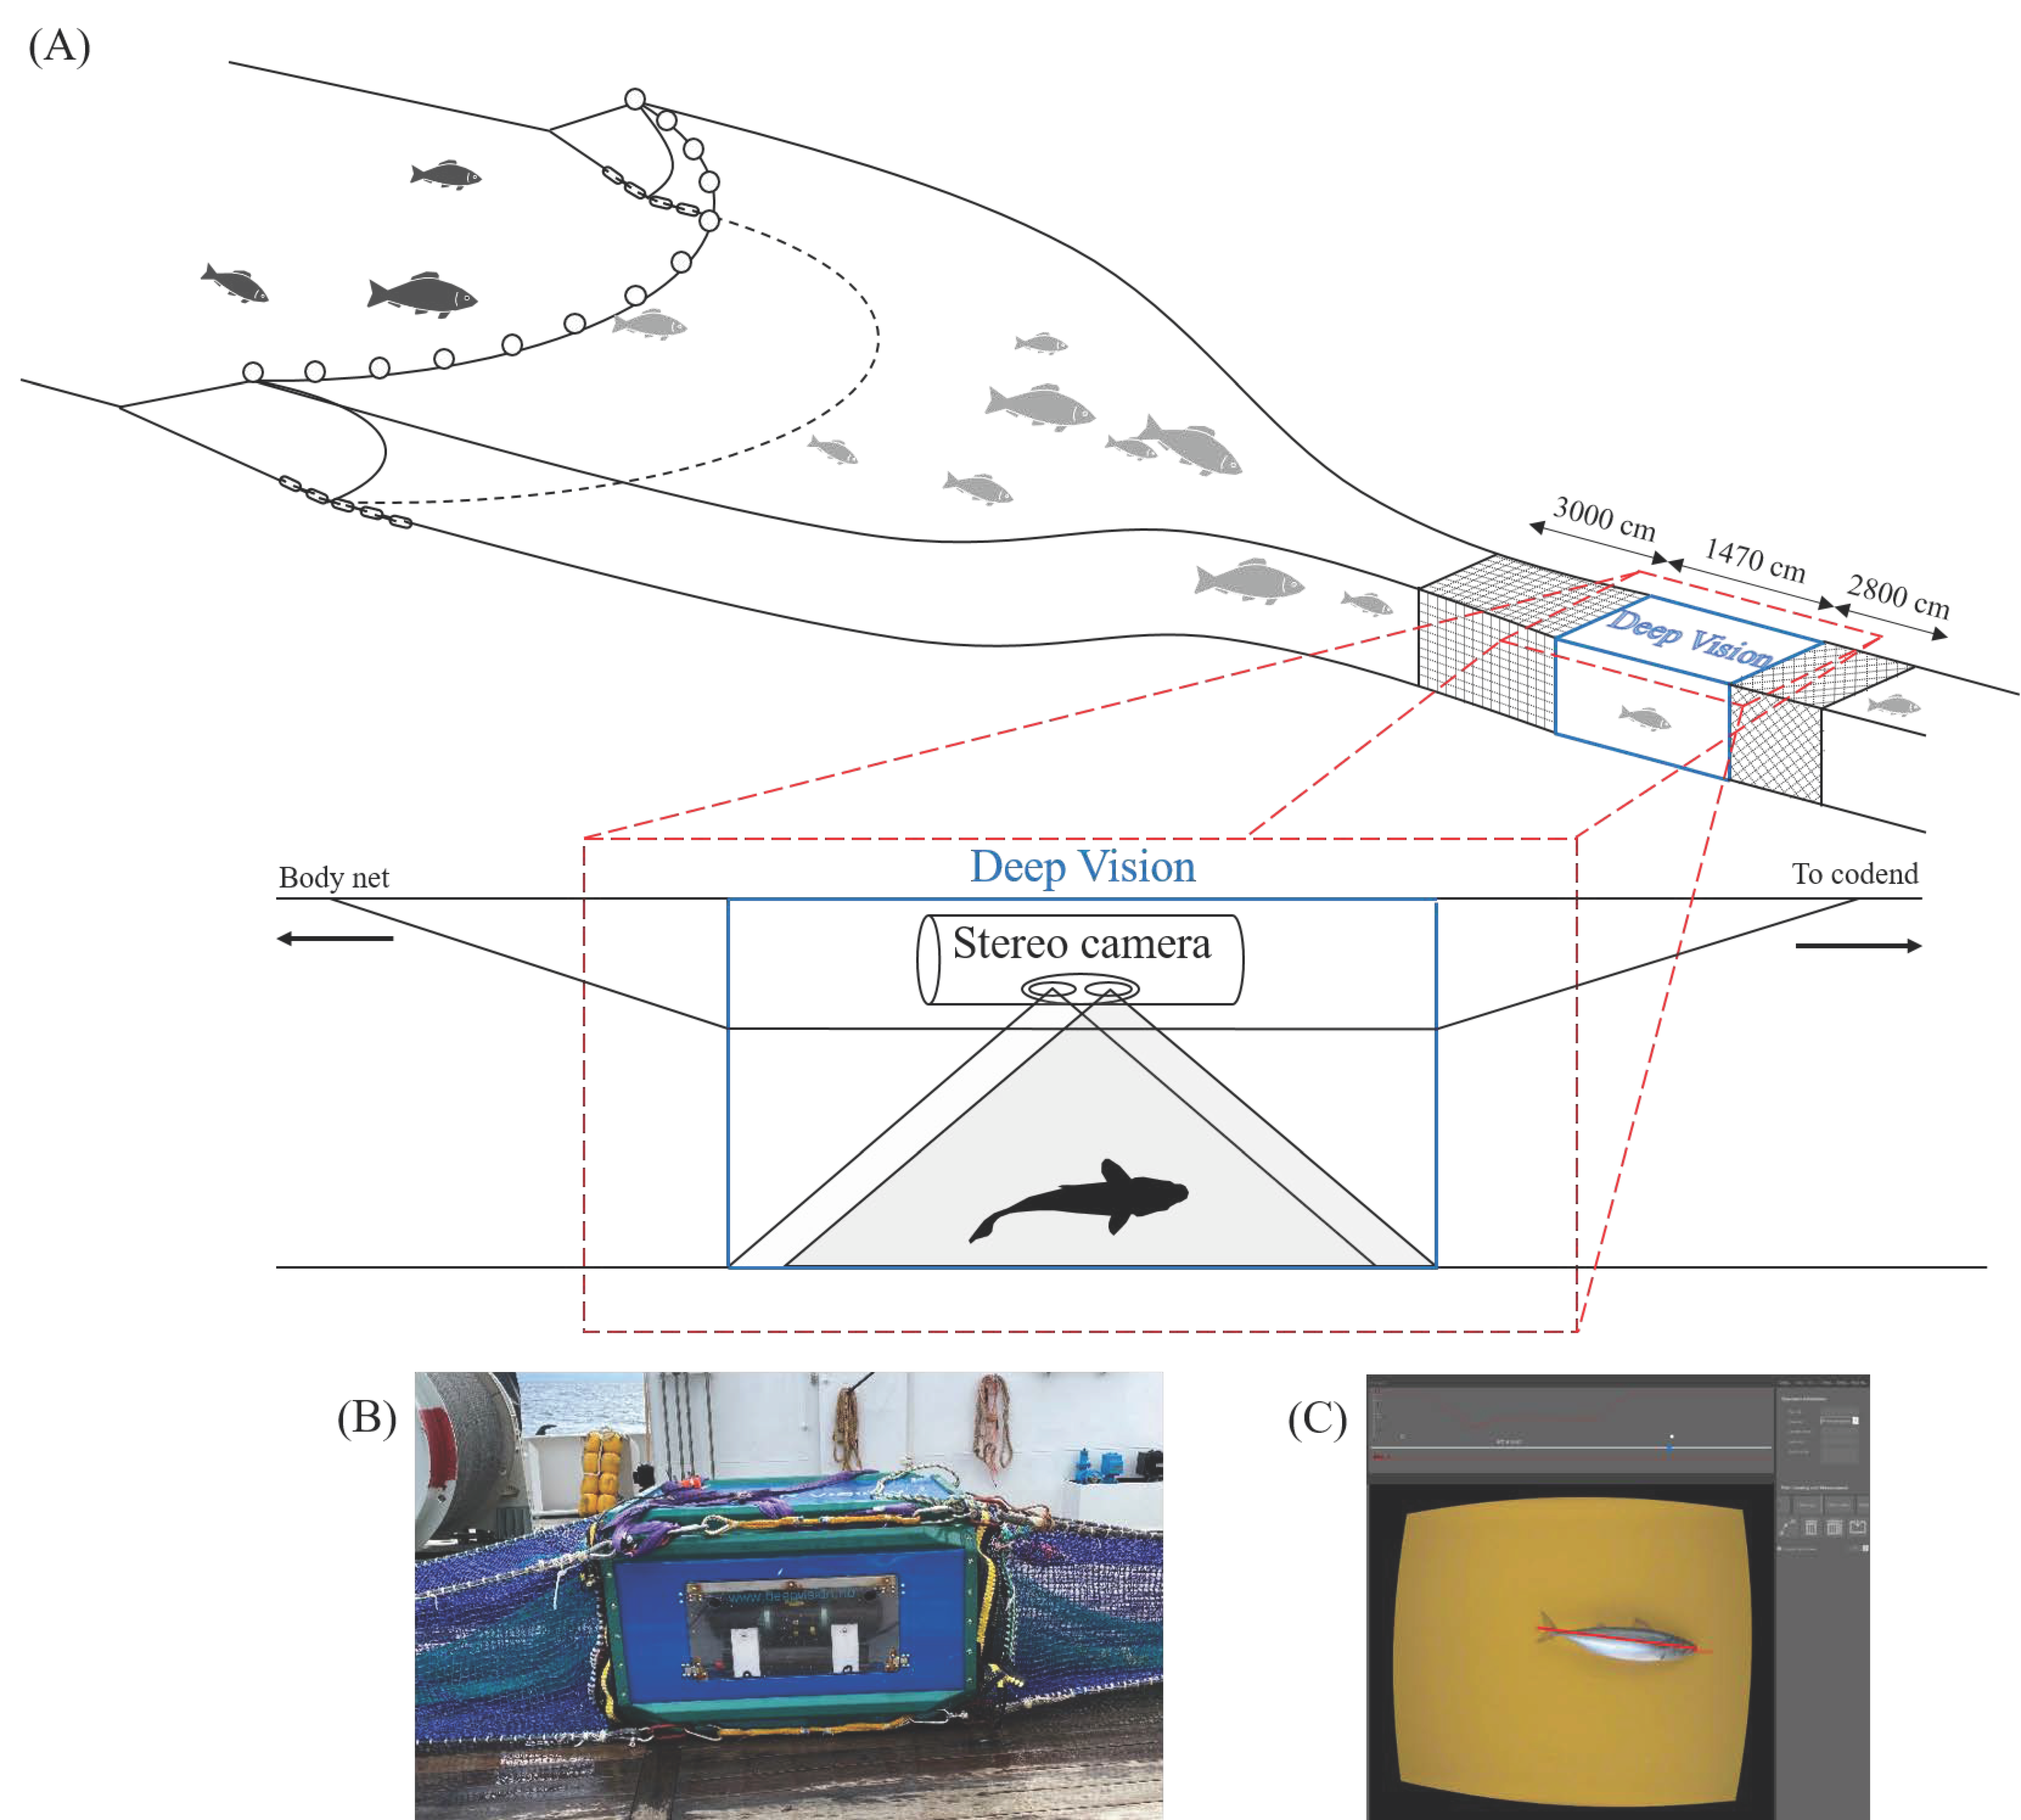
2.1. Measurement Apparatus
2.2. Data Processing
3. Results
4. Discussion
5. Conclusions
Author Contributions
Funding
Informed Consent Statement
Data Availability Statement
Conflicts of Interest
References
- Ole, A.M. Underwater acoustics in marine fisheries and fisheries research. Rev. Fish Biol. Fish. 1997, 7, 1–34. [Google Scholar]
- Zhang, C.I. Fisheries Science Series #1. Marine Fisheries Resources Ecology; Pukyong National University Press: Busan, Korea, 2010; pp. 1–561. [Google Scholar]
- Keller, A.A.; Wallace, J.R.; Horness, B.H.; Hamel, O.S.; Stewart, I.J. Variations in eastern North Pacific demersal fish biomass based on the US west coast groundfish bottom trawl survey (2003–2010). Fish. Bull. 2012, 110, 205–222. [Google Scholar]
- Koslow, J.A.; Kloser, R.J.; Williams, A. Pelagic biomass and community structure over the mid-continental slope off southeastern Australia based upon acoustic and midwater trawl sampling. Mar. Ecol. Prog. Ser. 1997, 146, 21–35. [Google Scholar] [CrossRef]
- Jones, D.T.; Lauffenburger, N.E.; Williams, K.; De Robertis, A. Results of the acoustic trawl survey of walleye pollock (Gadus chalcogrammus) in the Gulf of Alaska, June August 2017 (DY2017-06). AFSC Process. Rep. 2019, 2019, 110. [Google Scholar]
- Nøttestad, L.; Utne, K.R.; Óskarsson, G.J.; Jónsson, S.Þ.; Jacobsen, J.A.; Tangen, Ø.; Anthonypillai, V.; Aanes, S.; Vølstad, J.H.; Bernasconi, M.; et al. Quantifying changes in abundance, biomass, and spatial distribution of Northeast Atlantic mackerel (Scomber scombrus) in the Nordic seas from 2007 to 2014. ICES J. Mar. Sci. 2016, 73, 359–373. [Google Scholar] [CrossRef]
- Simmonds, E.J.; MacLennan, D.N. Fisheries Acoustics: Theory and Practice, 2nd ed.; Blackwell Science: Oxford, UK, 2005; pp. 1–437. [Google Scholar]
- Woillez, M.; Ressler, P.H.; Wilson, C.D.; Horne, J.K. Multifrequency species classification of acoustic-trawl survey data using semi-supervised learning with class discovery. J. Acoust. Soc. Am. 2012, 131, EL184–EL190. [Google Scholar] [CrossRef] [PubMed]
- Kracker, L.M. The geography of fish: The use of remote sensing and spatial analysis tools in fisheries research. Prof. Geogr. 1999, 51, 440–450. [Google Scholar] [CrossRef]
- Jones, J.B. Environmental impact of trawling on the seabed: A review. N. Z. J. Mar. Freshw. Res. 1992, 26, 59–67. [Google Scholar] [CrossRef]
- Brodeur, R.D. Habitat-specific distribution of Pacific ocean perch (Sebastes alutus) in Pribilof Canyon, Bering Sea. Cont. Shelf Res. 2001, 21, 207–224. [Google Scholar] [CrossRef]
- Honda, N.; Watanabe, T. Vertical distribution survey of the giant jellyfish Nemopilema nomurai by an underwater video camera attached to a midwater trawl net. Nippon Suisan Gakkaishi 2007, 73, 1042–1048. [Google Scholar] [CrossRef][Green Version]
- Logan, J.M.; Young, M.A.; Harvey, E.S.; Schimel, A.C.; Ierodiaconou, D. Combining underwater video methods improves effectiveness of demersal fish assemblage surveys across habitats. Mar. Ecol. Prog. Ser. 2017, 582, 181–200. [Google Scholar] [CrossRef]
- Seiler, J.; Williams, A.; Barrett, N. Assessing size, abundance and habitat preferences of the Ocean Perch Helicolenus percoides using a AUV-borne stereo camera system. Fish. Res. 2012, 129, 64–72. [Google Scholar] [CrossRef]
- Rosen, S.; Jörgensen, T.; Hammersland-White, D.; Holst, J.C. Deep Vision: A stereo camera system provides highly accurate counts and lengths of fish passing inside a trawl. Can. J. Fish. Aquat. Sci. 2013, 70, 1456–1467. [Google Scholar] [CrossRef]
- Allken, V.; Rosen, S.; Handegard, N.O.; Malde, K. A real-world dataset and data simulation algorithm for automated fish species identification. Geosci. Data J. 2021, 8, 199–209. [Google Scholar] [CrossRef]
- Rosen, S.; Holst, J.C. Deep Vision in-trawl imaging: Sampling the water column in four dimensions. Fish. Res. 2013, 148, 64–73. [Google Scholar] [CrossRef]
- Underwood, M.J.; Rosen, S.; Engås, A.; Eriksen, E. Deep vision: An in-trawl stereo camera makes a step forward in monitoring the pelagic community. PLoS ONE 2014, 9, e112304. [Google Scholar] [CrossRef]
- Jeong, S.B.; Hwang, D.J.; Kim, Y.J.; Shin, H.H.; Son, Y.U. Species composition of the catches collected by a bottom trawl in the Southern Waters of Korea in summer, 2004. Bull. Korean Soc. Fish. Technol. 2005, 41, 35–45. [Google Scholar]
- Park, Y.; Yoo, J.; Shin, H.H.; Kim, Y.; Kim, D. A Study on fishes caught by trawl survey in West coastal sea area of Je-ju Island. Bull. Fish. Sci. Inst. Chonnam Natl. Univ. 2021, 14, 50–55. [Google Scholar]
- Shin, H.H.; Hwang, D.J.; Kim, Y.J. Studies on the distribution of fisheries resources by bottom trawling in the Yellow Sea. Bull. Korean Soc. Fish. Technol. 2002, 38, 129–139. [Google Scholar]
- Valinassab, T.; Pierce, G.J.; Johannesson, K. Lantern fish (Benthosema pterotum) resources as a target for commercial exploitation in the Oman Sea. J. Appl. Ichthyol. 2007, 23, 573–577. [Google Scholar] [CrossRef]
- Kaeding, A.J.; Ast, J.C.; Pearce, M.M.; Urbanczyk, H.; Kimura, S.; Endo, H.; Nakamura, M.; Dunlap, P.V. Phylogenetic diversity and cosymbiosis in the bioluminescent symbioses of “Photobacterium mandapamensis”. Appl. Environ. Microbiol. 2007, 73, 3173–3182. [Google Scholar] [CrossRef] [PubMed]
- Kim, I.S.; Choi, Y.; Lee, C.L.; Lee, Y.J.; Kim, B.J.; Lim, J.H. Illustrated Book of Korean Fish; Kyo-Hak Publ.: Seoul, Korea, 2005; 615p. [Google Scholar]
- Cha, H.K.; Lee, J.B.; Kang, S.; Chang, D.S.; Choi, J.H. Reproduction of the jack mackerel, Trachurus japonicus Temminck et Schlegel in the coastal waters around Jeju Island, Korea: Maturation and spawning. J. Korean Soc. Fish. Technol. 2009, 45, 243–250. [Google Scholar] [CrossRef]
- Underwood, M.J.; Rosen, S.; Engås, A.; Jørgensen, T.; Fernö, A. Species-specific residence times in the aft part of a pelagic survey trawl: Implications for inference of pre-capture spatial distribution using the Deep Vision system. ICES J. Mar. Sci. 2018, 75, 1393–1404. [Google Scholar] [CrossRef]


| Trawl | Date (YYYY. MM. DD) | Location | Mean Depth (m) | Speed (Knot) | Temperature (°C) (Surface/Bottom) | Salinity (psu) (Surface/Bottom) | |
|---|---|---|---|---|---|---|---|
| Start (Latitude/Longitude) | End (Latitude/Longitude) | ||||||
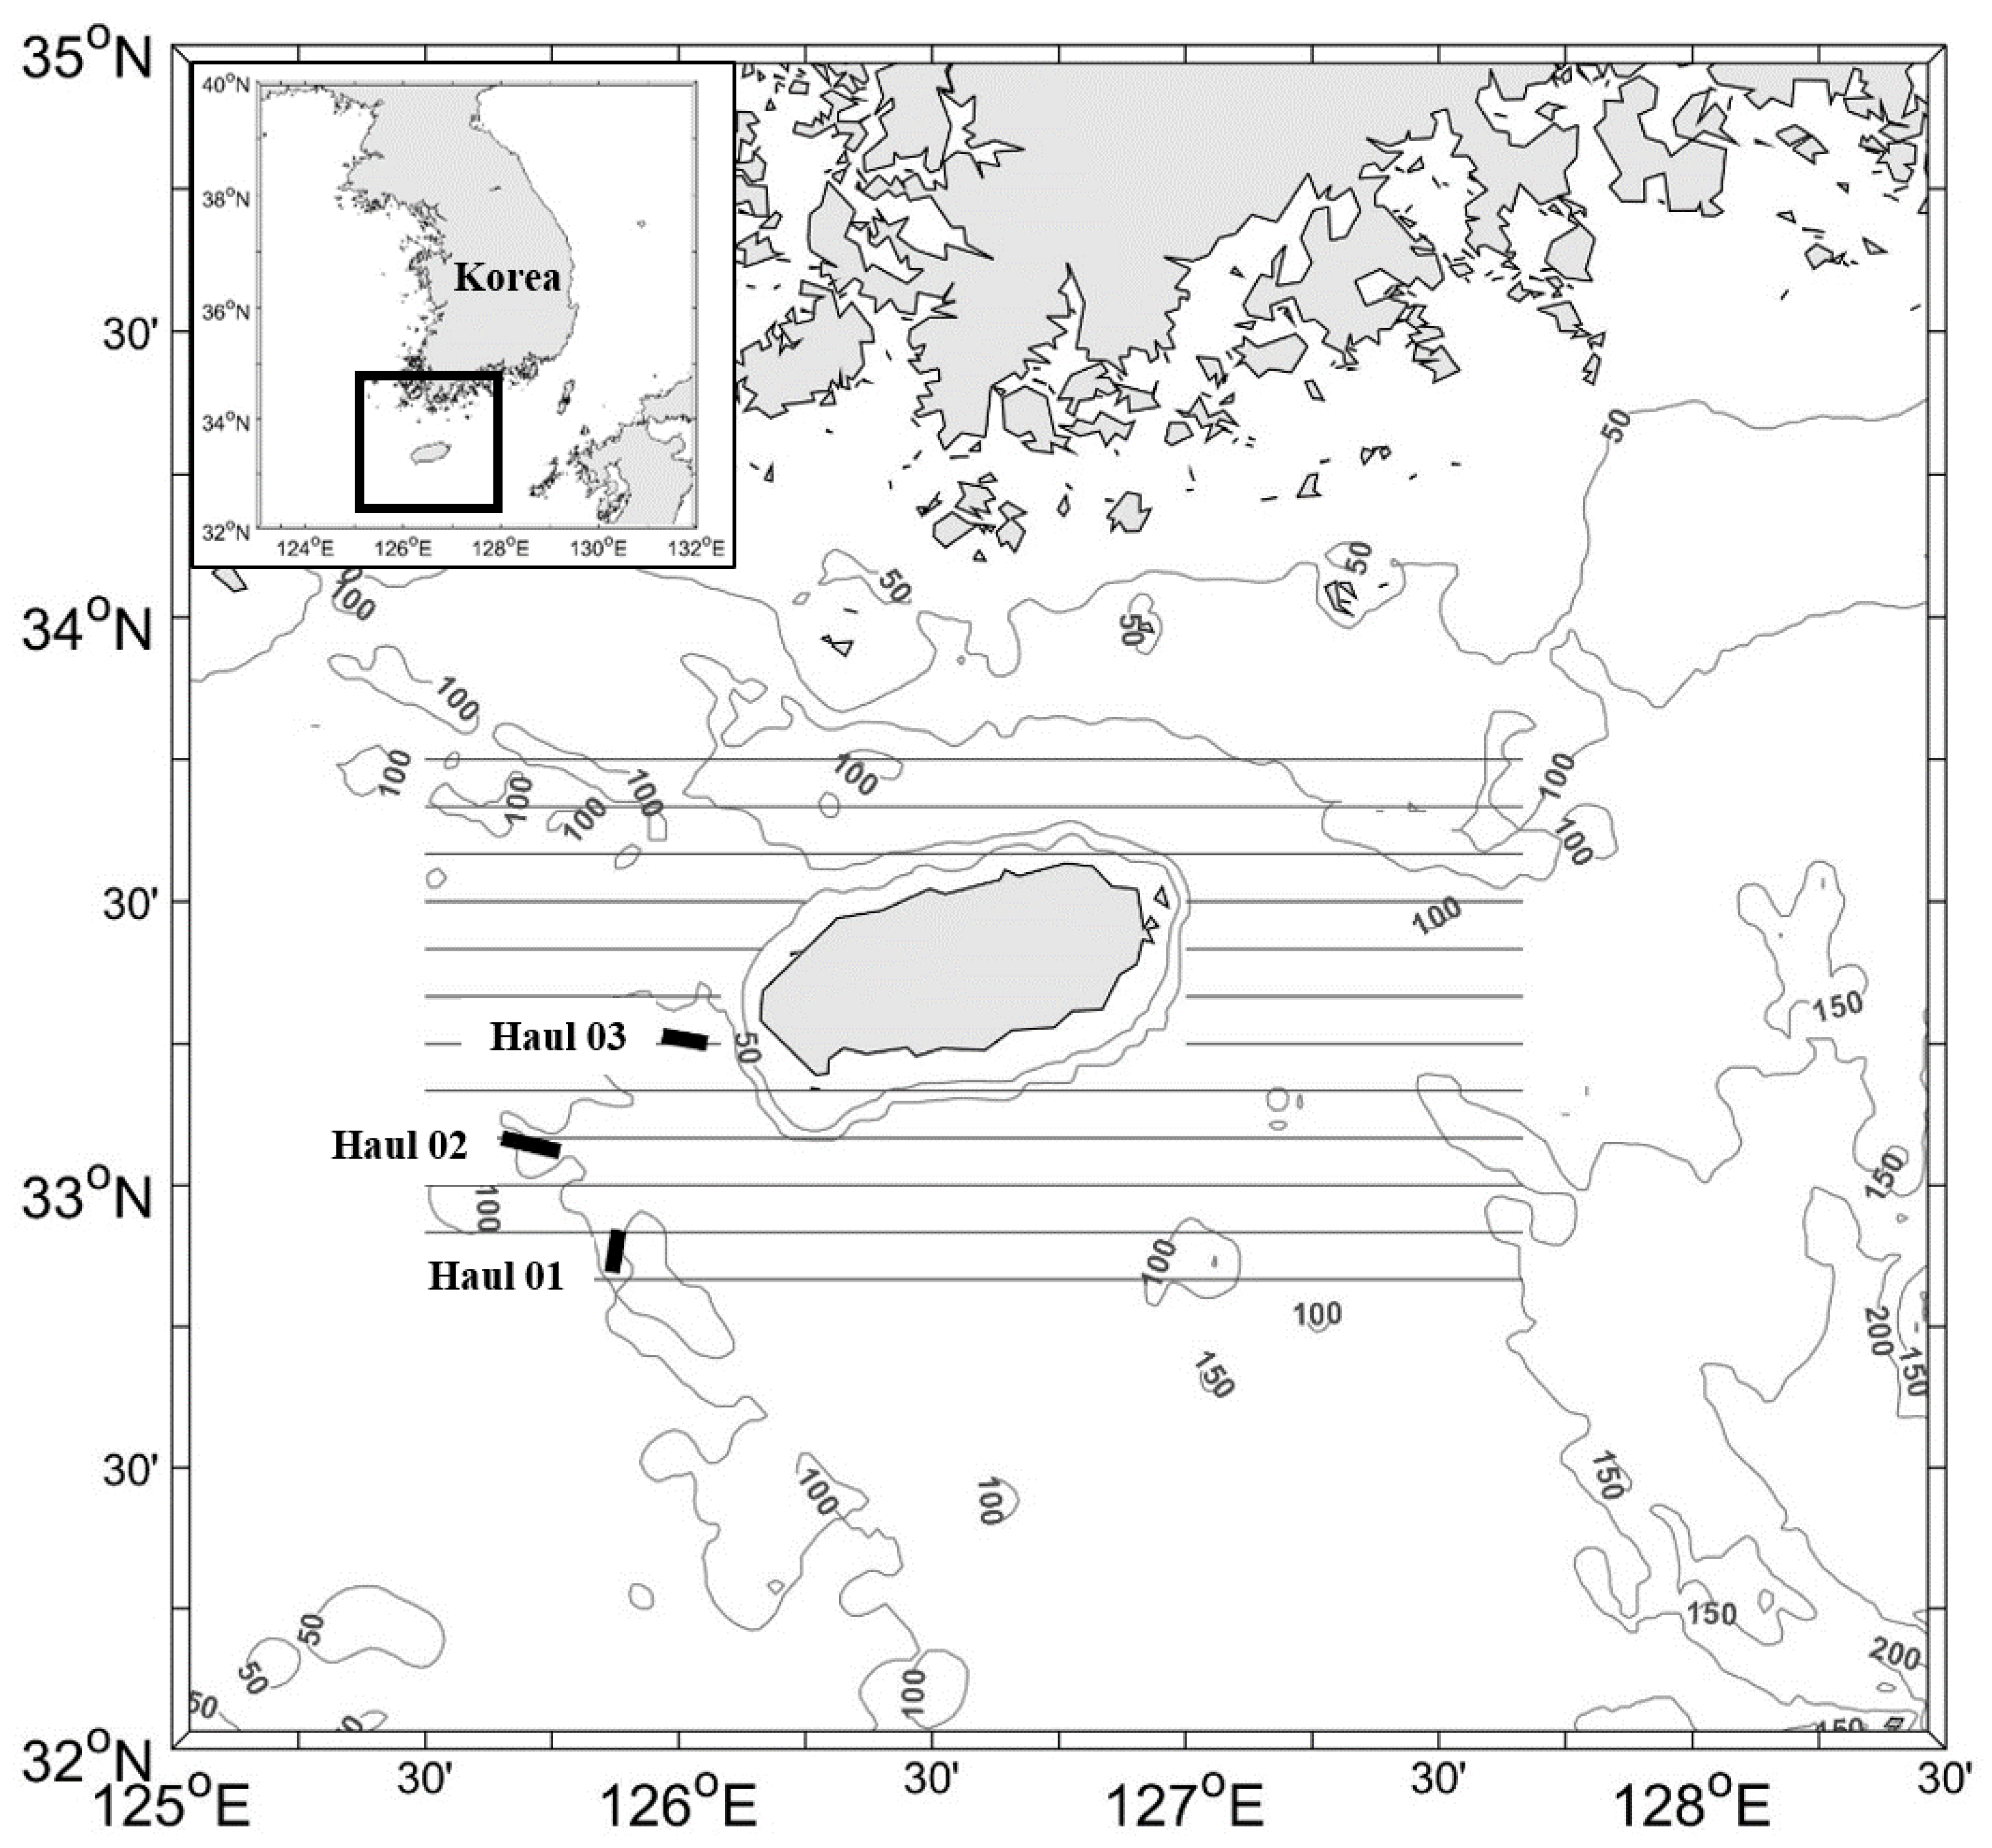
| Haul 01 | 2020. 10. 19. | 32°53.8′/125°52.8′ | 32°51.5′/125°52.4′ | 104.2 | 4.4 | 22.08/16.92 | 32.74/34.40 |
| Haul 02 | 2020. 10. 21. | 33°04.8′/125°41.0′ | 33°04.5′/125°44.4′ | 107.6 | 5.1 | 22.87/16.74 | 33.72/34.55 |
| Haul 03 | 2021. 07. 17. | 33°15.0′/126°02.0′ | 33°15.0′/125°58.6′ | 110.3 | 4.6 | 28.30/14.93 | 27.38/34.05 |
| Haul01 | Haul02 | Haul03 | ||||
|---|---|---|---|---|---|---|
| Species | N | W | N | W | N | W |
| Chub mackerel (Scomber japonicus) | 143 | 28.9 | 6 | 1.1 | ||
| Glowbelly (Acropoma japonicum) | 292 | 0.5 | 310 | 0.4 | ||
| Indian perch (Jaydia lineata) | 1233 | 2.2 | ||||
| Japanese flying squid (Todarodes pacificus) | 7 | 2.5 | ||||
| Japanese jack mackerel (Trachurus japonicus) | 29 | 2.7 | 24 | 3.4 | 1149 | 253.0 |
| John dory (Zeus faber) | 4 | 1.5 | ||||
| Largehead hairtail (Trichiurus lepturus) | 1952 | 158.7 | 6 | 0.7 | 186 | 10.6 |
| Pacific rudderfish (Psenopsis anomala) | 29 | 2.7 | 7 | 0.7 | 4 | 0.1 |
| Sharptooth seabass (Synagrops philippinensis) | 98 | 0.2 | ||||
| Silver pomfret (Pampus argenteus) | 200 | 19.5 | ||||
| Skinnycheek lanternfish (Benthosema pterotum) | 4239 | 4.0 | ||||
| Slender ribbonfish (Trachipterus ishikawae) | 4 | - | ||||
| Spearnose grenadier (Caelorinchus multispinulosus) | 21 | 0.2 | ||||
| Yellow croaker (Larimichthys polyactis) | 2102 | 39.5 | ||||
| Total | 10,240 | 258.9 | 451 | 6.5 | 1354 | 267.7 |
| Number of species | 10 | 6 | 6 | |||
| Counts | Difference | Mean Length (cm) | p-Value | ||||
|---|---|---|---|---|---|---|---|
| Species | Haul | Images | Catch | Images | Catch | ||
| Chub mackerel (Scomber japonicus) | 1 | 1 (1) | 21 (20) | 2000% | 34.4 | 28.4 ± 2.0 | - |
| Chub mackerel (Scomber japonicus) | 2 | 5 (5) | 3 (3) | 67% | 28.3 ± 2.4 | 27.8 ± 1.1 | 0.7147 |
| Glowbelly (Acropoma japonicum) | 1 | 13 (10) | 42 (30) | 223% | 4.2 ± 0.9 | 5.1 ± 0.9 | 0.0111 |
| Glowbelly (Acropoma japonicum) | 2 | 227 (41) | 168 (30) | 35% | 4.6 ± 0.8 | 4.9 ± 0.4 | 0.1656 |
| Indian perch (Jaydia lineata) | 1 | 18 (14) | 177 (30) | 883% | 6.1 ± 1.0 | 5.7 ± 0.5 | 0.1907 |
| Japanese flying squid (Todarodes pacificus) | 3 | 2 (1) | 2 (2) | 0% | 39.8 | 37.6 ± 3.0 | - |
| Japanese jack mackerel (Trachurus japonicus) | 1 | - | 4 (4) | - | - | 20.4 ± 4.6 | - |
| Japanese jack mackerel (Trachurus japonicus) | 2 | 4 (3) | 13 (13) | 225% | 18.1 ± 10.1 | 24.1 ± 1.9 | 0.4884 |
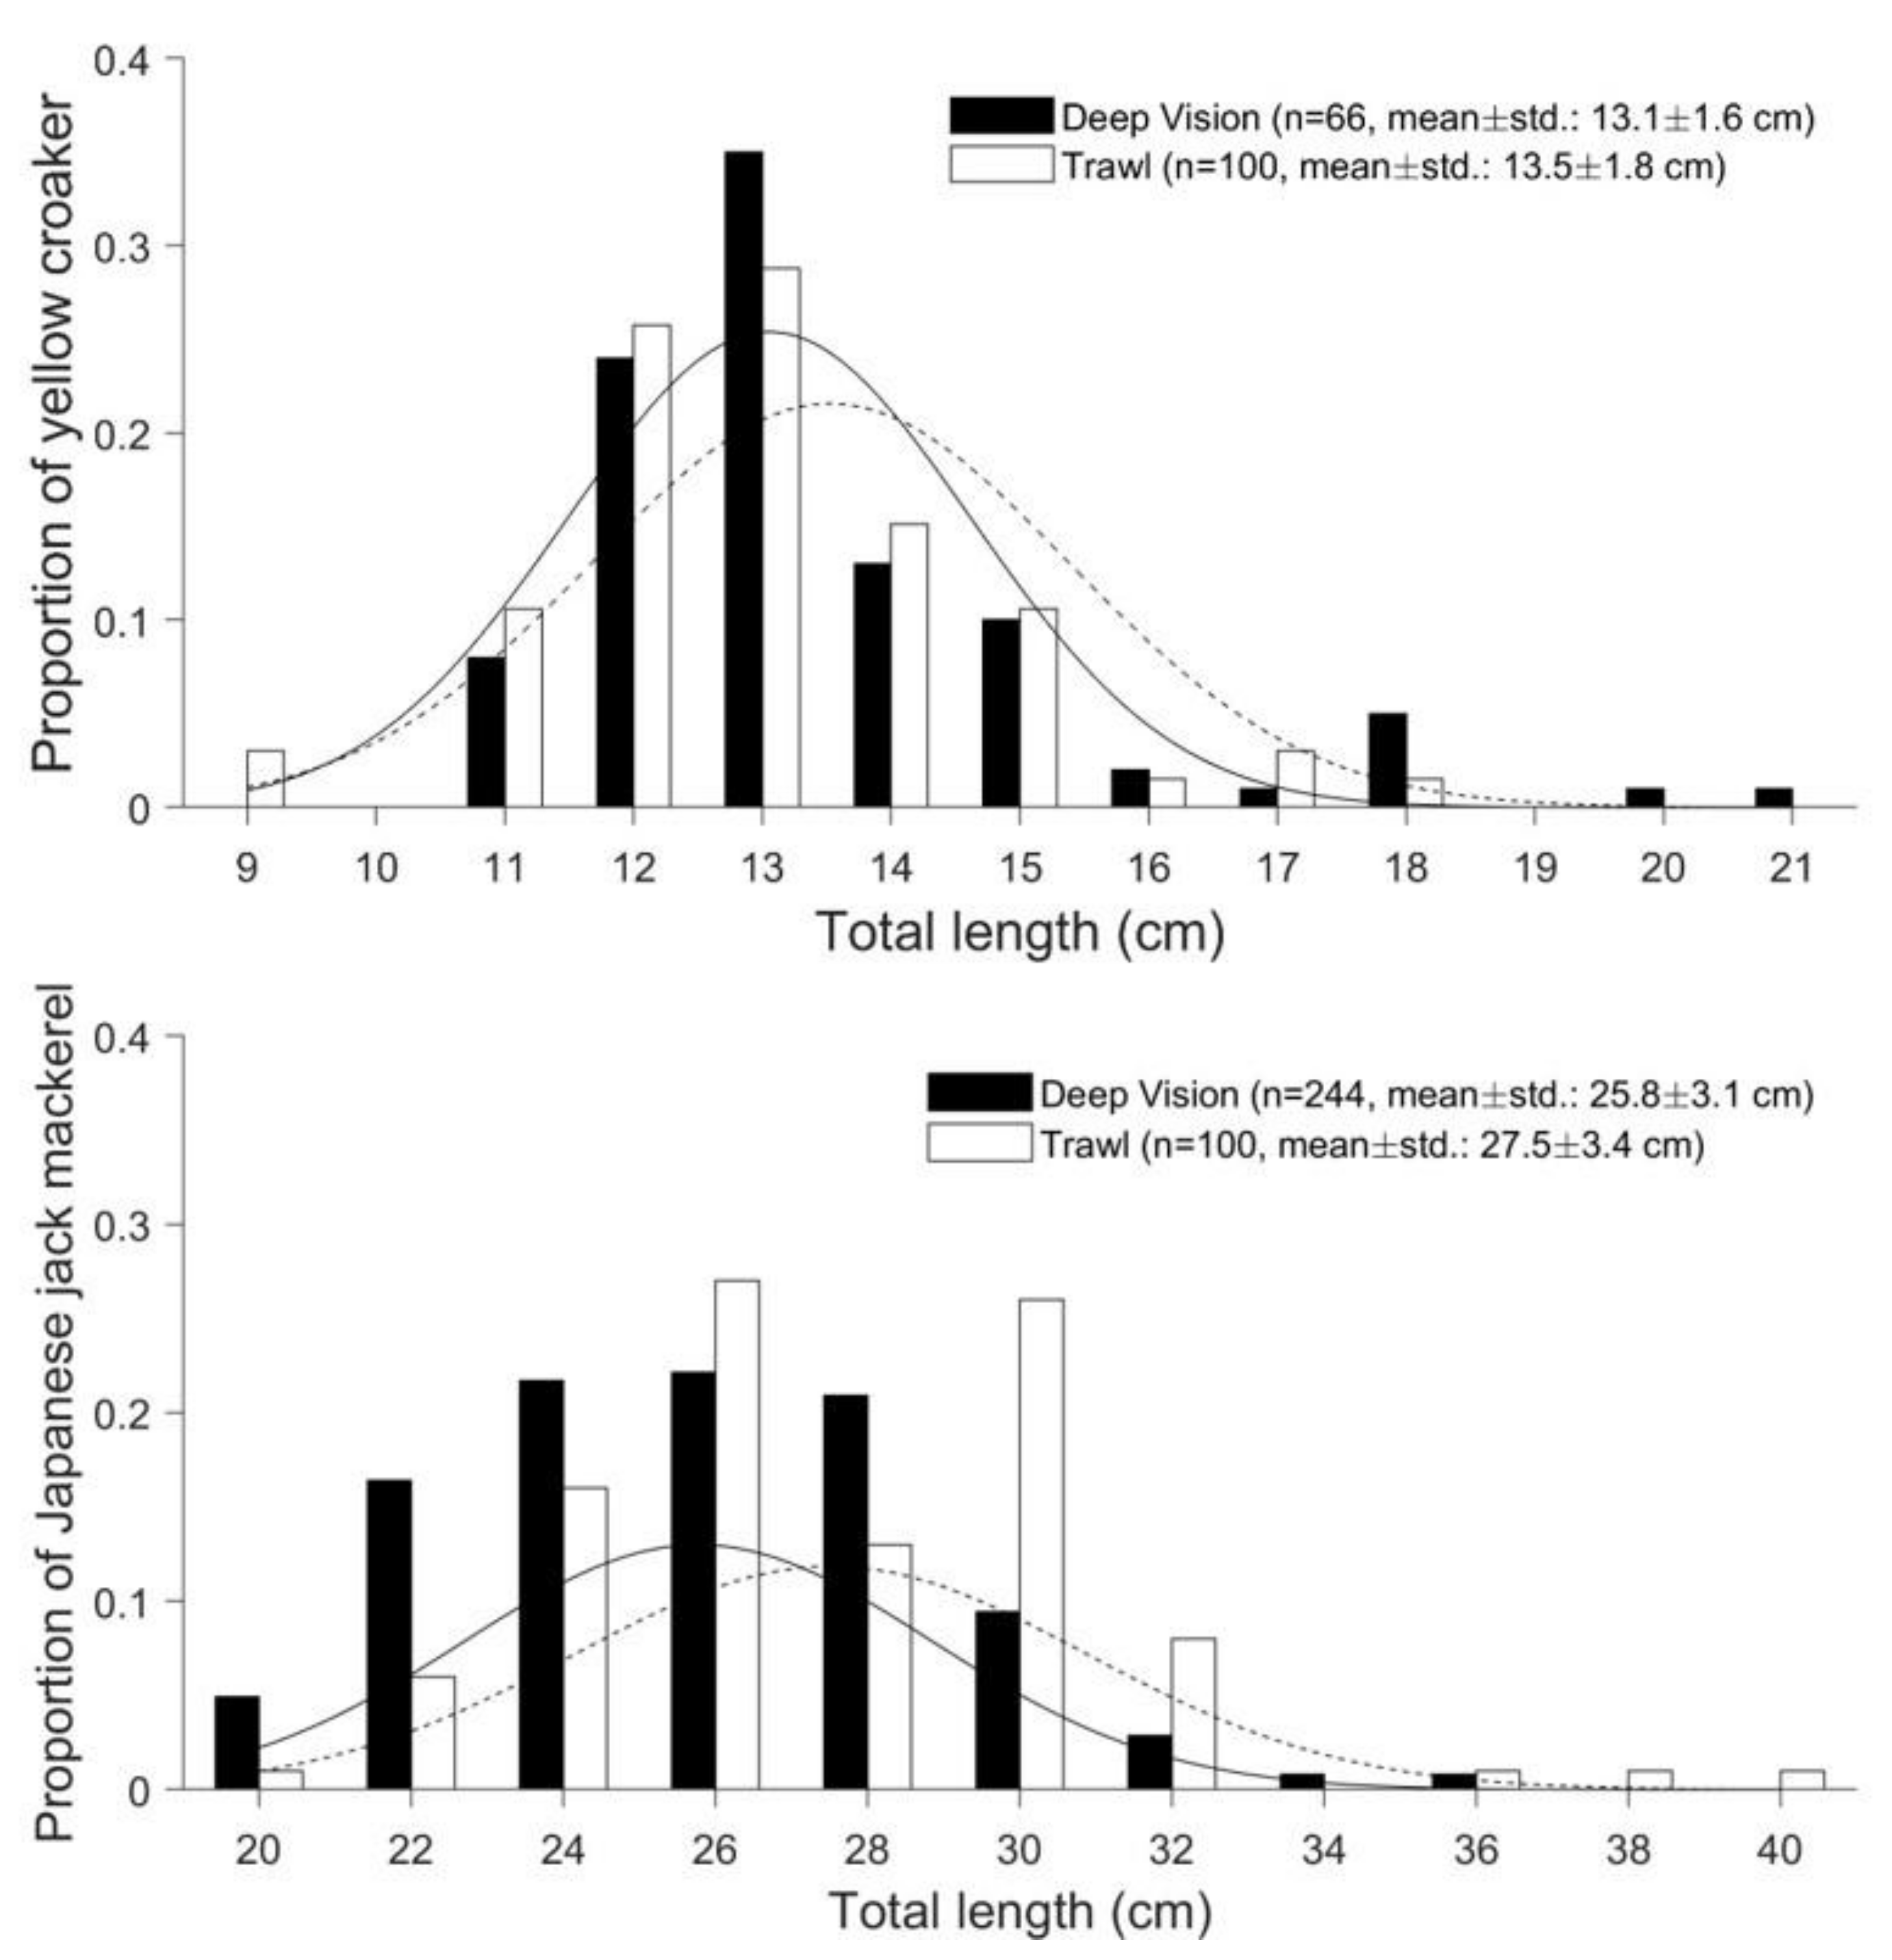
| Japanese jack mackerel (Trachurus japonicus) | 3 | 423 (244) | 327 (100) | 29% | 25.8 ± 3.1 | 27.5 ± 3.3 | 0.0000 |
| John dory (Zeus faber) | 3 | 1 (1) | 1 (1) | 0% | 31.6 | 30.3 | - |
| Largehead hairtail (Trichiurus lepturus) | 1 | 123 (7) | 281 (100) | 128% | 34.3 ± 24.9 | 63 ± 9.5 | 0.0228 |
| Largehead hairtail (Trichiurus lepturus) | 2 | 4 (3) | 3 (3) | 33% | 73.3 ± 16.9 | 55.4 ± 24.8 | 0.3600 |
| Largehead hairtail (Trichiurus lepturus) | 3 | 93 (8) | 53 (53) | 75% | 43.6 ± 10.9 | 50.4 ± 11.5 | 0.1265 |
| Pacific rudderfish (Psenopsis anomala) | 1 | - | 4 (4) | - | - | 18.3 ± 1.4 | - |
| Pacific rudderfish (Psenopsis anomala) | 2 | 2 (2) | 4 (4) | 100% | 19.8 ± 1.56 | 18.5 ± 0.9 | 0.3750 |
| Pacific rudderfish (Psenopsis anomala) | 3 | 1 (1) | 1 (1) | 0% | 8.8 | 9.1 | - |
| Sharptooth seabass (Synagrops philippinensis) | 2 | 37 (16) | 53 (30) | 43% | 5.5 ± 1.1 | 5.7 ± 0.6 | 0.5314 |
| Silver pomfret (Pampus argenteus) | 1 | 8 (5) | 29 (28) | 263% | 18.3 ± 3.6 | 18.3 ± 1.9 | 0.9897 |
| Skinnycheek lanternfish (Benthosema pterotum) | 1 | 33 (5) | 610 (30) | 1748% | 4.6 ±1.1 | 5.2 ± 0.6 | 0.3047 |
| Slender ribbonfish (Trachipterus ishikawae) | 3 | 1 (-) | 1 (-) | 0% | - | - | - |
| Spearnose grenadier (Caelorinchus multispinulosus) | 1 | - | 3 (3) | - | - | 15.3 ± 2.6 | - |
| Yellow croaker (Larimichthys polyactis) | 1 | 87 (66) | 302 (100) | 247% | 13.1 ± 1.6 | 13.5 ± 1.8 | 0.0863 |
Publisher’s Note: MDPI stays neutral with regard to jurisdictional claims in published maps and institutional affiliations. |
© 2022 by the authors. Licensee MDPI, Basel, Switzerland. This article is an open access article distributed under the terms and conditions of the Creative Commons Attribution (CC BY) license (https://creativecommons.org/licenses/by/4.0/).
Share and Cite
Lee, Y.-D.; Lee, H.; Yoon, E.; Park, C.; Osborg, E.S.; Løvall, K. A Comparative Assessment of Mid-Water Trawl and Deep Vision for Investigating Fishery Resources in the Coastal Waters off Jeju Island, Korea. Appl. Sci. 2022, 12, 1835. https://doi.org/10.3390/app12041835
Lee Y-D, Lee H, Yoon E, Park C, Osborg ES, Løvall K. A Comparative Assessment of Mid-Water Trawl and Deep Vision for Investigating Fishery Resources in the Coastal Waters off Jeju Island, Korea. Applied Sciences. 2022; 12(4):1835. https://doi.org/10.3390/app12041835
Chicago/Turabian StyleLee, Yong-Deuk, Hyungbeen Lee, Euna Yoon, Cheol Park, Eirik Svoren Osborg, and Kristoffer Løvall. 2022. "A Comparative Assessment of Mid-Water Trawl and Deep Vision for Investigating Fishery Resources in the Coastal Waters off Jeju Island, Korea" Applied Sciences 12, no. 4: 1835. https://doi.org/10.3390/app12041835
APA StyleLee, Y.-D., Lee, H., Yoon, E., Park, C., Osborg, E. S., & Løvall, K. (2022). A Comparative Assessment of Mid-Water Trawl and Deep Vision for Investigating Fishery Resources in the Coastal Waters off Jeju Island, Korea. Applied Sciences, 12(4), 1835. https://doi.org/10.3390/app12041835