Featured Application
A probabilistic soil–structure interaction analysis according to the new ASCE 4 standard is described on a step-by-step basis. The analysis is carried out on a typical concrete bridge structure. Differences from a deterministic-approach SSI analysis and a typical design model used in the current design practice are highlighted.
Abstract
In current design practice, typical seismic design of bridges tends to use simplified approaches. On the opposite side, the most advanced seismic analyses currently used in practice in all the fields of structural engineering are probably the ones used for the design of nuclear facilities, which include soil–structure interaction and motion incoherency effects. From that category, the most modern methodology is the probabilistic approach, which has been added to the new ASCE 4 standard. This type of state-of-the-art analysis is carried out in ACS SASSI software on a typical concrete bridge structure with deep foundations. A comparison of the results with the deterministic SSI approach and the typical Eurocode design from previous studies is presented at the end. Major differences in behavior are highlighted, which impact the overall safety of the structure.
1. Introduction
Soil–structure interaction refers to the influence that the ground has on the behavior of a structure placed on it, when subjected to different types of loads. For dynamic loading, the behavior of the coupled soil–structure system may suffer major changes from the original “structure on a fixed base” system. The dynamic loads can originate from the building itself (such as machine vibrations) or have an external source (impact loads due to crashes, blast loads, wind, waves, earthquakes and so on). One of the most important loads is the seismic ground motion, which is represented by seismic waves propagating through the soil layers [1].
The degree of effect the dynamic soil–structure interaction will have on a specific situation depends mainly on the dynamic properties of the structure (mass, stiffness and damping), those of the soil (stiffness and damping) [2] and the embedment depth of the structure.
In traditional design approaches, the SSI effects were usually neglected, and the structure was designed with a fixed (or very stiff) base. This would probably be acceptable for light and small structures on relatively stiff soil, such as houses or retaining walls, where there is no loss of coherency across different points of the foundation and a reduced dynamic amplification. The SSI effects on weaker soil become important with heavier and larger structures, such as nuclear facilities, high-rise buildings and large bridges, where the ground motion incoherency and local variations of the soil profile may influence the behavior of the structure to a large degree [1].
A concept that is widely spread in the structural engineering design based on broadened design spectra is that the soil–structure interaction will always have a beneficial effect on the seismic behavior of the structure, due to the increase in the vibration period, which should reduce the seismic accelerations acting on the structure. This has not always been the case for real earthquakes with narrow-band excitation spectra, such as the Vrancea 1977 earthquake for the Bucharest city site. Another example when design recommendations failed is the widely known collapse of the bridge on the Hanshin Expressway, due to the Kobe earthquake, which was the result of neglect at the design stage of the soil–structure interaction and the very important differential seismic wave effects due to the proximity to the fault [3].
On the other hand, if the SSI effects are beneficial on a particular case, overlooking them would lead to an excessively conservative and expensive design [4,5]. The SSI effects may reduce the acceleration, but also introduce the relative displacements that can be detrimental to infrastructures.
In order to obtain the most reliable design, SSI effects have to be included in the analysis through the coupled approach and not through any overly simplified, decoupled approach. Even Eurocode 8 presents a simplified approach for the current design of normal bridges, but it recommends the more complex SSI methodology for detailed analyses on structures of larger importance [6].
One of the cornerstones of the dynamic soil–structure interaction field was the work of the team from the Earthquake Engineering Research Center, Berkeley, California led by J. Lysmer, which developed a novel approach to model the soil–structure interaction phenomena. J. Lysmer’s teamwork [7,8,9,10,11,12] matured in the release of the SASSI program (System for Analysis of Soil–structure Interaction) in 1981 [13]. Continuing to work on the same problems, the Geotechnical Engineering Division from the University of Berkeley released, in 1999, the updated version of the original software, which was now called SASSI 2000 [14].
Other important contributions to the field of seismic soil–structure interaction have been made by Kausel and Roësset [15], Kausel [16,17], Chopra [18], Clough and Chopra [19], Gazetas [20,21] and Mylonakis et al. [22].
Most studies regarding soil–structure interaction have been focused on nuclear structures, which usually have large surface foundations. As the sites for future nuclear power-plants were carefully chosen, deep foundations were never necessary. Thus, the vast majority of SSI studies on pile foundations were looking into different types of structures, most of them being bridges.
M. Novak was one of the first to research the soil–pile interaction problem. He developed an approximate solution for the stiffness and damping of a pile group [23] and an approach to account for soil nonlinearity, slippage and lack of bond by introducing a cylindrical zone around the pile whose shear modulus and material damping are smaller than those of the free-field soil [24,25]. A. Kanya and E. Kausel have studied the dynamic behavior of pile groups embedded in layered semi-infinite media [26] and obtained a formulation based on the soil flexibility matrix, as well as dynamic stiffness and flexibility matrices of the piles; in the same work, a parametrical study was carried out, reaching conclusion regarding the influence of different parameters on the behavior of the pile group. Later, A. Kanya and M. Novak study the harmonic response of piles and pile groups embedded in halfspace to Rayleigh waves and obliquely incident body waves [27]. T. Nogami studied the behavior of pile foundations to vertical vibration [28,29].
On the other side, multiple studies regarding SSI featured experimental approaches, seeking to obtain some kind of confirmation for the large number of theoretical and parametrical studies already available. G. Gazetas and K.H. Stokoe II [30] evaluated the reliability of the impedance functions developed by the same author earlier [21]. R. Boulanger has also conducted a couple of experimental studies with dynamic centrifuge tests with focus on the following different issues: the behavior of liquefiable sand [31], the evaluation of the beam on a nonlinear Winkler foundation model (p-y curves) for piles [32] and the performance of piles in laterally spreading ground [33].
While having a major contribution in the general structural dynamics field [34], J. Penzien has also studied the seismic soil–structure interaction effects for deep foundations, using a hybrid approach, which includes adding a near-field soil volume, modelled with finite elements, to the general SSI approach [35].
The interest in bridge structures for the study of dynamic soil–structure interaction began to rise, due to frequent use of deep foundations and the large size of the structures. J. Lysmer and C.-C. Chin studied the effects a strong earthquake might have on the San Francisco–Oakland Bay Bridge East Crossing [36]. W.S. Tseng and J. Penzien applied the hybrid method for evaluating the soil–structure interaction effects on a bridge structure and even correlated the proposed methodology with the observed dynamic response of a laterally loaded, forced-vibration field test on a full-scale single-pile foundation [37].
Through its California Strong Motion Instrumentation Program (CSMIP), the transportation authority (California Department of Transportation, CALTRANS) managed to instrument multiple bridges across the state, thus obtaining, over the course of multiple years, actual strong motion recordings of real structures. This was a unique opportunity to the engineering community, who had the chance to verify and calibrate their models to real-life recordings of major events. N. Makris studied the soil–structure interaction effects for a bridge foundation on piles with a substructure approach in the time domain and validated the proposed approach to recordings from two of the instrumented bridges [38,39].
A state-of-the-art approach in the engineering field is the probabilistic approach. It offers a way to include all types of uncertainties in the analysis and assess their implications and influence over the whole problem [40]. Even though the probabilistic approach is not that new, with studies going back as far as 40–50 years ago [41,42,43], it started gaining more attention in recent years, due to the wide-scale availability of continually increasing computational power. It should be noted that, starting in 2016, probabilistic methods were introduced in practice for the seismic design of NPP structures, being included and recommended by the ASCE 4-16 standard for the seismic analysis of NPP structures.
Pertinent studies regarding applications of probabilistic approaches to seismic soil–structure interaction are provided by Elkhoraibi et al. [44], Kwon and Elnashai [45] and Ghiocel [46].
The probabilistic analysis is actually a multi-disciplinary tool with applications in the vast majority of engineering fields and at all stages of the projects. For example, probabilistic methods have been used for ground motion monitoring of the Large Hadron Collider (LHC), operated by CERN (European Organization for Nuclear Research) [47,48]. These recordings can be further used to validate and calibrate the design model and approach.
Figure 1 [49] offers an overview of the following uncertainties that may arise in a seismic soil–structure interaction analysis, which should be included in the probabilistic analysis: ground motion variability and variations in the dynamic behavior of the soil and that of the structure.
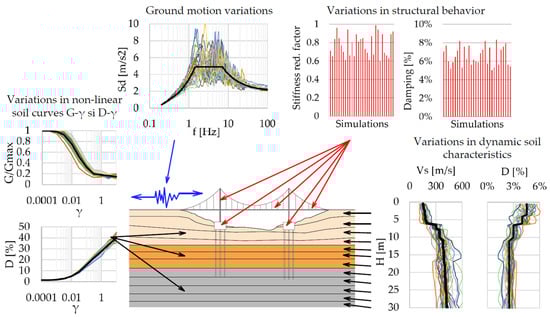
Figure 1.
Overview of a complete probabilistic SSI analysis.
This paper aims to perform a complete probabilistic seismic soil–structure interaction analysis of a highway bridge per ASCE 4-16 [50] recommendations, including motion incoherency effects, with a clear, step-by-step explanation of the probabilistic inputs and outputs.
An element of novelty of the study is the structure being analyzed, which is a typical bridge structure for Romania that is often used throughout the country. The authors have not been able to find similar study where an SSI analysis of such complexity has been per-formed on another bridge structure. The probabilistic results will be compared to the deterministic SSI analysis results, and, with the typical design results, this will highlight both differences between the applied, more sophisticated SSI approach and the simplified design code-based approach [51,52], and between the deterministic and probabilistic approaches.
2. Materials and Methods
2.1. The Structure and Analysis Models
The structure used in the study is a newly constructed 242 m-long bridge located in Romania (Figure 2). The design has been completed according to Eurocode, which became mandatory a couple of years before the bridge’s construction. Figure 2 contains a photo of the bridge.
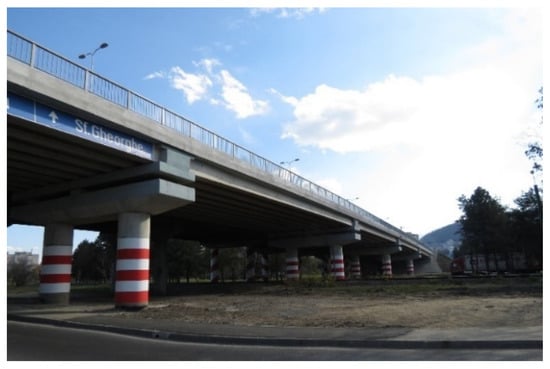
Figure 2.
Fartec bridge in Brasov, Romania.
Figure 3 shows a cross-section of the superstructure with a view of the central pier, which is composed of two circular columns, connected at the top by a rectangular pier cap. The bridge has deep foundations, with 16 m-long bored piles, tied together just below the surface by a 1.75 m-thick pile cap.
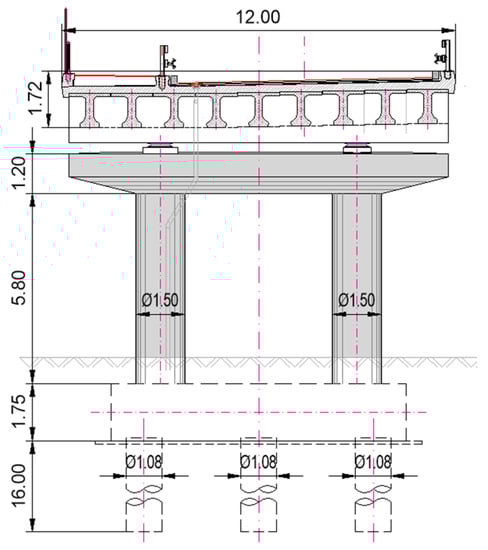
Figure 3.
Superstructure cross section and pier front view [49].
As part of the geotechnical study at the design stage, multiple boreholes were drilled near the future bridge’s foundations. The soil profile at the bridge site is typical for the Brașov basin, with a relatively thin top layer of sand above a thick layer of gravel. Figure 4 contains the soil profile with its main dynamic characteristics as follows: S-wave and P-wave velocity.
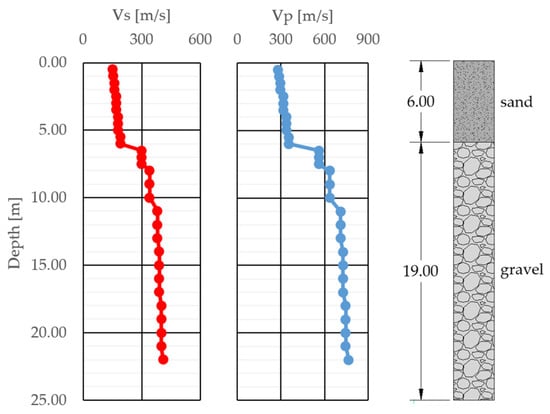
Figure 4.
Soil profile. S-wave and P-wave velocities.
The study focuses mainly on the comparison of the results obtained through a typical design approach versus a sophisticated SSI analysis.
The typical design approach uses industry-standard modelling approaches and the well-known software package CSiBridge. The piles, piers and superstructure girders are modelled as beam elements and the pile cap and superstructure slab as shell elements. The soil–structure interaction along the length of the piles is accounted for by springs of varying stiffness, which increases along with depth. Figure 5 shows a general view of the design model.
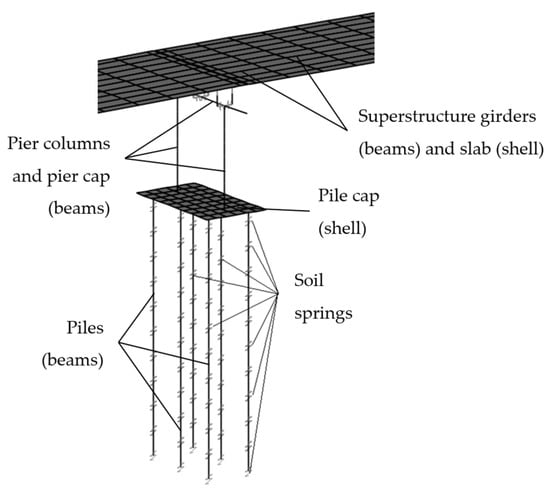
Figure 5.
Typical design finite element model in CSiBridge.
Regarding the modelling of the seismic action, typical design approaches include the application of an equal acceleration across the whole model, irrespective of the size of the structure. Additionally, for bridges longer than 200 m, the following simplified approach for the introduction of an equivalent effect to ground motion spatial variability is presented in Eurocode 8: the introduction of varying static displacements on infrastructure foundations. As highlighted by Figure 6, these displacements can increase in a single direction (Set A) or have sign variations, giving a saw-like result (Set B).
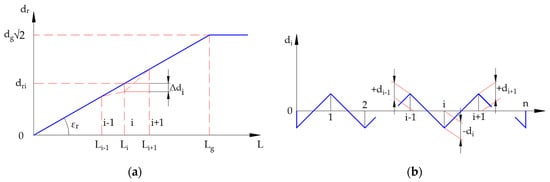
Figure 6.
Simplified models for the ground motion spatial variation effect, as per Eurocode 8 (a) Set A; (b) Set B [6].
The sophisticated SSI analysis is carried out in ACS SASSI, a highly specialized finite element software, that performs soil–structure interaction analysis for structures in contact with the ground (shallow, embedded, deeply embedded or buried). Originally, the software was created for the specific use on nuclear structures, but lately it has also been used for bridges, high-rise buildings, tunnels, etc.
Because of the limited computational capabilities, a single pier has been included, with its corresponding foundation. The corresponding superstructure mass has been concentrated at the top, in its center of gravity.
The finite element model is composed of the following 2 parts: the pier structure itself and the near-field soil volume (Figure 7). For the structural part, the piles and the pile cap are modelled as solid elements and the rest of the structure (that is above the ground) as beam elements. The equivalent mass of the superstructure has been concentrated at the top of the pier, in its center of gravity.
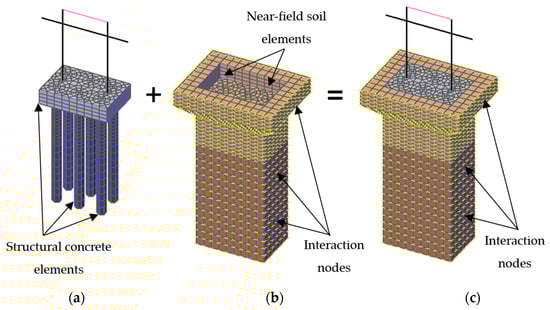
Figure 7.
Finite element model in ACS SASSI: (a) structural model; (b) near-field soil volume; (c) complete model.
Previous studies [49,51,52] highlighted the need include the soil that is in direct contact with the foundation in the model, as solid elements. The characteristics of the soil solid elements are the same as for the layers of free-field soil, at the corresponding depth. The interaction between the FEM model of the structure and the free-field soil layers is accounted for through the interaction nodes, present on the surface of the near-field soil volume and highlighted in Figure 6. The strong nonlinear behavior of the near-field soil has a major influence on the behavior of the pier.
In line with the typical SSI approach [10,13,14,53,54,55], the site is modelled as a multitude of horizontal layers on top of a uniform viscoelastic half-space. The solution is computed in the complex frequency domain, so only linear or linearized behavior is possible. Thus, the nonlinear behavior of the soil is taken into account through the Seed–Idriss equivalent linear model [56], as follows: the increase in displacement generates a reduction in stiffness and an increase in damping; each type of soil has multiple behavior curves that vary by depth. Figure 8 contains the Seed–Idriss behavior curves for sand and gravel, as presented in ASCE 4-16 [50].
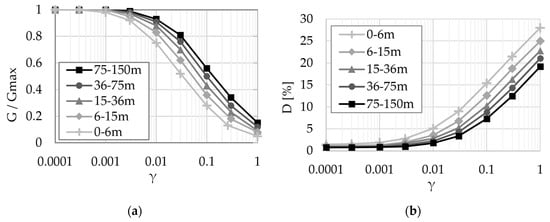
Figure 8.
G-γ and D-γ curves for sand and gravel according to ASCE 4-16; (a) G-γ; (b) D-γ [50].
The usual vertical-propagating wave field is used as follows: SV-waves for the longitudinal direction (X), SH-waves for the transverse direction (Y) and P-waves for the vertical direction (Z). The seismic waves propagate through the free-field soil layers until they reach the surface, which may produce significant changes in the ground motion that actually loads the structure.
The spatial variation of ground motion during a seismic event is influenced by the following 4 main factors, which are also shown in Figure 9 [57]:
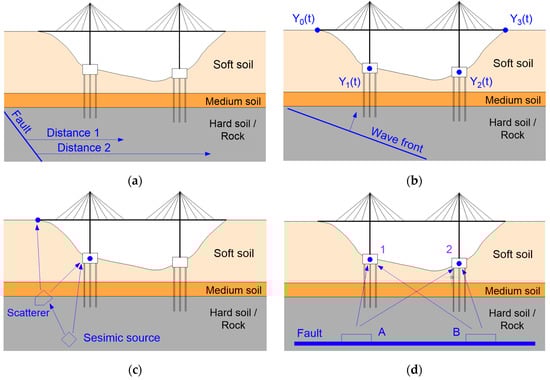
Figure 9.
Sources of spatial variation for seismic ground motion: (a) attenuation effect; (b) wave passage effect; (c) ray-path incoherence effect; (d) extended source effect [57].
- Attenuation effect, due to varying distances from the seismic fault;
- Spatial incoherence effect, which is divided in the following 3 categories:
- ○
- wave passage effect, which refers to the systematical time delays due to the horizontal component of wave incidence;
- ○
- ray-path incoherence effect, which refers to variations in the wave field due to reflections/refractions of the wave in discontinuities or complexities along the ray path;
- ○
- extended source effect, which refers to the mixing of seismic waves from different parts of the fault, for sites close to large earthquakes;
The spatial variation of ground motion or the ground motion incoherency is defined by the one-dimensional coherence function from a homogenous and isotropic Gaussian stochastic field [58]. Abrahamson has generated empirical plane-wave incoherency models for varying soil conditions and foundation types, from seismological data recorded in multiple dense arrays around the world.
This study uses the 2006 Abrahamson model [59], which was generated for soil and rock sites and for shallow and deep foundations. The coherence function is:
where f is the frequency (Hz) and is the separation distance (m). The other coefficients are detailed in Table 1.

Table 1.
Values of coherency function coefficients [59].
Equation (1) leads to the graph shown in Figure 10. The coherency for both horizontal and vertical components decreases with larger separation distances and larger frequencies. Additionally, at frequencies of 40 Hz or higher, the coherency has practically dropped almost to 0.
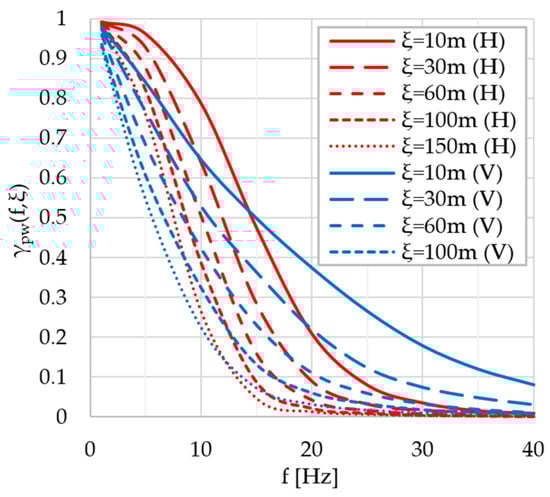
Figure 10.
Plane-wave coherency models—Horizontal and vertical components [59].
2.2. The Probabilistic Approach
As portrayed in Figure 1, the probabilistic modelling should normally include the following:
- Ground motion variations;
- Variations in the dynamic soil characteristics and nonlinear soil behavior curves;
- Structural behavior variations.
The probabilistic simulations use the Latin Hypercube method for a number of 30 simulations.
2.2.1. Ground Motion Variations
The seismic ground motion input is composed of artificially generated spectrum-compatible sets of 3 accelerograms, one for each direction (X, Y and Z).
ASCE 4-16 recommends the following two methods for the generation of the seismic input:
- Method 1 generates spectra with a similar shape, which seem scaled by varying coefficients. The disadvantage of this method is that the frequency content of the resulting spectra and the general shape of the seismic input remains unchanged and only the seismic hazard levels vary. Additionally, a poor variance in spectra peaks is obtained.
- Method 2 generates spectra with a random shape, which do not look like the initial spectra used for the generation. This is a true “probabilistic” approach, as all the generated seismic inputs have large variations in the frequency content, while their mean values still show good compliance with the initial spectra. When generating the artificial accelerograms, a statistical correlation between the spectral amplitudes at different frequencies is considered.
The differences described can be observed in Figure 11, which presents an example for 5 time-histories, using the two methods of generation [49].
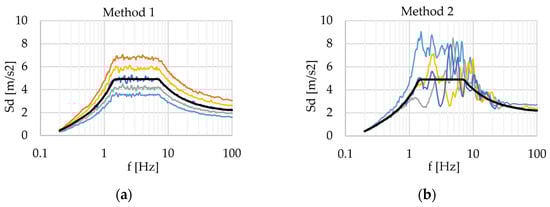
Figure 11.
Example of generated time histories using (a) Method 1 and (b) Method 2.
For the current study, Method 2 was used, as it produces much more realistic accelerograms. The parameters used for the generation of the time histories are as follows:
- Amplitude coefficient of variation: 0.25 (ASCE 4 recommended interval is 0.2–0.3);
- Frequency-independent constant correlation length of 0.70.
Figure 12 shows the spectra for the generated time histories, for each of the following three main directions: X, Y and Z [49].
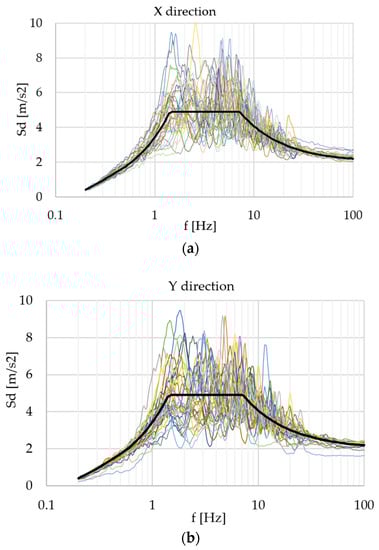
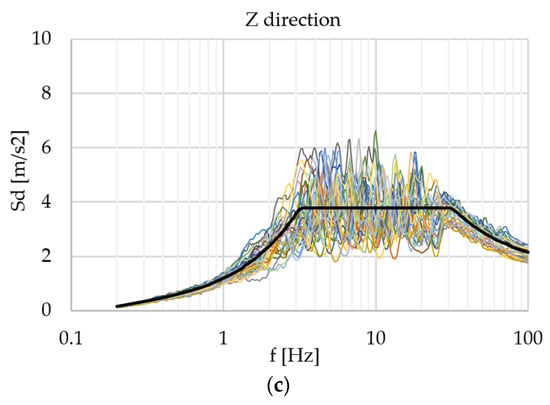
Figure 12.
Response spectra of generated time histories for the three main directions: (a) X; (b) Y; (c) Z.
2.2.2. Dynamic Soil Characteristics and Nonlinear Soil Behavior Curves
The variations in the dynamic soil characteristics can have a major effect on how the structure behaves under seismic loads. For example, if a section of the soil profile at a certain depth is softer, the following two phenomena can occur:
- If the pile forces are mainly generated by the global behavior of the structure (such as rocking), the forces in the piles will increase, because the soil offers a weaker support.
- If the pile forces are generated from local effects, such as local soil pressure or friction due to the seismic ground motion, the pile forces may be reduced, as the soil will apply a smaller force.
The two main dynamic characteristics of the soil are the S-wave velocity (Vs) and damping (D). Due to their soil shear strain dependency, they exhibit negative correlation as follows: damping is large for soft soil and very small for stiff rocks. For the probabilistic approach, the values of Vs and D for each soil layer are a pair of statistically dependent random variables that share the dependency described above.
The soil profile is usually divided in segments of soil or rock with similar properties. Furthermore, each of these segments will be divided into multiple layers, due to the requirements of the site response analysis. The correlation length may be considered constant along such a segment.
In ACS SASSI, the probabilistic Vs and D profiles can be generated using two methods [60]:
- Method 1 uses a single stochastic field as follows: the generated profiles have large variations around the mean value.
- Method 2 uses the following two stochastic fields: a large wavelength, which generates slow-amplitude variation, and a short wavelength with rapid-amplitude variation.
To better understand the differences between the two models, Figure 13 presents an example of just two soil profiles generated using each of the methods described above. For both methods, the inverse variation of Vs and D is highlighted; for larger Vs values, the damping is small and vice versa. Except for extreme situations, which would have been highlighted by the geological and geotechnical studies, the variations in soil properties from Method 1 are too large and sharp, making them unlikely to happen in reality. On the other hand, Method 2 produces very realistic profiles, with variations similar to those found in usual geotechnical studies.
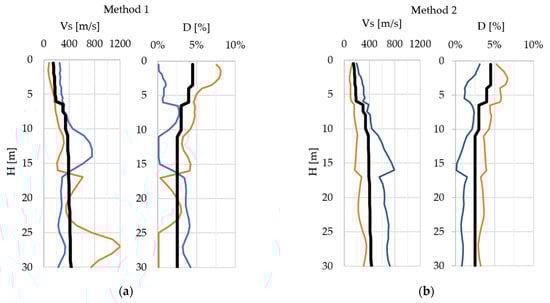
Figure 13.
Example of generated soil profiles using (a) Method 1 and (b) Method 2.
For the present study, Method 2 with a lognormal distribution has been used. The soil profile has been divided in the following 3 segments:
- 0–6 m: sand;
- 6–15 m: gravel;
- 15–30 m: gravel.
The choice of segment length depends on the intervals where a relevant change in soil behavior actually happens:
- The limit between the sand and gravel layers is at a depth of 6 m;
- The Seed–Idriss soil behavior curves (Figure 6) are also defined in intervals; the limit between the second and third interval is at a depth of 15 m, which falls inside the very thick gravel layer and divides it in two segments.
The parameters used for the generation of the soil profiles (coefficients of variation and correlation lengths) are summarized in Table 2.
Table 2.
Probabilistic Vs and D profile generation parameters [49].
Figure 14 shows the generated Vs and D profiles, along with the initial (mean) value.
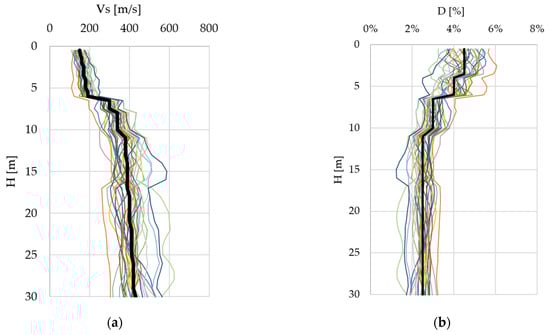
Figure 14.
Probabilistic soil properties profiles: (a) soil S-wave velocity profile 1; (b) soil damping profile.
The G-γ and D-γ linear-equivalent soil behavior curves are each generated using a one-dimensional random field, with large correlation lengths (slow variations) [55]. The Seed–Idriss curves (Figure 6) are used as the base (mean) values, along with the parameters from Table 3.
Table 3.
Probabilistic G-γ and D-γ curve generation parameters [49].
Additionally, a trapezoidal function is used for the application of the coefficients of variation, in order to get the maximum variation in the mid portion of the curve (shear strains between 0.003 and 0.3) and small variations at the beginning and end of the relevant shear strain interval (before 0.001 and after 1). The generated curves are presented in Figure 15 [49].
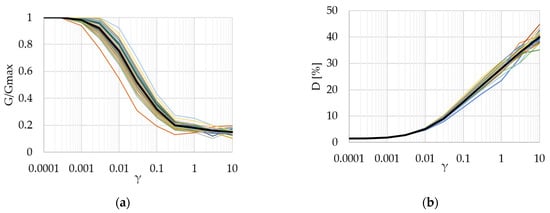
Figure 15.
Probabilistic linear-equivalent soil behavior curves: (a) G-γ; (b) D-γ.
2.2.3. Structural Behavior Variations
In order to keep the study focused on the soil–structure interaction effects and only highlight its influence on the behavior of the structure, no variations were introduced in the structural element properties themselves.
3. Results
In order to highlight the differences between them, the probabilistic approach model will be compared to two other models as follows:
- The same SSI model that has been analyzed through a deterministic approach (the model definitions and material are the ones used as base/mean values for the probabilistic approach);
- The Eurocode bridge design model, using the typical simplified design methods, that are currently used in practice.
The comparison features two main parameters of interest for the bridge designer:
- The response spectrum at superstructure level;
- Internal forces for piles and piers.
According to ASCE 4-16, the probabilistic SSI response corresponding to the 80% non-exceedance probability level should be considered for the design of the structure [50]. The probability curves will be generated for that level, using a log-normal distribution.
3.1. Response Spectrum at Superstructure Level
Figure 16, Figure 17 and Figure 18 contain the response spectrum for each of the 3 main directions and for each analysis/model:
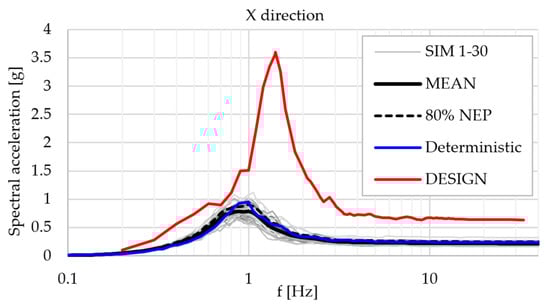
Figure 16.
Acceleration response spectrum at superstructure level-X direction.
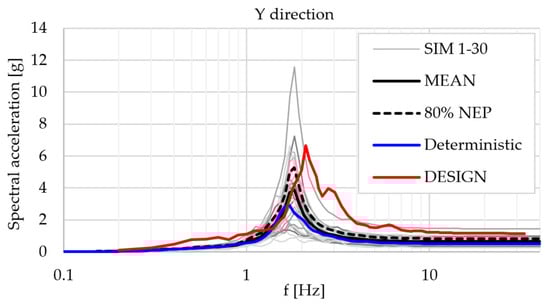
Figure 17.
Acceleration response spectrum at superstructure level-Y direction.
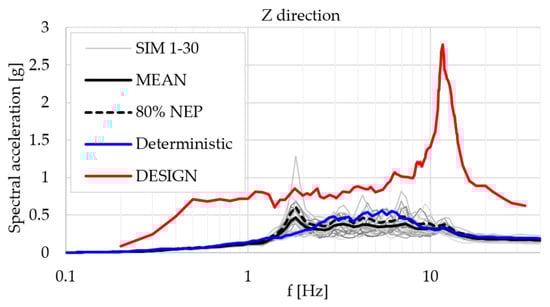
Figure 18.
Acceleration response spectrum at superstructure level-Z direction.
- The 30 probabilistic simulations and the computed mean/80% NEP curves;
- The deterministic model analysis curve;
- The EC design model curve.
Table 4 contains the spectral acceleration and frequency for the peaks of the acceleration response spectrum for each of the three models presented below:
Table 4.
Peak values of acceleration response spectrum.
The response spectrum graphs show large differences in behavior between the usual design model used in the current engineering practice and the SSI models. Typically, the design model overestimates the seismic response of the superstructure, even by as much as 3.5 times for the X direction (along the bridge superstructure axis). Due to this very large acceleration value, the behavior of the structure for the design model will be governed by a large rocking motion of the pier, generated by the superstructure motion in the horizontal direction, while the foundations remain relatively static. This is actually in perfect agreement with the general seismic behavior as it is generally understood by the engineering community. Still, the sophisticated SSI analyses show exactly the opposite, as follows: the ground motion is applied from the ground up and the behavior of the structure is quite chaotic; it is not governed solely by the superstructure displacement. For the vertical direction Z, the design model overestimates the superstructure response across the whole frequency range.
Overall, the design model generates a stronger structural response than the SSI analyses, for both the deterministic and probabilistic approach.
Regarding the probabilistic SSI model, for the X direction, a good agreement with the deterministic analysis is obtained, with only minor differences between them. For the Y direction, the shape of the graphs is similar; the main peaks show a small frequency shift, but a big difference in amplitude, as follows: the probabilistic model generates a 1.7 times stronger structural response. This means that the probabilistic model manages to point out a “weak point” in the structure, where the deterministic model actually underestimates the structural response.
For the vertical direction, the deterministic model misses a peak which can be found in multiple probabilistic simulations and is statistically relevant.
3.2. Internal Forces of the Main Structural Components
Figure 19, Figure 20 and Figure 21 contain the internal forces (axial forces and bending moments) for each of the following models: probabilistic, deterministic and design models.
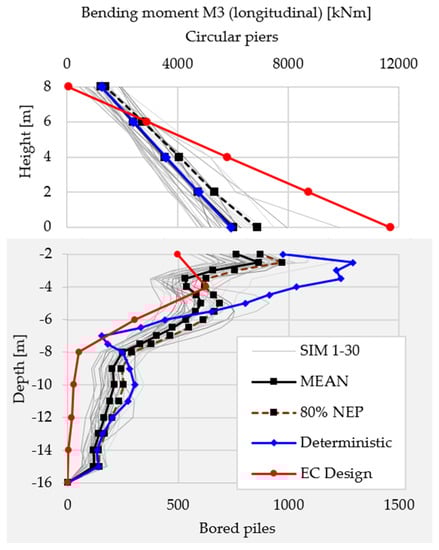
Figure 19.
Bending moment M3 (longitudinal) diagram for pier and bored piles.
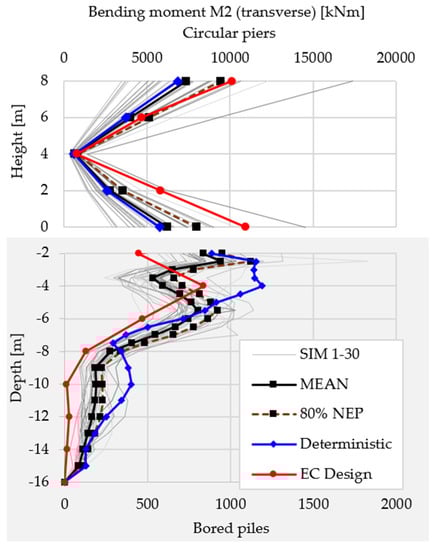
Figure 20.
Bending moment M2 (transverse) diagram for pier and bored piles.
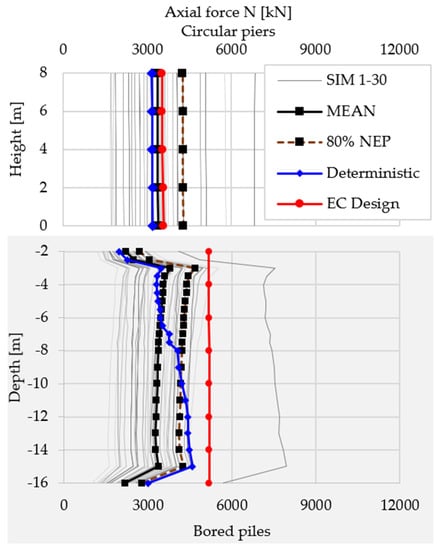
Figure 21.
Axial force N diagram for pier and bored piles.
This type of diagram representation has been chosen in order to be easily read and understood, while also being as complete as possible. The following notes explain how to read the diagrams:
- All internal forces diagrams are divided in two as follows:
- ○
- the upper half is for the circular pier section;
- ○
- the bottom half is for the bored piles.
- The height and depth values are measured from the upper side of the pile cap.
- Due to large differences in values of the two halves of the diagrams, each of them uses a different representation scale (check the top/bottom of the diagram).
Table 5 sums up the differences in internal forces between the three models as follows:
Table 5.
Main differences of internal forces.
For the circular piers, when comparing with the probabilistic analysis, the design model overestimates the bending moment for the X direction (bridge longitudinal axis) and is pretty close for the Y direction (bridge transverse direction). It is interesting to note that the difference in bending moments for the X direction (a ratio of 1.70) is a lot smaller than the difference of acceleration at superstructure level, where the ratio was 3.50. This means that a part of the acceleration difference does not generate bending in the piers, which is a completely different behavior than the traditional, simplified design concepts. For the axial forces, the probabilistic approach gives the strongest response with an increase of 20% over the typical design model. Still, this is not very problematic as it will only have a minor effect on the design of the pier.
The deterministic SSI model is close to the mean value of the probabilistic analysis for all internal forces of the circular piers, but it underestimates the response by 20–30% when comparing to the design values of the 80% non-exceedance probability internal forces.
The biggest differences in behavior are found below the soil surface as follows: the internal forces generated by transverse actions on the bored piles are underestimated by the design model by 25–35%. This actually means that the structure does not reach the demanded safety level. The axial force in the piles from the design model is larger than the one from the probabilistic analysis by approx. 10%; the axial force is the main factor for choosing the pile length and an overestimation will generate an important increase in the cost of the structure.
Overall, the smaller transverse forces and larger axial force in the bored piles point to a stiffer overall foundation model that is not subjected to the actual forces that would be generated by the ground motion during a seismic event.
4. Conclusions
The sophisticated soil–structure interaction methodology that is typically used on nuclear facilities has been applied to a bridge structure, using the state-of-the-art ACS SASSI software.
The use of the new probabilistic approach according to ASCE 04-16 is described on a step-by-step basis.
To account for the uncertainties in the model, the deterministic approach relies on factors of safety that lead to an overestimation of the design requirements in most parts of the structure, which further translated into higher than required costs. Instead, the probabilistic approach actually simulates real-world compatible variations in the model, which ensures that the behavior is as close to the real one as possible. By comparing to the deterministic models, the probabilistic approach can also be used to highlight weak points in the structure, where the required factor of safety is not actually obtained.
Additionally, major differences between this very modern approach and the typical design methods used in current engineering practice are highlighted. The latter is unable to capture the true dynamic behavior of the structure during a seismic event and misses the following main fact about earthquakes: the seismic waves propagate through the ground until they reach the structure, and it is applied to the structure only after the soil–structure interaction affects the motion.
All the simplifications that are applied to the typical design model tend to reduce it to a single degree of freedom inverted pendulum. This type of system will generate a very strong structural response overall, which provides the necessary safety for the design in the end. This is quite a brute-force approach as a big part of the structure will be needlessly oversized, a fact that has major implications on the costs of construction.
On the other hand, in certain situations, the design underestimates the seismic response (such as the transverse forces in the piles) and, in reality, the structure does not meet the required safety criteria. If main structural elements fail, the effect could be disastrous.
Because no clear answer can be given on whether the structural response from typical simplified design models overestimates or underestimates the response, engineers have to start including this type of advanced SSI analyses in their design, especially for very important/critical bridges.
As far as future directions for the study go, the next step would be a validation of the SSI model with recorded data from existing structures and real earthquakes. This would also validate the pile-soil (near-field) interaction methodology, which is of very high importance, especially for incoherent seismic input.
Author Contributions
Conceptualization, M.C.; methodology, D.M.G. and M.C.; software, D.M.G.; validation, D.M.G., D.C. and M.F.B.; formal analysis, M.C.; investigation, M.C.; resources, M.C. and M.F.B.; data curation, M.C. and M.F.B.; writing—original draft preparation, M.C.; writing—review and editing, D.M.G., D.C. and M.F.B.; visualization, M.C.; supervision, D.M.G. and D.C. All authors have read and agreed to the published version of the manuscript.
Funding
This research received no external funding.
Data Availability Statement
The results presented in this study are available on request from the corresponding author.
Conflicts of Interest
The authors declare no conflict of interest.
References
- Wolf, J.P. Dynamic Soil-Structure Interaction; Prentice-Hall Inc.: Englewood Cliffs, NJ, USA, 1985. [Google Scholar]
- Kramer, S.L. Geotechnical Earthquake Engineering; Prentice-Hall Inc.: Englewood Cliffs, NJ, USA, 1996. [Google Scholar]
- Mylonakis, G.; Syngros, C.; Gazetas, G.; Tazoh, T. The role of soil in the collapse of 18 piers of Hanshin expressway in the Kobe earthquake. Earthq. Engng. Struct. Dyn. 2006, 35, 547–575. [Google Scholar] [CrossRef]
- Mylonakis, G.; Gazetas, G. Seismic soil-structure interaction: Beneficial or detrimental? J. Earthq. Eng. 2000, 4, 277–301. [Google Scholar] [CrossRef]
- Anand, V.; Kumar, S.R.S. Seismic soil-structure interaction: A state-of-the-art review. Structures 2018, 16, 317–326. [Google Scholar] [CrossRef]
- CEN. Eurocode 8: Design of Structures for Earthquake Resistance—Part 2: Bridges; European Committee for Standardization: Brussels, Belgium, 2005. [Google Scholar]
- Lysmer, J.; Seed, H.B.; Schnabel, P.B. Influence of Base Rock Characteristics on Ground Response; UCB/EERC-70/07; Earthquake Engineering Research Center, University of California: Berkeley, CA, USA, 1970. [Google Scholar]
- Seed, H.B.; Lysmer, J.; Hwang, R.N. Soil Structure Interaction Analyses for Evaluating Seismic Response; UCB/EERC-74/06; Earthquake Engineering Research Center, University of California: Berkeley, CA, USA, 1974. [Google Scholar]
- Lysmer, J.; Seed, H.B.; Udaka, T.; Hwang, R.N.; Tsai, C.-F. Efficient Finite Element Analysis of Seismic Structure-Soil-Structure Interaction; UCB/EERC-75/34; Earthquake Engineering Research Center, University of California: Berkeley, CA, USA, 1975. [Google Scholar]
- Lysmer, J. Analytical Procedures in Soil Dynamics; UCB/EERC-78/29; Earthquake Engineering Research Center, University of California: Berkeley, CA, USA, 1978. [Google Scholar]
- Gomez-Masso, A.; Lysmer, J.; Chen, J.-C.; Seed, H.B. Soil Structure Interaction in Different Seismic Environments; UCB/EERC-79/18; Earthquake Engineering Research Center, University of California: Berkeley, CA, USA, 1979. [Google Scholar]
- Chen, J.-C.; Lysmer, J.; Seed, H.B. Analysis of Local Variations in Free Field Seismic Ground Motion; UCB/EERC-81/03; Earthquake Engineering Research Center, University of California: Berkeley, CA, USA, 1981. [Google Scholar]
- Lysmer, J.; Tabatabaie, M.; Tajirian, F.F.; Vahdani, S.; Ostadan, F. SASSI: A System for Analysis of Soil Structure Interaction; University of California: Berkeley, CA, USA, 1981. [Google Scholar]
- Lysmer, J.; Ostadan, F.; Chin, C.-C. SASSI 2000: A System for Analysis of Soil-Structure Interaction; Geotechnical Engineering, University of California: Berkeley, CA, USA, 1999. [Google Scholar]
- Kausel, E.; Roësset, J.M. Soil structure interaction problems for nuclear containment structures, electric power and the civil engineer. In Proceedings of the ASCE Power Division Conference, Boulder, CO, USA, 13 August 1974. [Google Scholar]
- Kausel, E. Dynamic Soil-Structure Interaction of Nuclear Power Plant Structures; International Centre for Computer-Aided Design (ICCAD): Santa Margherita, Italy, 1976. [Google Scholar]
- Kausel, E. Fundamental Solutions in Elastodynamics: A Compendium; Cambridge University Press: Cambridge, UK, 2006. [Google Scholar]
- Chopra, A.K. Earthquake Engineering for Concrete Dams: Analysis, Design, and Evaluation; Wiley-Blackwell: Hoboken, NJ, USA, 2020. [Google Scholar]
- Clough, R.W.; Chopra, A.K. Earthquake response analysis of concrete dams. In Structural and Geotechnical Mechanics, A Volume Honoring Professor Nathan M. Newmark; Hall, W.J., Newmark, N.M., Eds.; Prentice-Hall, Inc.: Englewood Cliffs, NJ, USA, 1977. [Google Scholar]
- Gazetas, G. Analysis of machine foundation vibrations: State of the art. Int. J. Soil Dyn. Earthq. Eng. 1983, 2, 2–42. [Google Scholar] [CrossRef]
- Gazetas, G. Formulas and charts for impedances of surface and embedded foundations. J. Geotech. Eng. 1991, 117, 1363–1381. [Google Scholar] [CrossRef]
- Mylonakis, G.; Nikolaou, S.; Gazetas, G. Footings under seismic loading: Analysis and design issues with emphasis on bridge foundations. Soil Dyn. Earthq. Eng. 2006, 26, 824–853. [Google Scholar] [CrossRef]
- Novak, M. Dynamic stiffness and damping of piles. Can. Geotech. J. 1974, 11, 574–598. [Google Scholar] [CrossRef]
- Novak, M.; Sheta, M. Approximate approach to contact effects of piles. In Dynamic Response of Pile Foundations, Analytical Aspects; American Society of Civil Engineers: New York, NY, USA, 1980; pp. 53–79. [Google Scholar]
- Novak, M. Piles under dynamic loads. In Proceedings of the 2nd International Conference on Recent Advances in Geotechnical Earthquake Engineering and Soil Dynamics, Rolla, MO, USA, 11–15 March 1991. [Google Scholar]
- Kaynia, A.M.; Kausel, E. Dynamic Stiffness and Seismic Response of Pile Groups Report R82-03; School if Engineering, Massachusetts Institute of Technology: Cambridge, MA, USA, 1982. [Google Scholar]
- Kaynia, A.M.; Novak, M. Response of pile foundations to rayleigh waves and obliquely incident body waves. Earthq. Eng. Struct. Dyn. 1992, 21, 303–318. [Google Scholar] [CrossRef]
- Nogami, T.; Novak, M. Soil-pile interaction in vertical vibration. Earthq. Eng. Struct. Dyn. 1976, 4, 277–293. [Google Scholar] [CrossRef]
- Nogami, T.; Chen, H.-L. Prediction of non-linear pile foundation response to vertical vibration. In Proceedings of the 3rd International Conferences on Recent Advances in Geotechnical Earthquake Engineering and Soil Dynamics, Rolla, MO, USA, 2–7 April 1995. [Google Scholar]
- Gazetas, G.; Stokoe, K.H., II. Free vibration of embedded foundations: Theory versus experiment. J. Geotech. Eng. 1991, 117, 1382–1401. [Google Scholar] [CrossRef]
- Wilson, D.W.; Boulanger, R.W.; Kutter, B.L.; Abghari, A. Dynamic centrifuge tests of pile supported structures in liquefiable sand. In Proceedings of the National Seismic Conference on Bridges and Highways—Progress in Research and Practice, FHWA and Caltrans, San Diego, CA, USA, 10–13 December 1995. [Google Scholar]
- Boulanger, R.W.; Curras, C.J.; Kutter, B.L.; Wilson, D.W. Seismic soil-pile-structure interaction experiments and analyses. J. Geotech. Geoenviron. Eng. 1999, 125, 750–759. [Google Scholar] [CrossRef]
- Brandenberg, S.J.; Boulanger, R.W.; Kutter, B.L.; Chang, D. Behavior of pile foundations in laterally spreading ground during centrifuge tests. J. Geotech. Geoenviron. Eng. 2005, 131, 1378–1391. [Google Scholar] [CrossRef] [Green Version]
- Clough, R.W.; Penzien, J. Dynamics of Structures; CSI Computers & Structures Inc.: Berkeley, CA, USA, 2003. [Google Scholar]
- Chen, C.-H.; Penzien, J. Seismic Modelling of Deep Foundation; UCB/EERC-84/19; Earthquake Engineering Research Center, University of California: Berkeley, CA, USA, 1984. [Google Scholar]
- Lysmer, J.; Chin, C.-C. Seismic response of piled bridge piers, Caltrans, Department of transportation, Division of structures. In Proceedings of the 1st Annual Seismic Research Workshop, Sacramento, CA, USA, 3–4 December 1991. [Google Scholar]
- Tseng, W.S.; Penzien, J. Hybrid method for evaluating soil-foundation-structure interaction effects. In Proceedings of the 5th Caltrans Seismic Research Workshop, Sacramento, CA, USA, 16–18 June 1998. [Google Scholar]
- Badoni, D.; Makris, N. Analysis of the Nonlinear Response of Structures Supported on Pile Foundations; UCB/EERC-97/07; Earthquake Engineering Research Center, University of California: Berkeley, CA, USA, 1997. [Google Scholar]
- Zhang, J.; Makris, N. Seismic Response Analysis of Highway Overcrossings Including Soil-Structure Interaction; PEER-2001/02; Pacific Earthquake Engineering Research Center, University of California: Berkeley, CA, USA, 2001. [Google Scholar]
- National Research Council. Probabilistic Methods in Geotechnical Engineering; The National Academies Press: Washington, DC, USA, 1995. [Google Scholar]
- Penzien, J. Probabilistic seismic response of structures. In Proceedings of the Iranian Congress of Civil Engineering Proceedings, Shiraz, Iran, 1976; Volume 1, pp. 372–385. [Google Scholar]
- Chelapati, C.V.; Wall, I.B. Probabilistic Assessment of Seismic Risk for Nuclear Power Plants; Holmes & Narver Inc.: Los Angeles, CA, USA, 1969. [Google Scholar]
- Fardis, M.N. A probabilistic seismic analysis of containment liner integrity. In Proceedings of the Transactions of the 4th International Conference on Structural Mechanics in Reactor Technology, San Francisco, CA, USA, 15–19 August 1977. [Google Scholar]
- Elkhoraibi, T.; Hashemi, A.; Ostadan, F. Probabilistic and deterministic soil structure interaction analysis including ground motion incoherency effects. Nucl. Eng. Des. 2014, 269, 250–255. [Google Scholar] [CrossRef]
- Kwon, O.-S.; Elnashai, A. Probabilistic Seismic Assessment of Structure, Foundation, and Soil Interacting Systems; Newmark Structural Engineering Laboratory, Department of Civil and Environmental Engineering, University of Illinois Urbana-Champaign: Champaign, IL, USA, 2007. [Google Scholar]
- Ghiocel, D.M. ASCE 4-16 standard-based probabilistic seismic SSI analysis for design-basis and fragility analysis. In Proceedings of the 2nd International Conference on Nuclear Power Plants: Structures, Risk & Decommissioning NUPP2018, London, UK, 11–12 June 2018. [Google Scholar]
- Scislo, L.; Guinchard, M. Source based measurements and monitoring of ground motion conditions during civil engineering works for high luminosity upgrade of the LHC. In Proceedings of the 26th International Congress on Sound and Vibration, ICSV26, Montreal, QC, Canada, 7–11 July 2019. [Google Scholar]
- Lacny, L.; Scislo, L.; Guinchard, M. Application of probabilistic power spectral density technique to monitoring the long-term vibrational behaviour of CERN seismic network stations. Vib. Phys. Syst. 2020, 31, 2020311. [Google Scholar]
- Conțiu, M. The Effects of Spatial Variation of the Seismic Ground Motion on Bridge Structures. Ph.D. Thesis, Technical University of Civil Engineering, Bucharest, Romania, September 2020. [Google Scholar]
- American Society of Civil Engineers. ASCE/SEI 4-16 Seismic Analysis of Safety-Related Nuclear Structures; American Society of Civil Engineers: Reston, VA, USA, 2017. [Google Scholar]
- Conțiu, M.; Ghiocel, D.M.; Crețu, D. Soil-structure interaction and motion incoherency effects on a concrete bridge with deep foundations. IOP Conf. Ser. Mater. Sci. Eng. 2018, 399, 012010. [Google Scholar] [CrossRef]
- Conțiu, M.; Ghiocel, D.M.; Crețu, D. Incoherent soil-structure interaction (SSI) effects for a 242 m long concrete bridge founded on deep piles. In Proceedings of the Second European Conference on Earthquake Engineering and Seismology (2ECEES), Istanbul, Turkey, 25–29 August 2014. [Google Scholar]
- Ghiocel, D.M.; Ghanem, R. Stochastic finite-element analysis of seismic soil–structure interaction. ASCE J. Eng. Mech. 2002, 128, 66–77. [Google Scholar] [CrossRef]
- Ghiocel, D.M.; Short, S.; Hardy, G. Seismic motion incoherency effects on SSI response of nuclear islands with significant mass eccentricities and different embedment levels. In Proceedings of the 20th International Conference on Structural Mechanics in Reactor Technology (SMiRT 20), Espoo, Finland, 9–14 August 2009. [Google Scholar]
- Ghiocel Predictive Technologies Inc. ACS SASSI Version 3.0 User Manual Revision 4; Ghiocel Predictive Technologies Inc.: Pittsford, NY, USA, 2016. [Google Scholar]
- Seed, H.B.; Idriss, I.M. Soil Moduli and Damping Factors for Dynamic Response Analysis; Report No. EERC 70-10; Earthquake Engineering Research Center: Berkeley, CA, USA, 1970. [Google Scholar]
- Eidinger, J.M.; Abrahamson, N. Seismic response of long span bridges to incoherent ground motion. In Proceedings of the 1st Annual Seismic Research Workshop, Sacramento, CA, USA, 3–4 December 1991; Caltrans, Department of Transportation, Division of Structures: Sacramento, CA, USA, 1991. [Google Scholar]
- Ghiocel, D.M.; Ostadan, F. Seismic Ground Motion Incoherency Effects on Soil-Structure Interaction Response of NPP Building Structures. In Proceedings of the Transactions of SMiRT 19 Conference, Toronto, ON, Canada, 12–17 August 2007. [Google Scholar]
- Abrahamson, N. Program on Technology Innovation: Spatial Coherency Models for Soil-Structure Interaction; EPRI: Palo Alto, CA, USA; Department of Energy: Germantown, MD, USA, 2006. [Google Scholar]
- Ghiocel Predictive Technologies Inc. ACS SASSI NQA Version 3 (IKTR8a) Option PRO for Probabilistic SSI User Manual Revision 2; Ghiocel Predictive Technologies Inc.: Pittsford, NY, USA, 2017. [Google Scholar]
Publisher’s Note: MDPI stays neutral with regard to jurisdictional claims in published maps and institutional affiliations. |
© 2022 by the authors. Licensee MDPI, Basel, Switzerland. This article is an open access article distributed under the terms and conditions of the Creative Commons Attribution (CC BY) license (https://creativecommons.org/licenses/by/4.0/).