1. Introduction
The term “diabetes” refers to a group of metabolic diseases most notably related to glucose metabolism. Carbohydrates obtained by the body from bread, potatoes, rice, cakes, and a variety of other meals are progressively broken down and destroyed [
1]. This disintegration and breakdown process begins in the stomach and continues through the duodenum and other segments of the small intestine. This breakdown and decomposition process produces a collection of sugars (carbohydrates) that are taken into circulation [
2]. Although the specific origin of diabetes mellitus is uncertain, scientists believe that both environmental and genetic factors contribute to the condition [
3]. Although it is incurable, it can be managed with medications and medicines [
4]. Individuals with DM are at risk for the development of further health problems. Early diagnosis and treatment of DM will also help prevent complications and reduce the risk of serious health problems [
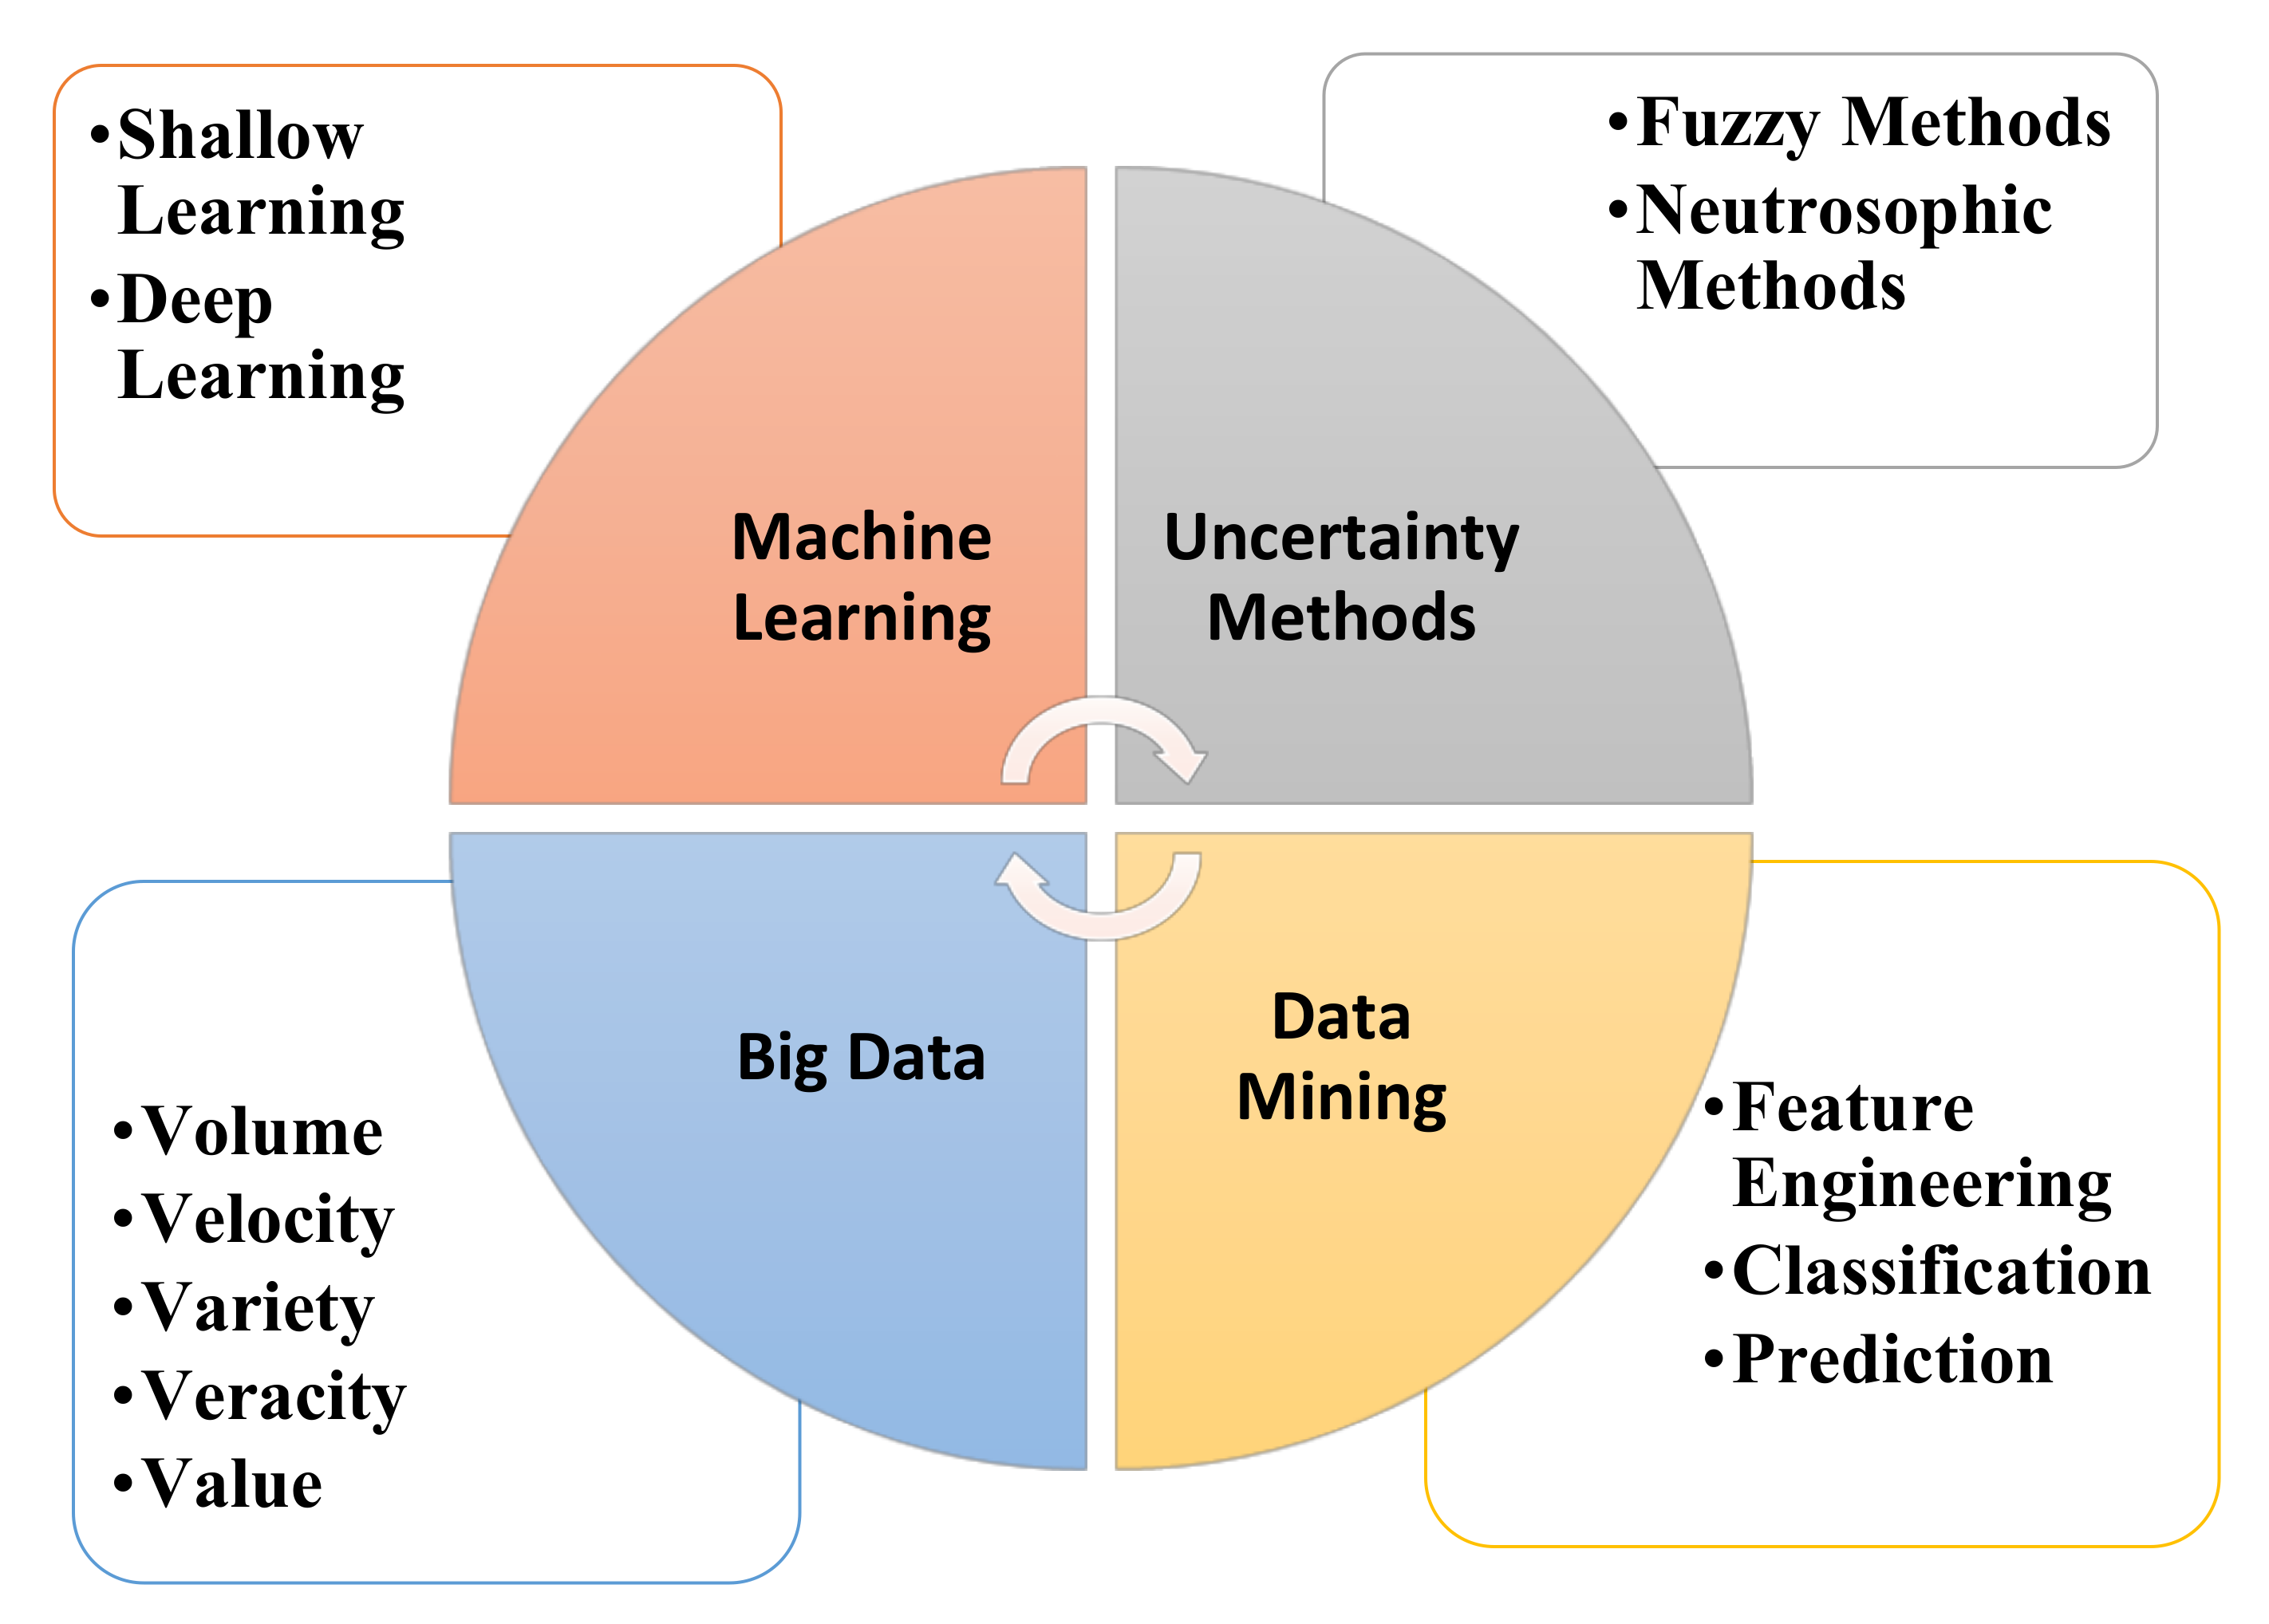
5]. There have been numerous advances in recent technologies, such as machine learning, fuzzy methods [
6,
7], and deep learning;
Figure 1 illustrates these technologies, adopted from [
8]. Recently, the integration between big data and IoT-based systems has played a main role in the diagnosis and treatment process. According to [
9], overweight and obesity (OO), and type 2 diabetes (T2D) pose a major public health burden that is increasing globally. Efficient preventive and control strategies for OO and T2D are critical not only to reduce immediate epidemiological costs but also to ensure that the United Nations’ Sustainable Development Goals (SDGs) are met, to reduce premature deaths from non-communicable diseases (NCDs) by one-third by 2030 by prevention and recovery, and to improve mental health and well-being [
3]. Smart systems will be helpful to all researchers to perform ground-breaking studies in OO and T2D using geo-tagged big data from smartphones, wearables, and other sensors. Personal diagnosis, screening, exercise, therapy and implants, and ultimately improved levels of telemedicine across the population, are all possible applications of smart health systems [
10].
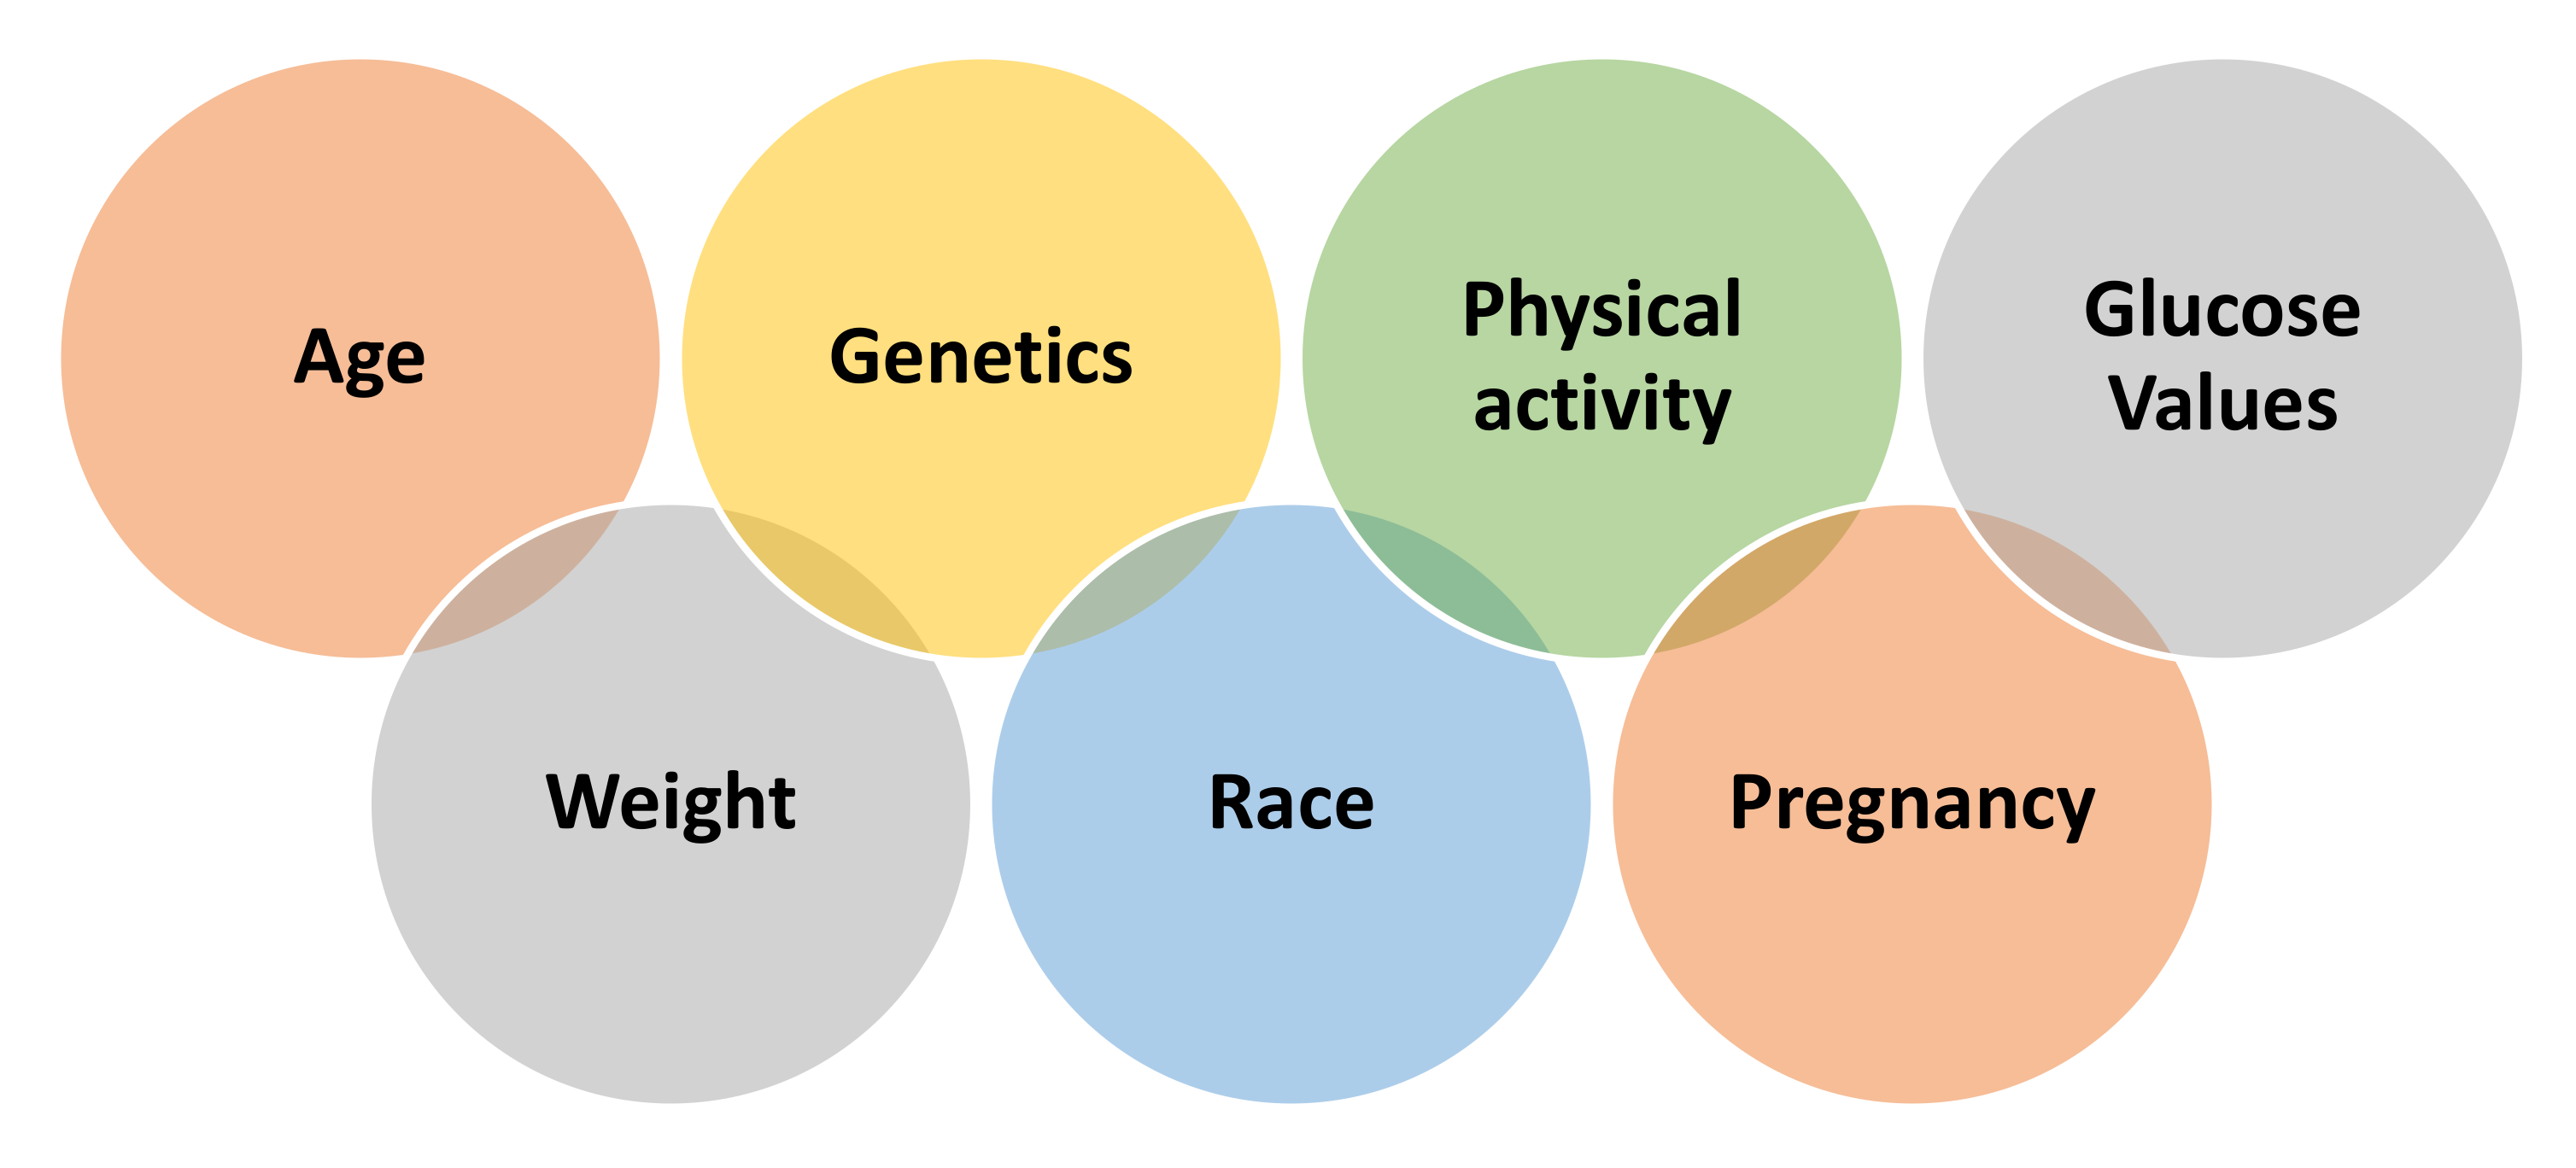
Researchers are still searching for an accurate answer to the following question: why do the conditions of “prediabetes” and T2D specifically affect certain people and not others? However, several factors appear to increase the risk of developing diabetes, including those that are discussed in [
11,
12]; major dimensions affecting diabetes are shown in
Figure 2.
The primary objective of this paper is to introduce an appropriate soft-computing methodology for handling the diabetes of pregnant women. The proposed focus is on handling the trade-off between machine learning accuracy versus the rationality of disease diagnosis. The developed method classifies diabetes in pregnant women using hybrid fuzzy membership concepts. Diabetes is a metabolic disease in which blood glucose levels rise over time and is considered one of the most common chronic diseases today. The significance of the study was determined by the importance of accurate prediction and classification of diabetes to reduce disease severity and start valid and appropriate treatment at an early stage. The key novelty of the research is introducing an extended version of Fuzzy KNN that depends on a hybrid membership function rather than regular (s). The proposed algorithm is tuned and sets the optimal value(s) of the hyperparameters using the grid search. The TFKNN is an enhanced version of the FKNN in the membership decision function, which enables TFKNN to deal with the belief degree, handle membership function and operation law, and avoid making the wrong categorization.
In this paper, we concentrated on the determinants of gestational diabetes, which include the stages listed below (See
Section 4). The placenta generates hormones that help and sustain pregnancy during pregnancy. Insulin resistance is increased by these hormones. The placenta enlarges and generates a considerable amount of these hormones throughout the second and third trimesters of pregnancy, making insulin action harder. To counteract this resistance, the pancreas produces more insulin under normal conditions. However, the pancreas occasionally fails to keep up with the rate, resulting in a very tiny amount of sugar (glucose) reaching the cells, while a significant amount accumulates in the blood circulation [
13].
As a result, pregnant women could be affected by gestational diabetes, but some are more vulnerable than others. Women over the age of 25, with a family or personal history of diabetes, and who are overweight are all risk factors for diabetes [
13,
14]. Based on the most recent epidemiological results [
15], forecasts the global and regional effects of diabetes for 2017 and 2045. Notably, the hit rate will increase to 693 million by 2045. The high prevalence of diabetes has significant social, environmental, and growth consequences, especially in low- and middle-income countries. The WHO’s objective is to encourage and support successful diabetes monitoring, prevention, and control efforts, particularly in poor and middle-income countries [
16].
Fuzzy logic is close to human reasoning, as it can accommodate the inconsistencies present in medical diagnosis results. Fuzzy logic is a Boolean logic extension dependent on degrees of truth between 0 and 1, or true/false. The theme of degree, inaccuracy, linguistics, and observation underpins fuzzy logic [
8].
Many studies have been introduced to predict diabetes [
17]. The best rules were optimized using the cost estimation function after fuzzy classification rules were created [
18]. In [
8], fuzzy expert system (FES)-based data mining was used to analyze information from the available evidence that could be ambiguous and to propose linguistic concepts with large approximations as their key to medical texts. Recently, the speed of diabetes diagnosis has increased based on the integration of recent technologies such as deep learning and a novel optimized architecture of four Hadoop clusters for data classification using the multi-level MapReduce fuzzy classifier (MMR-FC) and MapReduce-modified density-based spatial clustering of applications with noise (MR-MDBSCAN) [
18].
In this study, the PIDD is well analyzed and preprocessed. A fuzzy KNN classification model boosted by hyperparameter optimization is proposed to predict diabetes in the PIDD versus other classification models. Although KNN achieves higher micro-average and macro-average ROC curves, fuzzy KNN is the superior classifier for diabetes prediction in the PIDD based on accuracy, precision, sensitivity, and average AUC. The PIDD is analyzed to detect the relationship between the diabetes features and class labels and to detect the key problems of the given dataset, including outliers, missing values, normalization, feature importance, and imbalanced categories.
The major contributions of this paper can be summarized as follows:
A reliable preprocessing batch procedure (s) is proposed to resolve the interference of feature impacts and contradictions, determining the discriminator plans of the binary category for dealing with the PIDD;
Initial crisp logic rules are extracted from the processed data using a decision tree, Naïve Bayes, and a basic KNN classifier (s) for diabetes classification;
The training dataset is used as a base for resolving the uncertainty membership of each instance for reducing the misclassification coefficient cost and categorizing instance (s) reliably;
A modified Fuzzy KNN classifier (TFKNN) is proposed that uses an uncertainty membership function instead of regular fuzzy membership or a classical member function for the KNN classifier (s);
It is assumed that some performances lack hyperparameter values for the classification model, and a grid search optimizer is used to determine the tuned value(s) of the hyperparameter (s) for the fuzzy KNN, DT, NB, and the proposed TFKNN classifiers;
The performance of the classifier (s) with the best values for model parameters using the PIDD regarding the classification metrics is benchmarked and validated.
A hybrid cross-hold-fold validation framework is applied to validate the proposed methodology using different classifiers, including uncertainties.
The rest of the paper is organized as follows: the related work and the current contributions to classify diabetes are given in
Section 2.
Section 3 includes the steps of the applied methodologies, including the problem definition, preprocessing, and the utilized methods. The proposed fuzzy KNN algorithm is investigated in
Section 4. PIDD descriptions are discussed in
Section 5, and the results and discussion are presented. Finally, the conclusion and directions for future work are given in
Section 6.
2. Recent Contributions to Classify Diabetes
Researchers in the field of data science have recently made efforts to discover, detect, and diagnose diabetes in its early stage. The use of classification and regression algorithms can handle and aggregate large-scale patients simultaneously to help track disease. Although tracking diabetes is helpful, efforts to recommend a suitable treatment protocol are being made using machine learning and computer vision methodologies [
19,
20]. The PIDD was considered one of the most well-known datasets used in classification and prediction issues in diabetes diseases. A comparative review of prediction approaches for diabetes was presented by Ganesh and Sripriya [
21]. Moreover, a systematic review of machine learning and artificial intelligence approaches utilized to predict and self-manage diabetes based on the PIDD was presented by Chaki et al. [
5]. A framework for a semantic retrieval algorithm to diagnose diabetes based on fuzzy ontology orientation was presented by El-Sappagh et al. [
22]. The results achieved based on fuzzy ontology were 97.67% for 54 (fuzzy) object properties, 138 (fuzzy) datatype properties, 105 fuzzy data types, and 2640 instances.
A prediction of diabetes using classification algorithms such as decision tree, support vector machine (SVM), and NB are presented by Sisodia et al. [
23]. In this work, diabetes was predicted at an early stage. The accuracy achieved was 76.3 on the PIDD. A hybrid model based on a GA and a backpropagation network (BPN) was proposed by Karegowda et al. [
24], in which the weights of the BPN were optimized in the initialization based on the GA. The obtained accuracy value was between 77.07% and 84.71% when using correlation-based feature selection GA and BPN. A sequential minimal optimization (SMO) based on quadratic programming was used on the PIDD dataset by Khanwalkar and Soni [
25] with an average accuracy reaching 77.35%. The clinical PIDD dataset was further utilized to predict diabetes in women of Pima Indian heritage using supervised learning approaches investigated by Bhoi et al. [
26]. They compared and evaluated the results in terms of accuracy, precision, recall, F1 score, and AUC for the output of the classification tree (CT)-, SVM-, KNN-, NB-, random forest (RF), neural network (NN)-, AdaBoost (AB)- and logistic regression (LR)-supervised classifiers. Benbelkacem and Atmani [
27] presented an RF algorithm for the Pima dataset using 768 instances and 100 trees for the applied forest, and the results obtained were between 70% and 80% accuracy. The AB can be utilized efficiently to classify the enrolled data based on a genetic algorithm [
28].
Ramesh et al. [
29] presented an end-to-end healthcare monitoring framework for managing diabetes and predicting risk cases on the Pima dataset. They achieved 83.20%, 87.20%, and 79% accuracy, sensitivity, and specificity, respectively. An algorithm based on backward elimination and SVM was presented by Maulidina et al. [
30] to classify the PIDD. They utilized 268 diabetic patients and 500 normal patients with 8 well-known attributes, and they achieved an average accuracy of 85.71%. Hrimov et al. [
31] presented an LR method to predict the probability of diabetes based on the PIDD dataset, and they achieved 77.06% accuracy based on Python.
An enhanced early detection method for diabetes based on type 2 diabetes mellitus (T2DM) using multiple classifier approaches was presented by Zhu et al. [
32]. Multiple weighted factors based on a dynamic weighted voting scheme were used to adapt the prediction decision of this method to employ all voters in an equal manner and to combine these decisions. Ordás et al. [
33] proposed diabetic prediction approaches that include data augmentation using variational autoencoder (VAE), and the features are augmented using sparse autoencoder (SAE). The PIDD is further utilized and classified based on a convolutional neural network for classification, taking the number of pregnancies, glucose or insulin level, blood pressure, and age of patients into consideration.
Table 1 illustrates in detail the most recent approaches related to diabetes, including the accuracy, problem statement, preprocessing, feature selection, the selected classifier, the major contribution, and the minor drawbacks of each recent approach. Although deep learning (DL) approaches are a very interesting and hot topic to solve the classification and regression problem in many different applications, some medical applications require the determination of uncertainty values of the features without the need to obtain higher accuracy. Naz and Ahuja [
34] present a DL model based on the PIDD dataset with a promising achieved accuracy of 98.07%, precision of 95.22%, recall of 98.46%, and F1 score of 96.81%. They utilized a limited number of layers from one layer to four layers and used SoftMax and a rectifier activation function without fine-tuning hyperparameters, which generally leads to instability of the results and an overfitting problem [
35]. Another deep neural network (DNN) for diabetes prediction is presented by Ayon and Islam [
36]. They utilized both 5-fold and 10-fold cross-validation with higher accuracy, which reached 98.04%, and 97.27%, respectively, on the PIDD dataset. Moreover, they determined both the recall and F1 score so that the results are 98.80% and 99.00%, respectively, for a 5-fold validation and 97.80% and 96.00% for a 10-fold validation. Even the accuracy is higher; the utilization of only 5-fold or 10-fold cross-validations is considered the simplest validation approach of the machine learning pipeline. Therefore, a pretraining model with hyperparameter fine tuning is required to ensure the reliability and stability of the model. Moreover, it is very important to determine the uncertainty of the values and calculate the area under the curve to boost the results obtained.
3. Preliminaries
In this section, we introduce the problem formulation of the applied data to determine the diabetes scenarios within the preserved features. Afterward, we investigated the difference between fuzzy KNN and regular KNN.
3.1. Problem Formulation
To achieve high precision of data analysis, we need perfect consideration of the different aspects of features affecting the classification procedure. Hence, we consider
to represent the corresponding labels for
U, which is a given universe of discourse, as the input set of instances and which can be defined as
. Due to the
definition,
represents a labeled instance in diabetes analysis environments.
consists of
and
f, denoting samples with and without diabetes, such that
. To describe the diabetes diagnosis scenario with an imbalanced dataset, we assume
. Determining the label (i.e., diabetic or normal state) mentioned as
is a major challenge. In addition, each instance
is an n-dimensional attribute vector. It can be described as
= <
>. It is known that
is typically a high-dimensional feature vector from clinical settings. Thus, another task is to represent the [
37]. See
Table 2 for a visual representation of the problem according to the stated mathematical description.
In turn, the major intention of our problem focuses on supervised algorithms that are capable of handling different instances of binary classes in imbalanced datasets. In the subsequent sections, we will discuss the available algorithms that can be utilized as classification twisting models in diabetes analysis, especially in uncertainty mode or fuzzy models. Here, in the forthcoming section, we explain the major differences between fuzzy KNN and regular KNN to investigate the importance of the fuzzy algorithm to tackle the crisp variations in the applied features.
3.2. K Nearest Neighbors (KNN) Classifier
KNN, a common form of the NN rule in supervised learning, considers the use of the many comparable (nearest) k patterns in a training set to originate the class of a test pattern. The KNN classifier correctly classifies the target class for an unidentifiable instance by calculating the class label with the highest frequency among those nearest k instances. It can be mathematically formulated as in Equations (1) and (2):
where
is the KNN of instance
I.
The term
C(
I) is called the class label, for instance,
I. In more formal terms, consider
to be the train features, where
and
M is the number of features in a train set, and
is a test pattern from the test set where
, and
N is the number of features in a test set. The training procedure is carried out, during which the KNN classifier stores the true 𝓌 class for each training feature
based on the true class w of the majority of k of its closest neighbors. In the event of a tie, the nearest neighbor who belongs to one of the restricted classes assumes
c [
38].
One of the benefits of KNN is its simplicity, although there have been extensive studies from several viewpoints of the KNN classifier to improve the accuracy of the classification and reduce its defects. The most important disadvantage of it is the necessity to store the complete training set when performing the classification, as most machine learning requires only the model to be stored; other disadvantages include its somewhat low efficiency when calculating the decision rule and the low tolerance of noise, especially when k = 1. The KNN classifier depends on the existing data. It is the training that defines the boundaries of the decision.
To improve the classification efficiency, researchers have studied and analyzed the mentioned defects and accordingly created fast and accurately estimated models of the NN rule to speed up the calculation of nearest neighbors [
39,
40] and reduce the size of the training dataset [
41,
42]. New methods such as the computation of local mean, distance weight [
43], and specific weight are distributed to various features based on their importance [
44]. A modified KNN called the hybrid fuzzy weighted KNN algorithm [
45] is a novel concept for determining accurate test instance memberships from an imbalanced dataset by combining an adaptive KNN approach for dealing with an imbalanced issue and then joining it with fuzzy KNN [
46].
All these attempts have been made with a distinct goal: to increase the precision of the NN rule. Soft memberships (which characterize instances that did not correspond to the typical models of each class), improved similarity measures (which adjust the method of computing distances to the fuzzy memberships), and new decision standards are expected to improve the classifier’s accuracy by integrating both the memberships and the distances to the testing data’s final prediction. A few fuzzy KNN algorithms have additional distinguishing characteristics, such as the absence of a special k measurement configuration [
47].
3.3. A Fuzzy KNN Algorithm
Jóźwik [
48] made the first fuzzy KNN classifier proposal. Keller et al. [
49]’s proposal became the main reference in this field. Algorithm 1 describes the pseudocode of the basic steps denoting the membership function formula in line 10. The formula is used to determine the appropriate class based only on the distance from the prototype of the class.
| Algorithm 1. Fuzzy KNN based on distance from the prototype of the class. |
| | Input: instance |
| | Output: Ɩ class Label |
| 1 |
BEGIN |
| 2 | Input , vector to be classified. |
| 3 | Initialize . |
| 4 | DO UNTIL (distance from each prototype to computed) |
| 5 | Compute distance from to . |
| 6 | Increment . |
| 7 | END DO UNTIL |
| 8 | Initialize . |
| 9 | DO UNTIL ( assigned membership in all classes) |
| 10 | Compute |
| 11 | Increment |
| 12 | END DO UNTIL |
| 13 | Classify : set Ɩ |
| 14 |
END |
It is a more developed edition KNN algorithm. The majority class label is used to specify the class label of an unspecified instance in the conventional KNN algorithm. In the first stage of development, the membership of training instances for each class is determined by mathematical calculation using Equation (3):
where
denotes membership of
A in class
c,the class of
A is
j and
is all neighbors in class
C.
Regardless of the increasing improvement and proposals of KNN, which have created different methods of solving fuzzy NN classification algorithms, the use of fuzzy sets in conjunction with the NN classifier has enhanced work in dataset identification. Most of these works were already based on the application of fuzzy nearest neighbor rules to a range of domains or on alternative ways of combining FST and KNN. The fuzzy KNN algorithm computes the uncertainty membership function for each instance before classification relative to the complete number of instances, which yields a square computation relation. This relation is very important to determine the relative class of the current instance verse other algorithms that classify it without inspecting the uncertainty value of instance for each category. The Fuzzy KNN algorithm has the worst value(s) at the complexity levels O(kn2d) where k represents the number of available clusters, n represents the number of available instances, and d represents the dimensionality of the instance data.
4. Research Methodology
Recent literature was analyzed to determine the state-of-the-art diabetes classification methods and discover how diabetes patients are currently identified. In this section, the designed research is discussed and handled with regards to different aspects of implementation to achieve research objectives. First, the PIDD dataset is analyzed statistically and through visualization to pioneer the challenges and research problem. Second, in response to discovered requirements, a possible preprocessing procedure is demonstrated. Third, the proposed uncertainty membership function of the proposed TFKNN is introduced to overcome the drawbacks of the Fuzzy KNN classifier. Additionally, the designed workflow for fine-tuning the proposed TFKNN, fuzzy KNN, DT, and NB is described. Finally, the implemented validation method is explained, showing the main advantages of other validation methods.
4.1. Pima Indians Diabetes Dataset
The PIDD is one of the most familiar and publicly available datasets with rich, empirical data. It is widely applied in comparative studies with recent state-of-art approaches. During the analysis of patients with diabetes from the PIDD neighboring Phoenix, Arizona, all pregnant female patients with diabetic symptoms, regardless of demographic values such as social status and previous surgery, were included in the study. The collected dataset is publicly available (the PIDD for use in (ML) modelling during the training and testing procedures, available at
https://www.kaggle.com/uciml/pima-indians-diabetes-database last accessed 10 October 2021). The PIDD includes 768 female diabetic patients with 8 attributes, such that the PIDD is classified into 2 groups: 268 patients with diabetes and 500 normal patients without diabetes. Before enrolment, laboratory tests and personal medical records were obtained from all patients during the acute phase of collecting data.
Table 3 describes the attributes of the PIDD and provides a brief statistical summary. Moreover, it illustrates a sample of the acquired instances in the PIDD. A sample of the PIDD with different features and the corresponding values with the predicted outcomes is investigated in
Table 4.
4.2. Preprocessing
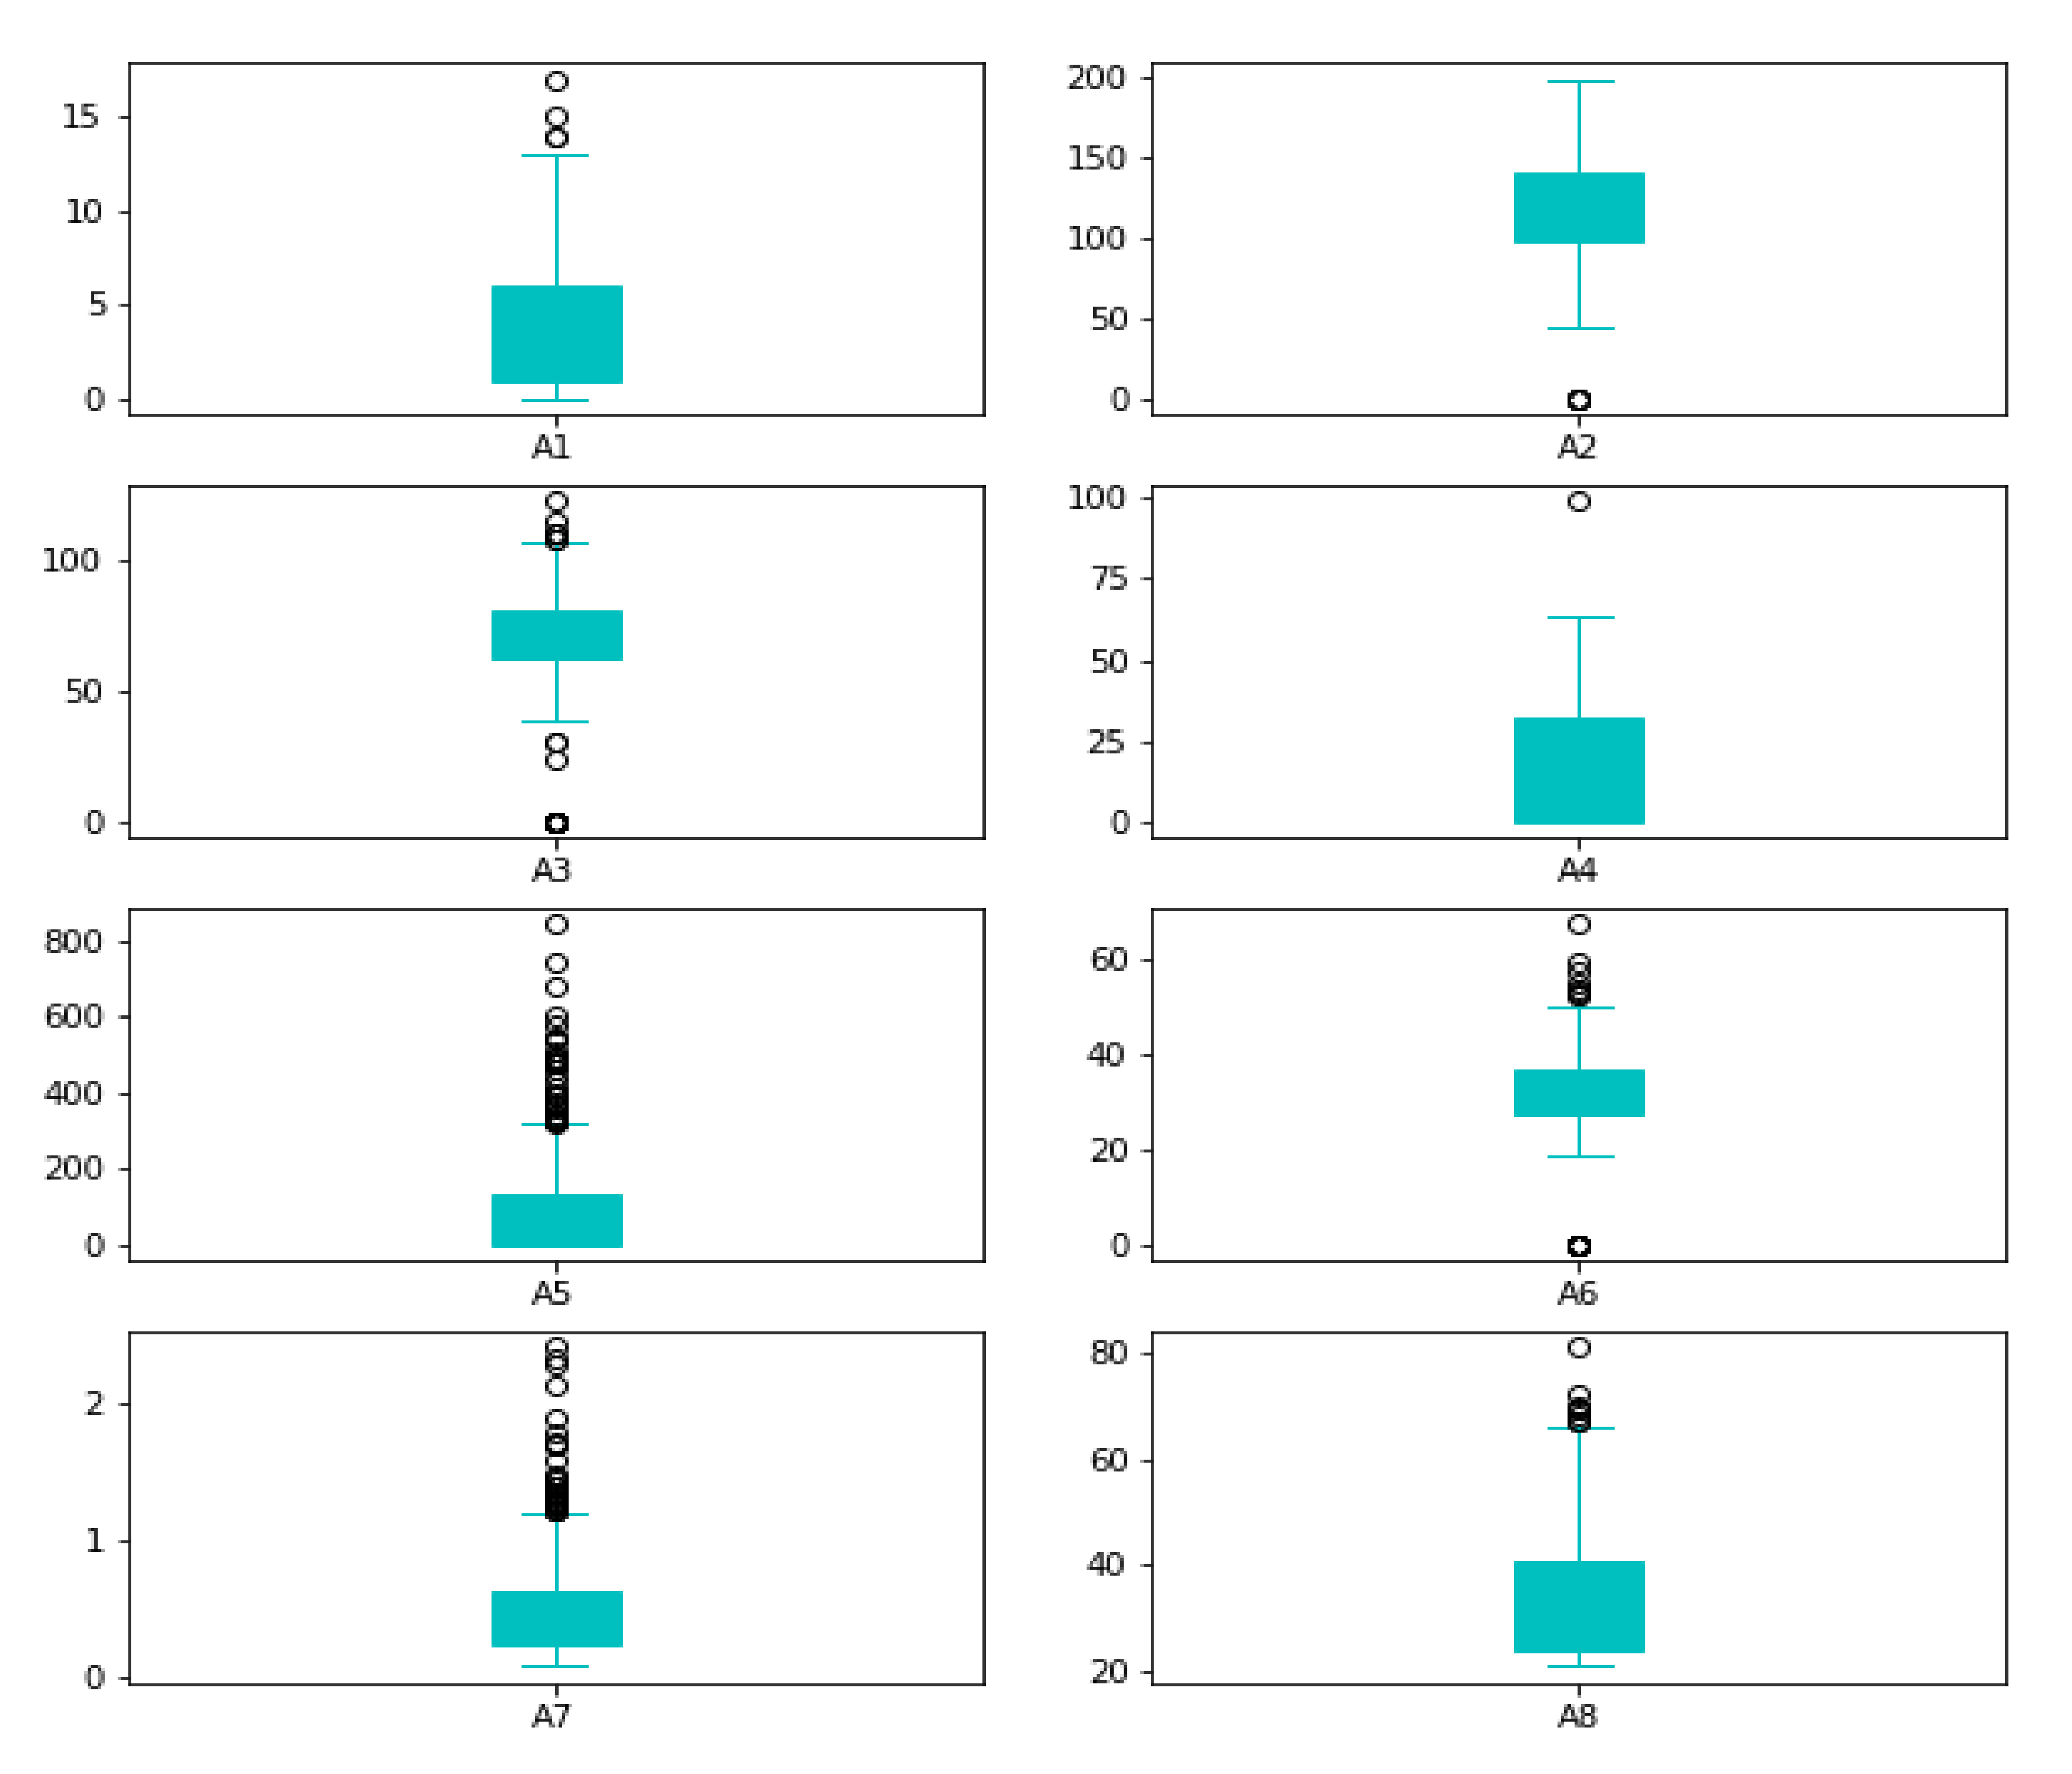
Reviewing the maximum values, they appear to be extremely high; for example, (A5), the maximum value of insulin cannot be 850. As a result, it is an outlier. Box plots can be used to verify our assumptions about such outliers, as shown in
Figure 3.
The preprocessing step in the proposed algorithm contains outlier rejection (P), imputing missing values (Q), the standardization process (S), and the selection of features.
When an observation deviates from the other observations in the data, it is called an outlier [
50]. The classifiers are affected by the distribution of the data and are sensitive; thus, the data deviating from the distribution need to be rejected. We used the IQR technique to remove outliers. The mathematical formulation for outlier rejection is described mathematically as in Equation (4).
where
I denotes the enrolled feature vector (FV) instances in the dimension space M, such as
I ∈ R
M. Q
1 represents the 1st quartile, Q
3 represents the 3rd quartile and the IQR are the range of interquartile of the applied attributes, knowing that Q
1, Q
3, and the IQR belongs to R
M. It is important to process the data by filling in the missing or blank values after outlier rejection, as this affects the classifiers with incorrect predictions. After the data became continuous without entering outliers, the null and absent values were processed by the average values of the enrolled features, as shown in Equation (5) [
51].
The Z-score normalization was performed based on rescaling parameters such that the normal distribution with zero mean and one variance were achieved. As shown in Equation (6), the term standardization (S) refers to the process of reducing the skewness of the data distribution.
where the enrolled FV (
I,
) ∈ R
M, where
is the mean, and the standard deviation is
σ ∈ R
M.
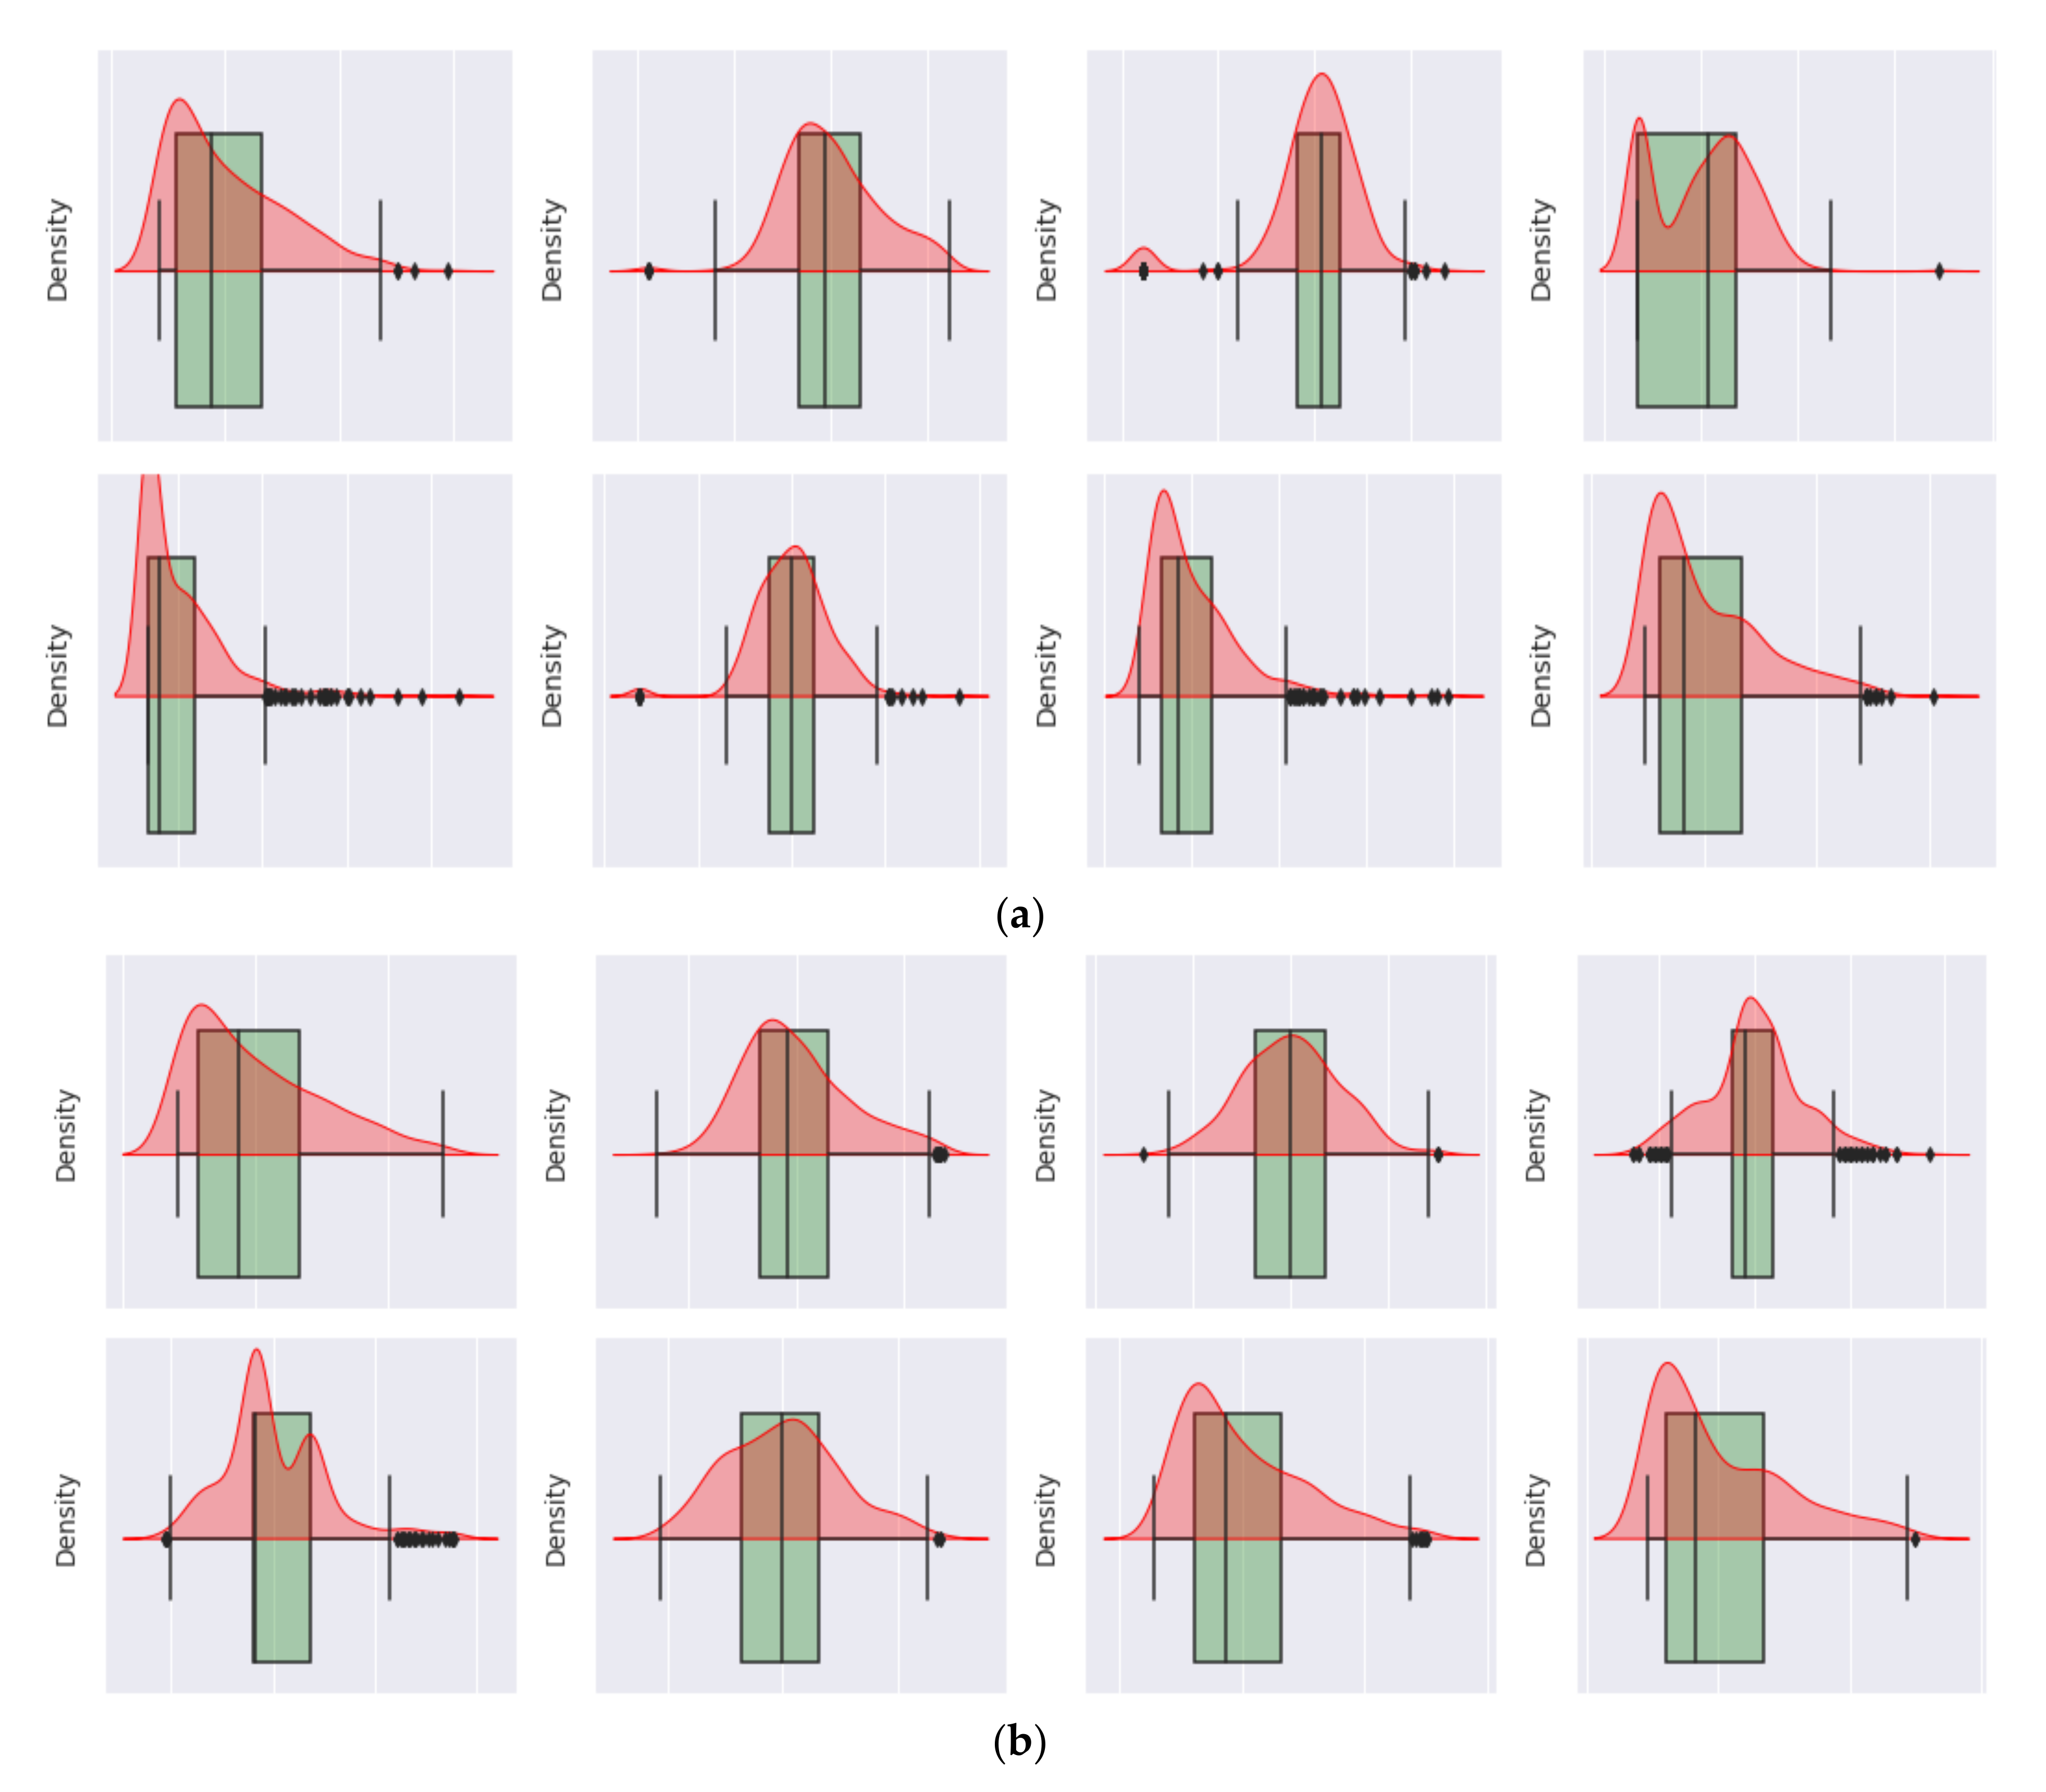
The statistical analyses in
Figure 4 show that the correlation of the features with the intended results is enhanced after imputing the missing outlier rejection values, wherever the correlation coefficient has improved significantly, particularly for A3, A4, and A5. The benefit of feature selection is an improved correlation. The classifiers’ accuracy increases as the dimension of the feature increases. However, as the domain of the feature increases without increasing the sample size, the efficiency of the classifiers needs to be improved. In machine learning, such a scenario is known as overfitting. The space of the feature becomes denser and denser because of the curse of dimensionality, forcing the classifiers to be overfitted and lose functional generalizability [
52].
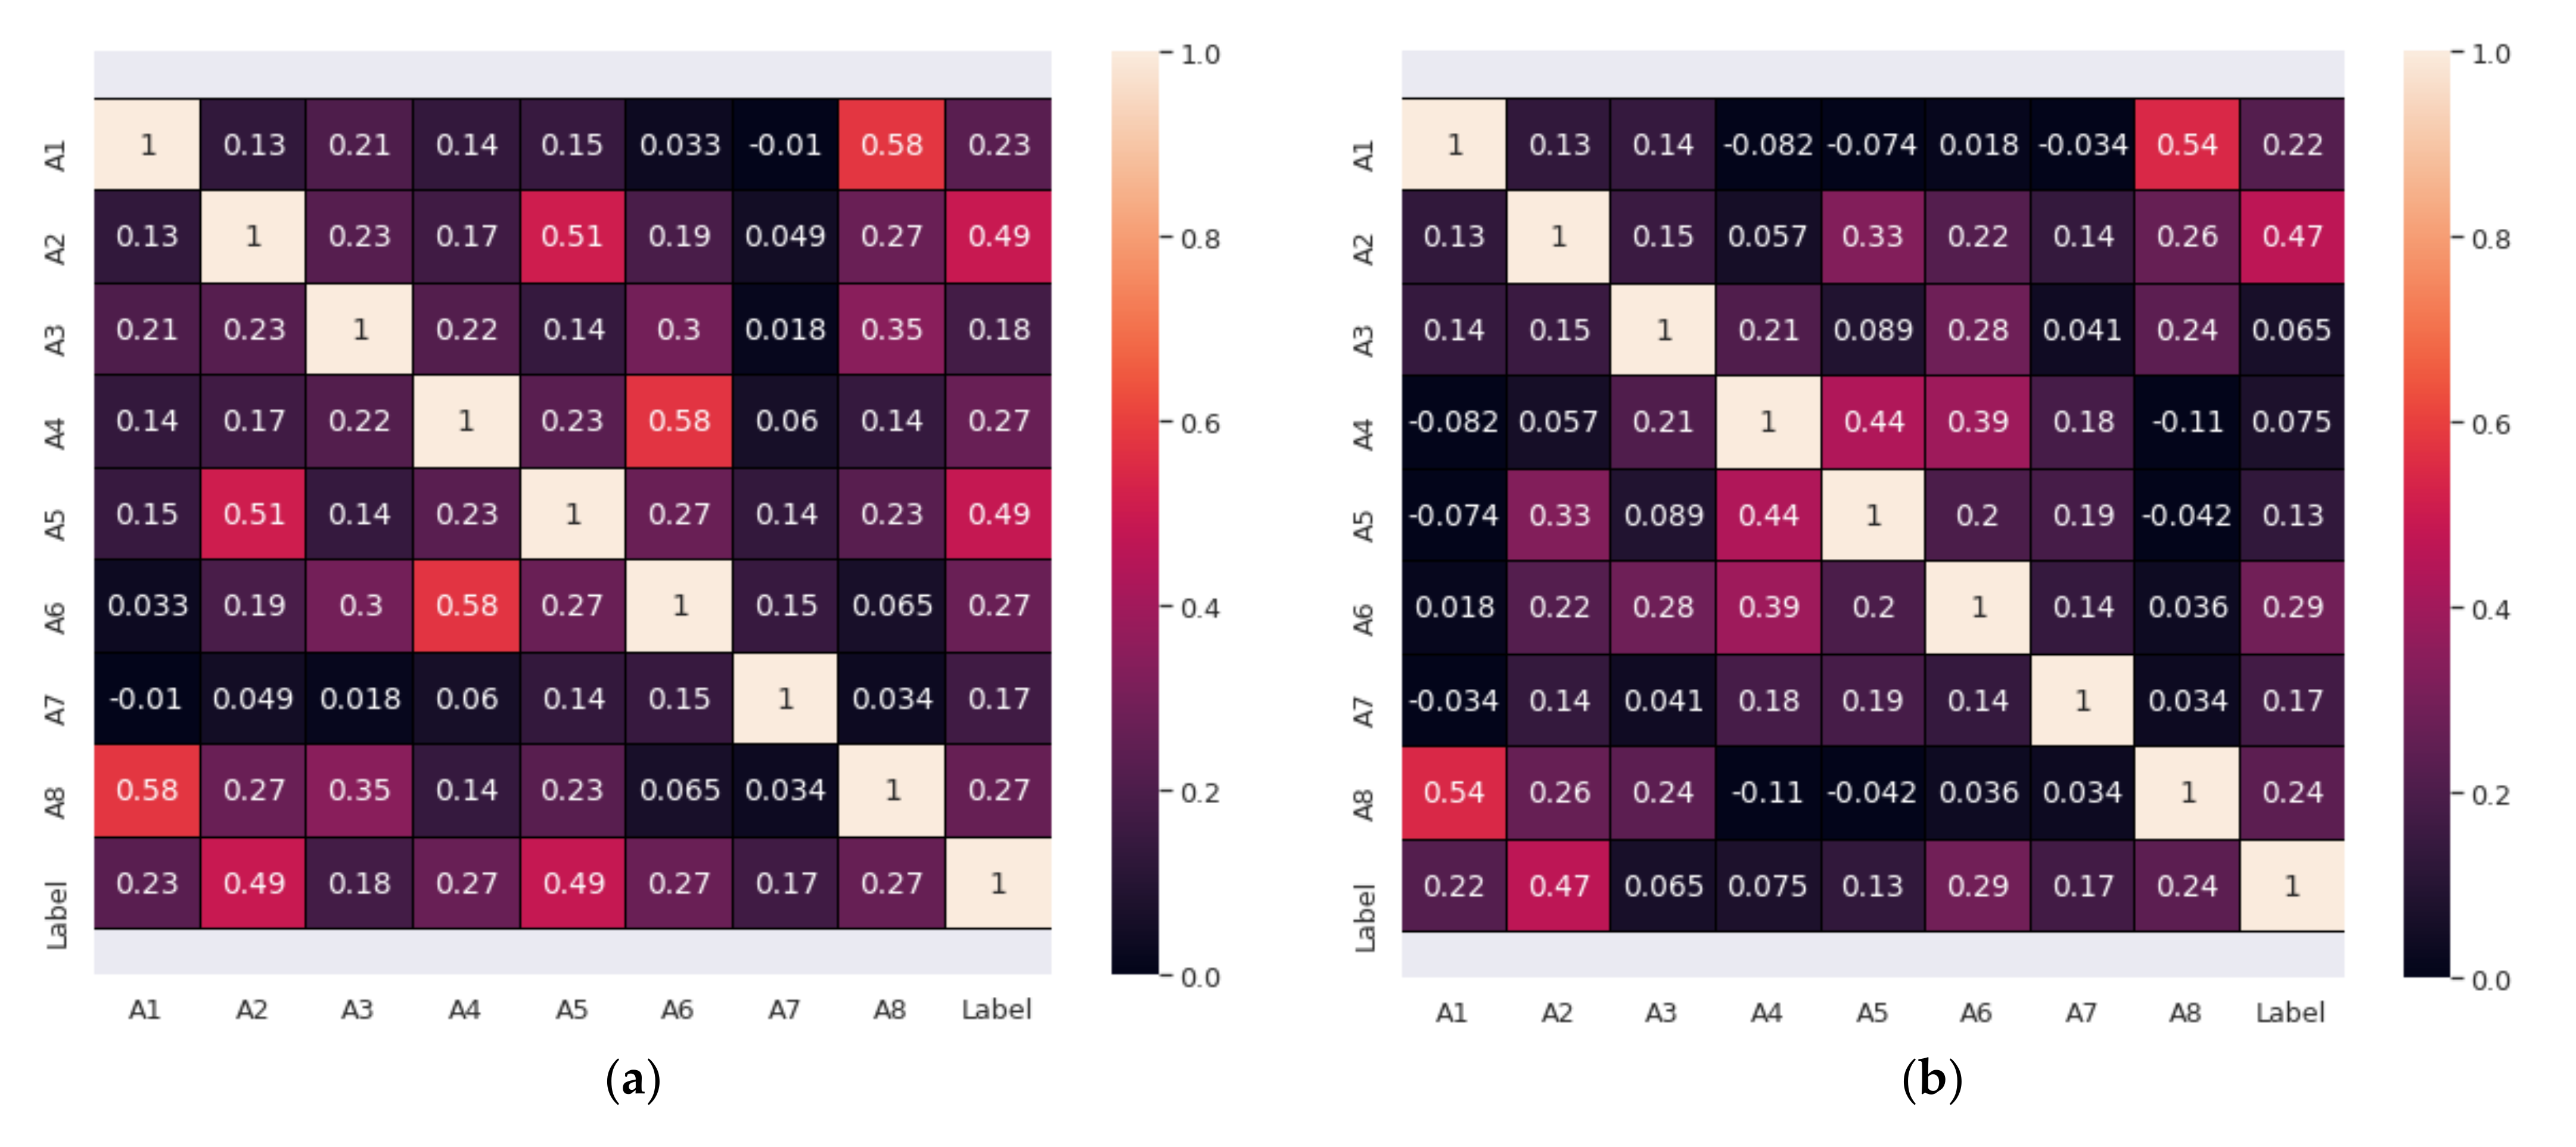
However, feature standardization is unlikely to provide a guarantee of significant improvement in many ML models, such as the NB model. The correlation’s confusion matrix combines the results of outlier rejection and imputation of missing values. The confusion matrix that represents the correlation of features based on the applied PIDD dataset before and after processing is shown in
Figure 5.
4.3. The Proposed Fuzzy KNN (TFKNN) Based on Uncertainty
Based on the discovered research gap of the regular fuzzy KNN, Algorithm 1 demonstrates the steps of the standard fuzzy KNN classifier that has been proposed by Keller et al. [
49]. It is based on calculating the membership value using Equation (8) in line 10. It has complexity estimated as
O(
kn2d), where
k represents the number of available cluster(s),
n represents the number of available instance(s), and
d represents the dimensionality of the instance data. Their proposal has been widely used for classification based on measuring the distance of instance (x) between different available classes. The algorithm works to indicate the belief degree of classification in a simulation of the expert’s experience and knowledge. The proposed fuzzy KNN works on handling the trade-off between classification accuracy and operational law for detecting diabetes. In [
49], Keller et al. have proposed a fuzzy KNN that differ from the regular classic fuzzy KNN in terms of the membership function. In which, they have used Equation (8) instead of Equation (7) as the membership function. This change in the membership function allows instance (
x) to be assigned in each class based only on the distance from the class prototype. We use the uncertainty membership function, Equation (9), instead of Equation (8) to enhance the fuzzy KNN classification for the PIDD. If we deal with the belief degree (i.e., classification output) by probability theory, it will lead to wrong decisions. However, decision-making in the health system is critical, and the fuzzy set is not suitable for unsharp concepts. We need to enhance the uncertainty theory that is mainly characterized by the membership function and operation law.
Let us consider that Equations (7) and (8) are two available empirical membership functions by two domain experts. These empirical values can be applied using
to make it easy for the model to generalize or adapt to a variety of possible ranges and to distinguish between the decisions. Hence, the membership value of instance (
x) can be defined using Equation (10) as follows:
where
where
In turn,
is an uncertainty member function for instance (
x). The proposed function has been widely accepted as effective for forecasting classification groups and applicable in a wide range of applications. The proposed membership function is used as a judgment or decision-aiding. Algorithm 2 has the same time complexity as Algorithm 1, determined by
O(
kn2d).
| Algorithm 2. Fine-Tuning Fuzzy KNN based on Uncertainty (TFKNN). |
| | Input: instance |
| | Output:Ɩ class Label |
| 1 | BEGIN |
| 2 | Input , vector to be classified. |
| 3 | Initialize . |
| 4 | DO UNTIL (distance from each prototype to computed) |
| 5 | Compute distance from to . |
| 6 | Increment . |
| 7 | END DO UNTIL |
| 8 | Initialize . |
| 9 | DO UNTIL ( assigned membership in all classes) |
| 10 | Compute |
| 11 |
|
| 12 | Compute |
| 13 |
|
| 14 | Compute |
| 15 | Increment |
| 16 | END DO UNTIL |
| 17 | Classify : set Ɩ |
| 18 | END |
We have calculated the time and space complexity of the different classification algorithms in terms of Big-O. Even though fuzzy KNN has the worst value(s) at the complexity levels, it is the best in practice in terms of evaluation metrics. In turn, to achieve higher accuracy, precision, recall, and f-measure, we have to pay the cost in terms of complexity. The fuzzy KNN computes the uncertainty membership function for each instance before classification relative to the complete number of instances, which yields a square computation relation. This relation is very important to determine the relative class of the current instance versus other algorithms that classify it without inspecting the uncertainty value of the instance for each category. We think it is acceptable to be in the second level of complexity compared to improvements in the classification metrics at the healthcare system, where decisions are critical and have a direct impact on human care. Hence, the uncertainty and membership function helps improve predictions about human lives and health decisions to be more reliable, accurate, and concise. Additionally, as a plan to overcome this challenge(s), there is scheduled work to re-arrange the membership function of TFKNN to be referenced pre-computed once as a lookup map, as shown in
Table 5.
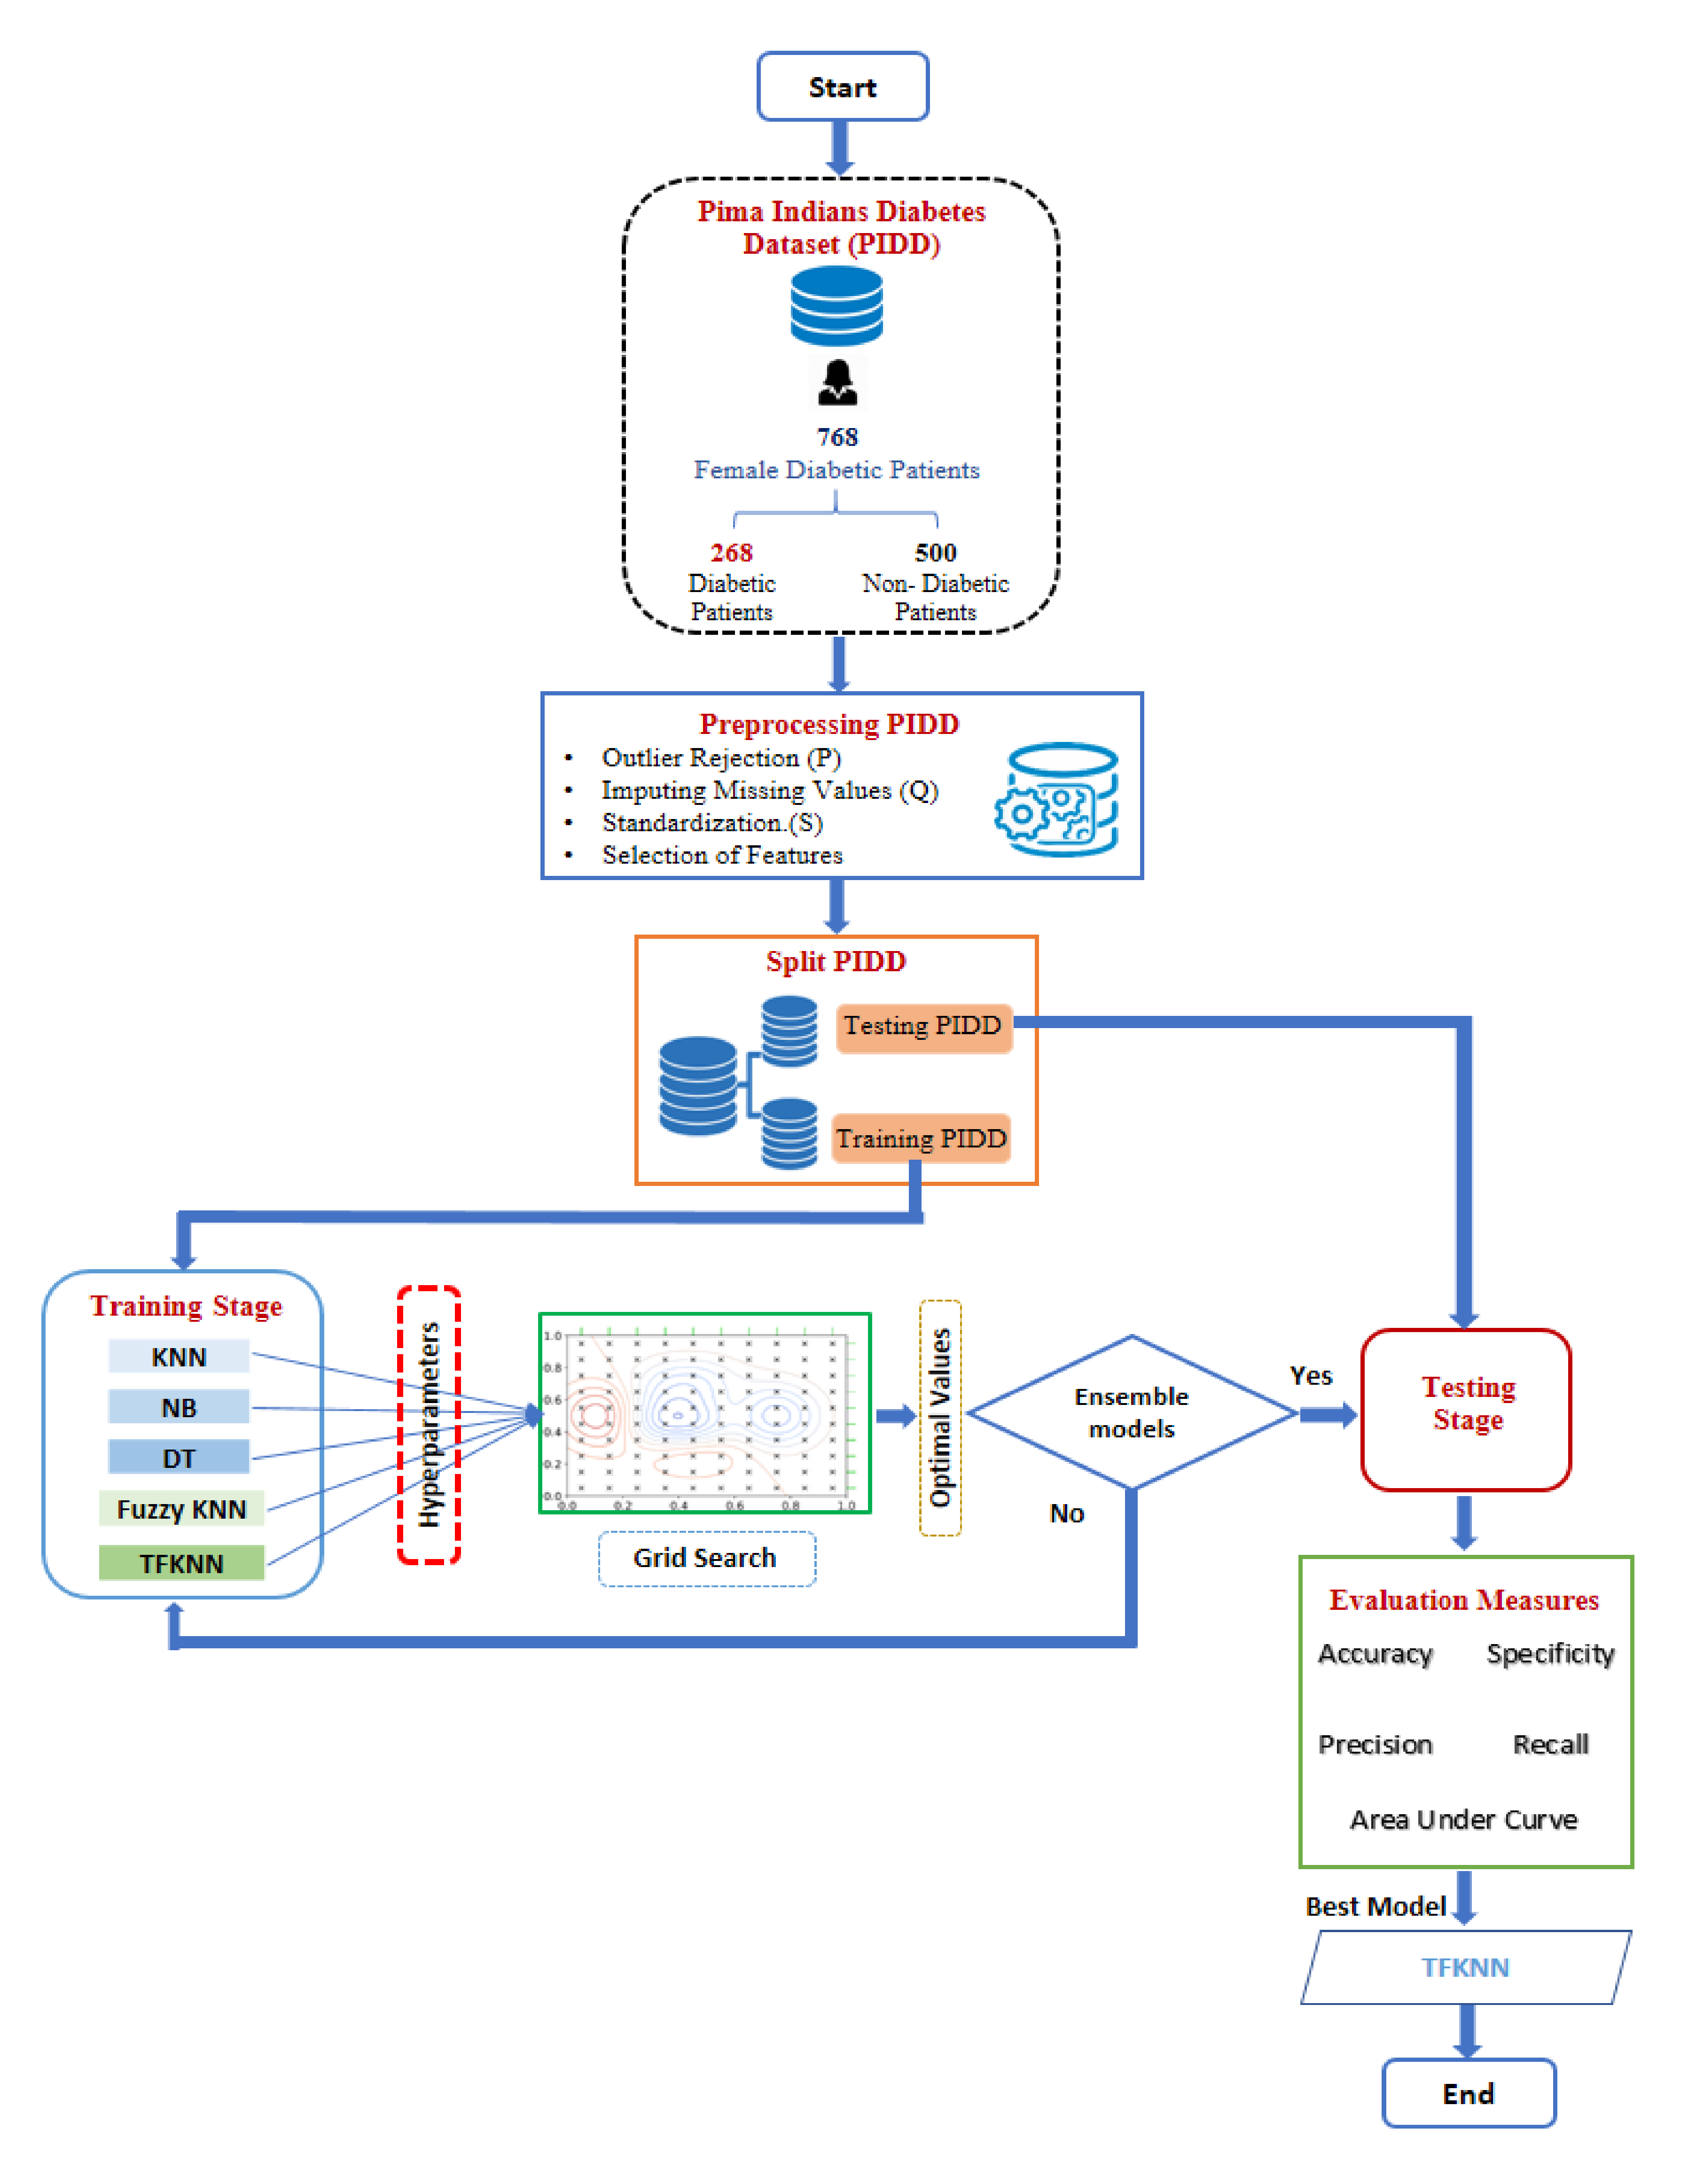
Because the proposed TFKNN based on uncertainty membership function has hyperparameters, it is subject to performance leakage due to their value(s). In turn, the proposed TFKNN is tuned by a grid search to identify the best values of the hyperparameters for deriving the optimal performance in terms of classification metrics for PIDD. The fine-tuning process includes searching for optimal values of other regular classifiers such as KNN, NB, and DT to benchmark and empirically analye the classifiers’ performance in response to the fine-tuning.
Figure 6 represents the fine-tuning and proposed workflow of the proposed algorithm, TFKNN, Fuzzy KNN, KNN, NB, and DT for classifying diabetes in pregnant women. The major objective of the fine-tuning procedure is to improve the classification metrics like accuracy, recall, and AUC. In the workflow, the input dataset is evaluated using the cross-hold validation method; this is described below in detail as a hybrid mix of cross-fold and hold-out validation methods. The validation method supports the avoidance of overfitting problems and estimates the hyperparameters to derive the best accuracy rate. During the preprocessing phase, a correlation matrix is calculated to investigate the relationship between the features, as well as the relationship between the input features and the class label. The membership values for each sample are calculated using Equations (7)–(9), as all the neighbors closest to the class are distinguished based on their closeness to it. For each instance (x), a Euclidean distance is estimated for each category in the classification space, and the appropriate membership value(s) is assigned using a suitable membership formula. The process is iterative and repetitive until unclassified instance(s) are assigned to a class.
4.4. Cross-Hold Validation Method
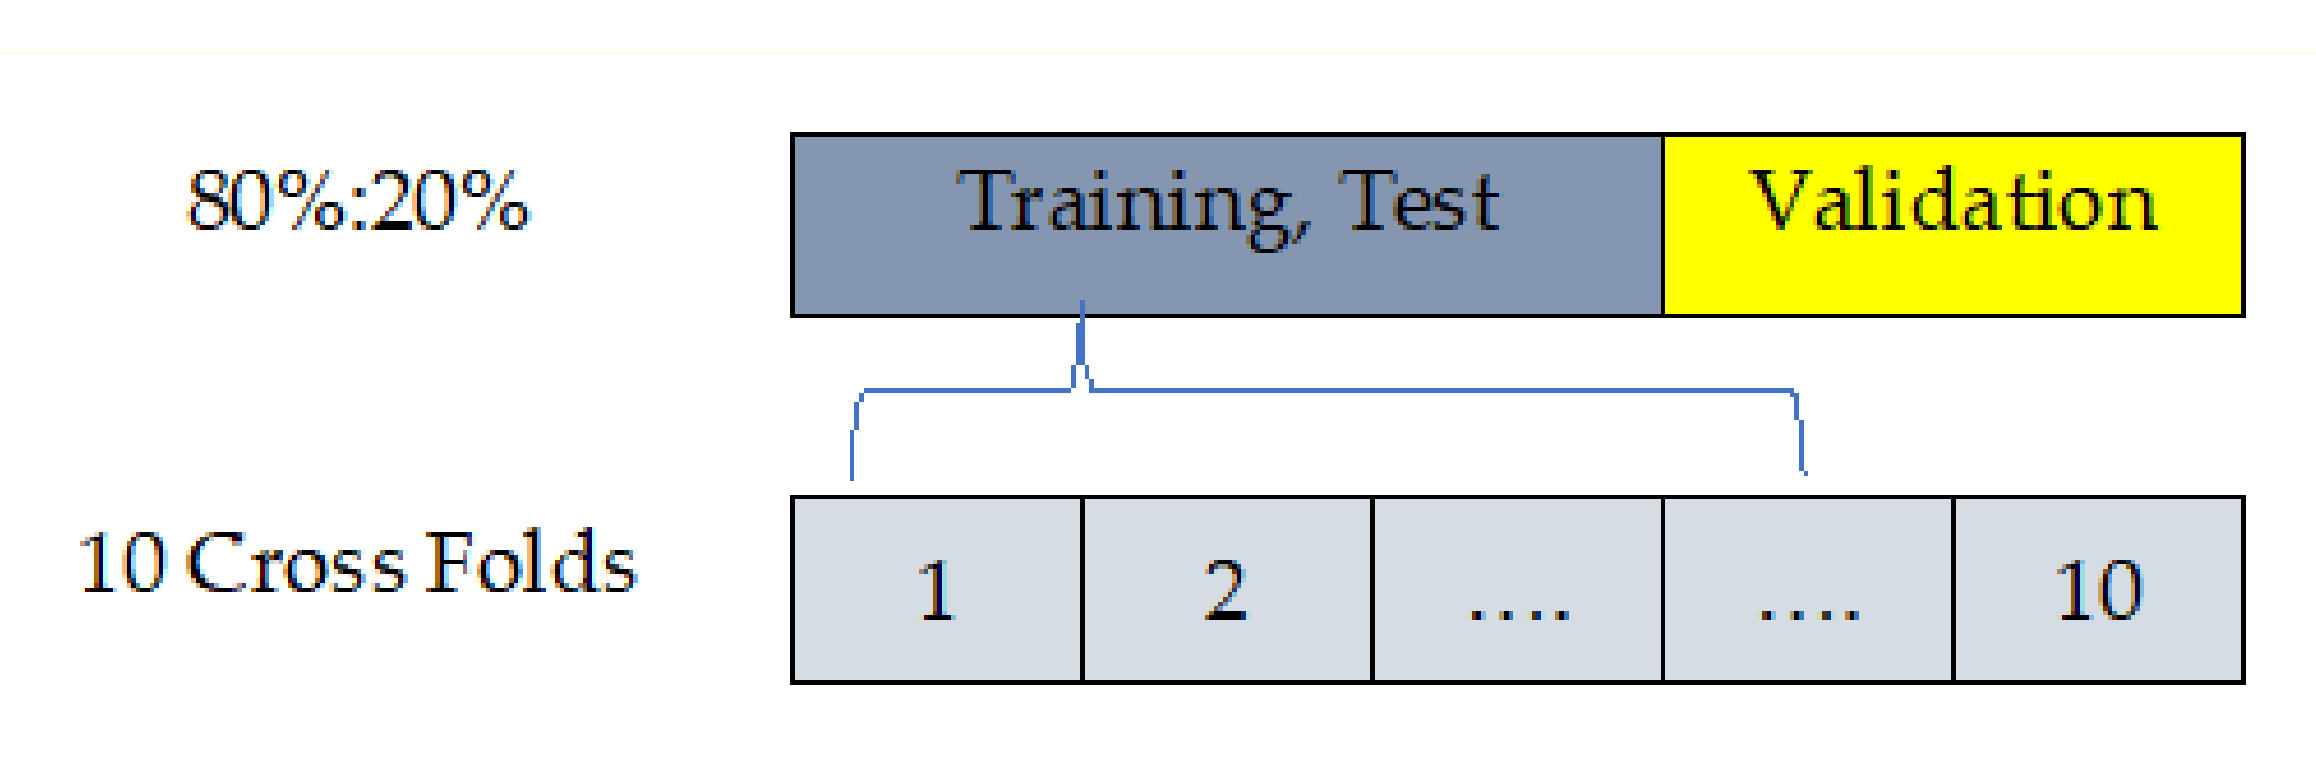
Although [
53] has proposed a work based on the cross-validation strategy using the PIDD, in practice, with the PIDD including 768 instances, there are 2 different challenges. First, the cross-fold validation is perfect during the computation of model parameter(s), but the error is the average of values across folds. Second, the hold-out method fits the testing model based on an evaluation using test samples and is not recommended to adjust the parameter(s) of the model as shown in
Figure 7.
Hence, the proposed algorithm is conducted based on the training/testing strategy to overcome the interference of the stated challenges. It is worth mentioning that the training/testing strategy (80% and 20%, respectively) truly reflects the effectiveness and power of the proposed algorithm. We have designed a custom validation method to overcome the drawback of each method and gain the promotion of each method. Although the dataset samples can be used for cross-fold validation instead of hold-out validation, we decided to apply training then tested and validated using 80% as 10 cross-folds (training, testing) and 20% hold out (validation).
5. Empirical Evaluation: Setup and Findings
This section is designed to explore the effectiveness of the proposed algorithm and the compared state-of-the-art methods. During the phases of the proposed algorithm, different phases are conducted to enrich the efficiency of the proposed algorithm, and various ML methods, such as KNN, NB, DT, and fuzzy KNN, that have indeed been trained and evaluated.
5.1. Experimental Setup
In this section, we demonstrate all experiments on the Python 3.7 development environment using a package of software executed and performed on a workstation machine with the following specifications: processor Core i7, RAM 16 GB, and 4G-GT NVIDIA with GPU-740 m.
Table 6 shows the key-value pair for the hyperparameters that will be tuned using grid search.
5.2. Selected Ensemble Model
The ensemble of machine learning models X [
54,
55] is a recognized technique for improving performance via several classifiers. The collection of the outcome from various ensemble models could truly enhance prediction precision [
56]. Equation (10) was used to perform weighted aggregation as follows:
where
Wj is the corresponding AUC, j is the classifier number,
represents confidence values
, and
i is the class number. Each model’s output, Y
j (
j = 1, 3,…,
n = 4) ∈ R
C, assigns C (diabetes or not) confidence values
∈ R. Therefore, the final class label C
i of the unobserved data is determined such that for the ensemble X ∈ R
C, the
= max (Y (X)).
5.3. Evaluation Matrix
Machine learning model performance can be measured using the confusion matrix demonstrated in
Table 7, and
Table 8 describes the evaluation metrics of the results. Four classification algorithms were used: KNN, NB, DT, and fuzzy KNN, which were compared in terms of classification accuracy, specificity, precision, recall, and AUC. The classification metrics TP, TN, FP, and FN were used to calculate classification accuracy, specificity, precision, recall, F1 score, and AUC.
5.4. Evaluation and Analysis of the Results
This section is designed to discuss and analyze the results of the proposed algorithm as well as the compared state-of-the-art methods.
Table 9 represents the experimental results of different ML classifiers. Each experiment is illustrated using different classification performance metrics, including precision, recall, accuracy, specificity, and area under the curve (AUC). However, each classifier is supported using a confusion matrix for the consolidation of the stated values. Each classifier is trained and validated using the PIDD in the training set and test set at 80% and 20%, respectively.
Table 9 represents the results of TFKNN, fuzzy KNN, NB, and DT regarding the proposed workflow in
Figure 6.
Table 9 holds notable values of the fine-tuning in terms of precision, accuracy, recall, specificity, and AUC. More precisely,
Table 9 demonstrates the validation results and compares the different behaviors of the model using different validation test sets. Due to the AUC, the proposed TFKNN classifier achieves the highest table average value of 94.13, exceeding the nearest classifier by +3.37. Hence, the proposed TFKNN is considered an excellent classification model that can diagnose patients with the disease or condition based on the test. Since precision and recall are generally inversely related, the TFKNN achieves a high precision rate and a low recall percentage, indicating the model’s ability to discriminate diabetes patients from non-diabetes patients, achieving the intended objective of the overall analysis.
In contrast, the fuzzy KNN model investigates recognizing non-diabetes cases versus diabetes cases. Hence, we can observe the benefits of noticed accuracy rates where the proposed TFKNN achieves 90.63% as the best classifier beating the rates of the decision tree, fuzzy KNN, and NB. The major objective of the ML model is rejecting healthy patients and accepting unhealthy patients without a condition. Regarding the specificity proportion, the proposed TFKNN achieves the highest rate for correctly rejecting healthy patients without a condition versus others.
Even though decision trees and NB do not compete for classifiers over precision, recall, specificity, and accuracy, they compete well over the average AUC. The decision tree is considered the second most excellent model in discriminating healthy and unhealthy patients, and the NB model sets in the tail with a minor differentiation by 4.21 from the TFKNN classifier.
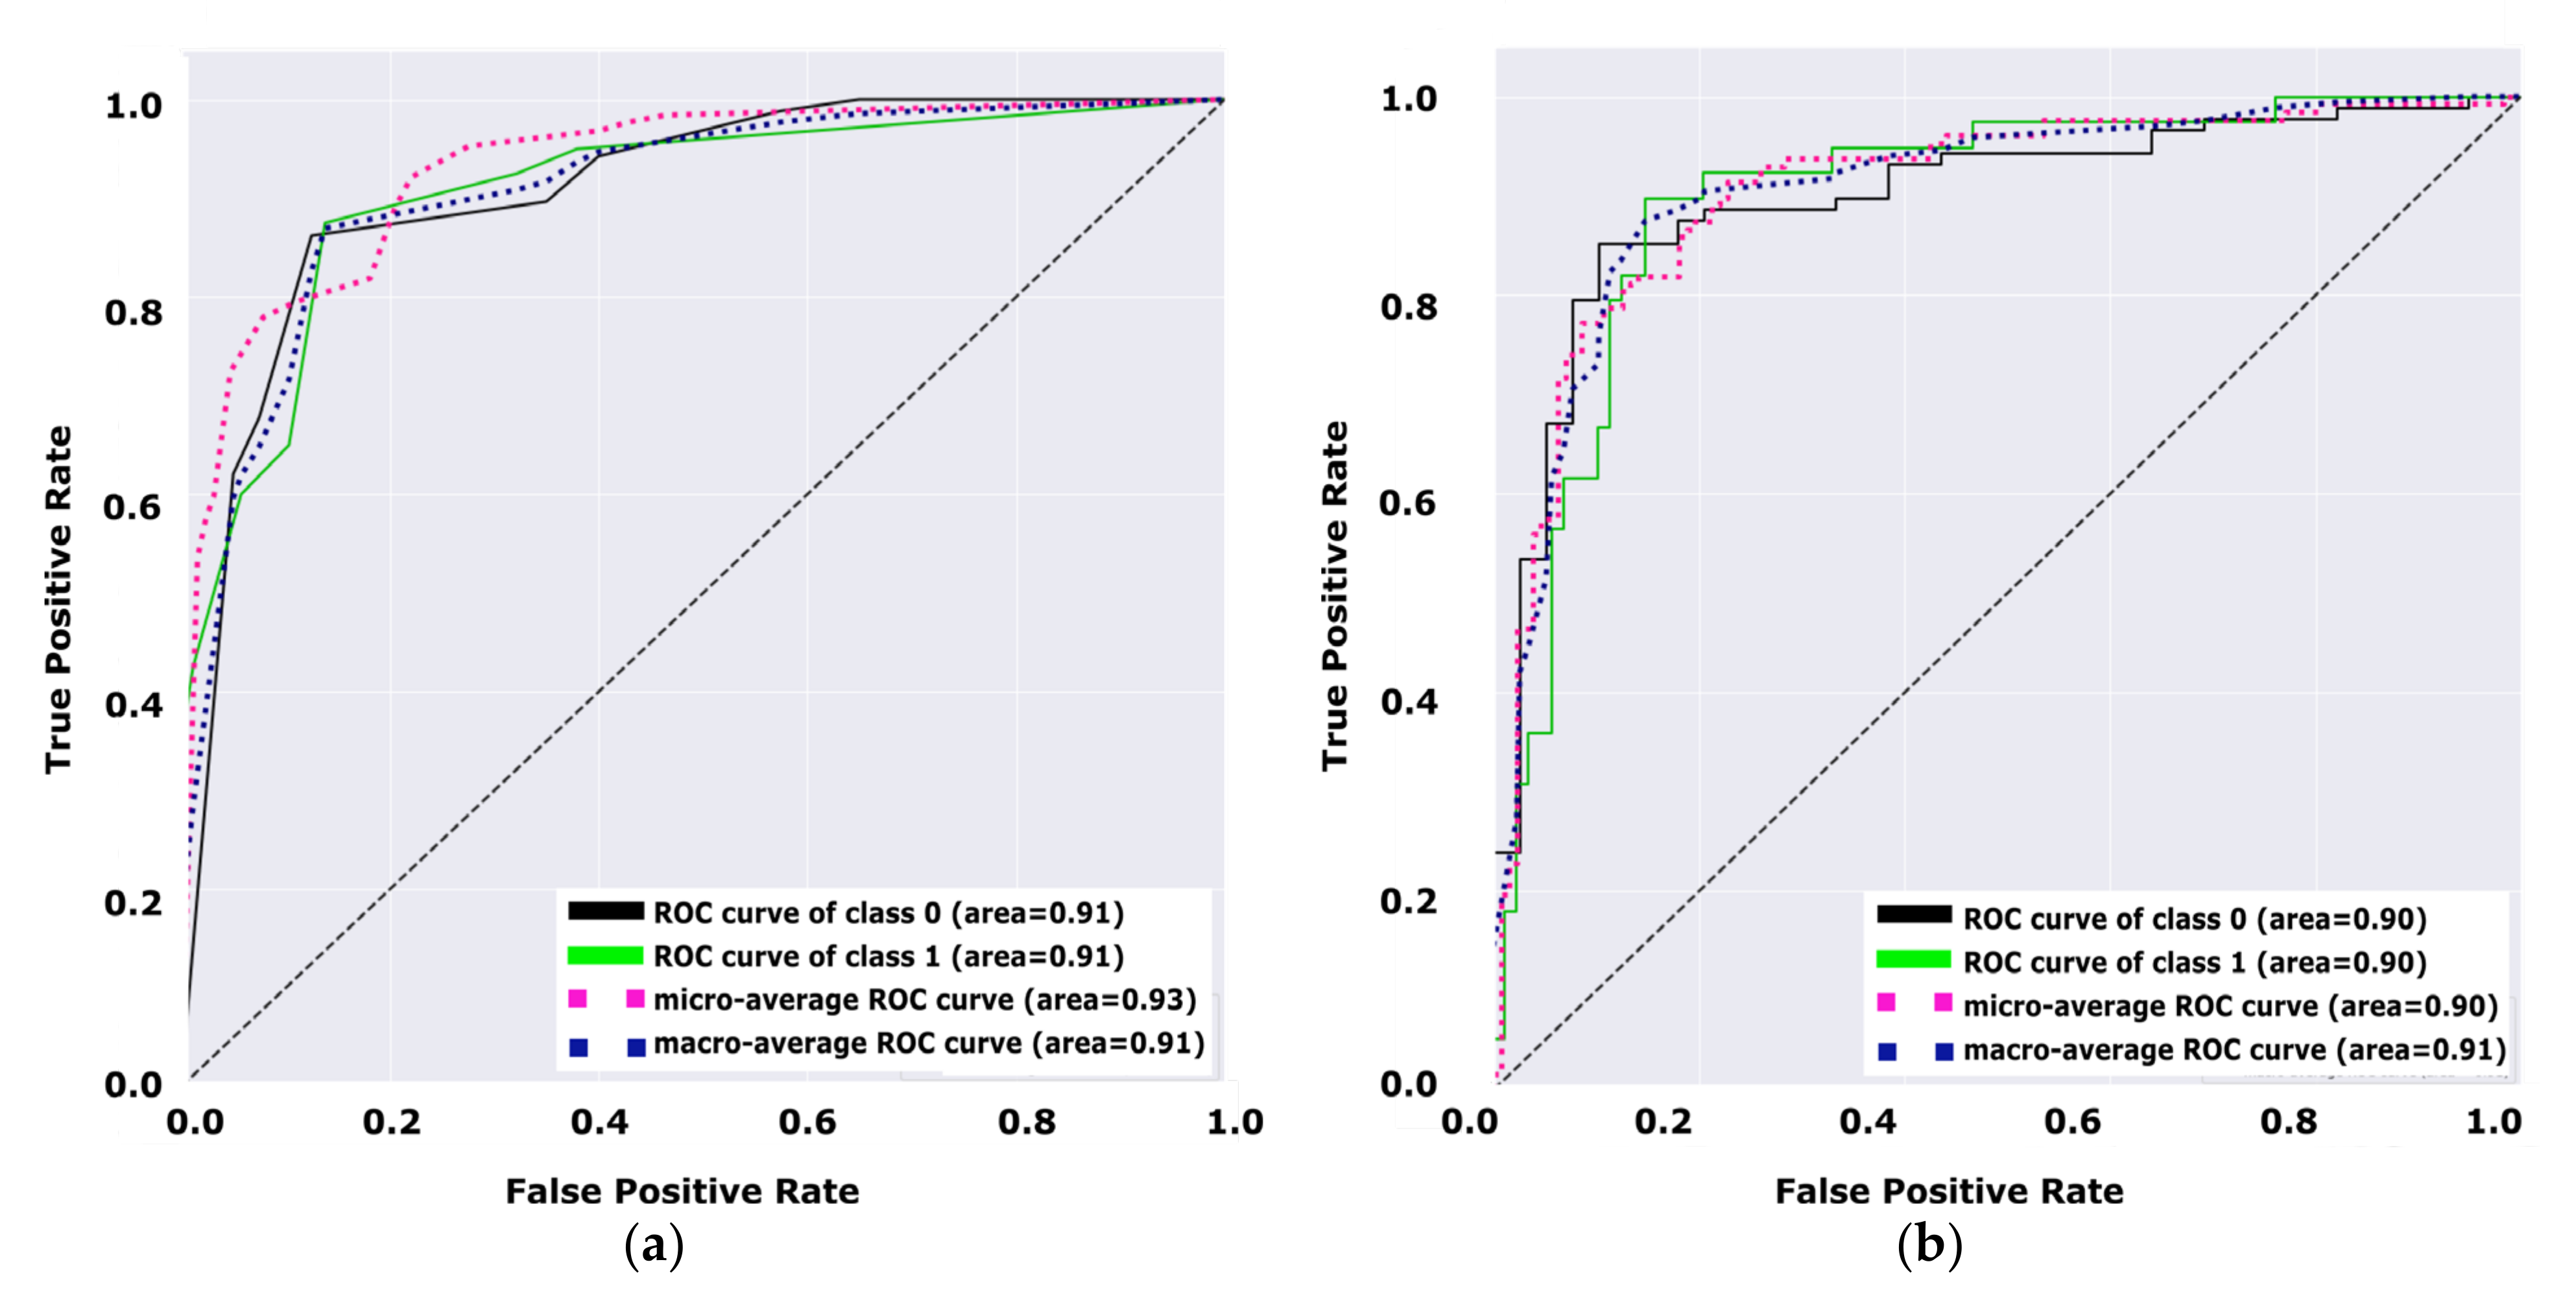
Figure 8 illustrates the performance of the decision tree model versus the performance of the NB model. Both figures (a, and b) demonstrate the performance of the model for diabetes and non-diabetes (e.g., the unhealthy class and healthy class, respectively) classes.
Figure 8a shows that the total average of the ROC curve for both classes is 0.91, while the total average of the ROC curve for both classes in
Figure 8b is 0.90. Hence,
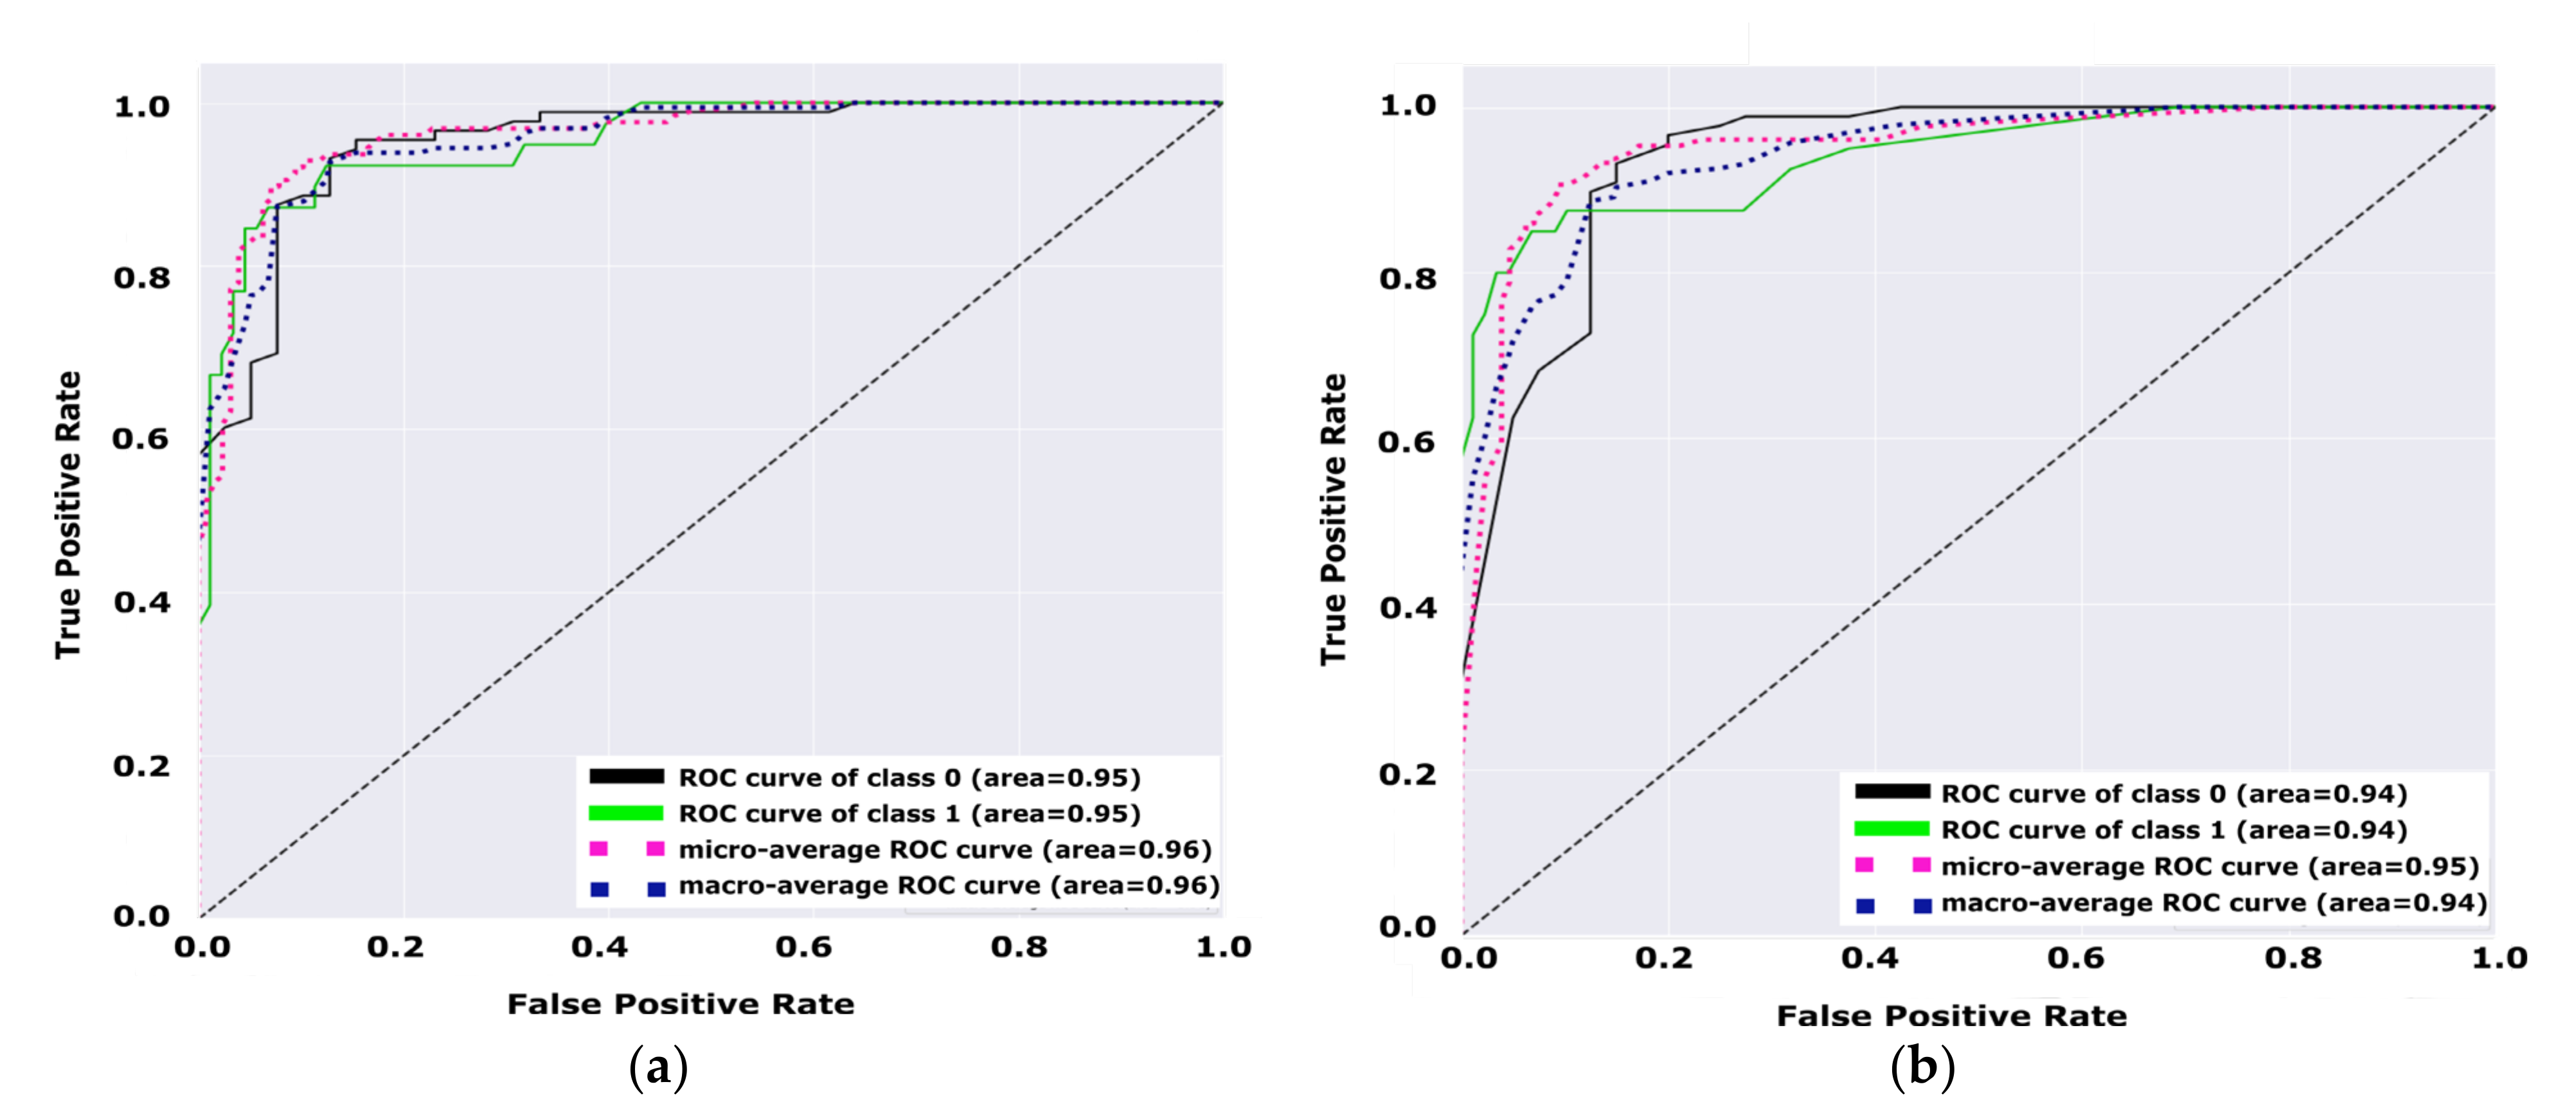
Figure 8 indicates that the decision tree is a better model than the NB model by +0.01 due to the average ROC curve for both classes. From the receiver operating characteristic curve investigated in
Figure 9, we can notice that the test set variation of the area under the curve for the TFKNN is more than Fuzzy KNN, which confirms the strength of the TFKNN classifier using this test set. However, the overall AUC performance from
Table 10 shows that the TFKNN is the superior classifier for diabetes prediction on the PIDD.
Figure 9 demonstrate the performance of the model for diabetes and non-diabetes (e.g., unhealthy class and healthy class, respectively) classes, such that
Figure 9a shows that the total average of the ROC curve for both classes is 0.95, while the total average of the ROC curve for both classes in
Figure 9b is 0.94.
Table 10 demonstrates a comprehensive comparative analysis of different classification models. Each model is trained for the prediction of healthy versus unhealthy instances. Furthermore,
Table 10 shows the micro-average ROC curve versus the macro-average ROC curve for different classification algorithms. From this table, it could be noticed that TFKNN achieves better rates than fuzzy KNN in micro- and macro-average ROC curve analysis. Depending on
Table 9, we can confirm that TFKNN is better than other classifiers in average experiments instead of a single beating during a certain test set in the ROC curve analysis. Therefore, the prediction of diabetes based on the PIDD using a TFKNN classifier achieves good results compared with other traditional classifiers.
Table 11 has been designed to illustrate the empirical analysis of the noted results by different KNN classifiers, fuzzy KNN, uncertainty Fuzzy KNN, different decision tree, and different naïve Bayes classifiers versus the tuned classifier in terms of precision, recall, accuracy, and specificity. The results have been investigated using the 80:20 hold-out validation method and 10-fold cross-validation method.
Table 12 demonstrates the global superiority of the proposed uncertainty fuzzy KNN classifier in terms of precision, accuracy, and specificity. For recall, the fuzzy KNN has global superiority at 95.45% versus all others regardless of the validation method.
5.5. Discussion
To present a comprehensive evaluation of the proposed fine-tuned classifiers, we have evaluated the dataset versus different recent works of literature,s including shallow classifiers and deep learning models. A comparative study is given in
Table 12 between the state-of-art methods with the proposed fine-tuned hyperparameter model based on fuzzy KNN, DT, KNN, and NB. The comparative study depends on determining the confusion matrix precision, recall, F1 score, and accuracy for the applied PIDD dataset.
Table 12 concludes the importance and impact of preprocessing efficiency on classification performance.
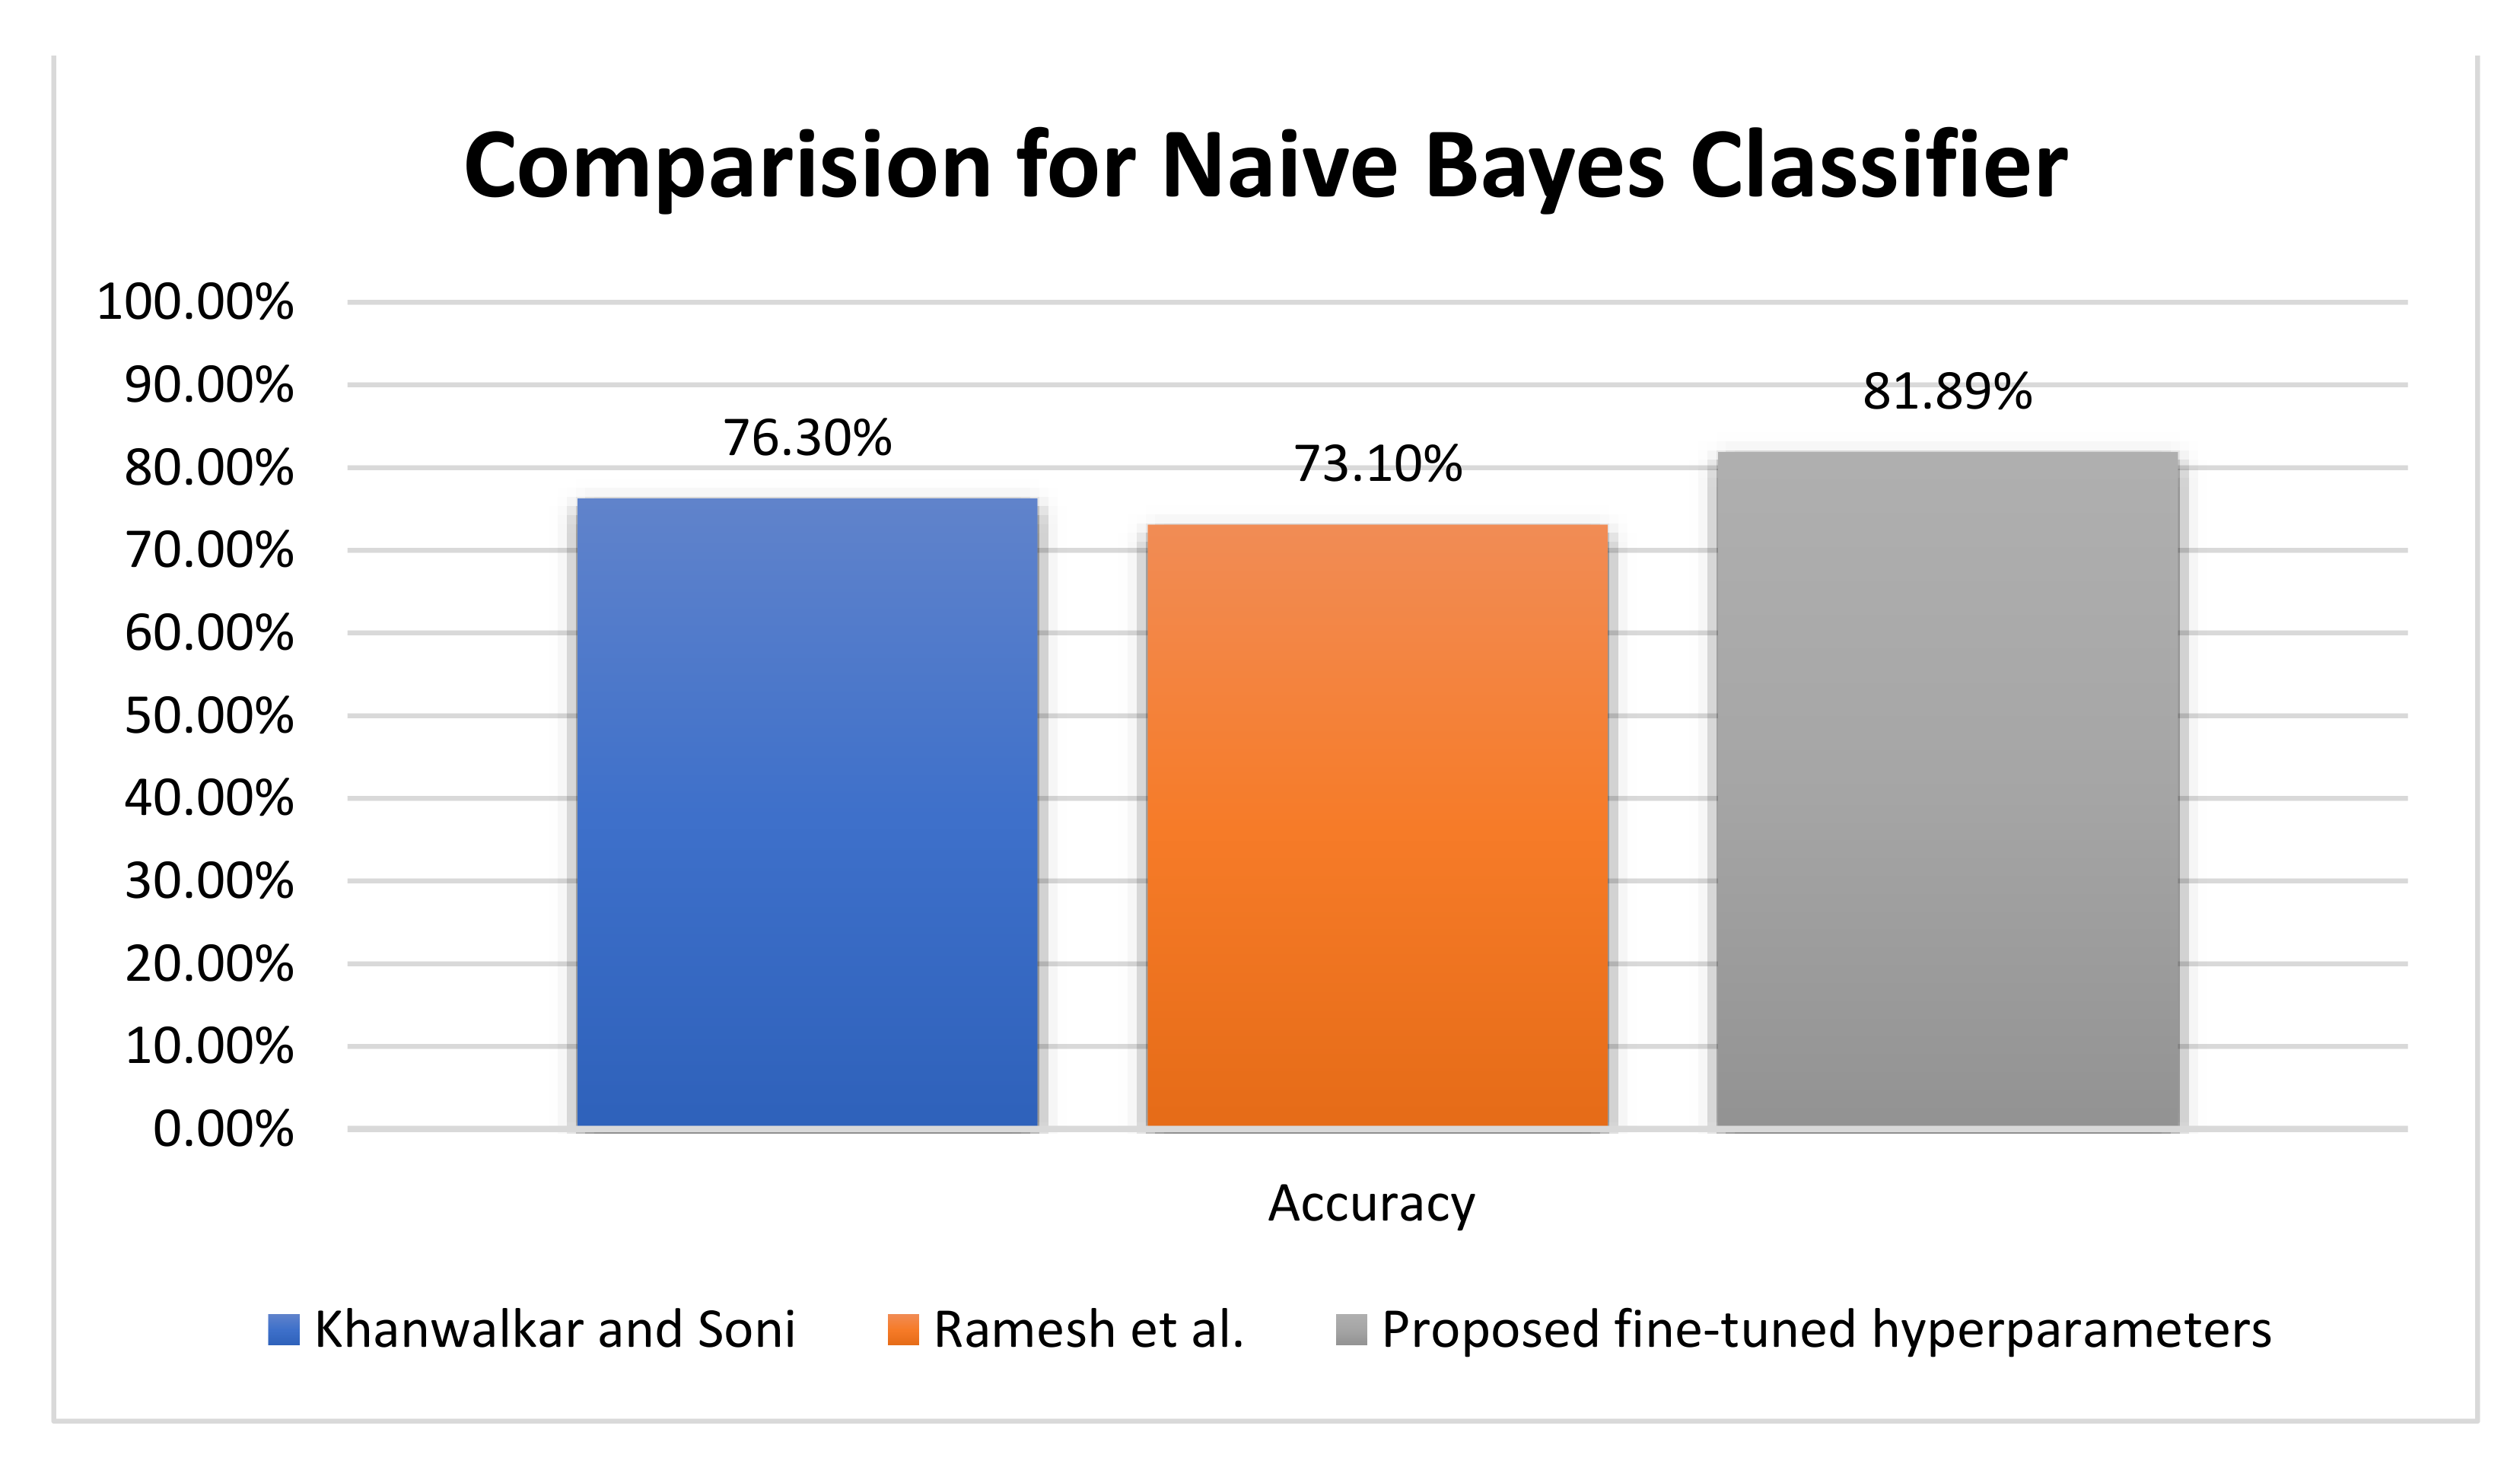
As shown in
Figure 10, based on the NB classifier, Khanwalkar and Soni [
25] and Ramesh et al. [
29] achieved accuracies 76.30%, and 73.10%, respectively, compared with the proposed 81.89% NB accuracy. On the other hand, Bhoi et al. [
26] achieved an accuracy of 76.80% for the logistic regression (LR) classifier, compared with Ramesh et al. [
29], who achieved an accuracy of 73.30% with LR. Furthermore, Khanwalkar and Soni [
25] introduced sequential minimal optimization, which achieved an accuracy rate of 77.34% versus 90.63% by fuzzy KNN and 90.55% by KNN for the proposed fine-tuned classifier.
The improvement of the proposed algorithm is a result of perfect preprocessing, feature quality analysis, and hyperparameter optimization using the grid search algorithm.
Figure 10 represents a comparative evaluation of the NB classifier using the PIDD regarding the accuracy metric. The proposed fine-tuned classifier achieves better accuracy by +6.39%, and the evaluation of the proposed records the testing output of the experiment.
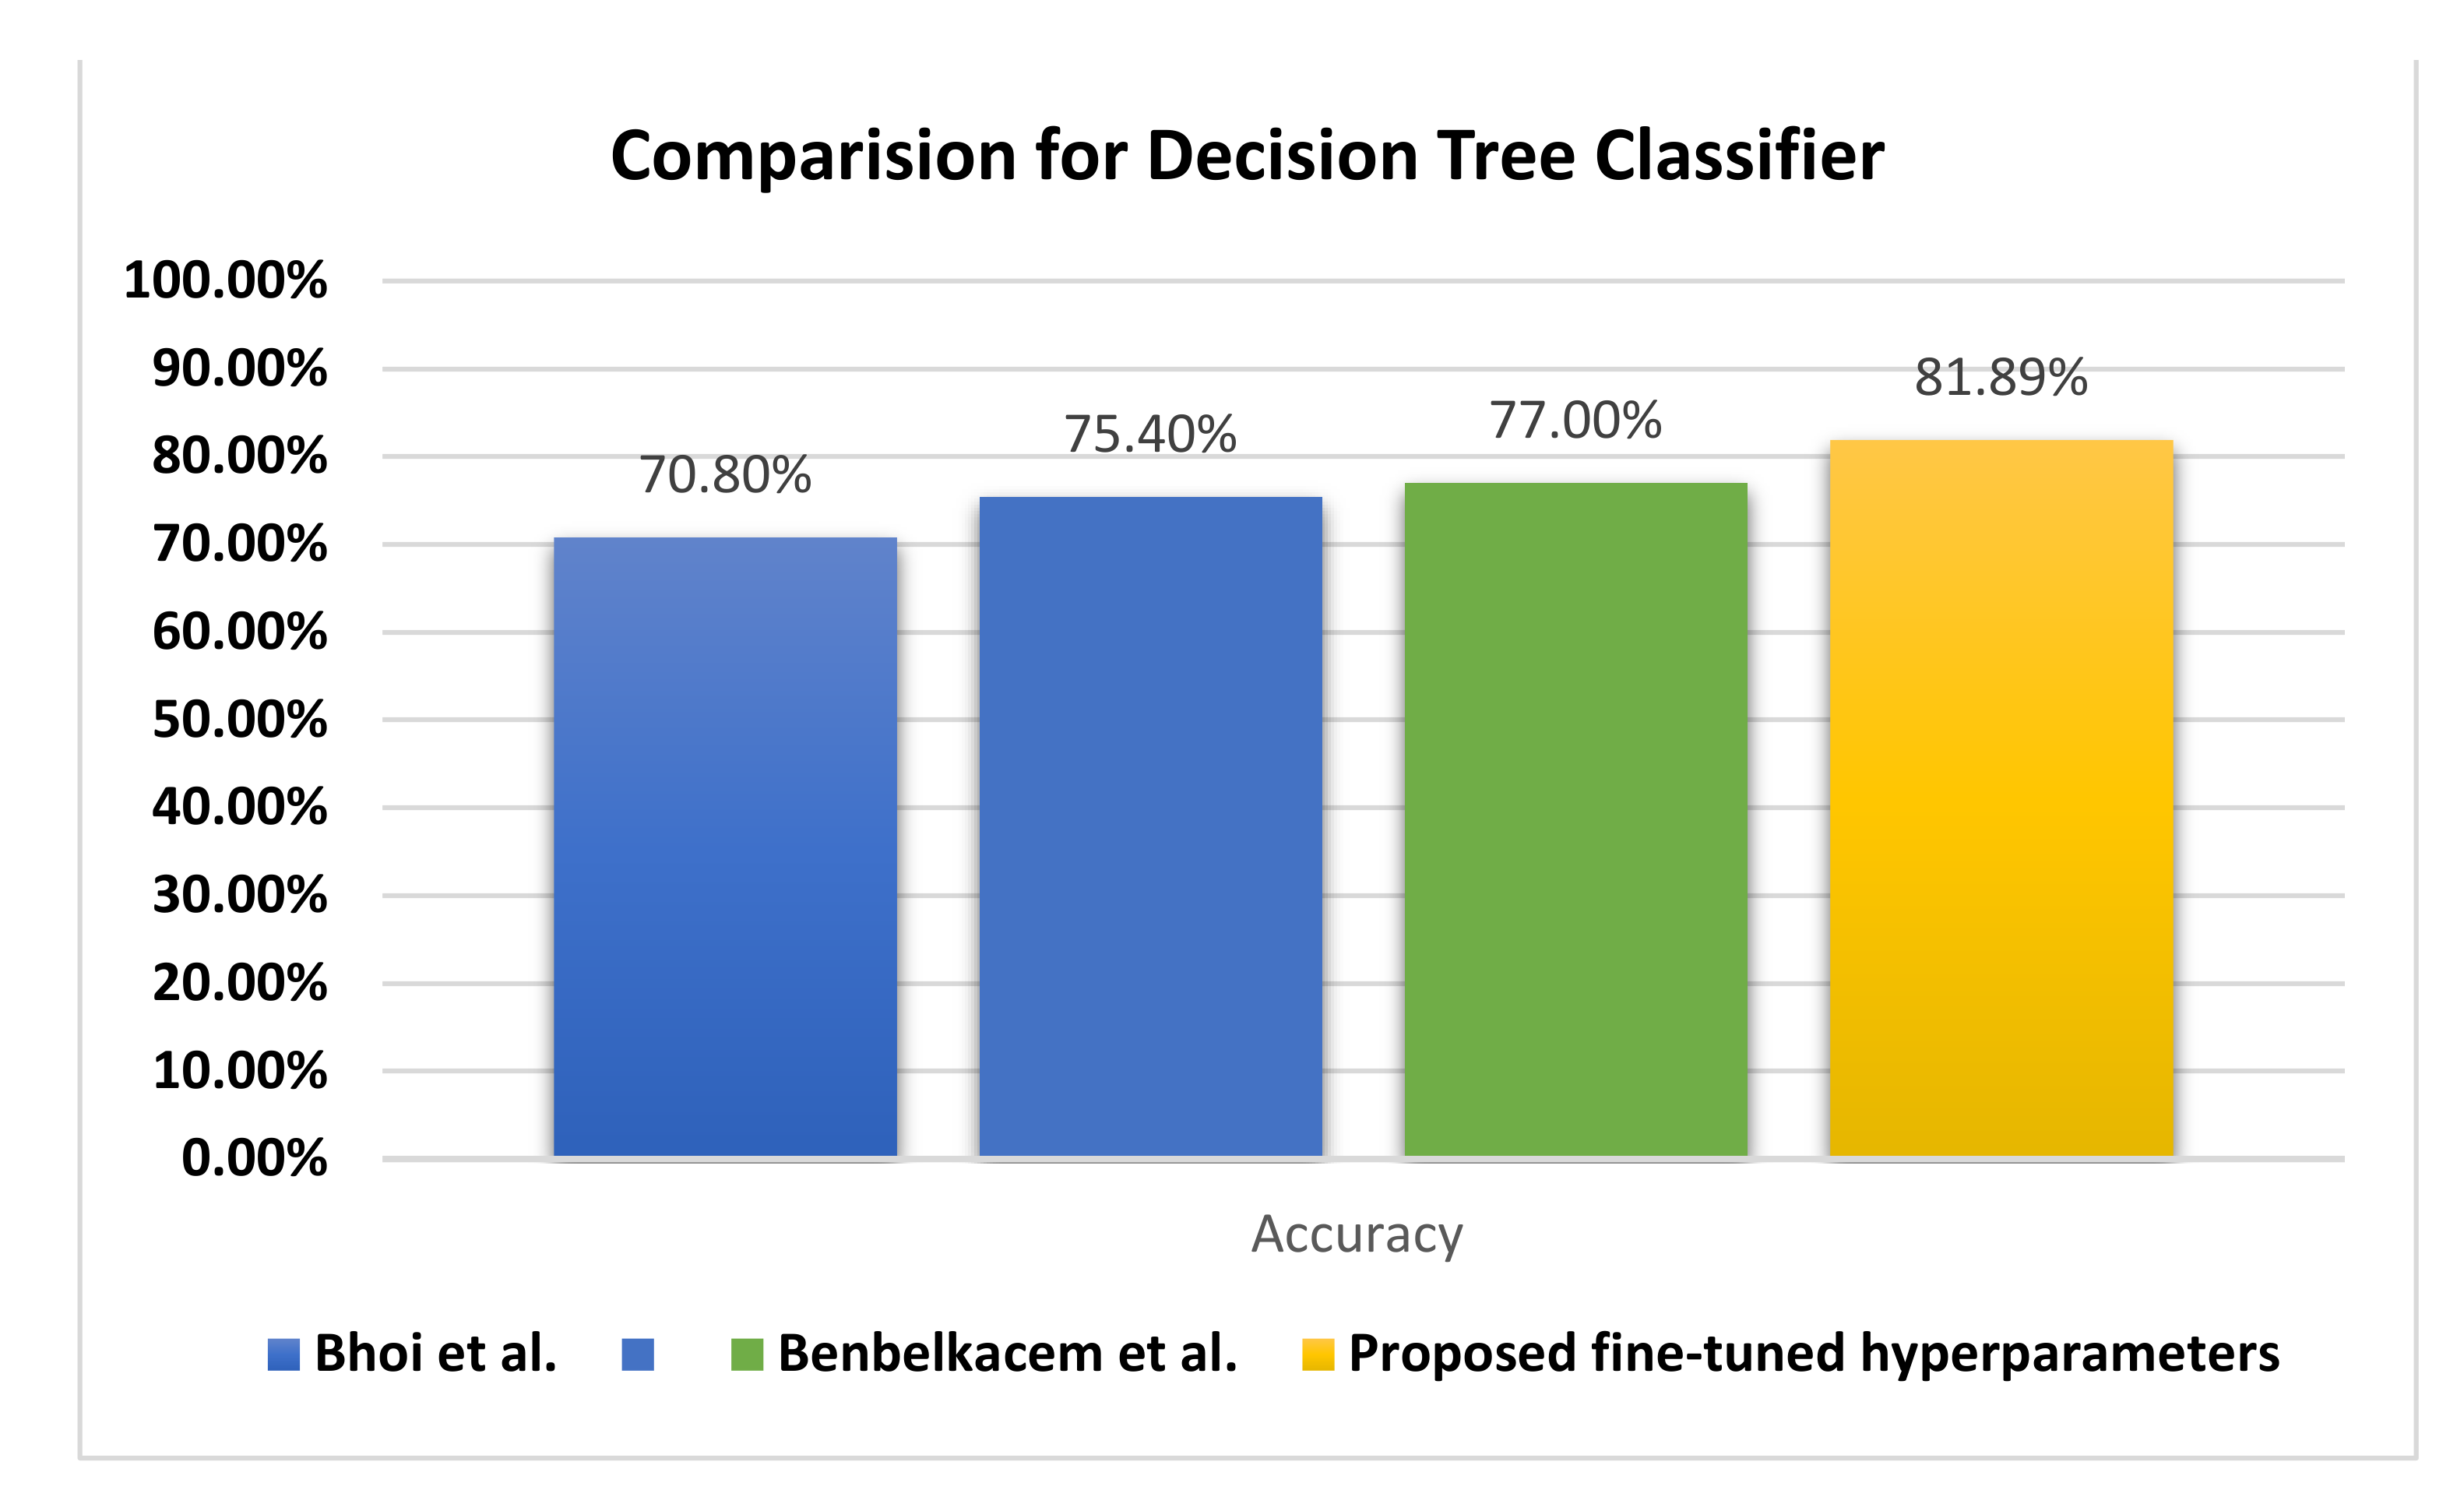
Figure 11 illustrates the behavior of the DTRF classifier regarding the accuracy, in which the proposed fine-tuned classifier achieves +4.89% better accuracy than the decision tree by Benbelkacem and Atmani [
27] and the classical decision tree random forest by Bhoi et al. [
26].
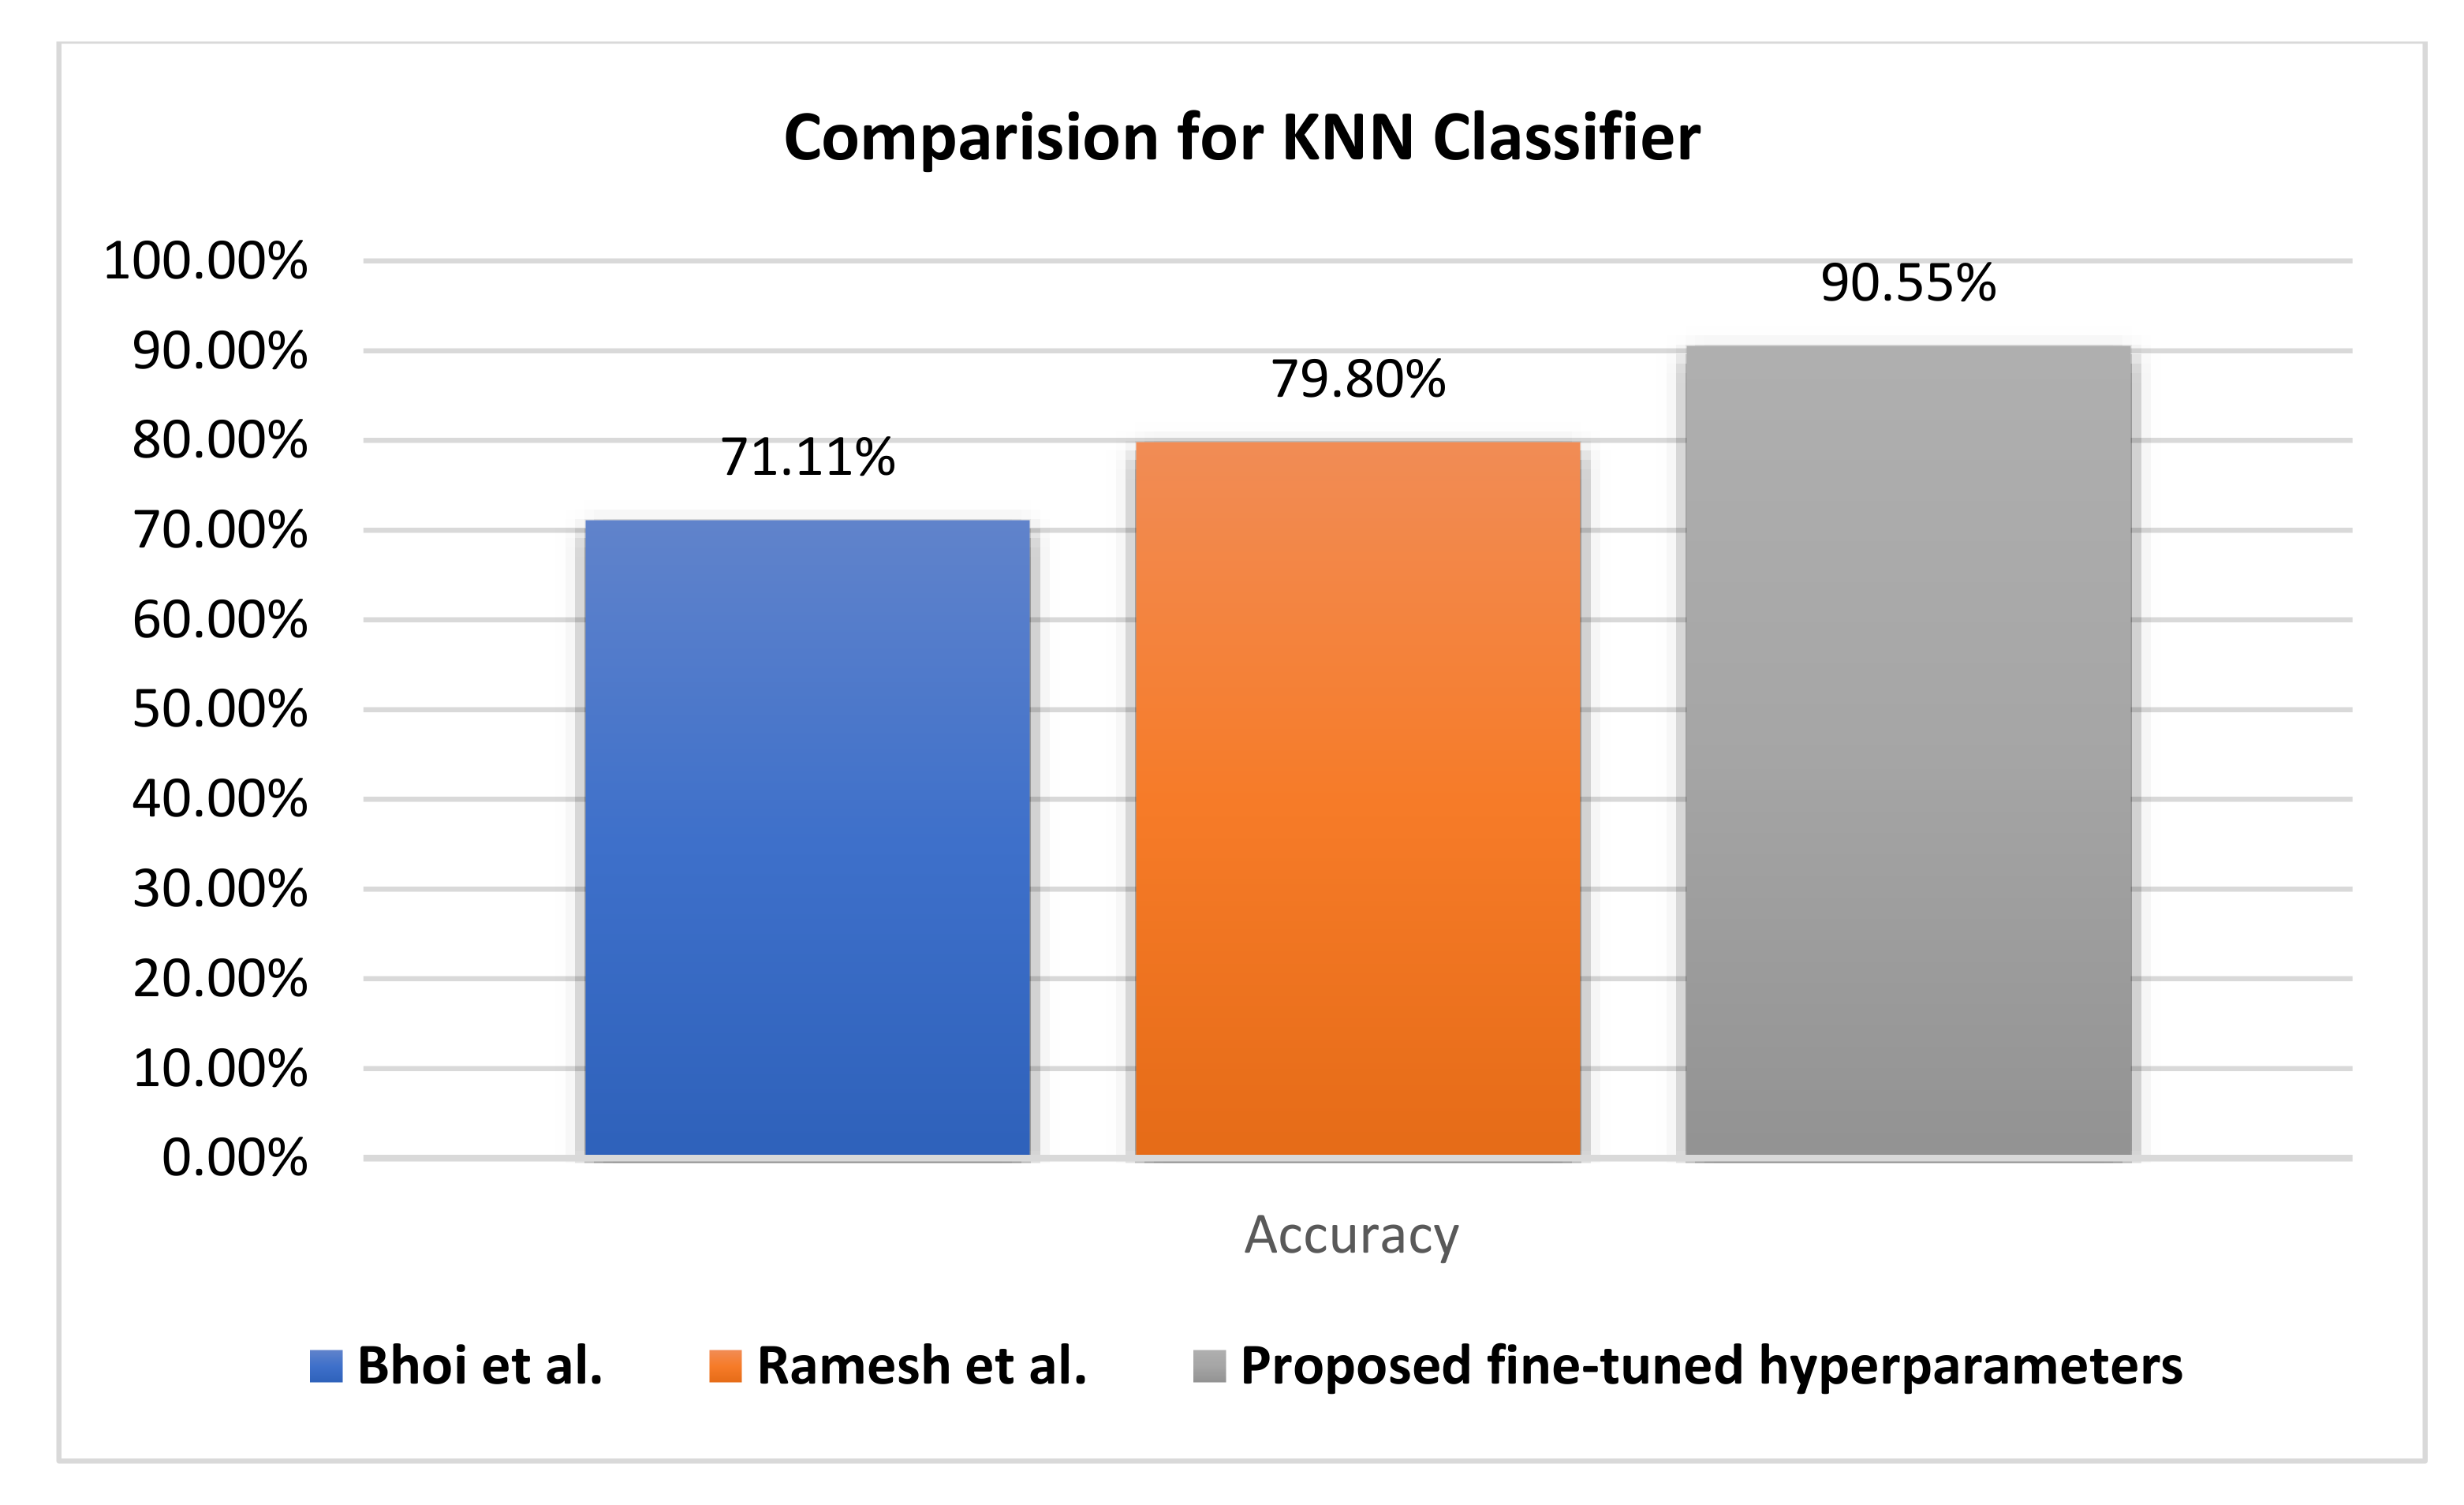
Figure 12 compares the evaluation of different KNN classifiers using the PIDD. The proposed method reaches a 90.55% accuracy rate, improving it by +17.39. Generally, the KNN classifier reaches higher accuracy rates than other classifiers. Hence, resolving the uncertainty issue of KNN leads to the improvement of the fuzzy KNN model.
As investigated in
Table 12, KNN is better than the fuzzy KNN in terms of the recall; however, this is not the major role of medicine assistance systems. However, the precision and F1 score are more confidential for correctly rejecting healthy patients without a condition versus others. In terms of precision, the fuzzy KNN is better than KNN, confirming the ability of our proposed model to discriminate diabetes patients from non-diabetes patients. Even though there are slight improvements in KNN over fuzzy KNN regarding the F1 score, overall, the accuracy of the fuzzy KNN is 90.63%, which is better than the 90.55% achieved by the KNN. The average value of the area under the curve (AUC) is 94.13% for fuzzy KNN and 90.55% for KNN, which proves the superiority of the fuzzy KNN classifier for uncertainty values.
In this work, we have supported our study with comparison and analysis with some of the deep learning. After focused research using academic research engines, we have compared and analyzed some studies using the PIDD and different deep learning methods which were published recently [
34,
36]. Furthermore, we have survived different available taxonomies for modeling diabetes using the PIDD. We further agree with the opinion about the comparison and analysis with some deep learning methods; however, let us demonstrate more about PIDD meta-data and its relation to deep learning methods.
In PIDD, the normal and abnormal instances are imbalanced, which increases the probability of model biasing;
The total number of instances is 768 in PIDD, which is not fair enough to build a stable model using deep learning in the hold-out validation method. However, this can be used in cross-fold validation, although this method is not used for our experiment;
Despite the importance of PIDD data preprocessing, which was clarified and documented in the proposed methodology, it was inferred for its importance for building a classification model before and after the preprocessing. However, the researchers who dealt with data processing and the creation of a deep learning model did not deal with data preprocessing and were interested in accuracy only, which negatively affected the confidence in the applied results of their model;
The uncertainty-based membership function is tackled for outlier values which are difficult using DL approaches;
The ROCs and available AUC of the deep learning models are increased in response to a small number of cross-validation and vice versa;
The pretrained well-known models (e.g., AlexNet, VGG-16, VGG-19...etc.) which are capable of transfer learning and which are fine-tuned were not fit to help in PIDD. This facilitied deep learning model construction.
While there are slight improvements in accuracy using the deep learning approaches compared with the fuzzy KNN, the proposed approach fits the uncertainty of the data based on fine-tuned hyperparameter and grid search, leading to model stability and the uncertainty classification. The authors of [
34] designed a limited number of layers that start from one layer to four layers and used SoftMax and a rectifier activation function without fine-tuning the hyperparameters, which generally leads to instability of the results and an overfitting problem [
35]. Moreover, in [
36], even though the accuracy achieved by the authors is greater than the tuned fuzzy KNN, it is based on 5-fold cross-validation, which is considered the simplest validation approach of the machine learning pipeline. In contrast, the tuned fuzzy KNN classifier is validated randomly using hold-out training and a test set. In the same mentality, the deep learning model is subject to be affected by the number of cross-fold batches proved by the ROC figures [
57], in which the ROC values decrease with an increase in the number of validation folds.
6. Conclusions and Future Work
In real life, a model for medical diagnosis should care about accuracy and how certain the prediction is. Diabetes is considered a major chronic disease that requires stability of the model and considers uncertain areas. In turn, if the uncertainty is too high, a doctor would consider this in his decision process, which is why we consider uncertainty classification rather than classification only.
This study contains valuable information for classifying women into two different groups, diabetics and non-diabetics, using different supervised classification models. TFKNN and fuzzy KNN produced the best classification performances in terms of evaluation metrics such as accuracy, precision, recall, F1 score, AUC, and average weighted ROC. In this study, the PIDD is well analyzed and preprocessed, and the TFKNN classification model is built and boosted by hyperparameter optimization to predict diabetes in PIDD versus other classification models. Although the KNN approach achieves a higher micro- and macro-average ROC curves, the TFKNN model is the superior classifier for diabetes prediction in the PIDD based on accuracy, precision, sensitivity, and average AUC. The results indicated that the precision, recall, and F1 score of the TFKNN was 93.18%, while the obtained accuracy was 90.63. This is as compared with the fuzzy KNN, which achieved precision, recall, F1 score, and accuracy values of 91.30%, 95.45%, 93.32%, and 90.55, respectively. On the other hand, in terms of specificity, the proposed TFKNN achieved 85.00% compared with the fuzzy KNN, which achieved 79.49%s. At the same time, the average area under the curve indicated that the proposed TFKNN achieved 94.13% compared with the Fuzzy KNN, which achieved 90.55%. These numerical results all refer to the superiority of the proposed FTKNN compared with recent state-of-art methodologies.
However, the TFKNN classifier helps in handling uncertainty classification instead of crisp using a membership function that measures the estimation of loyalty for an instance to a certain class. Although the fuzzy KNN has the worst value(s) at the complexity levels, it is the best in practice in terms of evaluation metrics. Some limitations must be addressed, however, including the threshold election and hyperparameter optimization. Additionally, the uncertainty classification considers instances individually without awareness of global features and instances that are considered a challenge. In the future, we intend to support the classification model in an uncertainty mode with the explainability of machine learning and engage a global context during the learning process for medical diagnostic models of diabetes. Additionally, there is an intention to design a deep learning architecture for handling preprocessing, uncertainty classification, and hold-out validation and overcome the fuzzy KNN challenge(s) based on a scheduled work to re-arrange the membership function of fuzzy KNN to be referenced and pre-computed once as a lookup map.


 ,
, 


