
Saturation, Allowed Transitions and Quantum Interference in Laser Cooling of Solids


Abstract
:1. Introduction
2. Theory
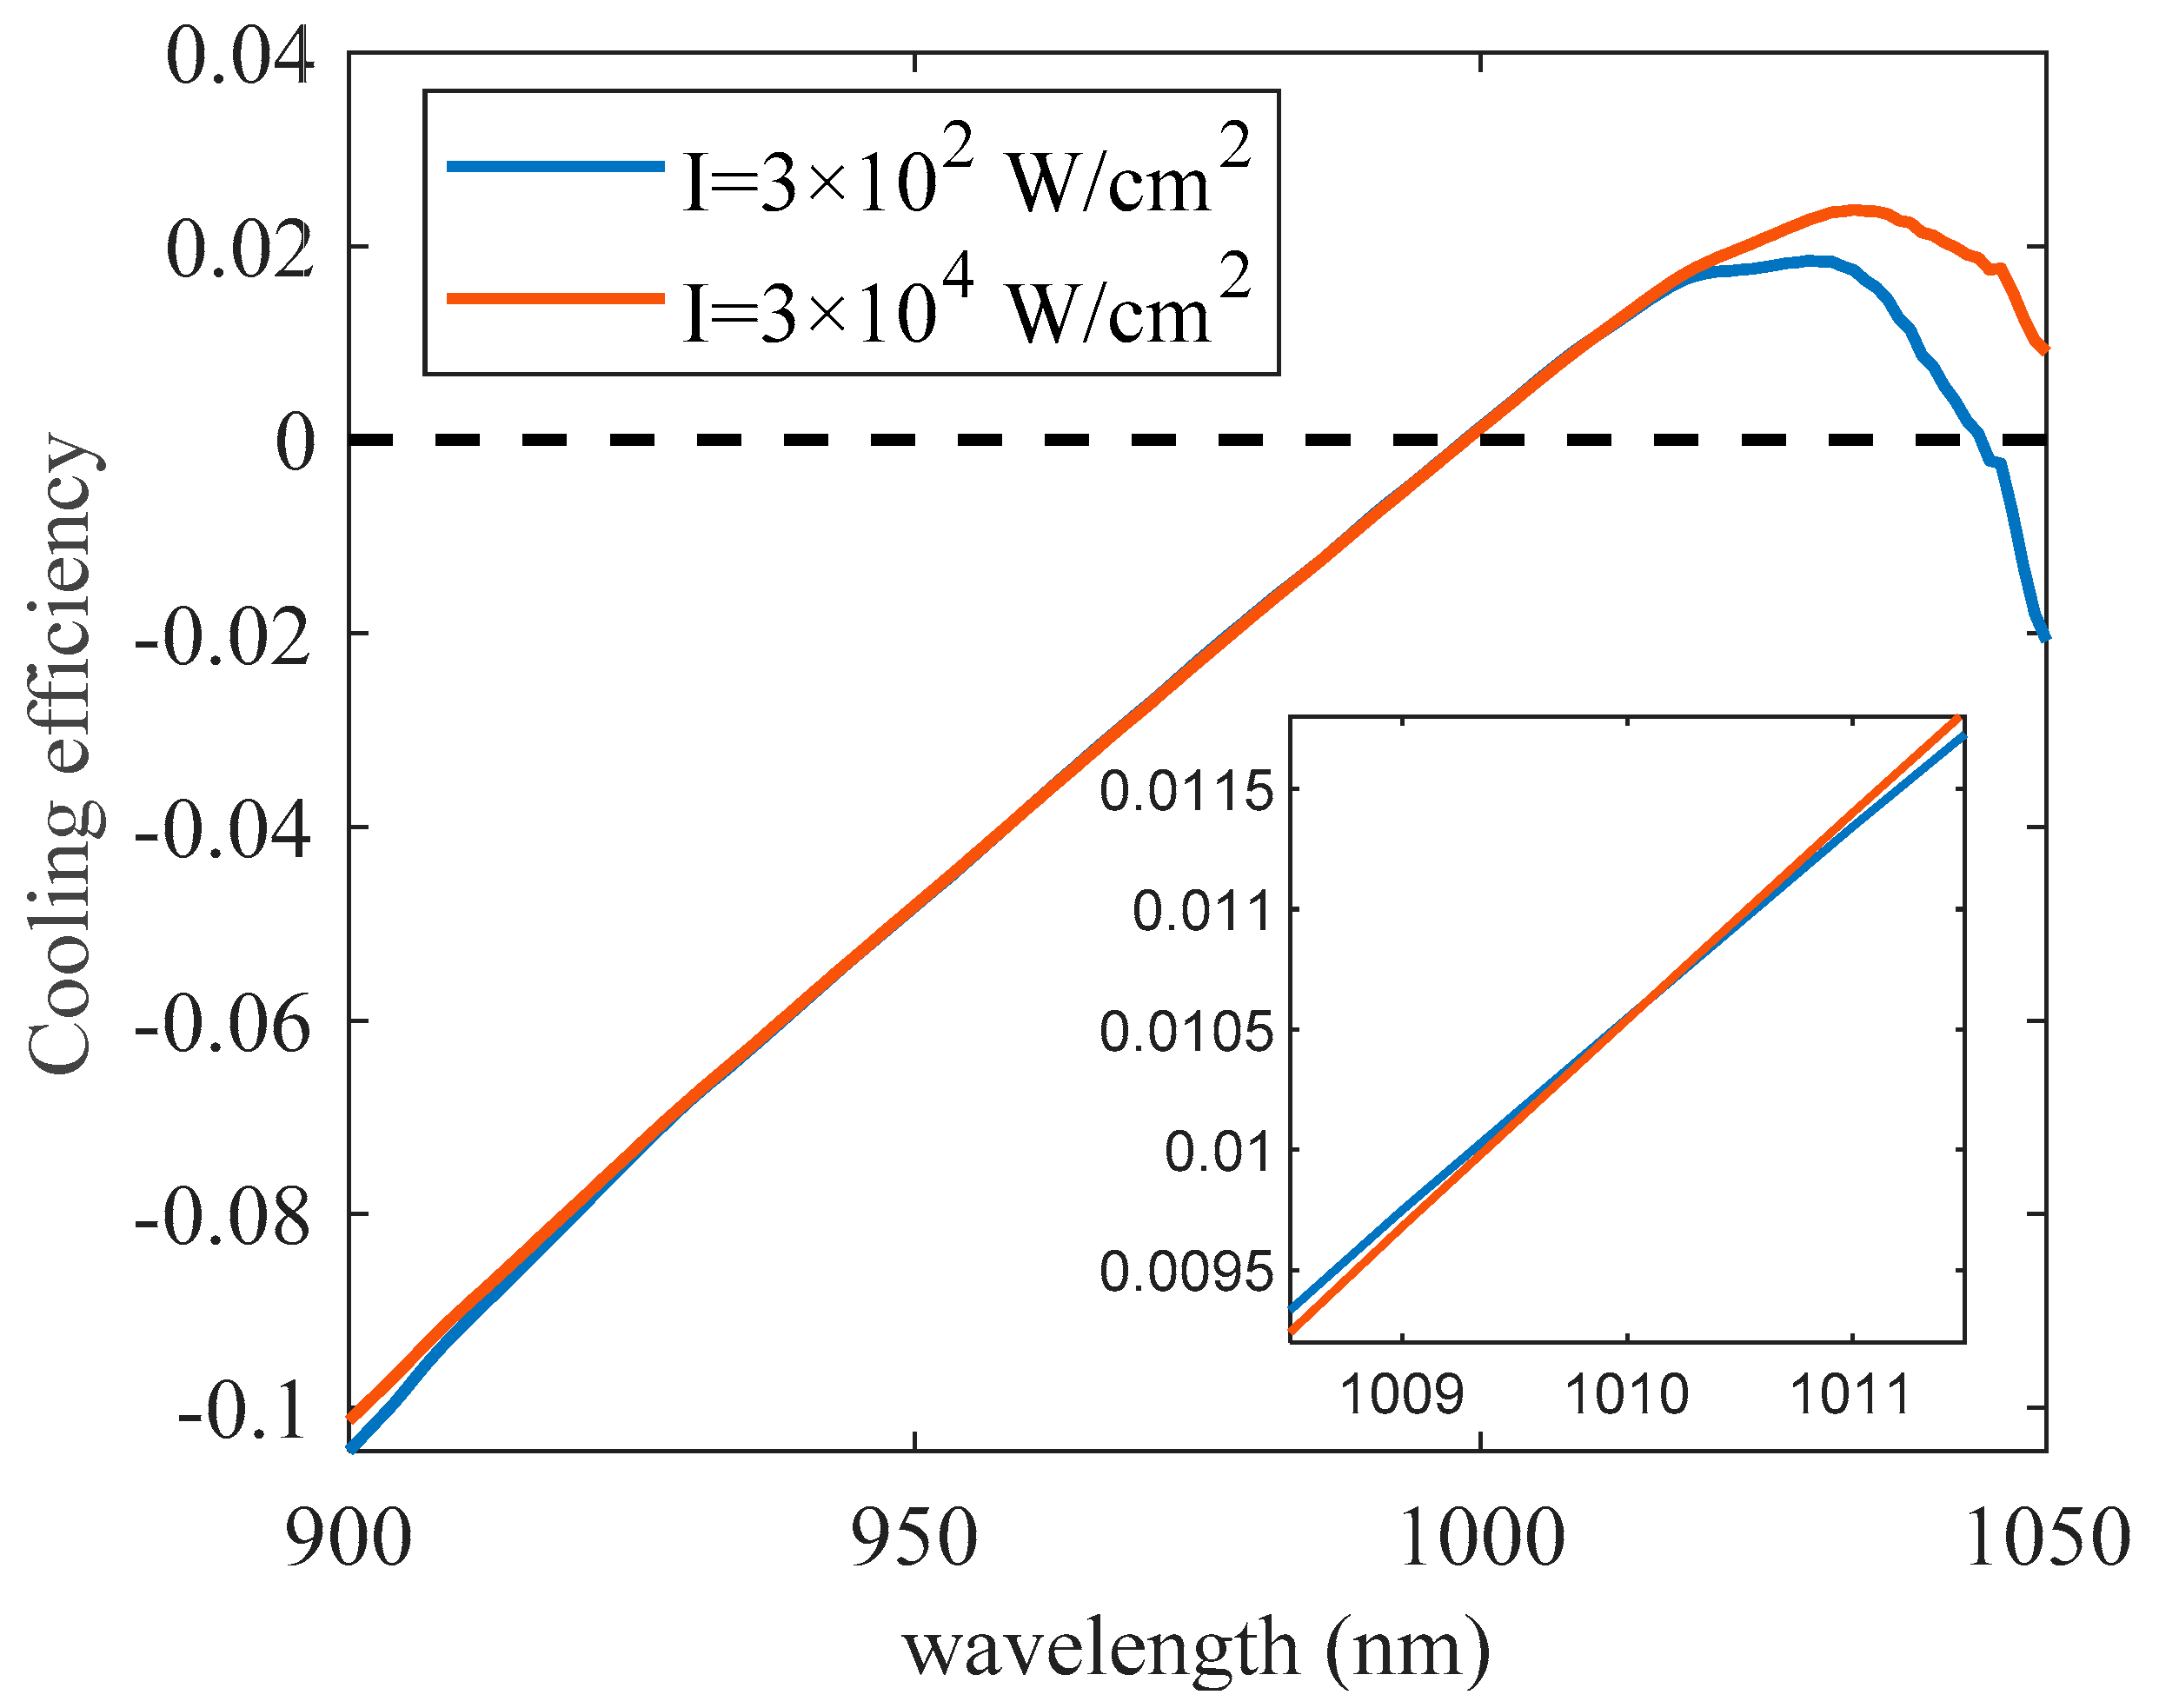
2.1. Improved Cooling Efficiency Using Optical Saturation
2.2. Electric-Dipole-Allowed Transitions for Rapid Cooling
2.3. Quantum Interference for Self-Cooled Lasing without Inversion
3. Methods and Results
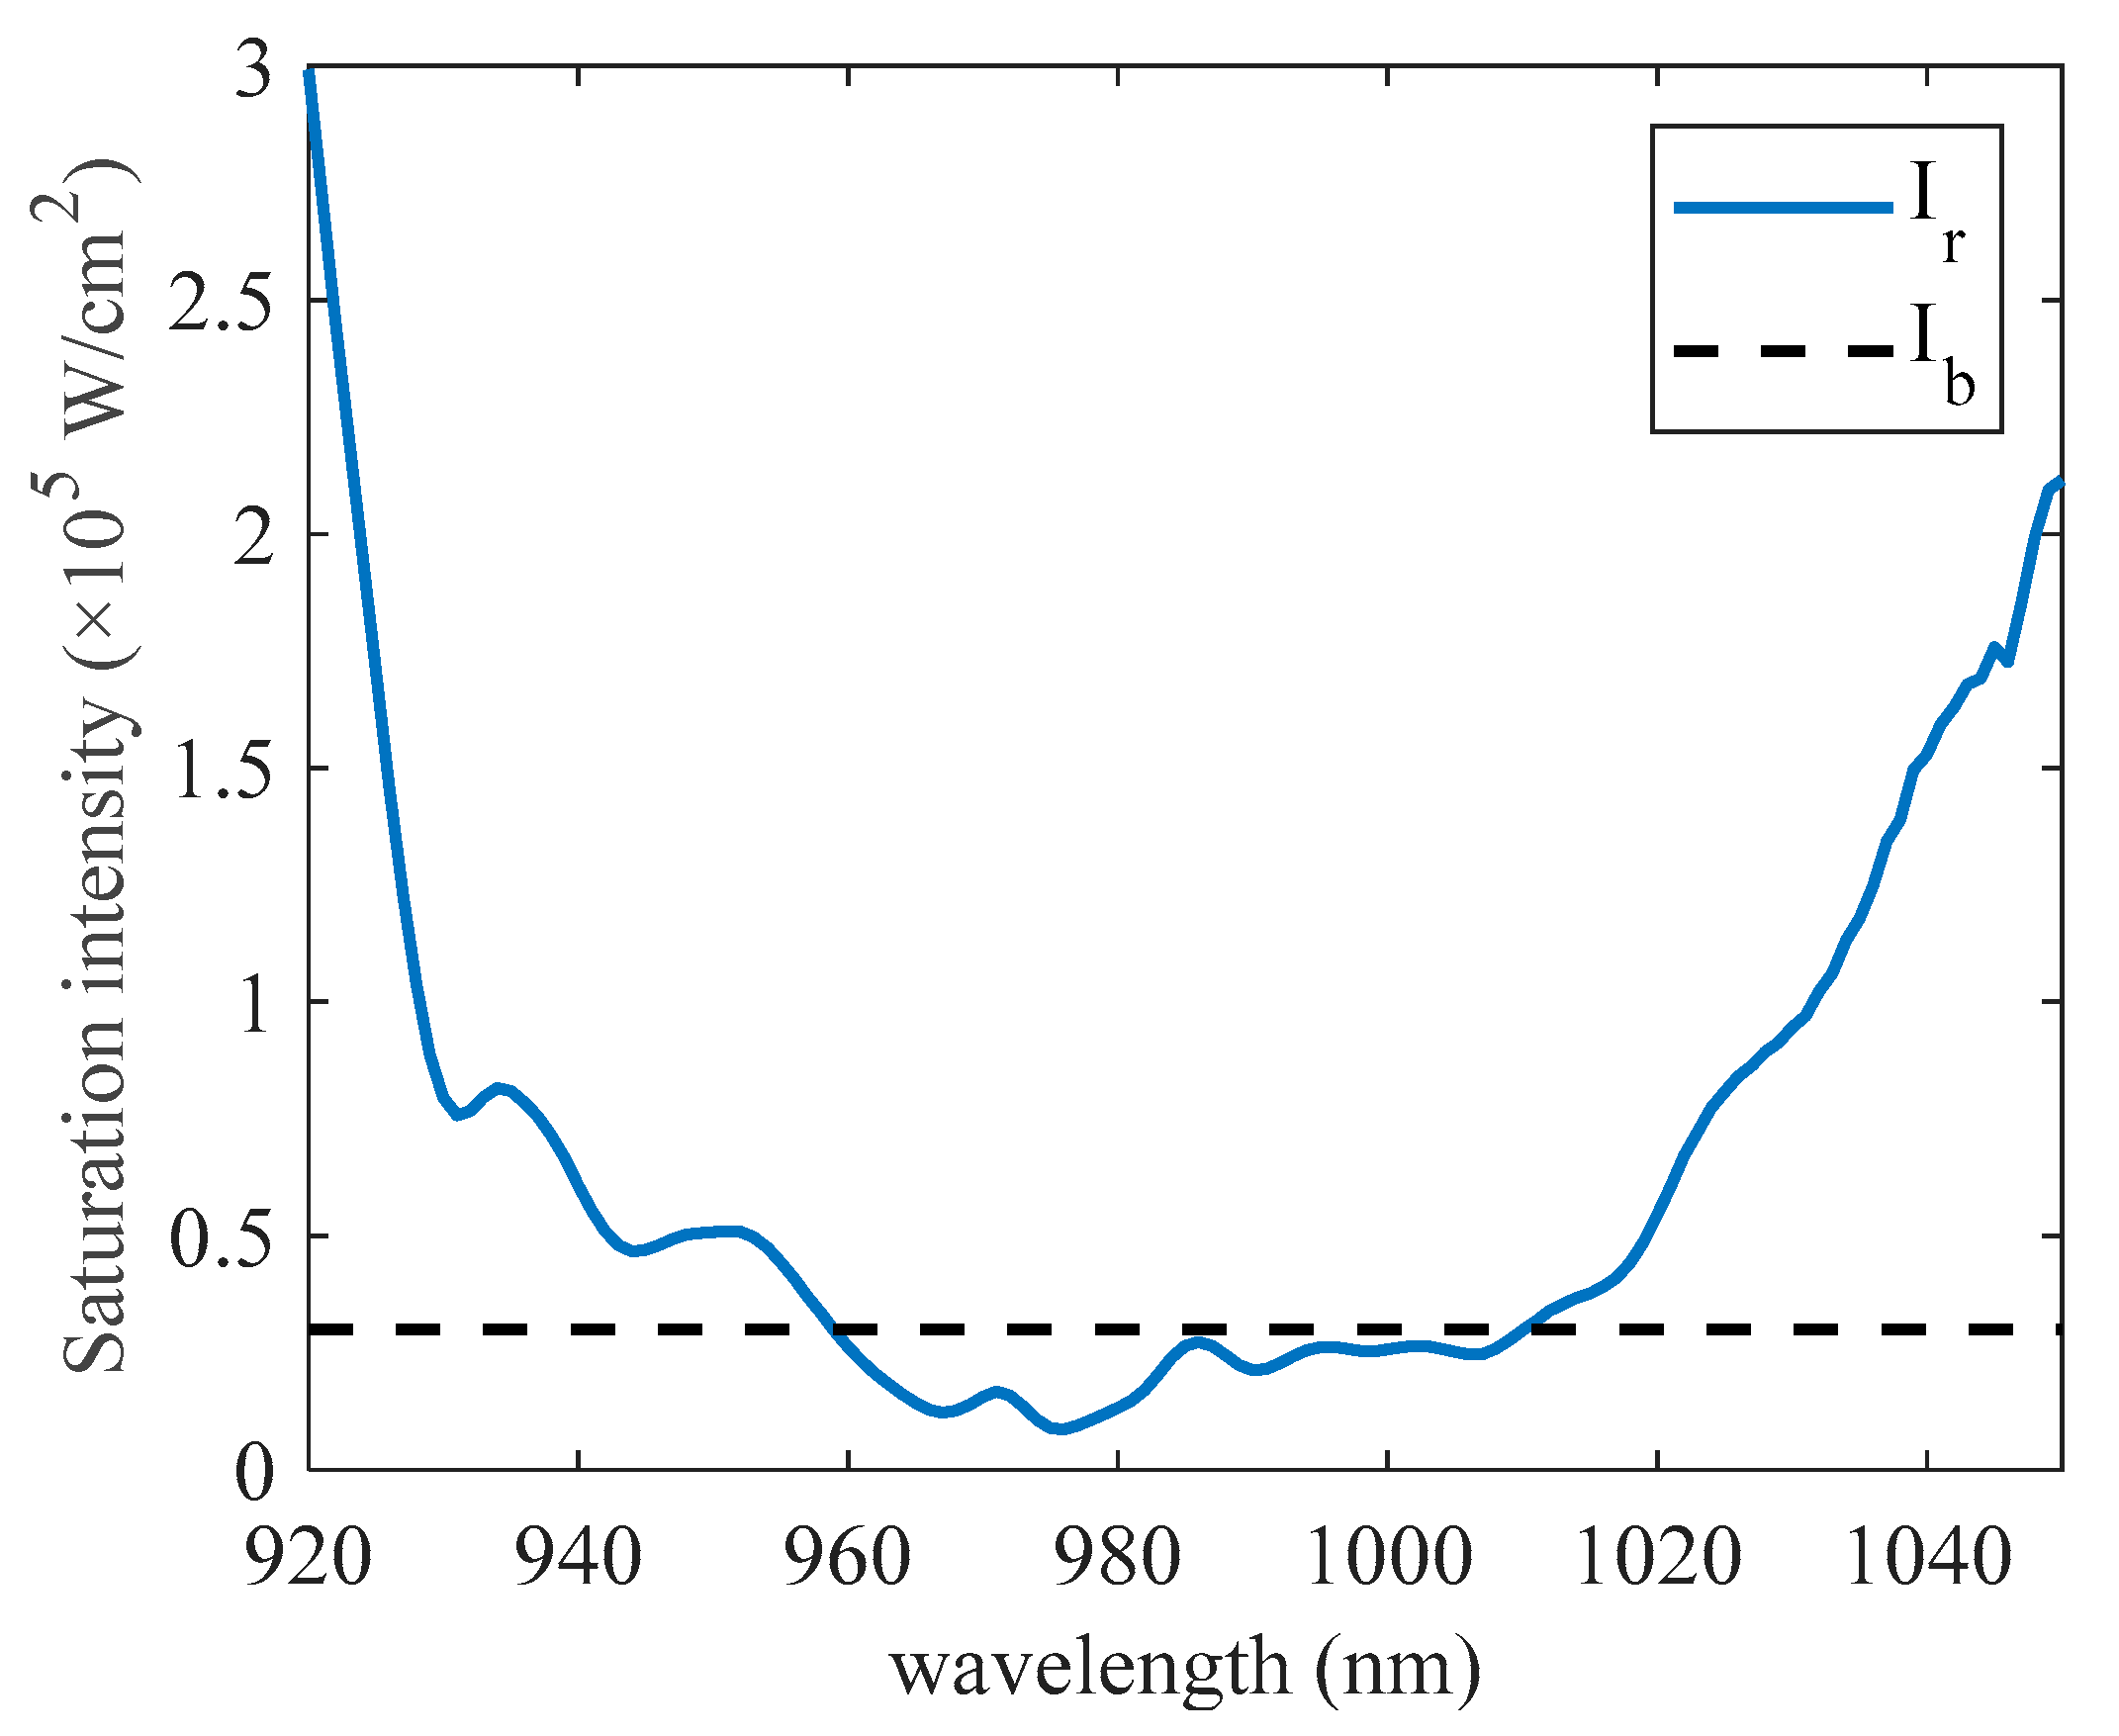
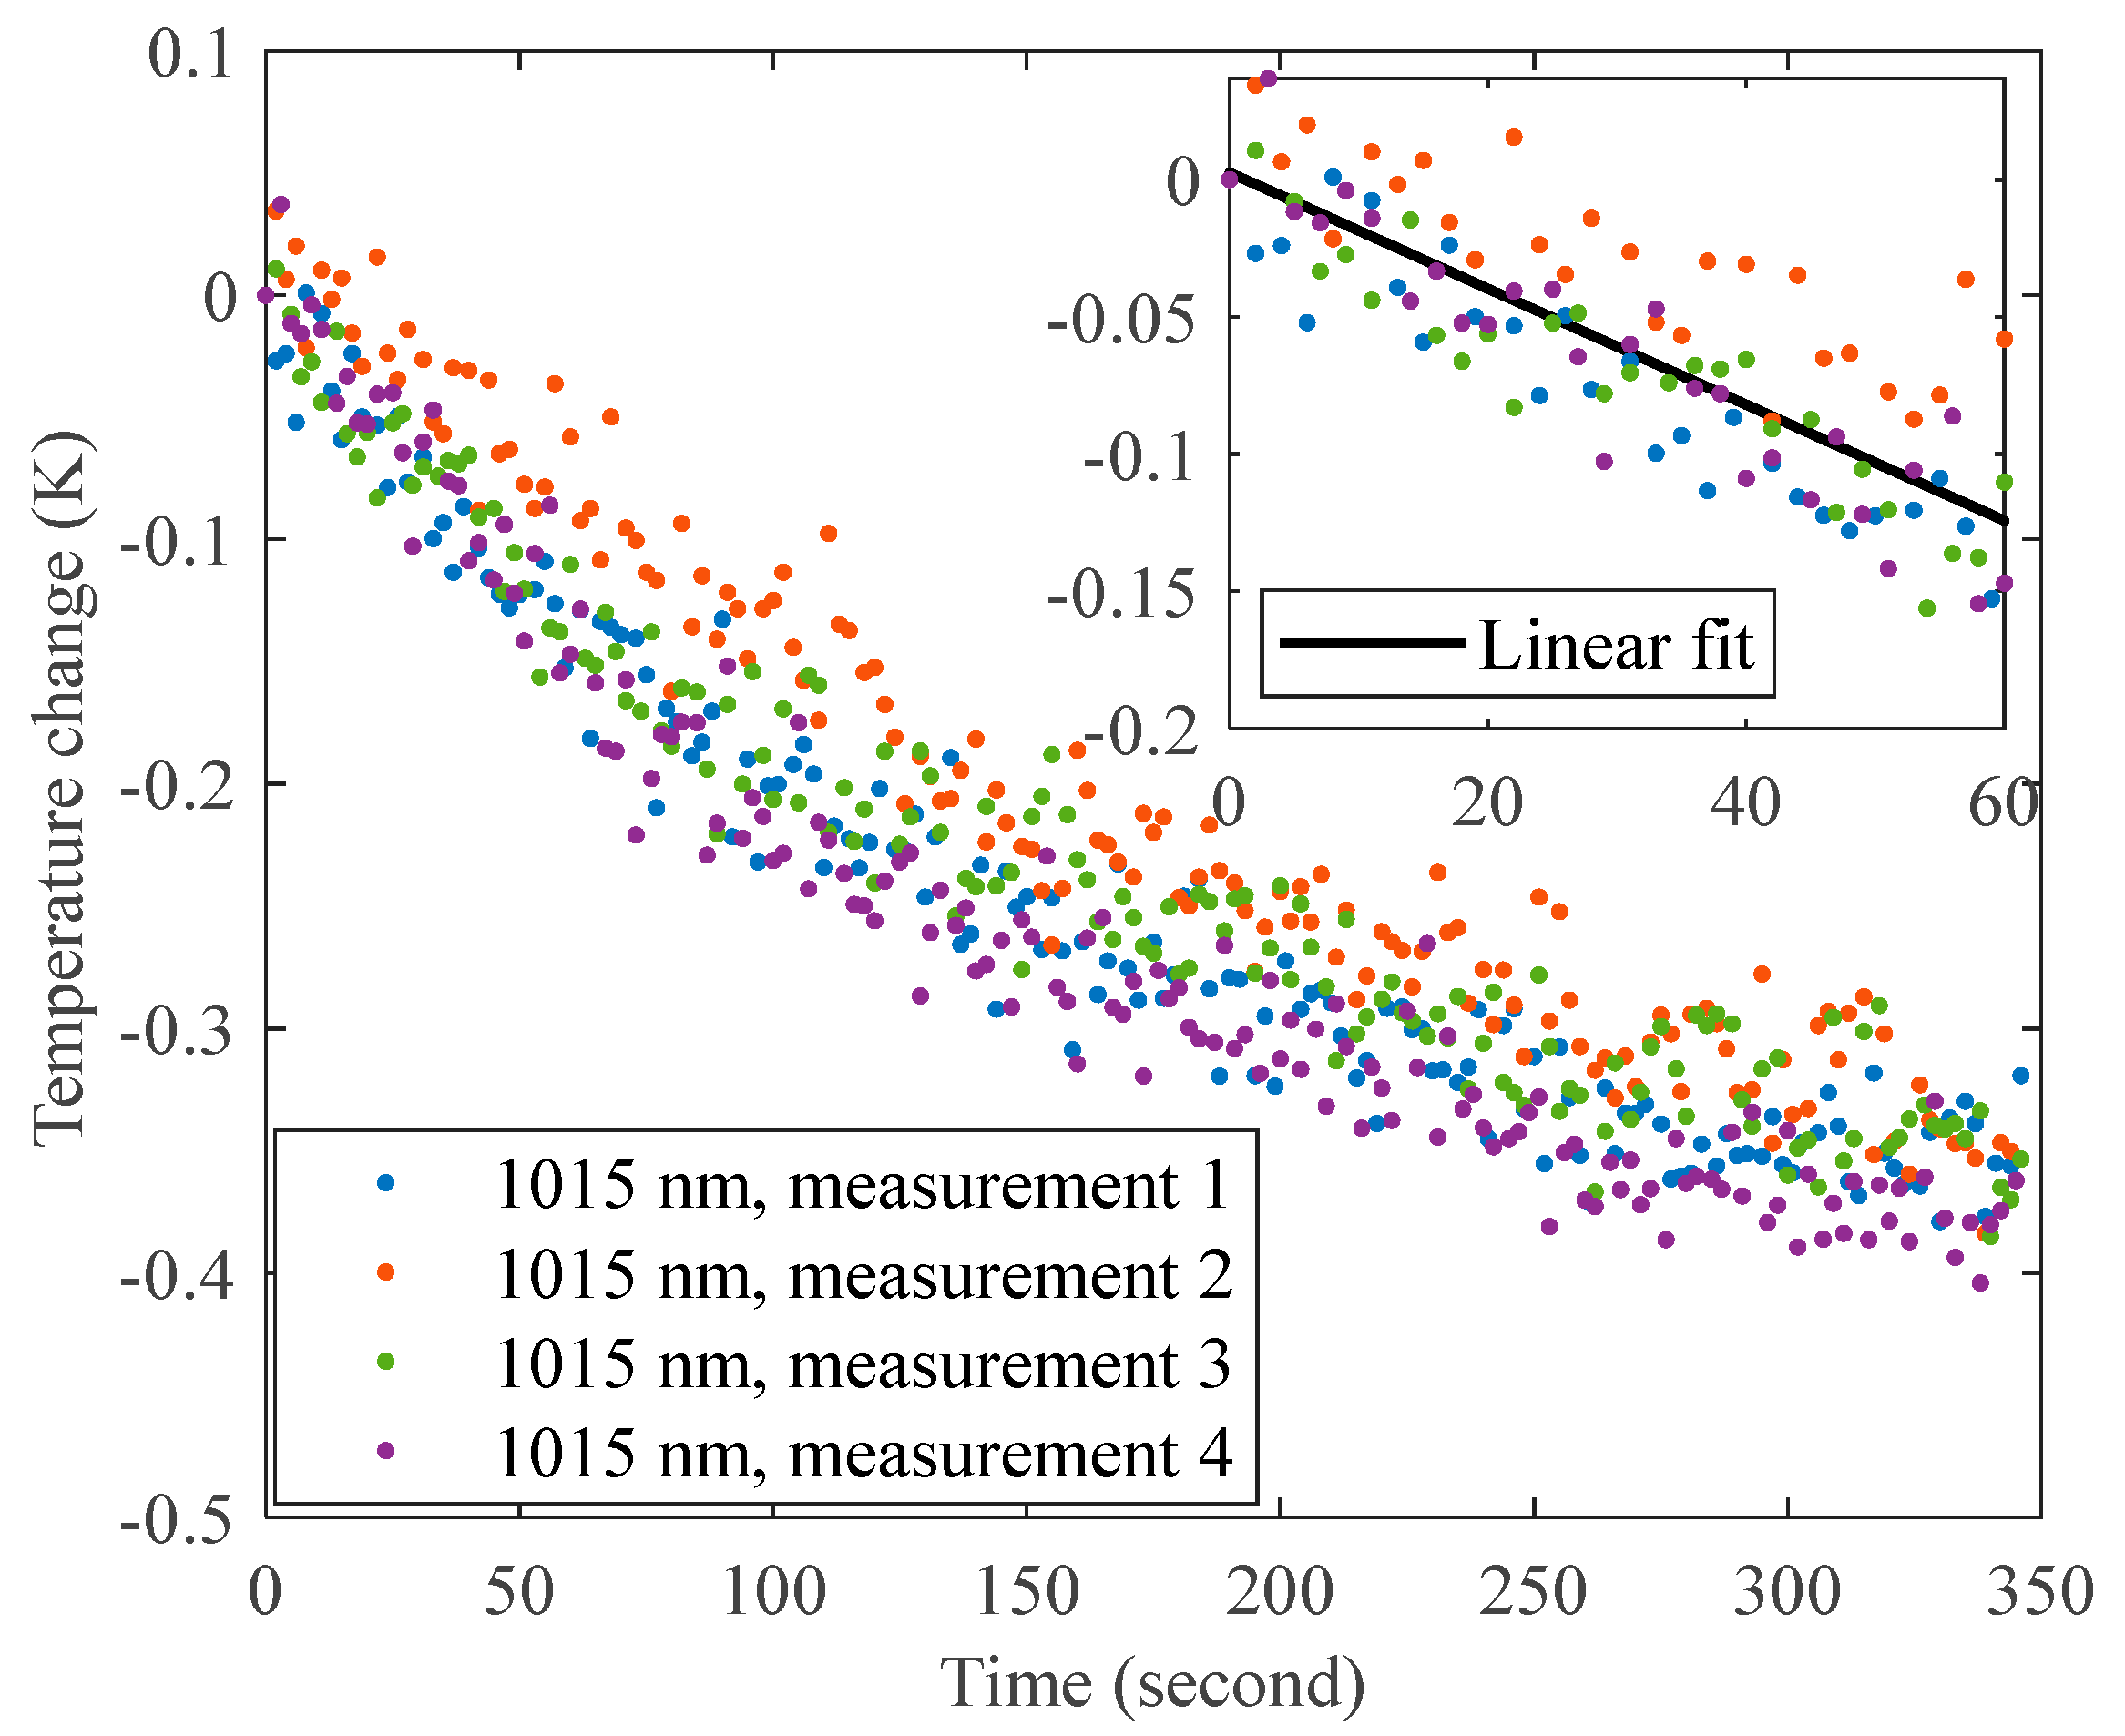
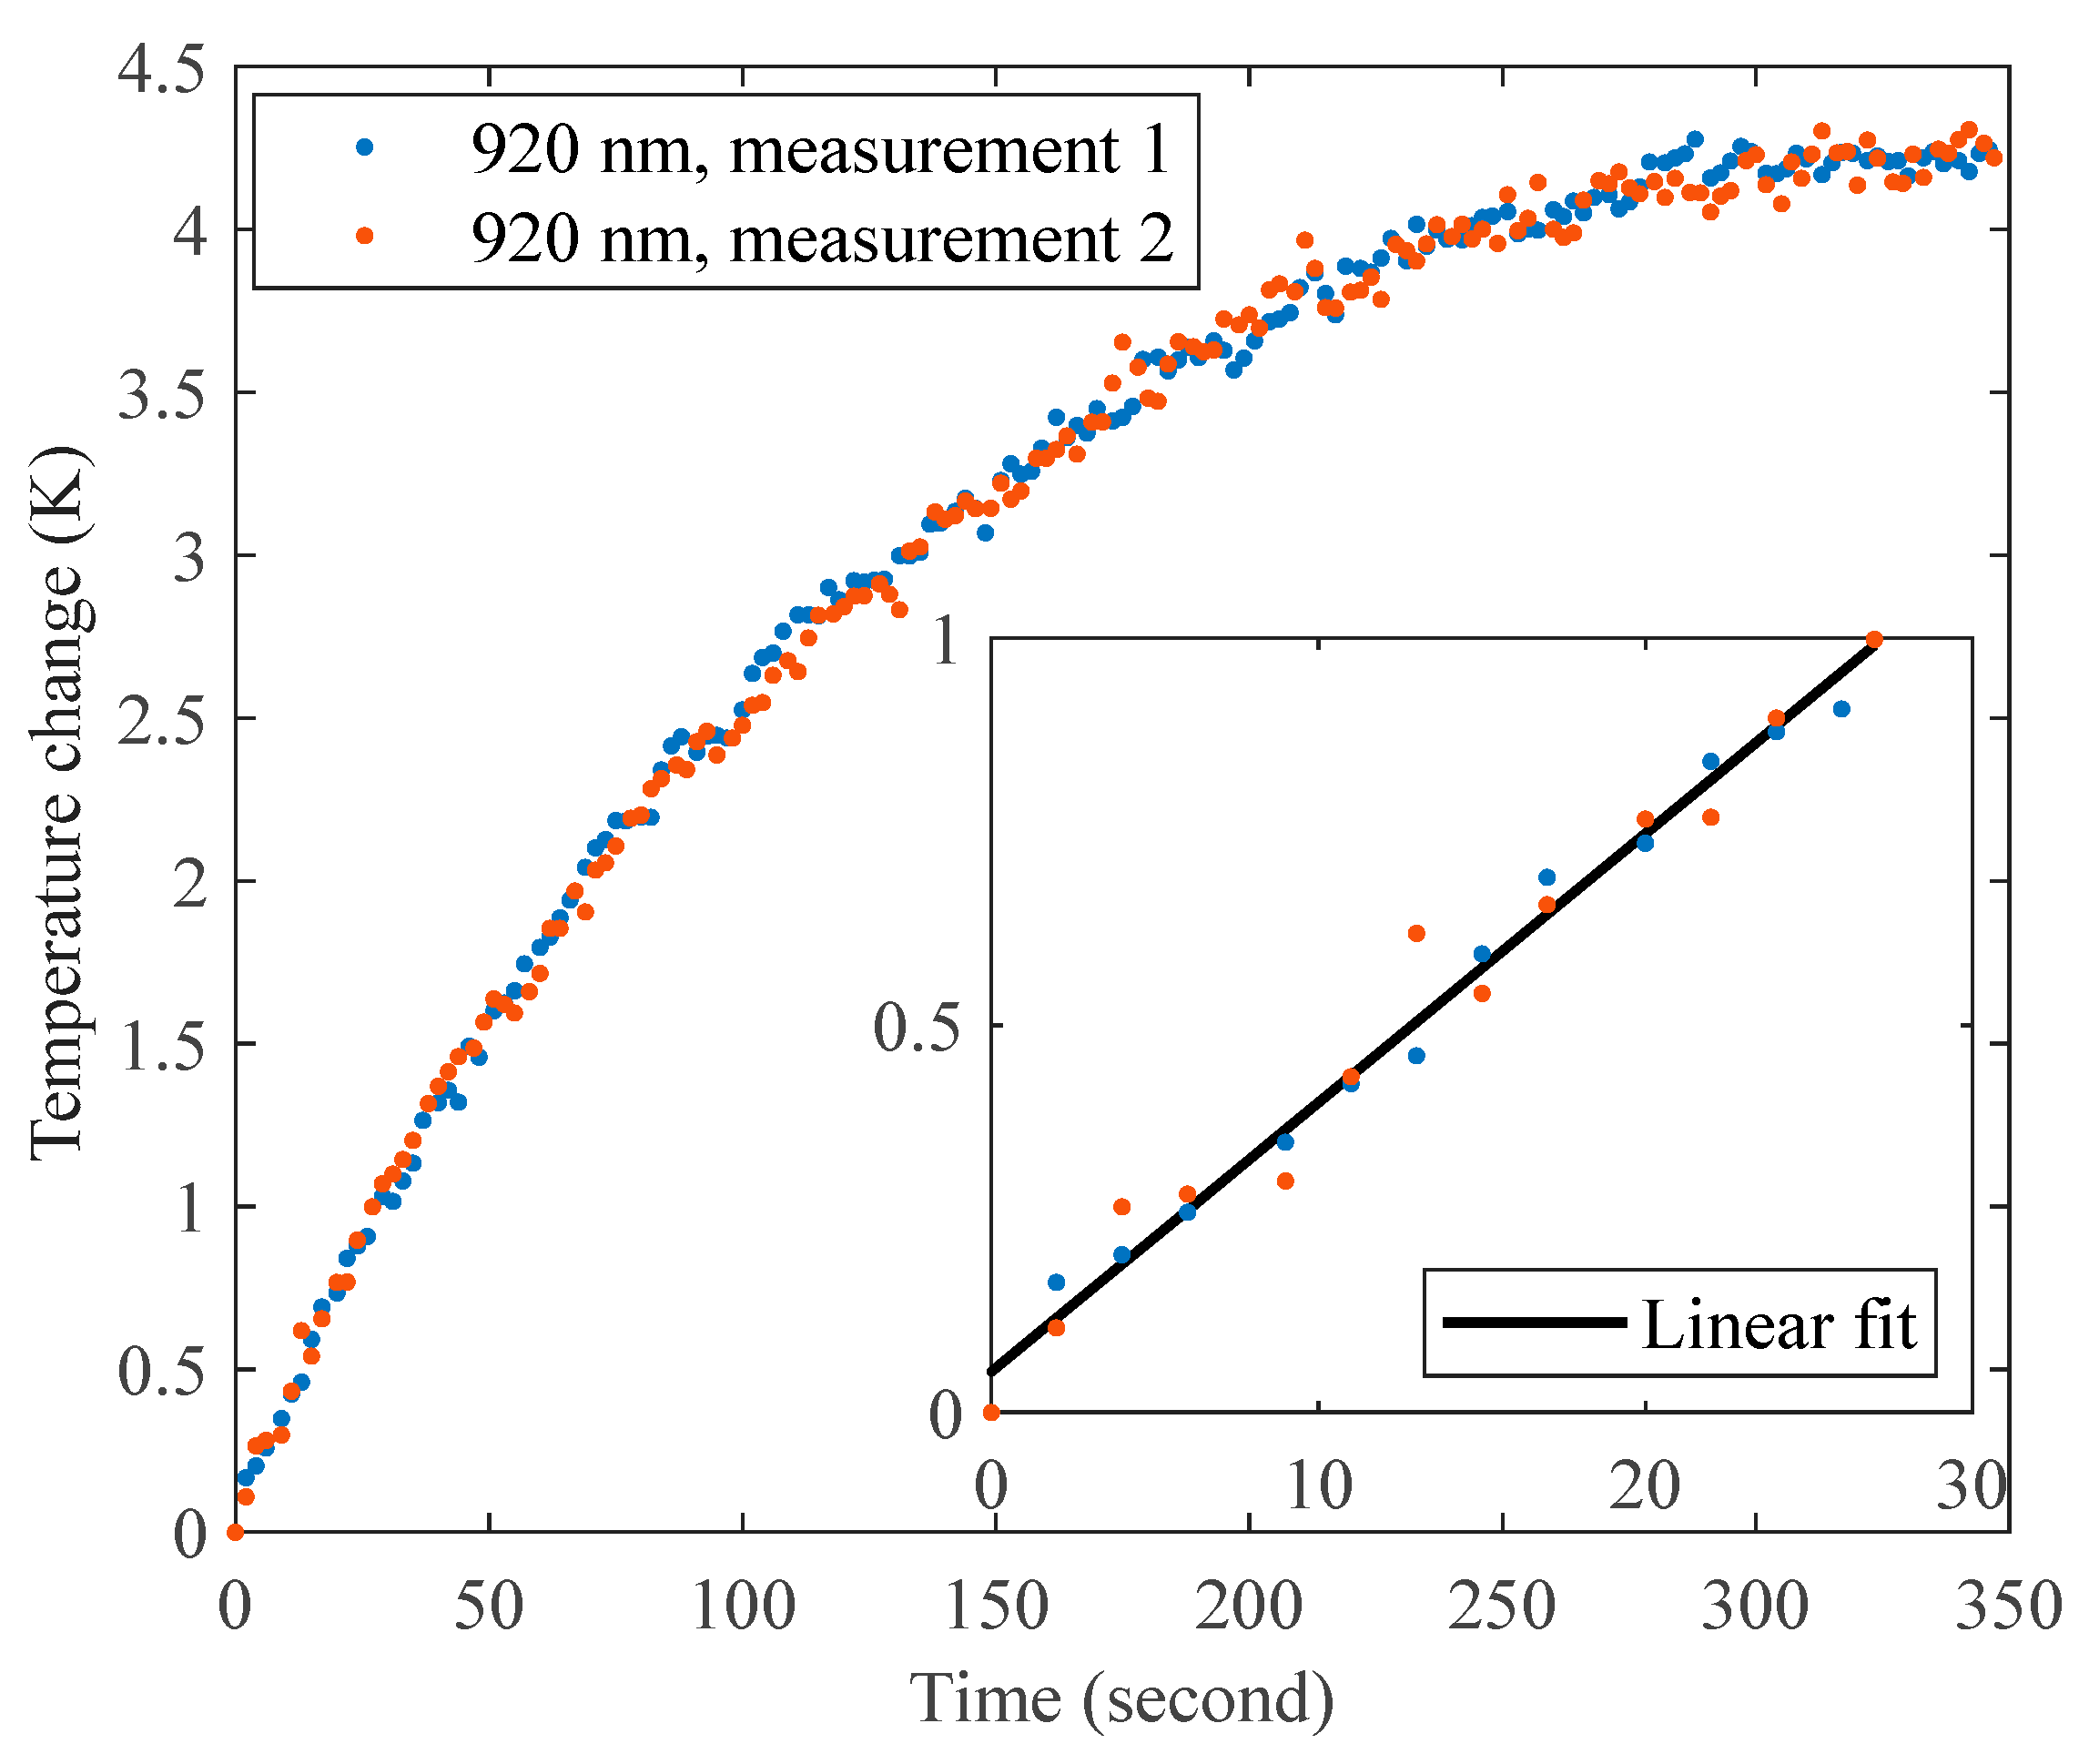
3.1. Improved Cooling via Saturation of Background Absorption in Yb:LiYF4
3.1.1. Differential Luminescence Thermometry (DLT)
3.1.2. Thermal Lens Spectroscopy (TLS)
3.2. Laser Cooling on an Electric-Dipole-Allowed Transition in Ti:Al2O3
3.3. Fano Resonance and Induced Transparency in Laser Cooling
4. Discussion
5. Conclusions
Author Contributions
Funding
Data Availability Statement
Acknowledgments
Conflicts of Interest
Appendix A
References
- Epstein, R.I.; Buchwald, M.I.; Edwards, B.C.; Gosnell, T.R.; Mungan, C.E. Observation of laser-induced fluorescent cooling of a solid. Nature 1995, 377, 500–503. [Google Scholar] [CrossRef]
- Bowman, S.R.; Mungan, C.E. New materials for optical cooling. Appl. Phys. B 2000, 71, 807–811. [Google Scholar] [CrossRef]
- Melgaard, S.D.; Albrecht, A.R.; Hehlen, M.P.; Sheik-Bahae, M. Solid-state optical refrigeration to sub-100 Kelvin regime. Sci. Rep. 2016, 6, 20380. [Google Scholar] [CrossRef] [PubMed] [Green Version]
- Hehlen, M.P.; Meng, J.; Albrecht, A.R.; Lee, E.R.; Gragossian, A.; Love, S.P.; Hamilton, C.E.; Epstein, R.I.; Sheik-Bahae, M. First demonstration of an all-solid-state optical cryocooler. Light Sci. Appl. 2018, 7, 15. [Google Scholar] [CrossRef] [PubMed]
- Bowman, S.R. Lasers without internal heat generation. IEEE J. Quantum Electron. 1999, 35, 115–122. [Google Scholar] [CrossRef] [Green Version]
- Bowman, S.R.; O’Connor, S.P.; Biswal, S.; Condon, N.J.; Rosenberg, A. Minimizing Heat Generation in Solid-State Lasers. IEEE J. Quantum Electron. 2010, 46, 1076–1085. [Google Scholar] [CrossRef]
- Yang, Z.; Meng, J.; Albrecht, A.R.; Sheik-Bahae, M. Radiation-balanced Yb:YAG disk laser. Opt. Express 2019, 27, 1392–1400. [Google Scholar] [CrossRef]
- Hehlen, M.P.; Epstein, R.I.; Inoue, H. Model of laser cooling in the Yb3+-doped fluorozirconate glass ZBLAN. Phys. Rev. B 2007, 75, 144302. [Google Scholar] [CrossRef] [Green Version]
- Feofilov, S.P.; Kulinkin, A.B.; Konyushkin, V.A.; Nakladov, A.N. The role of two-step excitation processes in laser cooling experiments: CaF2:Eu2+. Opt. Mater. 2016, 60, 240. [Google Scholar] [CrossRef]
- Khurgin, J.B. Surface plasmon-assisted laser cooling of solids. Phys. Rev. Lett. 2007, 98, 177401. [Google Scholar] [CrossRef]
- Rivlin, L.A.; Zadernovsky, A.A. Laser cooling of semiconductors. Opt. Commun. 1997, 139, 219–222. [Google Scholar] [CrossRef]
- Rupper, G.; Kwong, N.H.; Binder, R. Optical refrigeration of GaAs: Theoretical study. Phys. Rev. B 2007, 76, 245203. [Google Scholar] [CrossRef]
- Nemova, G.; Kashyap, R. Laser Cooling of Solids. Rep. Prog. Phys. 2010, 73, 086501. [Google Scholar] [CrossRef] [Green Version]
- Mungan, C.E.; Gosnell, T. Laser Cooling of Solids. Adv. At. Mol. Opt. Phys. 1999, 40, 161–228. [Google Scholar] [CrossRef]
- Rand, S.C. Raman Laser Cooling of Solids. J. Lumin. 2013, 133, 10–14. [Google Scholar] [CrossRef]
- Zhang, J.; Zhang, Q.; Wang, X.; Kwek, L.C.; Xiong, Q. Resolved-sideband Raman cooling of an optical phonon in semiconductor materials. Nat. Photon. 2016, 10, 600–605. [Google Scholar] [CrossRef]
- Rand, S.C. Lectures on Light, 2nd ed.; Oxford University Press: New York, NY, USA, 2016. [Google Scholar]
- McCumber, D.E. Einstein Relations Connecting Broadband Emission and Absorption Spectra. Phys. Rev. 1964, 136, A954–A957. [Google Scholar] [CrossRef]
- Püschel, S.; Kalusniak, S.; Kränkel, C.; Tanaka, H. Temperature-dependent radiative lifetime of Yb:YLF: Refined cross sections and potential for laser cooling. Opt. Express 2021, 29, 11106–11120. [Google Scholar] [CrossRef]
- Scott, G.B.; Lacklison, D.E.; Page, J.L. Absorption spectra of Y3Fe5O12(YIG) and Y3Ga5O12: Fe3+. Phys. Rev. B 1974, 10, 971–986. [Google Scholar] [CrossRef]
- Schubert, M.; Tiwald, T.E.; Herzinger, C.M. Infrared dielectric anisotropy and phonon modes of sapphire. Phys. Rev. B 2000, 61, 8187–8201. [Google Scholar] [CrossRef]
- Shirakov, A.; Burshtein, Z.; Shimony, Y.; Frumker, E.; Ishaaya, A.A. Radiative and non-radiative transitions of excited Ti3+ cations in sapphire. Sci. Rep. 2019, 9, 18810. [Google Scholar] [CrossRef]
- Scully, M.O.; Zubairy, M.S. Quantum Optics; Cambridge University Press: Cambridge, UK, 2012. [Google Scholar]
- Cheng, L.; Andre, L.B.; Salkeld, A.J.; Andrade, L.H.C.; Lima, S.M.; Silva, J.R.; Rytz, D.; Rand, S.C. Laser cooling of Yb3+:KYW. Opt. Express 2020, 28, 2778–2788. [Google Scholar] [CrossRef]
- de Lima Filho, E.S.; Nemova, G.; Loranger, S.; Kashyap, R. Laser-induced cooling of a Yb:YAG crystal in air at atmospheric pressure. Opt. Express 2013, 21, 24711–24720. [Google Scholar] [CrossRef]
- Seletskiy, D.V.; Melgaard, S.D.; Lieto, A.D.; Tonelli, M.; Sheik-Bahae, M. Laser cooling of a semiconductor load to 165 K. Opt. Express 2010, 18, 18061–18066. [Google Scholar] [CrossRef]
- Aggarwal, R.L.; Ripin, D.J.; Ochoa, J.R.; Fan, T.Y. Measurement of thermo-optic properties of Y3Al5O12, Lu3Al5O12, YAlO3, LiYF4, LiLuF4, BaY2F8, KGd(WO4)2, and KY(WO4)2 laser crystals in the 80–300 K temperature range. J. App. Phys. 2005, 98, 103514. [Google Scholar] [CrossRef]
- Shen, J.; Lowe, R.D.; Snook, R.D. A model for cw laser induced mode-mismatched dual-beam thermal lens spectrometry. Chem. Phys. 1992, 165, 385–396. [Google Scholar] [CrossRef]
- Silva, J.R.; Malacarne, L.C.; Baesso, M.L.; Lima, S.M.; Andrade, L.H.C.; Jacinto, C.; Hehlen, M.P.; Astrath, N.G.C. Modeling the population lens effect in thermal lens spectrometry. Opt. Lett. 2013, 38, 422–424. [Google Scholar] [CrossRef] [PubMed]
- Cheng, L.; Andre, L.B.; Almeida, G.L.; Andrade, L.H.C.; Lima, S.M.; Silva, J.R.; Catunda, T.; Guyot, Y.; Rand, S.C. Differential Absorption Saturation in Laser Cooled Yb:YLF. Opt. Mat. under review.
- Lieto, A.D.; Sottile, A.; Volpi, A.; Zhang, Z.; Seletskiy, D.V.; Tonelli, M. Influence of other rare earth ions on the optical refrigeration efficiency in Yb:YLF crystals. Opt. Express 2014, 22, 28572–28583. [Google Scholar] [CrossRef] [Green Version]
- Cittadino, G.; Volpi, A.; Lieto, A.D.; Tonelli, M. Co-doping of LiYF4 crystal: A virtuous effect of cooling efficiency. J. Phys. D: Appl. Phys. 2018, 51, 145302. [Google Scholar] [CrossRef]
- Silva, J.R.; Andrade, L.H.C.; Lima, S.M.; Guyot, Y.; Giannini, N.; Sheik-Bahae, M. External Quantum Efficiency determined by combined thermal lens and photoluminescence spectroscopy techniques: Application to Ce3+:YAG. Appl. Phys. Lett. 2020, 117, 061107. [Google Scholar] [CrossRef]
- Moulton, P. Spectroscopic and laser characteristics of Ti:Al2O3. J. Opt. Soc. B 1986, 3, 125–133. [Google Scholar] [CrossRef]
- Fano, U. Effects of Configuration Interaction on Intensities and Phase Shifts. Phys. Rev. 1961, 124, 1866–1878. [Google Scholar] [CrossRef]
- Boller, K.J.; İmamoğlu, A.; Harris, S.E. Observation of electromagnetically induced transparency. Phys. Rev. Lett. 1991, 66, 2593. [Google Scholar] [CrossRef] [PubMed] [Green Version]
- Anisimov, P.M.; Dowling, J.P.; Sanders, B.C. Objectively Discerning Autler-Townes Splitting from Electromagnetically Induced Transparency. Phys. Rev. Lett. 2011, 107, 163604. [Google Scholar] [CrossRef]
- Marshall, C.D.; Payne, S.A.; Speth, J.A.; Tassano, J.B.; Krupke, W.F.; Quarles, G.J.; Castillo, V.K.; Chai, B.H.T. Properties of Ce:LiSrAlF6 and Ce:LiCaAlF6 ultraviolet lasers. SPIE Proc. 1994, 2115, 7. [Google Scholar] [CrossRef]
- Volpi, A.; Meng, J.; Gragossian, A.; Albrecht, A.R.; Rostami, S.; Lieto, A.D.; Epstein, R.I.; Tonelli, M.; Hehlen, M.P.; Sheik-Bahae, M. Optical refrigeration: The role of parasitic absorption at cryogenic temperatures. Opt. Express 2019, 27, 29710–29718. [Google Scholar] [CrossRef]
- Melgaard, S.; Seletskiy, D.; Polyak, V.; Asmerom, Y.; Sheik-Bahae, M. Identification of parasitic losses in Yb:YLF and prospects for optical refrigeration down to 80K. Opt. Express 2014, 22, 7756–7764. [Google Scholar] [CrossRef] [Green Version]
- Greene, B.I.; Wolfe, R. Femtosecond relaxation dynamics in magnetic garnets. J. Opt. Soc. Am. B 1985, 2, 600–605. [Google Scholar] [CrossRef]
- Pathak, N.; Gupta, S.K.; Sanyal, K.; Kumar, M.; Kadam, R.M.; Natarajan, V. Photoluminescence and EPR studies on Fe3+-doped ZnAl2O4: An evidence for local site swapping of Fe3+ and formation of inverse and normal phase. Dalton Trans. 2014, 43, 9313–9323. [Google Scholar] [CrossRef]
- Gareyeva, Z.V.; Doroshenko, R.A. Optical absorption of octahedral ions Fe2+, Fe4+ and photoinduced effect in YIG single crystals. J. Magn. Magn. Mater. 2004, 268, 1–7. [Google Scholar] [CrossRef]
- Ma, J.; Dong, J.; Ueda, K.I.; Kaminskii, A.A. Optimization of Yb:YAG/Cr4+:YAG composite ceramics passively Q-switched microchip lasers. Appl. Phys. B 2011, 105, 749–760. [Google Scholar] [CrossRef]
- See for example: Ryou, J.H. Gallium nitride (GaN) on sapphire substrates for visible LEDs. In Nitride Semiconductor Light-Emitting Diodes; Woodhead Publishing: Cambridge, UK, 2014; pp. 66–98. [Google Scholar] [CrossRef]
- See for example: Baxter, J.B.; Aydil, E.S. Epitaxial growth of ZnO nanowires on a- and c-plane sapphire. J. Cryst. Growth 2005, 274, 407–411. [Google Scholar] [CrossRef]
- Townsend, M.G. Visible Charge Transfer Band in Blue Sapphire. Solid State Comm. 1968, 6, 81–83. [Google Scholar] [CrossRef]
- Krebs, J.J.; Maisch, W.G. Exchange Effects in the Optical-Absorption Spectrum of Fe3+ in Al2O3. Phys. Rev. B 1971, 4, 757. [Google Scholar] [CrossRef]
- Ferguson, J.; Fielding, P.E. The Origins of the Colours of Yellow, Green and Blue Sapphires. Chem. Phys. Lett. 1971, 10, 262. [Google Scholar] [CrossRef]


| Beam Radius (µm) | Intensity (W/cm2) | |
|---|---|---|
| DLT High | 32.4–39.3 | (1.6–2.4) 104 |
| DLT Low | 284–318 | (2.0–3.3) 102 |
| TLS High | 316–364 | (1.1–1.3) 103 |
| TLS Low | 316–364 | (1.1–1.3) 102 |
| λobs (nm) | kobs (cm−1) | Initial Level | Site | kcalc (cm−1) | kobs − kcalc (cm−1) |
|---|---|---|---|---|---|
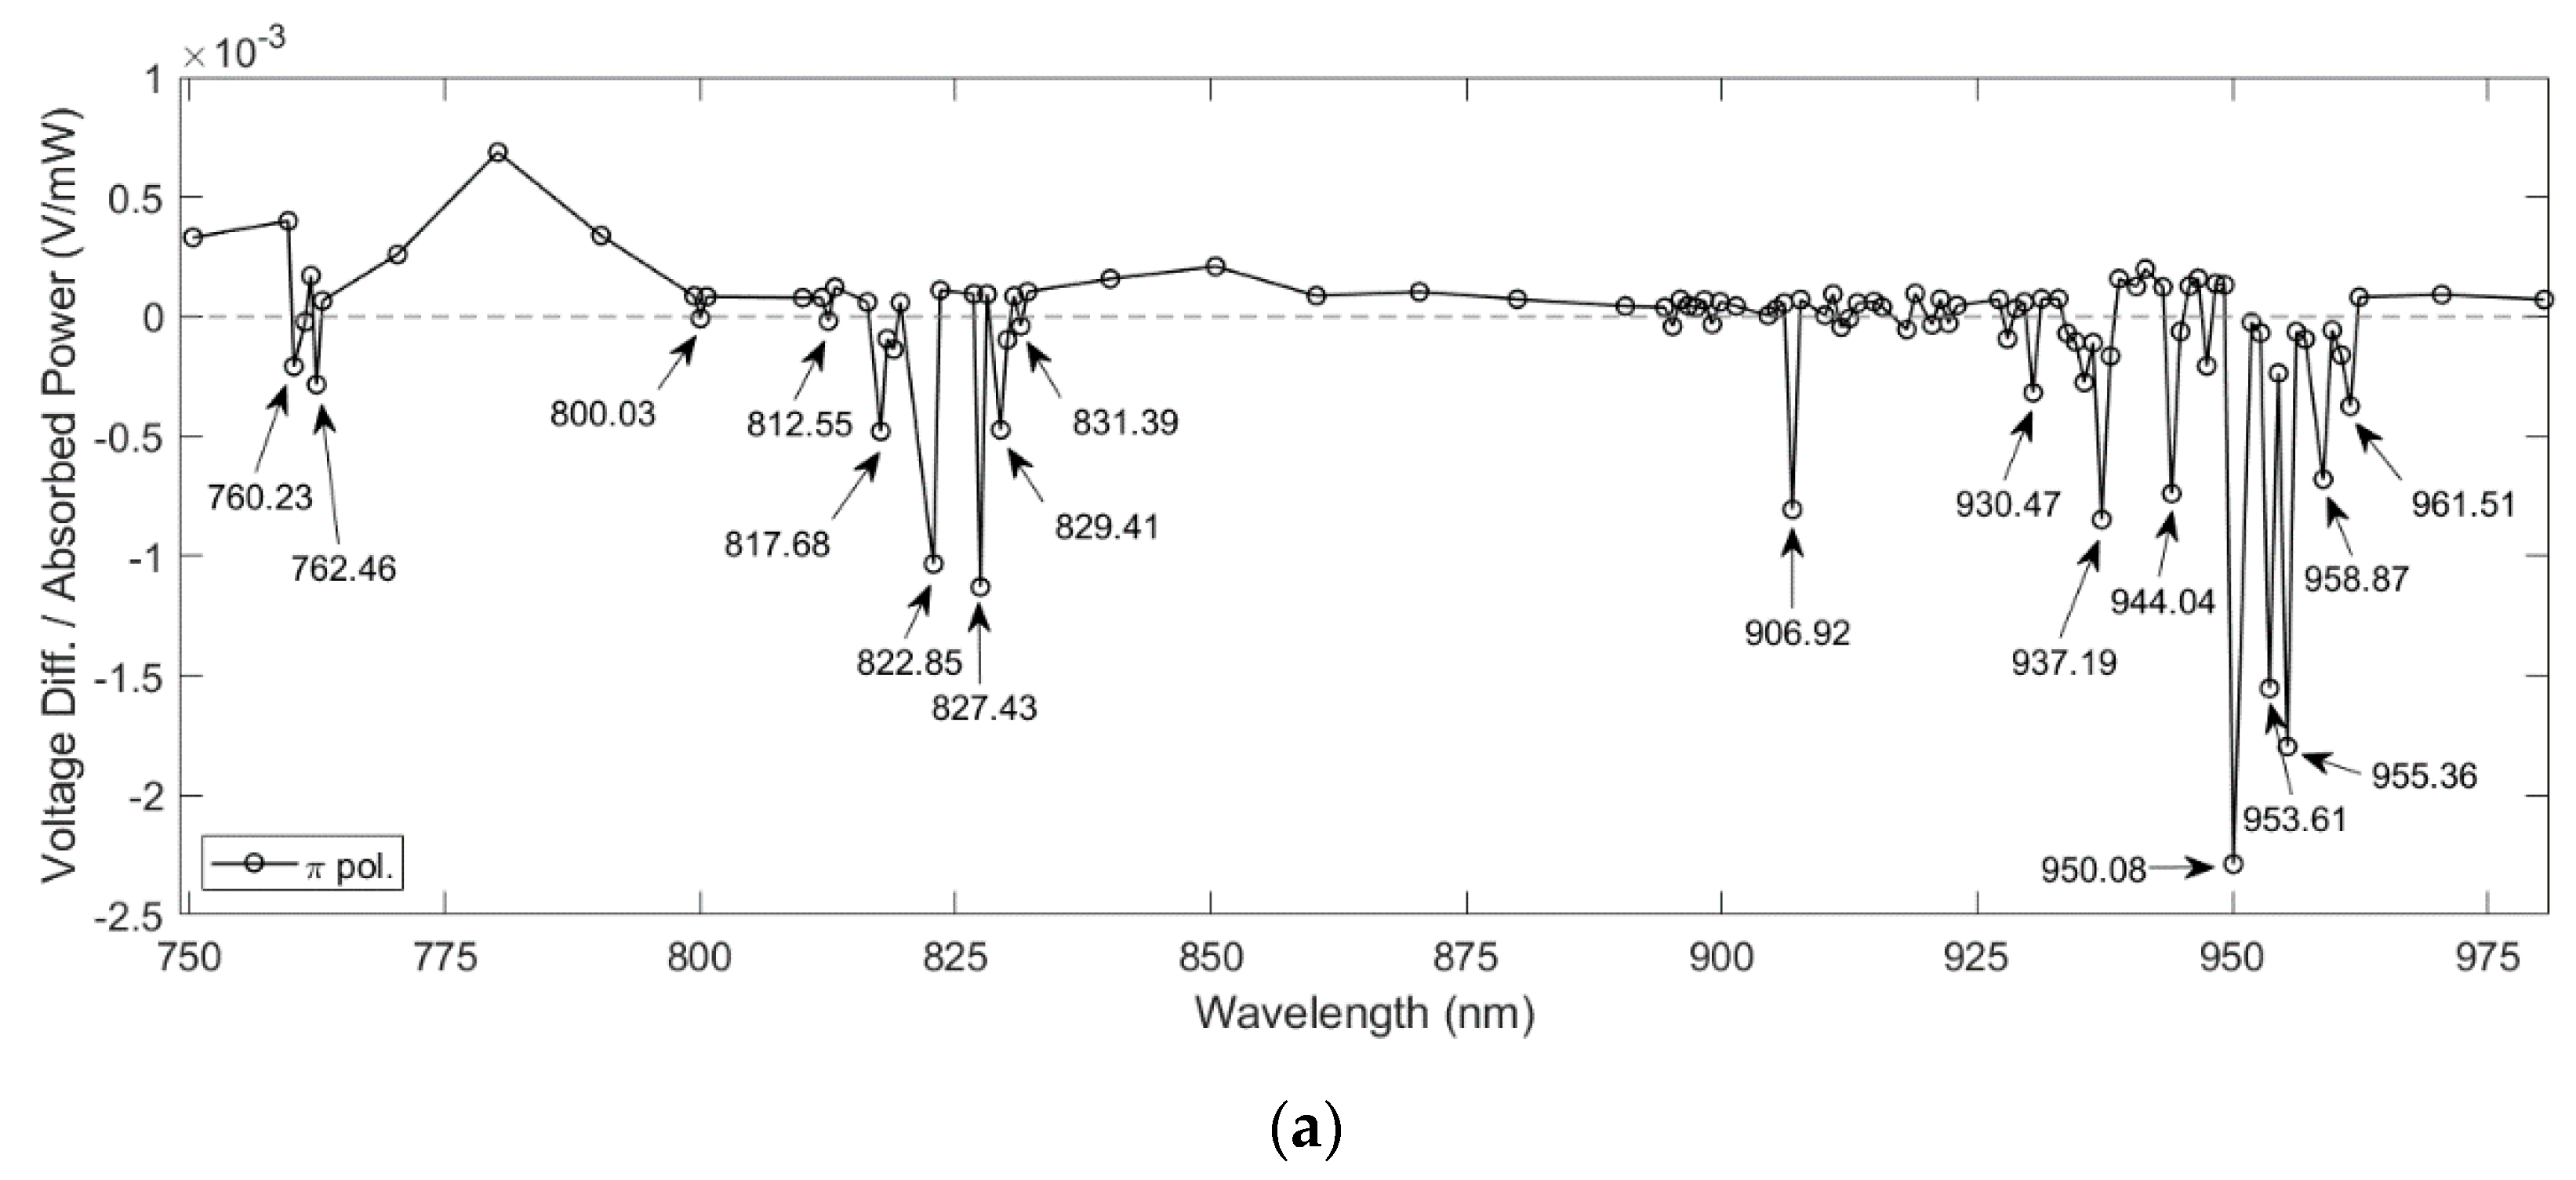
| 812.55 | 12,306.93 | (2A(0), vd) | 3 | 12,276.79 | −30.14 |
| 817.68 | 12,229.72 | (2A(0), vd) | 4 | 12,276.79 | 47.07 |
| 822.85 | 12,152.88 | (2A(1), v = 0) | 1 | 11,957.89 | −194.99 |
| 827.43 | 12,085.61 | (2A(1), v = 0) | 2 | 11,957.89 | −127.72 |
| 829.41 | 12,056.76 | (2A(1), v = 0) | 3 | 11,957.89 | −98.87 |
| 831.39 | 12,028.05 | (2A(1), v = 0) | 4 | 11,957.89 | −70.15 |
| 906.92 | 11,026.33 | (2A(1), vd) | 2 | 11,076.89 | 50.56 |
| 930.47 | 10,747.26 | (2A(1), vd) | 3 | 11,076.89 | 329.64 |
| 937.19 | 10,670.19 | (2A(1), vd) | 4 | 11,076.89 | 406.70 |
| 944.04 | 10,592.77 | (2A(2), v = 0) | 1 | 10,547.89 | −44.88 |
| 950.08 | 10,525.43 | (2A(2), v = 0) | 2 | 10,547.89 | 22.47 |
| 953.61 | 10,486.47 | (2A(2), v = 0) | 3 | 10,547.89 | 61.43 |
| 955.36 | 10,467.26 | (2A(2), v = 0) | 4 | 10,547.89 | 80.64 |
| 958.87 | 10,428.94 | (2A(2), va) | 1 | 10,149.89 | −279.05 |
| 961.51 | 10,400.31 | (2A(2), va) | 2 | 10,149.89 | −250.41 |
| Average: | −1.21 |
| λobs (nm) | kobs (cm−1) | Initial Level | Site | kcalc (cm−1) | kobs − kcalc (cm−1) |
|---|---|---|---|---|---|
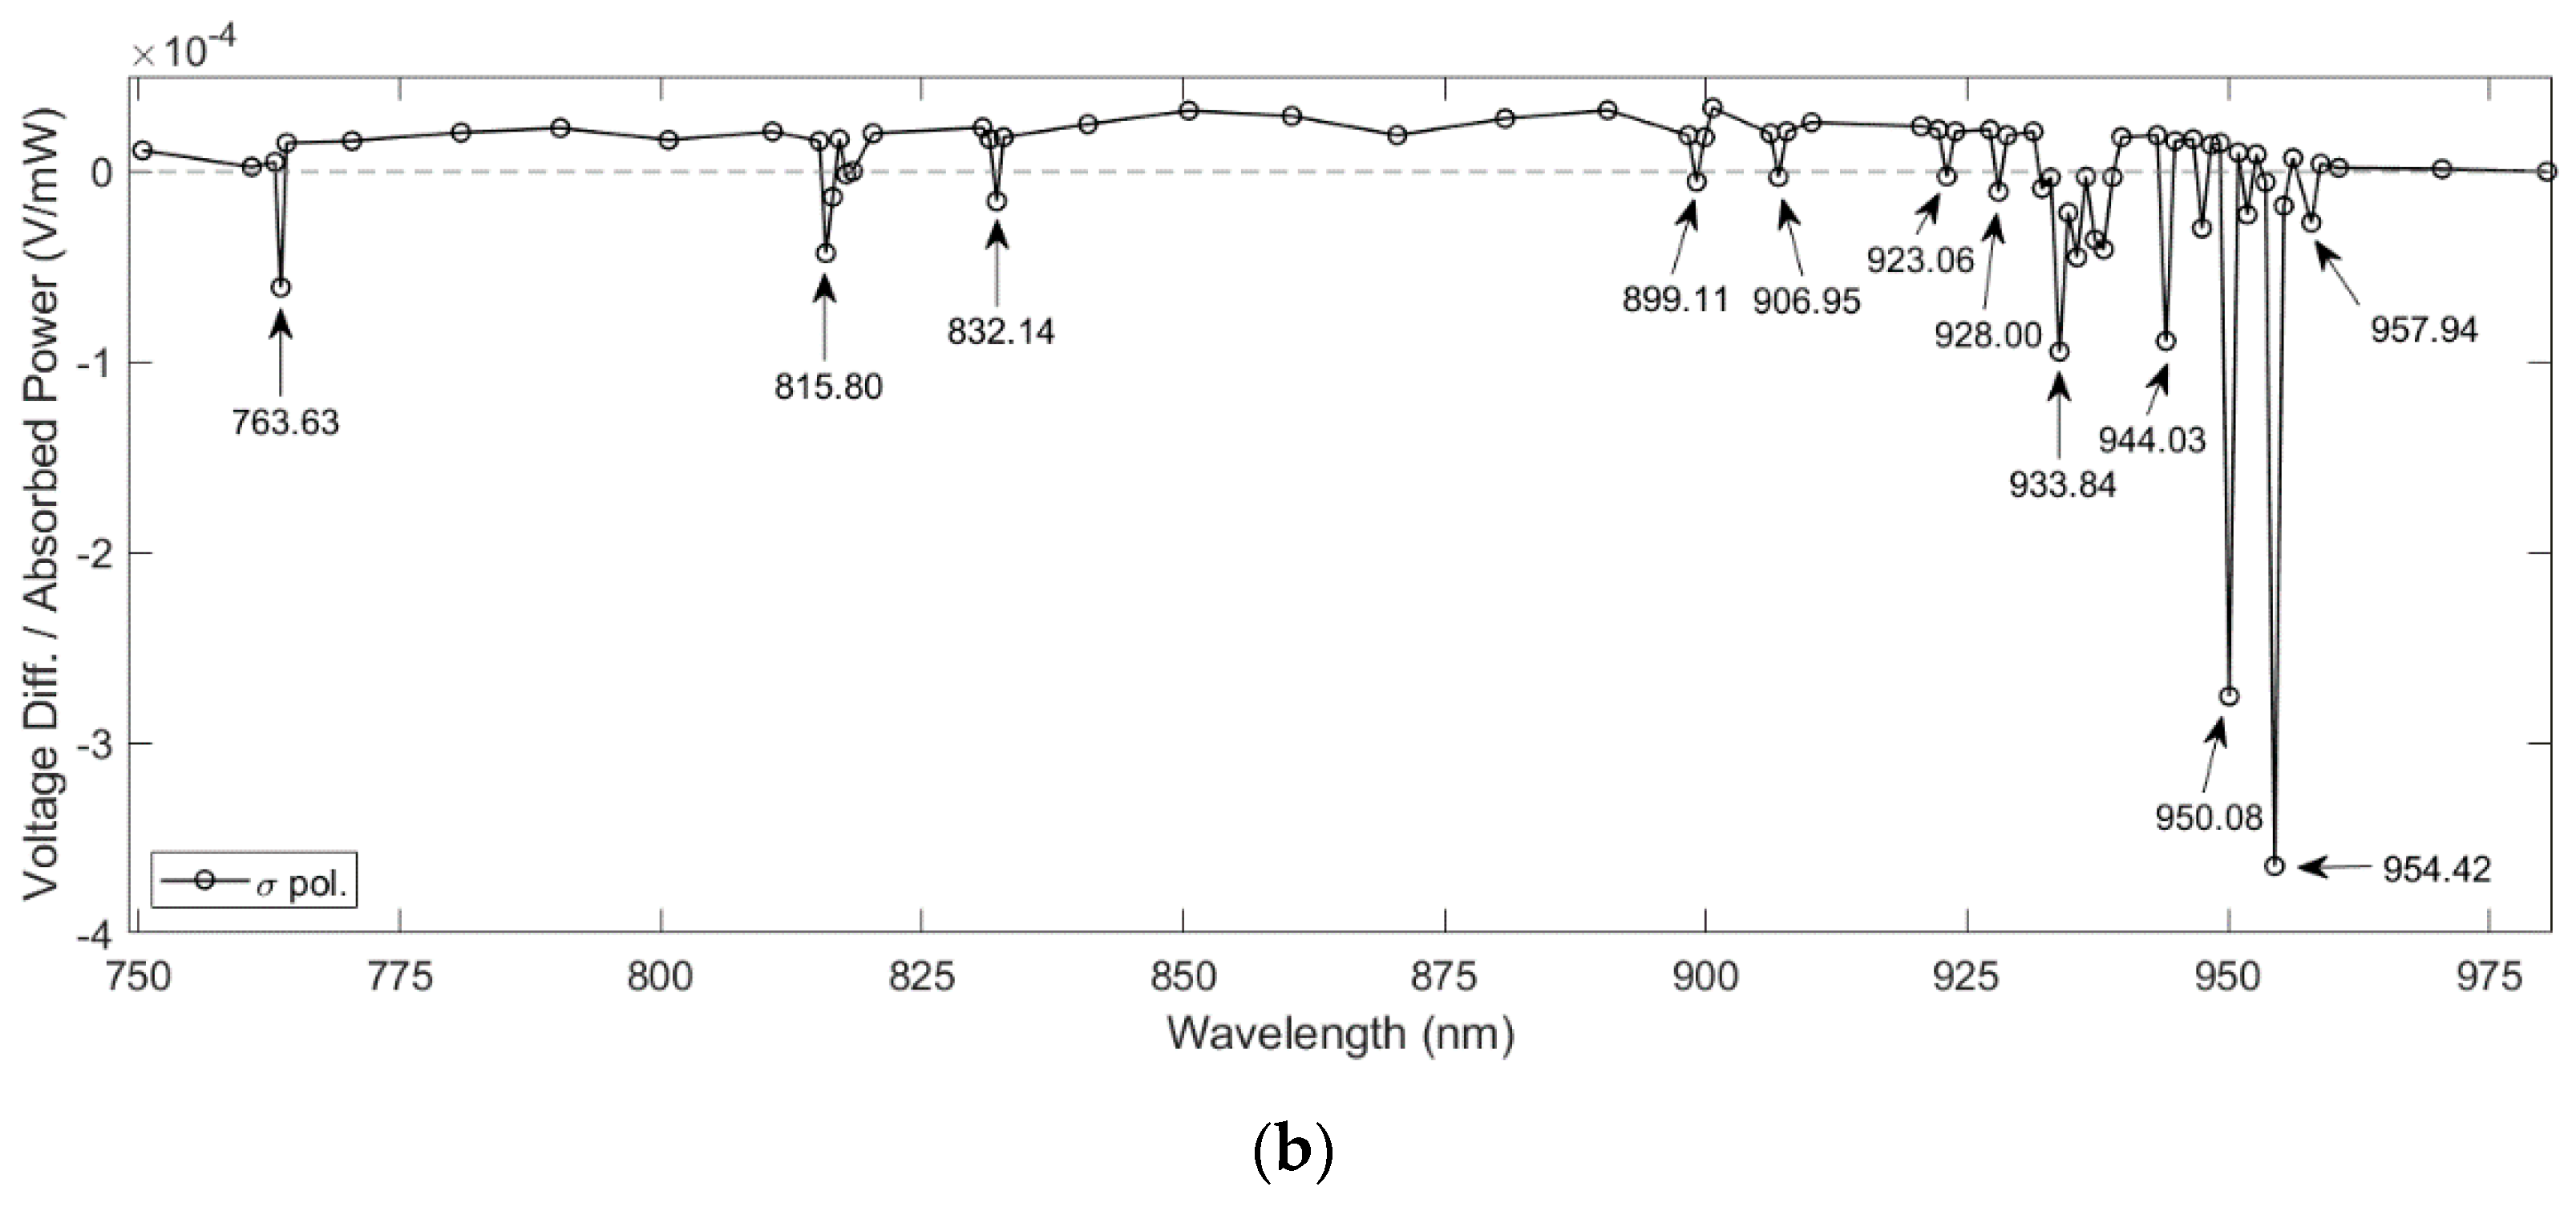
| 815.80 | 12,257.91 | (2A(0), vd) | 4 | 12,199.56 | −58.35 |
| 832.14 | 12,017.21 | (2A(1), v = 0) | 4 | 11,906.16 | −111.05 |
| 899.11 | 11,122.11 | (2A(1), vd) | 1 | 10,999.56 | −122.55 |
| 906.95 | 11,025.97 | (2A(1), vd) | 2 | 10,999.56 | −26.41 |
| 928.00 | 10,775.86 | (2A(1), vd) | 3 | 10,999.56 | 223.70 |
| 933.84 | 10,708.47 | (2A(1), vd) | 4 | 10,999.56 | 291.09 |
| 944.03 | 10,592.88 | (2A(2), v = 0) | 1 | 10,496.16 | −96.72 |
| 950.08 | 10,525.43 | (2A(2), v = 0) | 2 | 10,496.16 | −29.27 |
| 954.42 | 10,477.57 | (2A(2), v = 0) | 3 | 10,496.16 | 18.59 |
| 957.90 | 10,439.50 | (2A(2), v = 0) | 4 | 10,496.16 | 56.66 |
| Average: | 13.24 |
Publisher’s Note: MDPI stays neutral with regard to jurisdictional claims in published maps and institutional affiliations. |
© 2022 by the authors. Licensee MDPI, Basel, Switzerland. This article is an open access article distributed under the terms and conditions of the Creative Commons Attribution (CC BY) license (https://creativecommons.org/licenses/by/4.0/).
Share and Cite
Andre, L.B.; Cheng, L.; Rand, S.C. Saturation, Allowed Transitions and Quantum Interference in Laser Cooling of Solids. Appl. Sci. 2022, 12, 953. https://doi.org/10.3390/app12030953
Andre LB, Cheng L, Rand SC. Saturation, Allowed Transitions and Quantum Interference in Laser Cooling of Solids. Applied Sciences. 2022; 12(3):953. https://doi.org/10.3390/app12030953
Chicago/Turabian StyleAndre, Laura B., Long Cheng, and Stephen C. Rand. 2022. "Saturation, Allowed Transitions and Quantum Interference in Laser Cooling of Solids" Applied Sciences 12, no. 3: 953. https://doi.org/10.3390/app12030953
APA StyleAndre, L. B., Cheng, L., & Rand, S. C. (2022). Saturation, Allowed Transitions and Quantum Interference in Laser Cooling of Solids. Applied Sciences, 12(3), 953. https://doi.org/10.3390/app12030953