
Kinematic Relations during Double Support Phase in Parkinsonian Gait


Abstract
:Featured Application
Abstract
1. Introduction
2. Materials and Methods
2.1. Participants
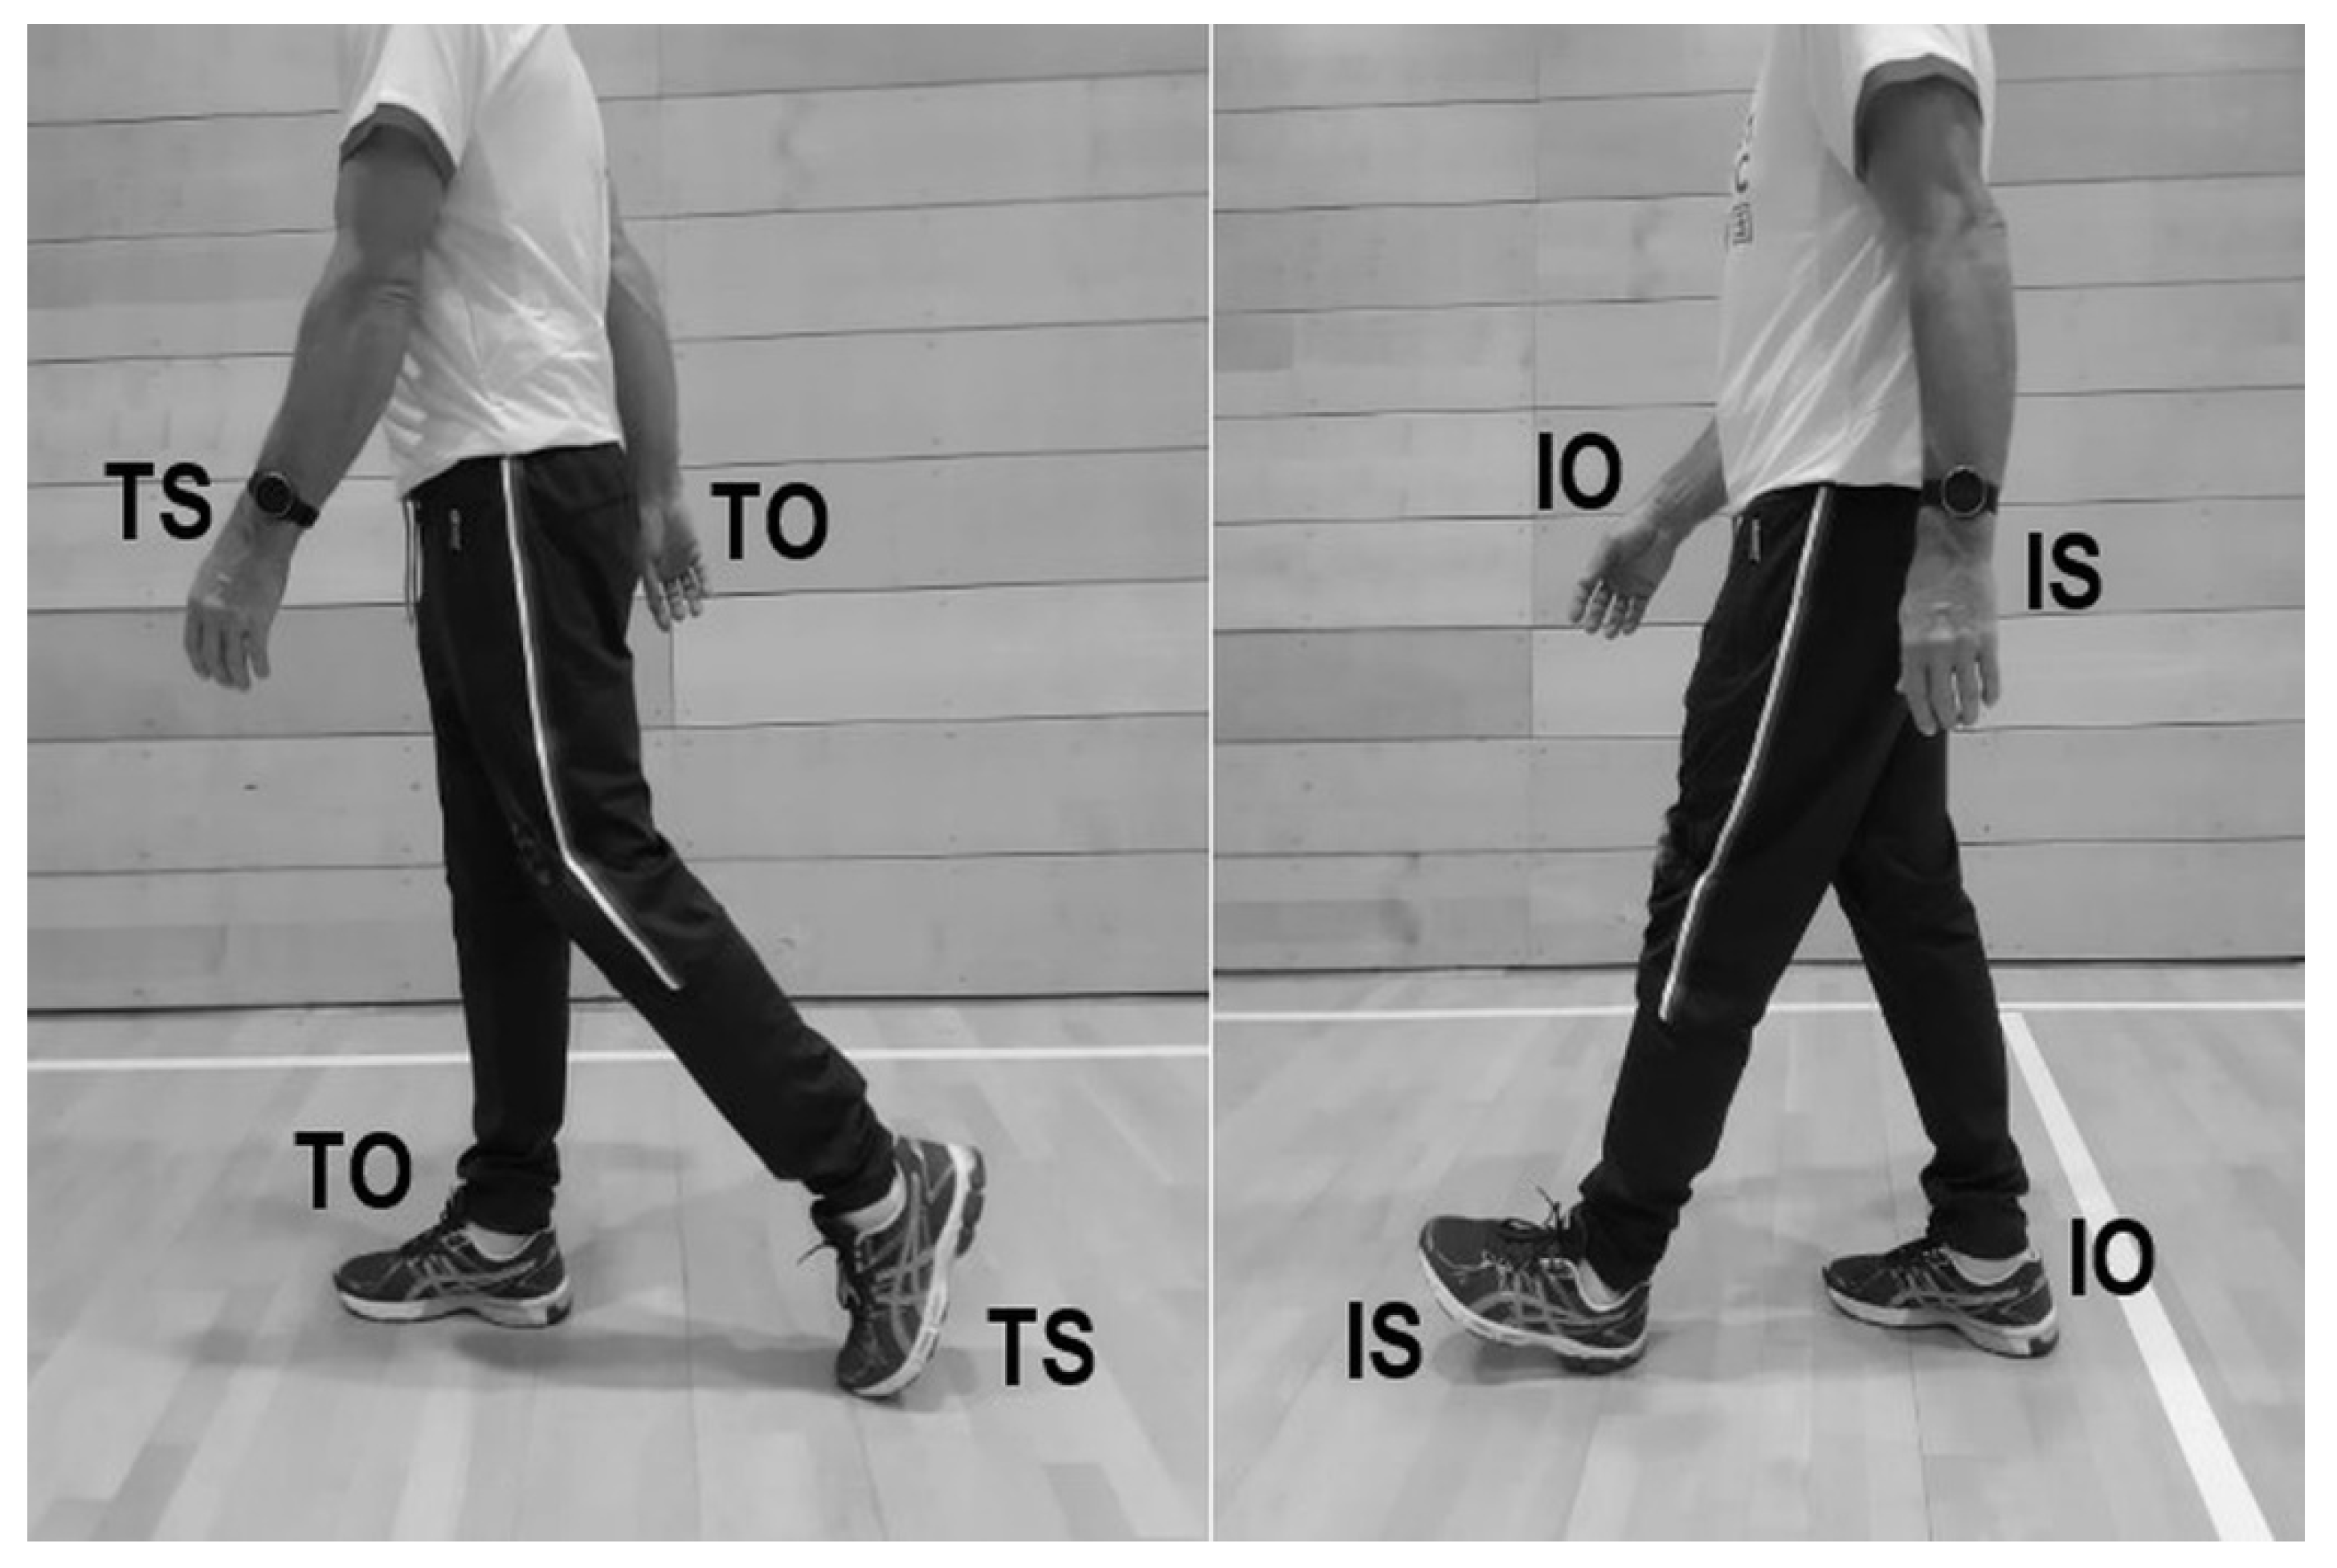
2.2. Recording Method
2.3. Analysed Gait Parameters
2.4. Statistical Evaluation
3. Results
4. Discussion
5. Conclusions
Author Contributions
Funding
Institutional Review Board Statement
Informed Consent Statement
Data Availability Statement
Conflicts of Interest
References
- Sveinbjornsdottir, S. The clinical symptoms of Parkinson’s disease. J. Neurochem. 2016, 139, 318–324. [Google Scholar] [CrossRef] [Green Version]
- Pringsheim, T.; Jette, N.; Frolkis, A.; Steeves, T.D.L. The prevalence of Parkinson’s disease: A systematic review and meta-analysis. Mov. Disord. 2014, 29, 1583–1590. [Google Scholar] [CrossRef] [PubMed]
- Kurz, M.J.; Hou, J.G. Levodopa influences the regularity of the ankle joint kinematics in individuals with Parkinson’s disease. J. Comput. Neurosci. 2010, 28, 131–136. [Google Scholar] [CrossRef]
- Poláková, K.; Růžička, E.; Jech, R.; Kemlink, D.; Rusz, J.; Miletínová, E.; Brožová, H. 3D visual cueing shortens the double support phase of the gait cycle in patients with advanced Parkinson’ s disease treated with DBS of the STN. PLoS ONE 2020, 15, e0244676. [Google Scholar] [CrossRef] [PubMed]
- Morris, M.E.; Iansek, R.; Matyas, T.A.; Summers, J.J. The pathogenesis of gait hypokinesia in Parkinson’s disease. Brain 1994, 117, 1169–1181. [Google Scholar] [CrossRef]
- Kluger, B.M. Fatigue in Parkinson’s Disease. Int. Rev. Neurobiol. 2017, 133, 743–768. [Google Scholar] [CrossRef]
- Szlufik, S.; Kloda, M.; Friedman, A.; Potrzebowska, I.; Gregier, K.; Mandat, T.; Przybyszewski, A.; Dutkiewicz, J.; Figura, M.; Habela, P.; et al. The Neuromodulatory Impact of Subthalamic Nucleus Deep Brain Stimulation on Gait and Postural Instability in Parkinson’s Disease Patients: A Prospective Case Controlled Study. Front. Neurol. 2018, 9, 906. [Google Scholar] [CrossRef] [PubMed]
- El-gohary, M.; Pearson, S.; Mcnames, J.; Mancini, M.; Horak, F.; Mellone, S.; Chiari, L. Continuous Monitoring of Turning in Patients with Movement Disability. Sensors 2014, 14, 356–369. [Google Scholar] [CrossRef] [Green Version]
- Bloxham, C.A.; Mindel, T.A.; Frith, C.D. Initiation and execution of predictable and unpredictable movements in parkinson’s Disease. Brain 1984, 107, 371–384. [Google Scholar] [CrossRef]
- Plotnik, M.; Giladi, N.; Balash, Y.; Peretz, C.; Hausdorff, J.M. Is freezing of gait in Parkinson’s disease related to asymmetric motor function? Ann. Neurol. 2005, 57, 656–663. [Google Scholar] [CrossRef]
- Gazibara, T.; Pekmezovic, T.; Tepavcevic, D.K.; Tomic, A.; Stankovic, I.; Kostic, V.S.; Svetel, M. Fall frequency and risk factors in patients with Parkinson’s disease in Belgrade, Serbia: A cross-sectional study. Geriatr. Gerontol. Int. 2015, 15, 472–480. [Google Scholar] [CrossRef]
- Shukla, L.C.; Schulze, J.; Farlow, J.; Nathan, D. Parkinson Disease Overview. Gene Rev. 2019, 1–15. [Google Scholar]
- Keloth, S.M.; Arjunan, S.P.; Kumar, D.K. Variance of the gait parameters and fraction of double-support interval for determining the severity of parkinson’s disease. Appl. Sci. 2020, 10, 577. [Google Scholar] [CrossRef] [Green Version]
- Peppe, A.; Chiavalon, C.; Pasqualetti, P.; Crovato, D.; Caltagirone, C. Does gait analysis quantify motor rehabilitation efficacy in Parkinson’s disease patients? Gait Posture 2007, 26, 452–462. [Google Scholar] [CrossRef] [PubMed]
- Kharb, A.; Saini, V.; Jain, Y.; Dhiman, S. A review of gait cycle and its parameters. Int. J. Comput. Eng. Manag. 2011, 13, 78–83. [Google Scholar]
- Winter, D.A.; Patla, A.E.; Frank, J.S.; Walt, S.E. Biomechanical walking pattern changes in the fit and healthy elderly. Phys. Ther. 1990, 70, 340–347. [Google Scholar] [CrossRef]
- Fisher, B.E.; Wu, A.D.; Salem, G.J.; Song, J.; Lin, C.H.J.; Yip, J.; Cen, S.; Gordon, J.; Jakowec, M.; Petzinger, G. The Effect of Exercise Training in Improving Motor Performance and Corticomotor Excitability in People With Early Parkinson’s Disease. Arch. Phys. Med. Rehabil. 2008, 89, 1221–1229. [Google Scholar] [CrossRef] [PubMed] [Green Version]
- Zanardi, A.P.J.; da Silva, E.S.; Costa, R.R.; Passos-Monteiro, E.; Santos, I.O.d.; Kruel, L.F.M.; Peyré-Tartaruga, L.A. Gait parameters of Parkinson’s disease compared with healthy controls: A systematic review and meta-analysis. Sci. Rep. 2021, 11, 752. [Google Scholar] [CrossRef]
- Pedersen, S.W.; Öberg, B.; Larsson, L.E.; Lindval, B. Gait analysis, isokinetic muscle strength measurement in patients with Parkinson’s disease. Scand. J. Rehabil. Med. 1997, 29, 67–74. [Google Scholar] [PubMed]
- Sofuwa, O.; Nieuwboer, A.; Desloovere, K.; Willems, A.M.; Chavret, F.; Jonkers, I. Quantitative gait analysis in Parkinson’s disease: Comparison with a healthy control group. Arch. Phys. Med. Rehabil. 2005, 86, 1007–1013. [Google Scholar] [CrossRef] [Green Version]
- Abdulhay, E.; Arunkumar, N.; Narasimhan, K.; Vellaiappan, E.; Venkatraman, V. Gait and tremor investigation using machine learning techniques for the diagnosis of Parkinson disease. Futur. Gener. Comput. Syst. 2018, 83, 366–373. [Google Scholar] [CrossRef]
- Ferrarin, M.; Lopiano, L.; Rizzone, M.; Lanotte, M.; Bergamasco, B.; Recalcati, M.; Pedotti, A. Quantitative analysis of gait in Parkinson’s disease: A pilot study on the effects of bilateral sub-thalamic stimulation. Gait Posture 2002, 161, 35–148. [Google Scholar] [CrossRef]
- Vaillancourt, D.E.; Prodoehl, J.; Sturman, M.M.; Bakay, R.A.E.; Metman, L.V.; Corcos, D.M. Effects of deep brain stimulation and medication on strength, bradykinesia, and electromyographic patterns of the ankle joint in Parkinson’s disease. Mov. Disord. 2006, 21, 50–58. [Google Scholar] [CrossRef] [PubMed] [Green Version]
- Halliday, S.E.; Winter, D.A.; Frank, J.S.; Patla, A.E.; Ontario, N.L.G. The initiation of gait in young, elderly, and Parkinson’s disease subjects. Gait Posture 1998, 8, 8–14. [Google Scholar] [CrossRef]
- Balestrino, R.; Schapira, A.H.V. Parkinson disease. Eur. J. Neurol. 2020, 27, 27–42. [Google Scholar] [CrossRef]
- Schilling, B.K.; Pfeiffer, R.F.; Ledoux, M.S.; Karlage, R.E.; Bloomer, R.J.; Falvo, M.J. Effects of moderate-volume, high-load lower-body resistance training on strength and function in persons with parkinson’s disease: A pilot study. Parkinsons Dis. 2020, 2010, 824734. [Google Scholar] [CrossRef] [PubMed] [Green Version]
- Sitek, O.; Kalichová, M.; Baláž, M.; Hedbávný, P.; Boušek, T. Gait analysis of patients with Parkinson’s disease in relation to apposite data selection. Recent Res. Sport. Sci. 2020, 2, 14–29. [Google Scholar]
- Maki, B.E. Gait changes in older adults: Predictors of falls or indicators of fear? J. Am. Geriatr. Soc. 1997, 45, 313–320. [Google Scholar] [CrossRef]
- Kalichová, M. “Parkinsonian Gait”. Mendeley Data, V1. 2021. Available online: https://data.mendeley.com/ (accessed on 22 December 2021).
- Kasović, M.; Štefan, L.; Zvonař, M. Domain-specific and total sedentary behavior associated with gait velocity in older adults: The mediating role of physical fitness. Int. J. Environ. Res. Public Health 2020, 17, 593. [Google Scholar] [CrossRef] [Green Version]
- Ciprandi, D.; Zago, M.; Bertozzi, F.; Sforza, C.; Galvani, C. Influence of energy cost and physical fitness on the preferred walking speed and gait variability in elderly women. J. Electromyogr. Kinesiol. 2018, 43, 1–6. [Google Scholar] [CrossRef]
- Elbers, R.G.; van Wegen, E.E.H.; Verhoef, J.; Kwakkel, G. Is gait speed a valid measure to predict community ambulation in patients with Parkinson’s disease? J. Rehabil. Med. 2013, 45, 370–375. [Google Scholar] [CrossRef] [Green Version]
- Mak, M.K.Y.; Pang, M.Y.C. Parkinsonian single fallers versus recurrent fallers: Different fall characteristics and clinical features. J. Neurol. 2010, 257, 1543–1551. [Google Scholar] [CrossRef] [PubMed]
- Kimmeskamp, S.; Hennig, E.M. Heel to toe motion characteristics in Parkinson patients during free walking. Clin. Biomech. 2001, 16, 806–812. [Google Scholar] [CrossRef]
- Tomlinson, C.; Patel, S.; Meek, C.; Herd, C.; Clarke, C.; Stowe, R.; Shah, L.; Sackley, C.M.; Deane, K.H.; Wheatley, K.; et al. Physiotherapy versus placebo or no intervention in Parkinson’s disease. Cochrane Collab. Rev. 2013, 1, 1–118. [Google Scholar] [CrossRef] [PubMed] [Green Version]
- Morris, S.; Morris, M.E.; Iansek, R. With the Timed “ Up & Go ” Test in. Phys. Ther. 2001, 81, 810–818. [Google Scholar] [PubMed]

| PD (n = 165) | CS (n = 165) | ||||||
|---|---|---|---|---|---|---|---|
| Variables | Median | IqR (25–75) | Median | IqR (25–75) | Mann-Whitney U (p) | Cohen d | |
| Spatial variables | Step length | 0.448 | 0.139 | 0.576 | 0.083 | 0.0000 | 1.6 |
| Step length index | 0.265 | 0.089 | 0.346 | 0.035 | 0.0000 | 1.9 | |
| Step width | 0.199 | 0.065 | 0.159 | 0.051 | 0.0000 | −0.8 | |
| Step width index | 0.115 | 0.036 | 0.092 | 0.029 | 0.0000 | −0.8 | |
| Temporal variables | Step-time | 0.540 | 0.100 | 0.520 | 0.060 | 0.0076 | −0.7 |
| Stride time | 1.070 | 0.190 | 1.040 | 0.090 | 0.0237 | −0.7 | |
| DST | 0.165 | 0.080 | 0.130 | 0.040 | 0.0000 | −1.1 | |
| SST | 0.380 | 0.070 | 0.400 | 0.030 | 0.0078 | 0.0 | |
| DST % | 15.311 | 4.600 | 12.500 | 2.679 | 0.0000 | −1.2 | |
| SST % | 33.905 | 5.270 | 37.383 | 2.597 | 0.0000 | 1.2 | |
| Walking cadence n/s | 1.869 | 0.333 | 1.923 | 0.165 | 0.0237 | 0.6 | |
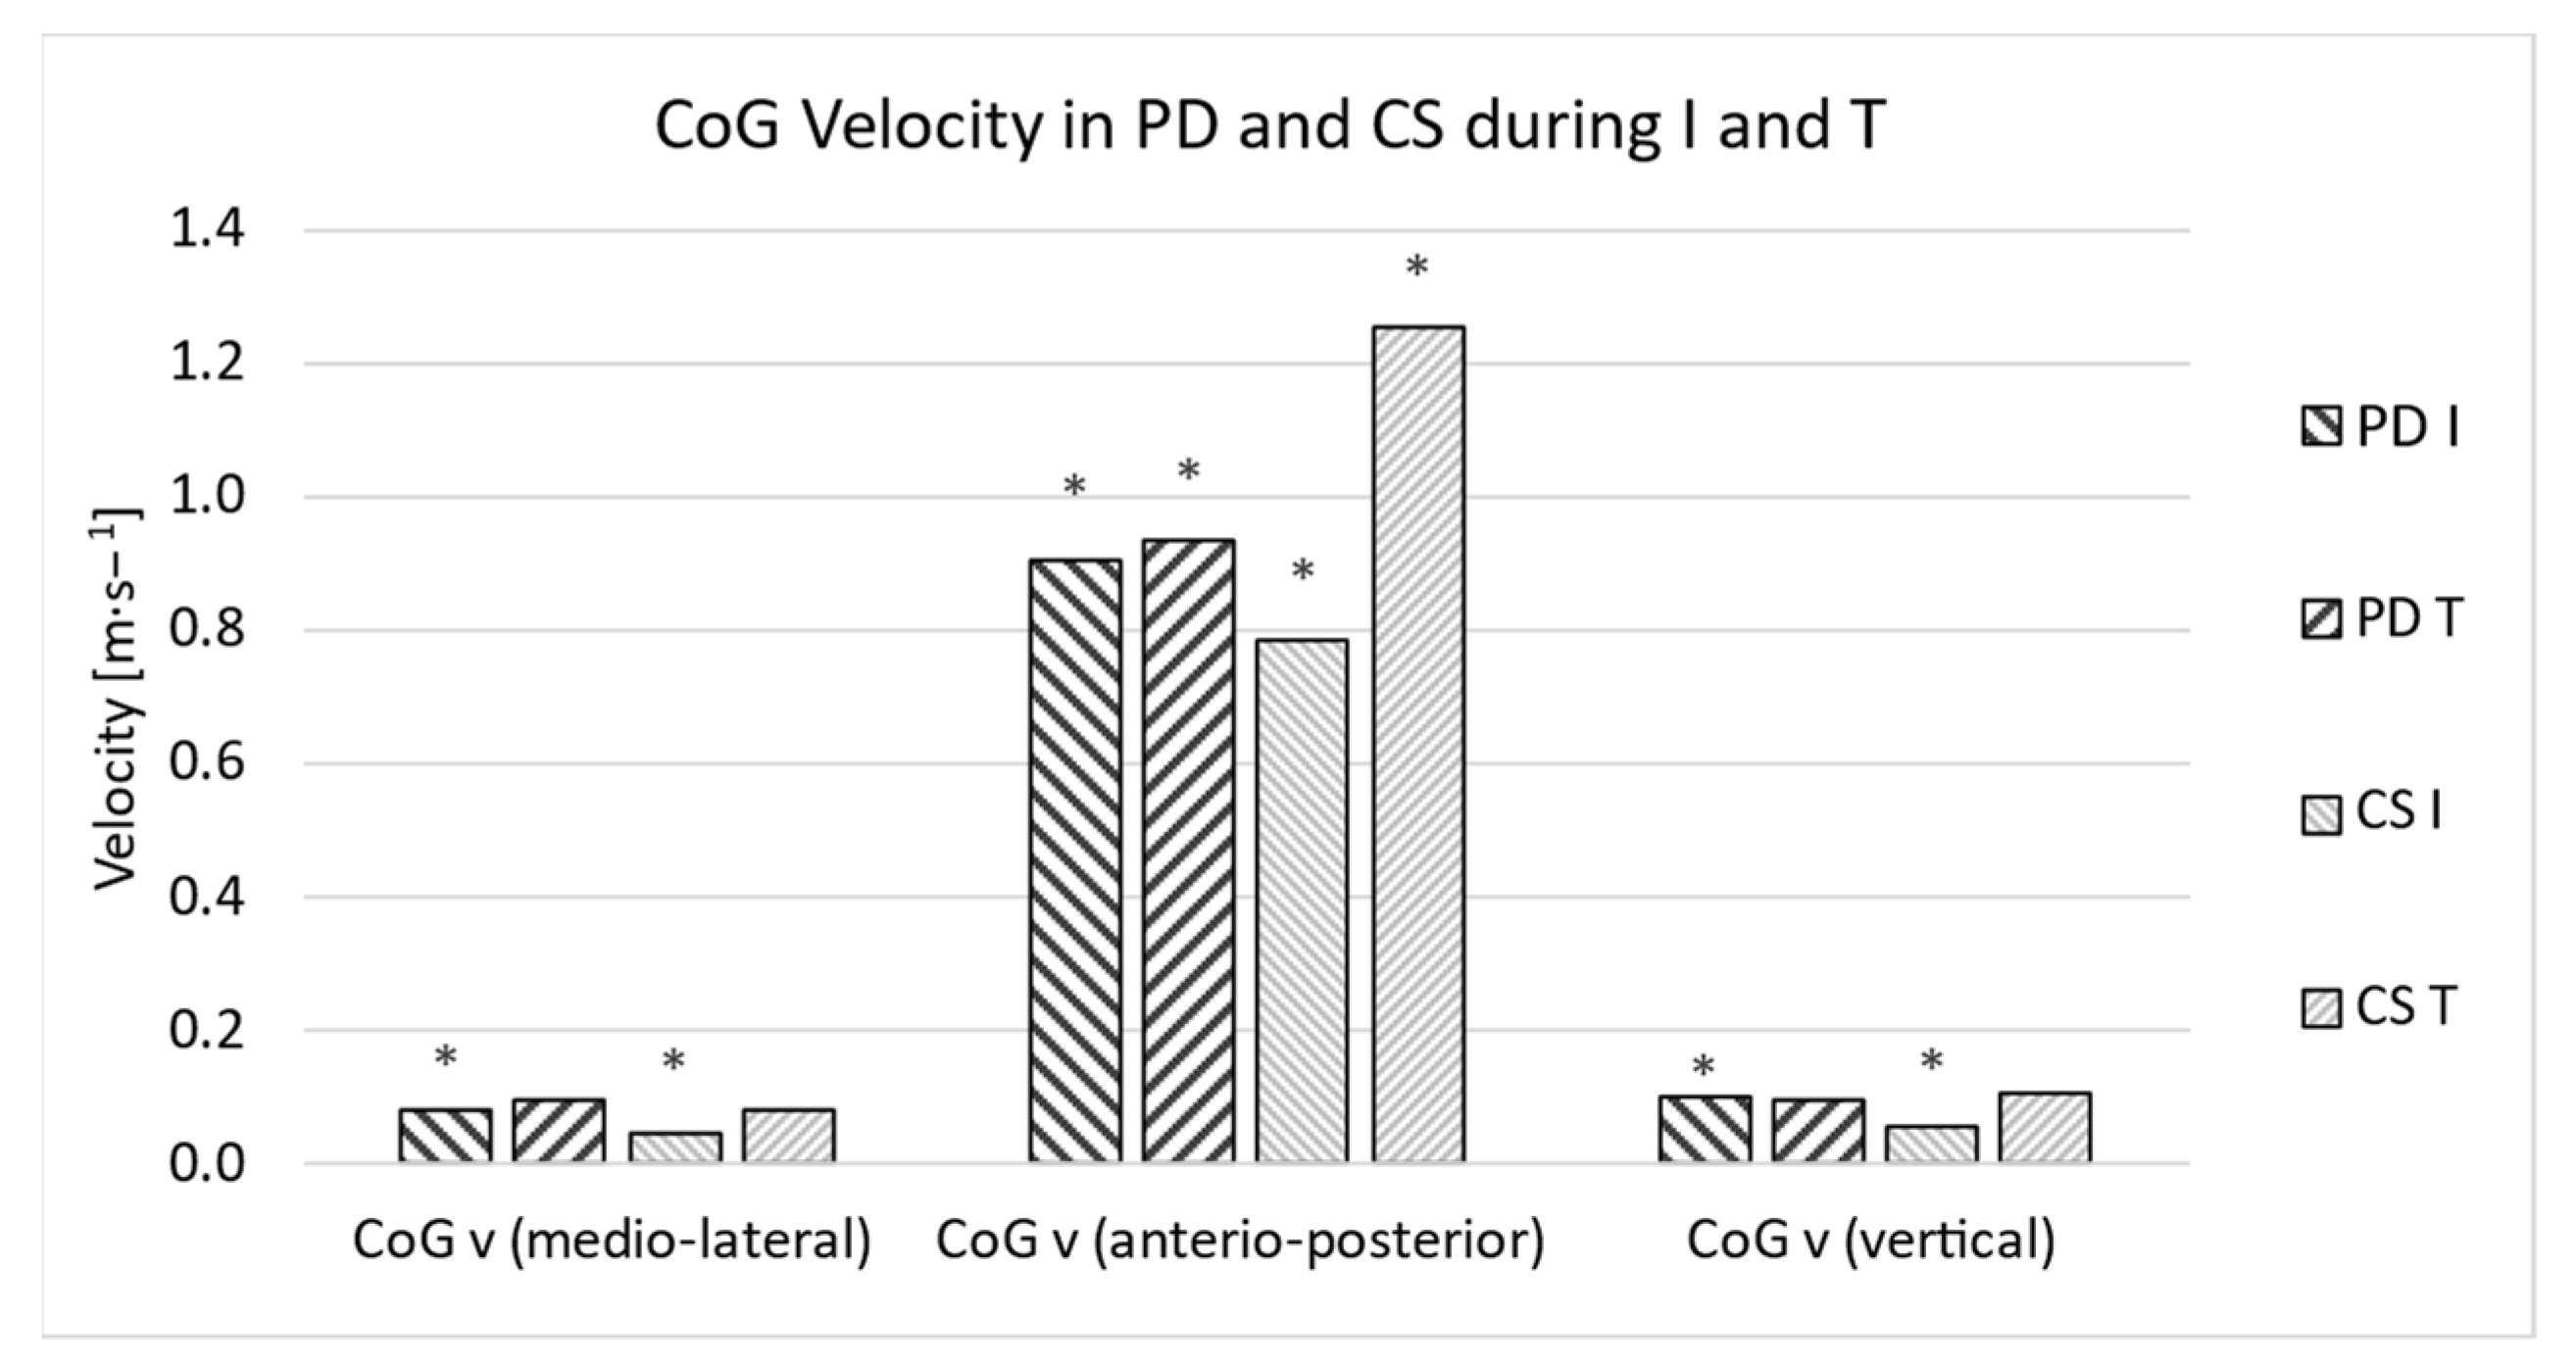
| I CoG v (medio-lateral) | 0.082 | 0.073 | 0.049 | 0.047 | 0.0000 | −0.8 | |
| I CoG v (anterio-posterior) | 0.908 | 0.505 | 0.785 | 0.561 | 0.0252 | −0.2 | |
| I CoG v (vertical) | 0.100 | 0.087 | 0.058 | 0.066 | 0.0000 | −0.8 | |
| I CoG v (abs) | 0.921 | 0.515 | 0.795 | 0.561 | 0.0139 | −0.3 | |
| T CoG v (medio-lateral) | 0.095 | 0.069 | 0.084 | 0.080 | 0.4310 | −0.1 | |
| T CoG v (anterio-posterior) | 0.935 | 0.479 | 1.253 | 0.174 | 0.0000 | 1.2 | |
| T CoG v (vertical) | 0.095 | 0.089 | 0.108 | 0.048 | 0.4144 | 0.1 | |
| T CoG v (abs) | 0.945 | 0.483 | 1.265 | 0.168 | 0.0000 | 1.2 | |
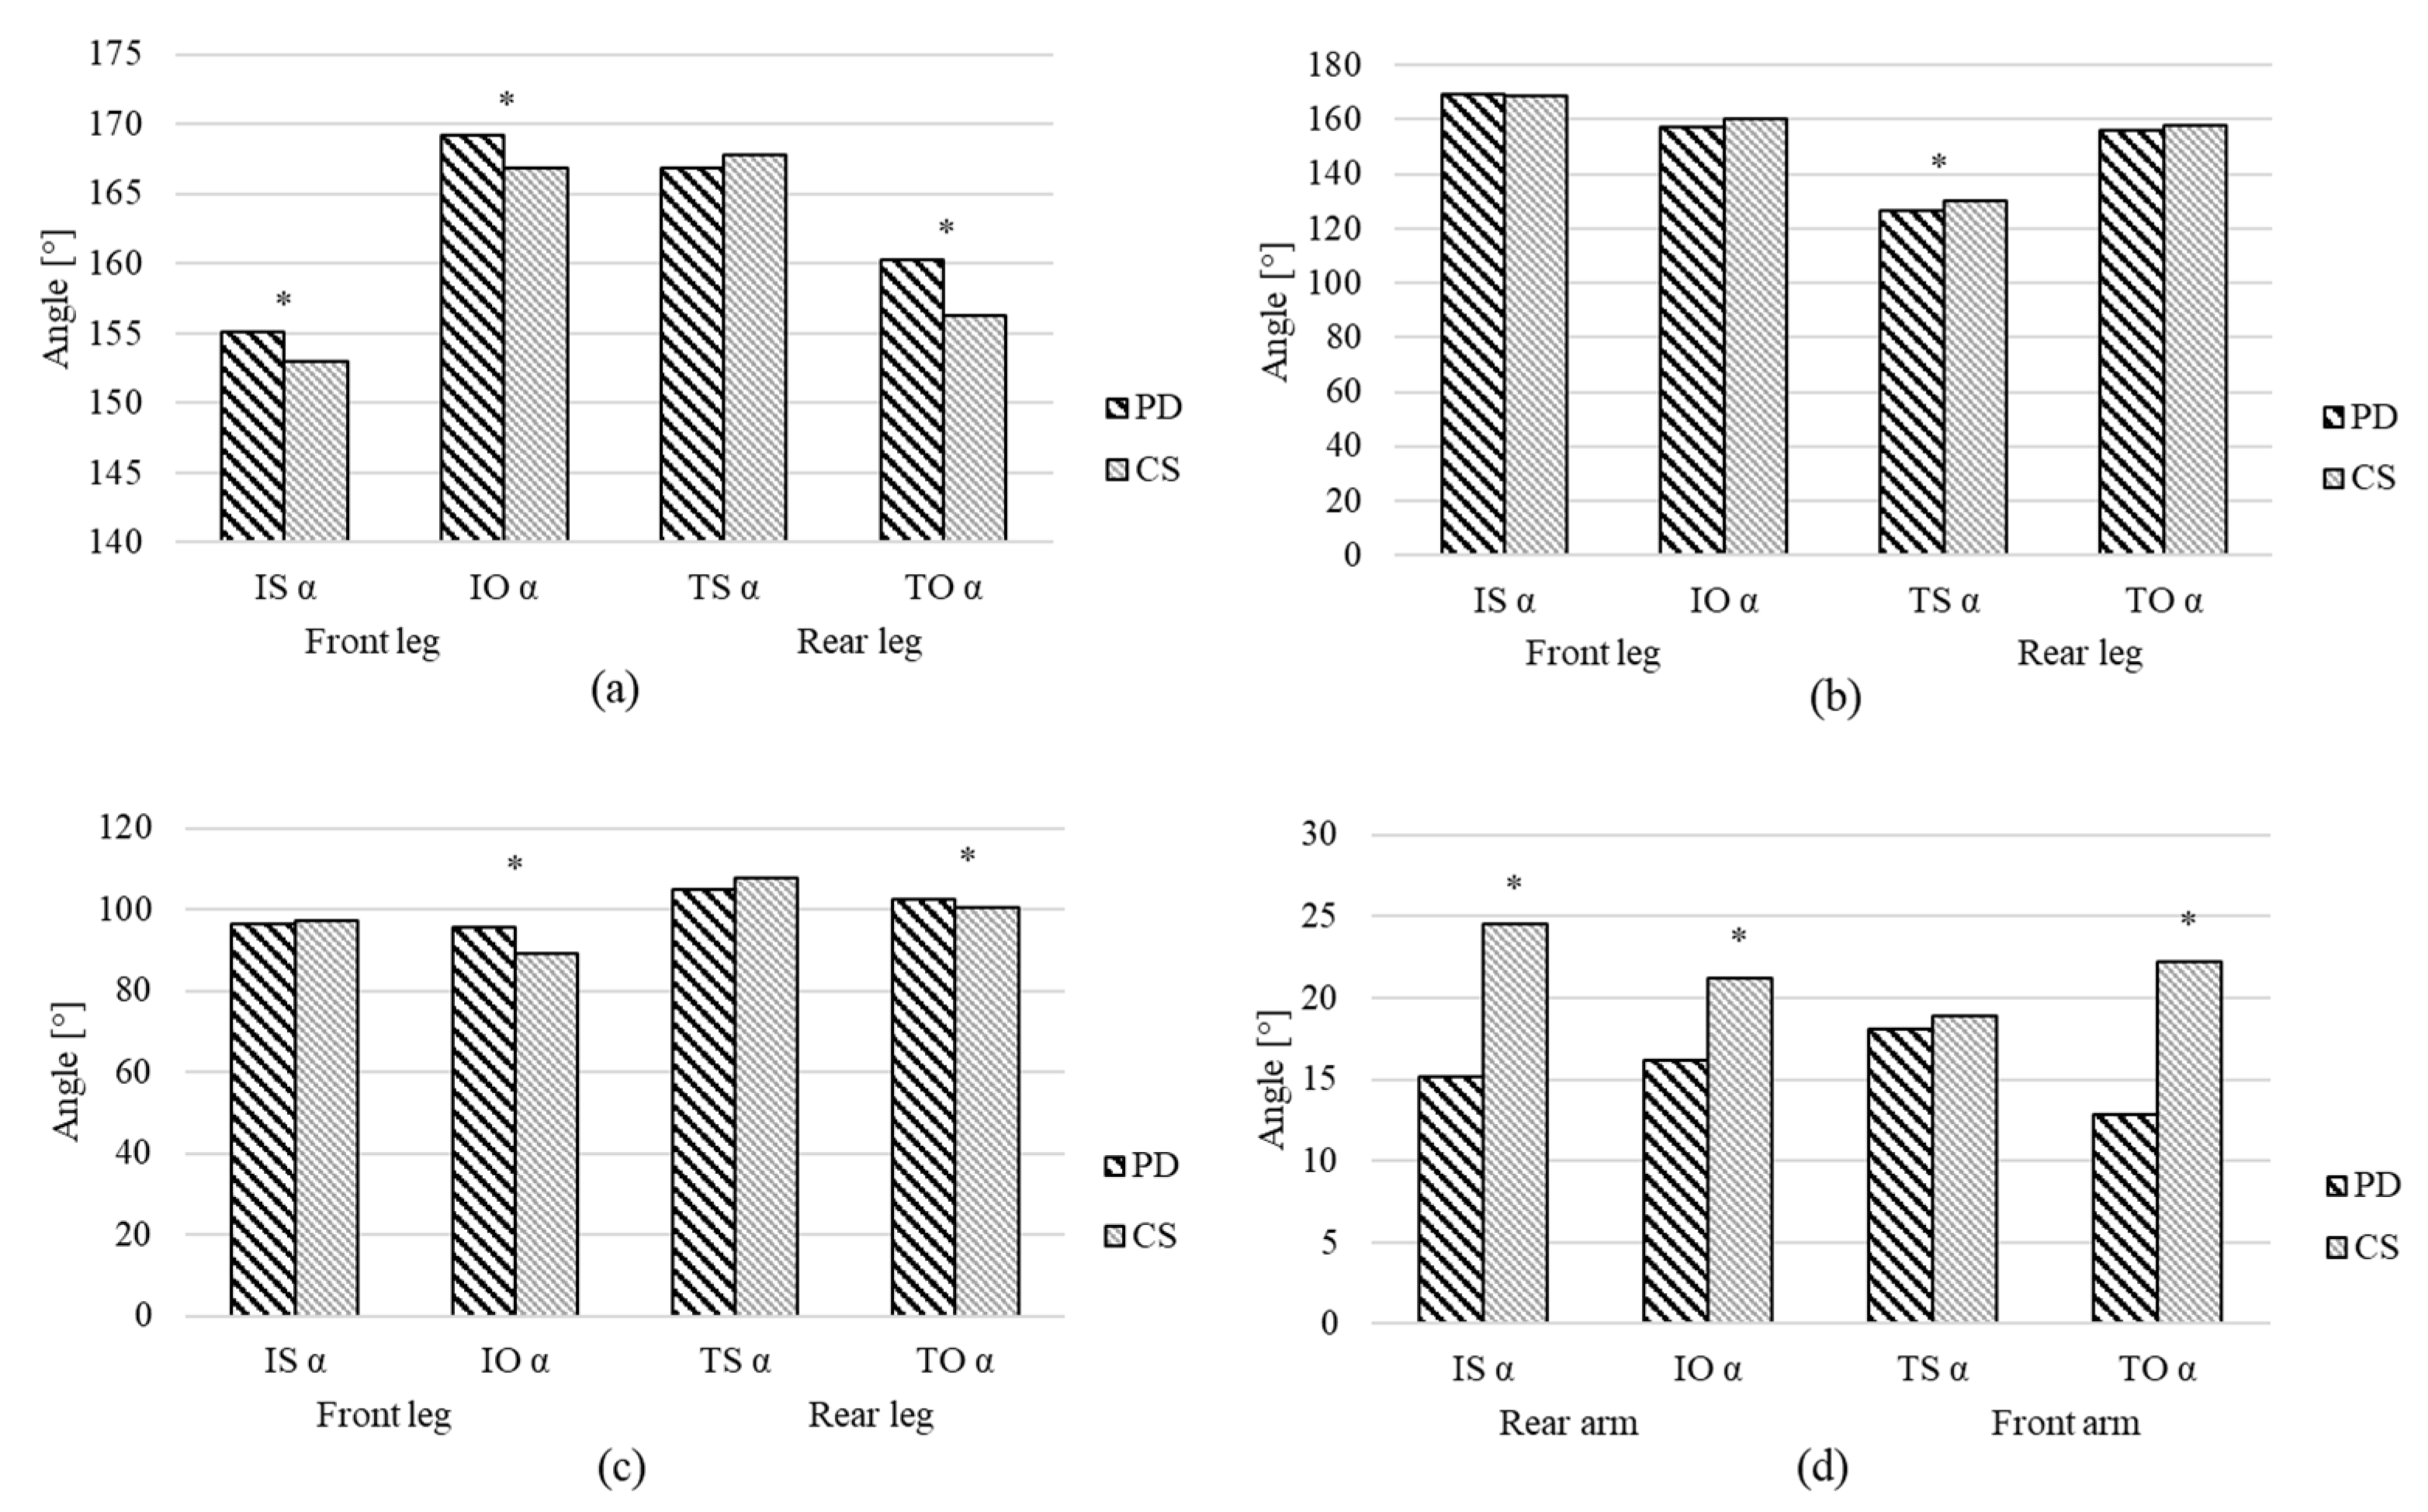
| Angular variables | IS hip α | 155.087 | 8.536 | 152.981 | 4.841 | 0.0013 | −0.3 |
| IO hip α | 169.160 | 7.345 | 166.818 | 7.299 | 0.0000 | −0.7 | |
| TS hip α | 166.861 | 6.969 | 167.810 | 4.911 | 0.1754 | 0.2 | |
| TO hip α | 160.282 | 11.520 | 156.292 | 6.942 | 0.0015 | −0.4 | |
| IS knee α | 169.251 | 16.130 | 168.687 | 6.730 | 0.8527 | 0.3 | |
| IO knee α | 157.394 | 11.205 | 160.322 | 8.840 | 0.1041 | 0.2 | |
| TS knee α | 126.587 | 10.893 | 130.260 | 8.383 | 0.0031 | 0.3 | |
| TO knee α | 156.027 | 11.571 | 157.821 | 5.700 | 0.1428 | 0.2 | |
| IS ankle α | 96.468 | 15.750 | 97.358 | 5.792 | 0.4608 | 0.0 | |
| IO ankle α | 95.763 | 10.878 | 89.039 | 4.261 | 0.0000 | −1.1 | |
| TS ankle α | 105.093 | 17.782 | 107.625 | 5.864 | 0.0857 | 0.3 | |
| TO ankle α | 102.454 | 7.653 | 100.561 | 4.542 | 0.0037 | −0.3 | |
| IS shoulder α | 15.185 | 6.049 | 24.480 | 7.132 | 0.0000 | 2.2 | |
| IO shoulder α | 16.178 | 10.133 | 21.180 | 11.552 | 0.0003 | 0.4 | |
| TS shoulder α | 18.042 | 10.145 | 18.908 | 7.762 | 0.9094 | 0.0 | |
| TO shoulder α | 12.866 | 6.688 | 22.202 | 4.445 | 0.0000 | 2.1 | |
| I Trunk lean | 1.827 | 2.278 | 4.050 | 3.334 | 0.0000 | 0.8 | |
| I Trunk rotation | 4.374 | 5.428 | 4.357 | 4.532 | 0.5723 | −0.1 | |
| T Trunk lean | 2.166 | 1.585 | 3.550 | 3.498 | 0.0001 | 0.5 | |
| T Trunk rotation | 3.819 | 5.268 | 3.402 | 3.571 | 0.0939 | −0.3 | |
| Variable I | Variable II | ρ (PD) | ρ (CS) |
|---|---|---|---|
| Step width index | I CoG v (medio-lateral) | 0.6702 | 0.0376 |
| T CoG v (antero-posterior) | I CoG v (antero-posterior) | 0.8957 | 0.4052 |
| TS shoulder α | TO ankle α | −0.4718 | 0.4632 |
| TS shoulder α | IO shoulder α | 0.3660 | 0.9143 |
| IO shoulder α | IS shoulder α | −0.2488 | 0.3795 |
| DST % | I CoG v (antero-posterior) | −0.5469 | −0.0337 |
| SST % | I CoG v (antero-posterior) | 0.5062 | 0.3120 |
| Walking cadence N/s | I Trunk lean | −0.3178 | 0.3595 |
| Step length index | I CoG v (antero-posterior) | 0.7559 | 0.1081 |
Publisher’s Note: MDPI stays neutral with regard to jurisdictional claims in published maps and institutional affiliations. |
© 2022 by the authors. Licensee MDPI, Basel, Switzerland. This article is an open access article distributed under the terms and conditions of the Creative Commons Attribution (CC BY) license (https://creativecommons.org/licenses/by/4.0/).
Share and Cite
Sitek, O.; Kalichová, M.; Hedbávný, P.; Boušek, T.; Baláž, M. Kinematic Relations during Double Support Phase in Parkinsonian Gait. Appl. Sci. 2022, 12, 949. https://doi.org/10.3390/app12030949
Sitek O, Kalichová M, Hedbávný P, Boušek T, Baláž M. Kinematic Relations during Double Support Phase in Parkinsonian Gait. Applied Sciences. 2022; 12(3):949. https://doi.org/10.3390/app12030949
Chicago/Turabian StyleSitek, Ondřej, Miriam Kalichová, Petr Hedbávný, Tomáš Boušek, and Marek Baláž. 2022. "Kinematic Relations during Double Support Phase in Parkinsonian Gait" Applied Sciences 12, no. 3: 949. https://doi.org/10.3390/app12030949
APA StyleSitek, O., Kalichová, M., Hedbávný, P., Boušek, T., & Baláž, M. (2022). Kinematic Relations during Double Support Phase in Parkinsonian Gait. Applied Sciences, 12(3), 949. https://doi.org/10.3390/app12030949