1. Introduction
The coexistence of autonomous and conventional ships invokes questions about the safety of autonomous ships when operating in the same areas as conventional ships [
1]. Concerns about the reliability of navigation safety and legal issues [
2] have resulted the application of shore remote control systems in the degree of autonomy levels 2 and 3. Presently, the training of remote operators is recommended to be conducted in the simulation [
3] due to the similar aspects between the simulation and the remote controlling.
Remote controlling includes rapid assessment of a ship’s situation and making effective decisions regardless of the ship’s location [
4]. Accordingly, the training of remote operators should be compact and effective for trainees to obtain navigation proficiency within a relatively short period of training time. Thus, massive situational education is required for the training of the remote operator. In addition, the simulation training has to reflect real-life situations for a better content of training [
5] and effectiveness.
The application of reality to the simulation education method has been an important matter in other industries as well. In the case of aviation training, challenges to reduce the gap between reality and simulation practice have been focused on by the developers of the training system in designing simulation for realism [
6]. The practices of trends from the real world were considered to be included in the training simulation by replicating substantial aspects of real situations [
7]. In this perspective, we used the trajectory data of actual ships as the real world’s trend of navigation situations.
The ship’s trajectory data has been used in various researches. The subjects of the research were such as navigation risk identification or assessment [
8,
9] and ship traffic analysis [
10,
11,
12]. These researchers conducted the statistical analysis of the ship’s trajectory data, which is similar to this research, but for a different purpose. The other research that used ship trajectory data was focused on the route generation for an autonomous ship [
13]. The research took the ship’s trajectory data as the historical data of mariner’s experience and used various algorithms for route recommendation. The basic idea of taking historical data as a trend of actual navigation was similar to our research. However, instead of using the ship’s trajectory itself, we extracted the distribution of navigation elements and applied them in the massive generation of practical navigation scenarios.
The practical navigation scenarios that this research aimed to generate are the realistic and proper ones for the training. In the real world, the possible navigation situation would be unlimited, but not all cases are proper for the training. For example, the large multiple altering cases or circling cases can happen in the real world, but rarely. Therefore, this research analyzed the distribution of navigation elements from trajectory data and applied them to the permutation to generate massive and practical navigation scenarios to improve the simulation training of autonomous ship remote operators.
2. Materials and Methods
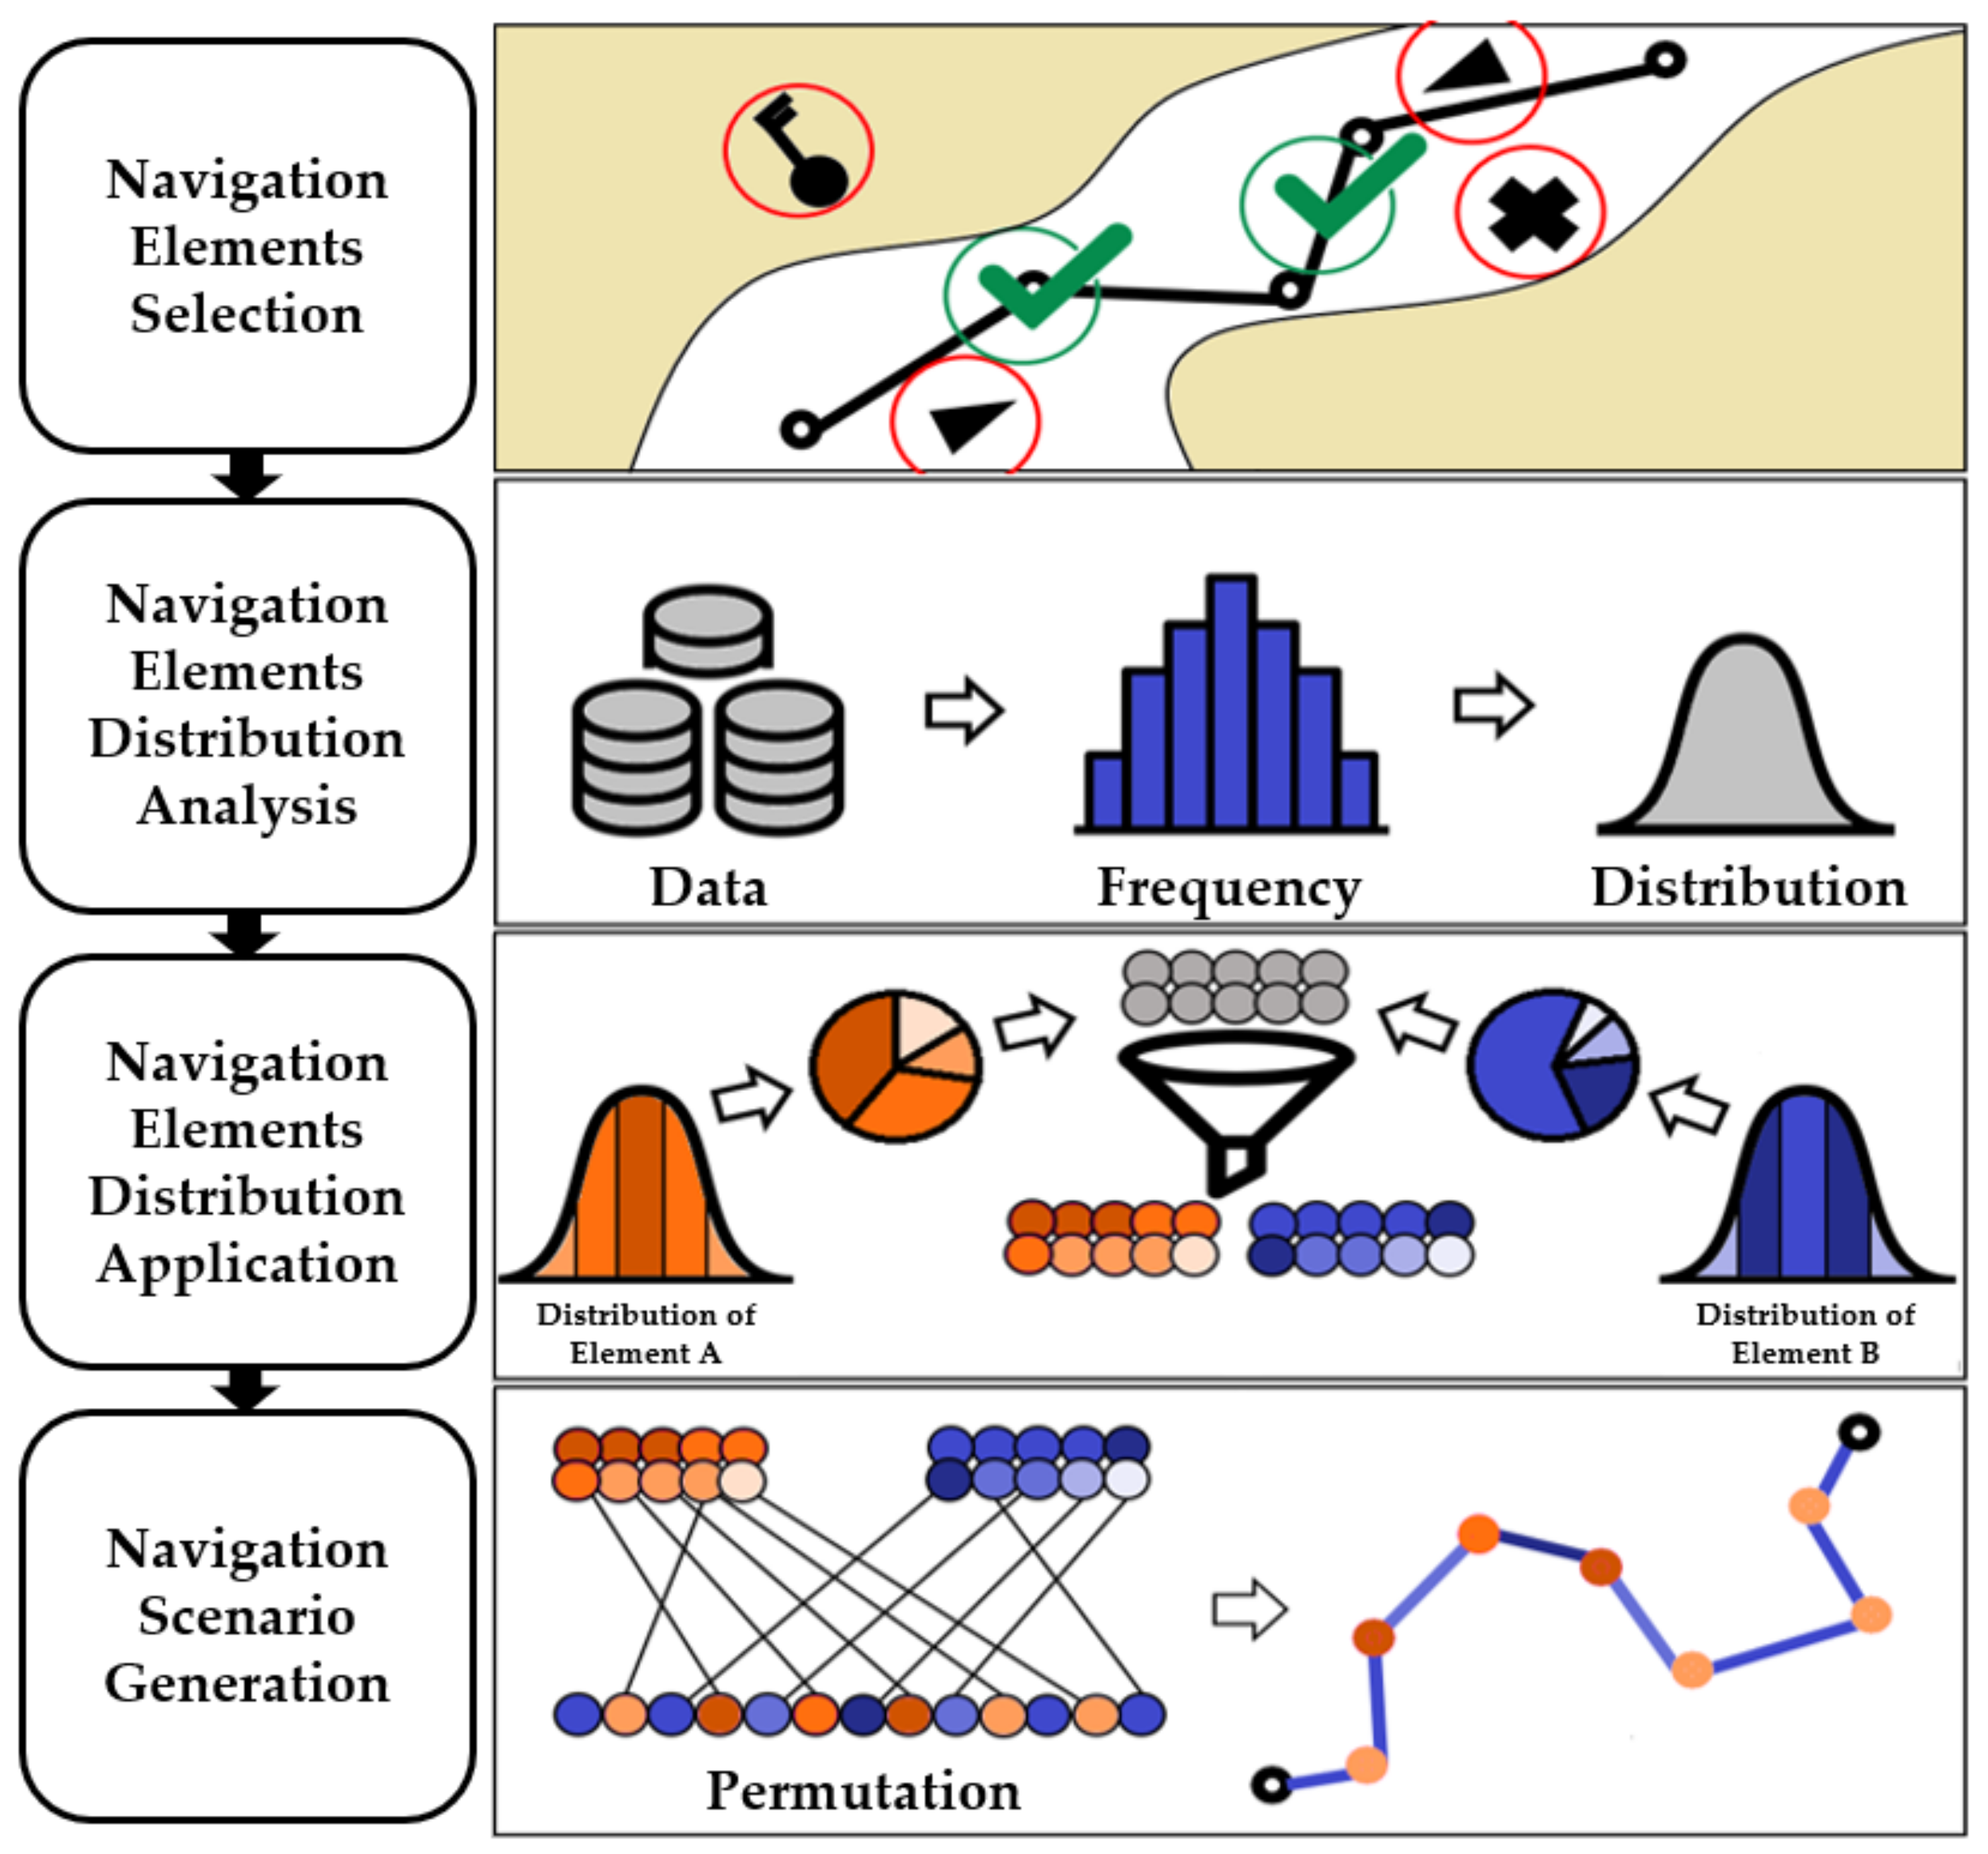
The proposed methods gathered and selected appropriate navigation elements and extracted the distribution from the collected ship trajectory data to generate practical navigation scenarios.
Figure 1 shows the workflow of the proposed method with an illustration.
Each step of the workflow is described in detail in the illustration, from the “Navigation elements selection” step to the “Navigation scenario generation” step. We selected two elements as
Figure 1 showing elements A and B, extracted the distribution of each element’s values, then applied to components of the permutation.
2.1. Navigation Element Selection
Navigation elements are the factors that comprise any given navigation situation. In this study, we collected navigation elements that have been used previously in other simulated navigation-related studies. The collected navigation elements were such as “distance between waypoints,” “course altering at waypoints” [
14], “speed acceleration” [
15], “heading,” “safe passing distance” [
16], and others. Among the various navigation elements, we selected the “course altering angle at the waypoint” and “distance between waypoints.” The reason for selecting these particular navigation elements was that they are both components of a navigation route, able to compose a basic form of navigation scenario, and considered to be sufficiently independent of each other.
2.2. Navigation Element Distribution Analysis
2.2.1. Data Collection and Preprocessing
In this study, Automatic Identification System (AIS) trajectory data from South Korea from August 1 to 31 in the year 2020 were collected. The AIS data include static ship data (e.g., Maritime Mobile Service Identify (MMSI) number and gross tonnage) and dynamic ship sensor data (e.g., date, time, and GPS data with latitude and longitude). The size of data was 30 million rows, and the number of ships was 5000 to 9000 per day. Data preprocessing involved sorting the data according to the designed experimental conditions, as shown in
Table 1.
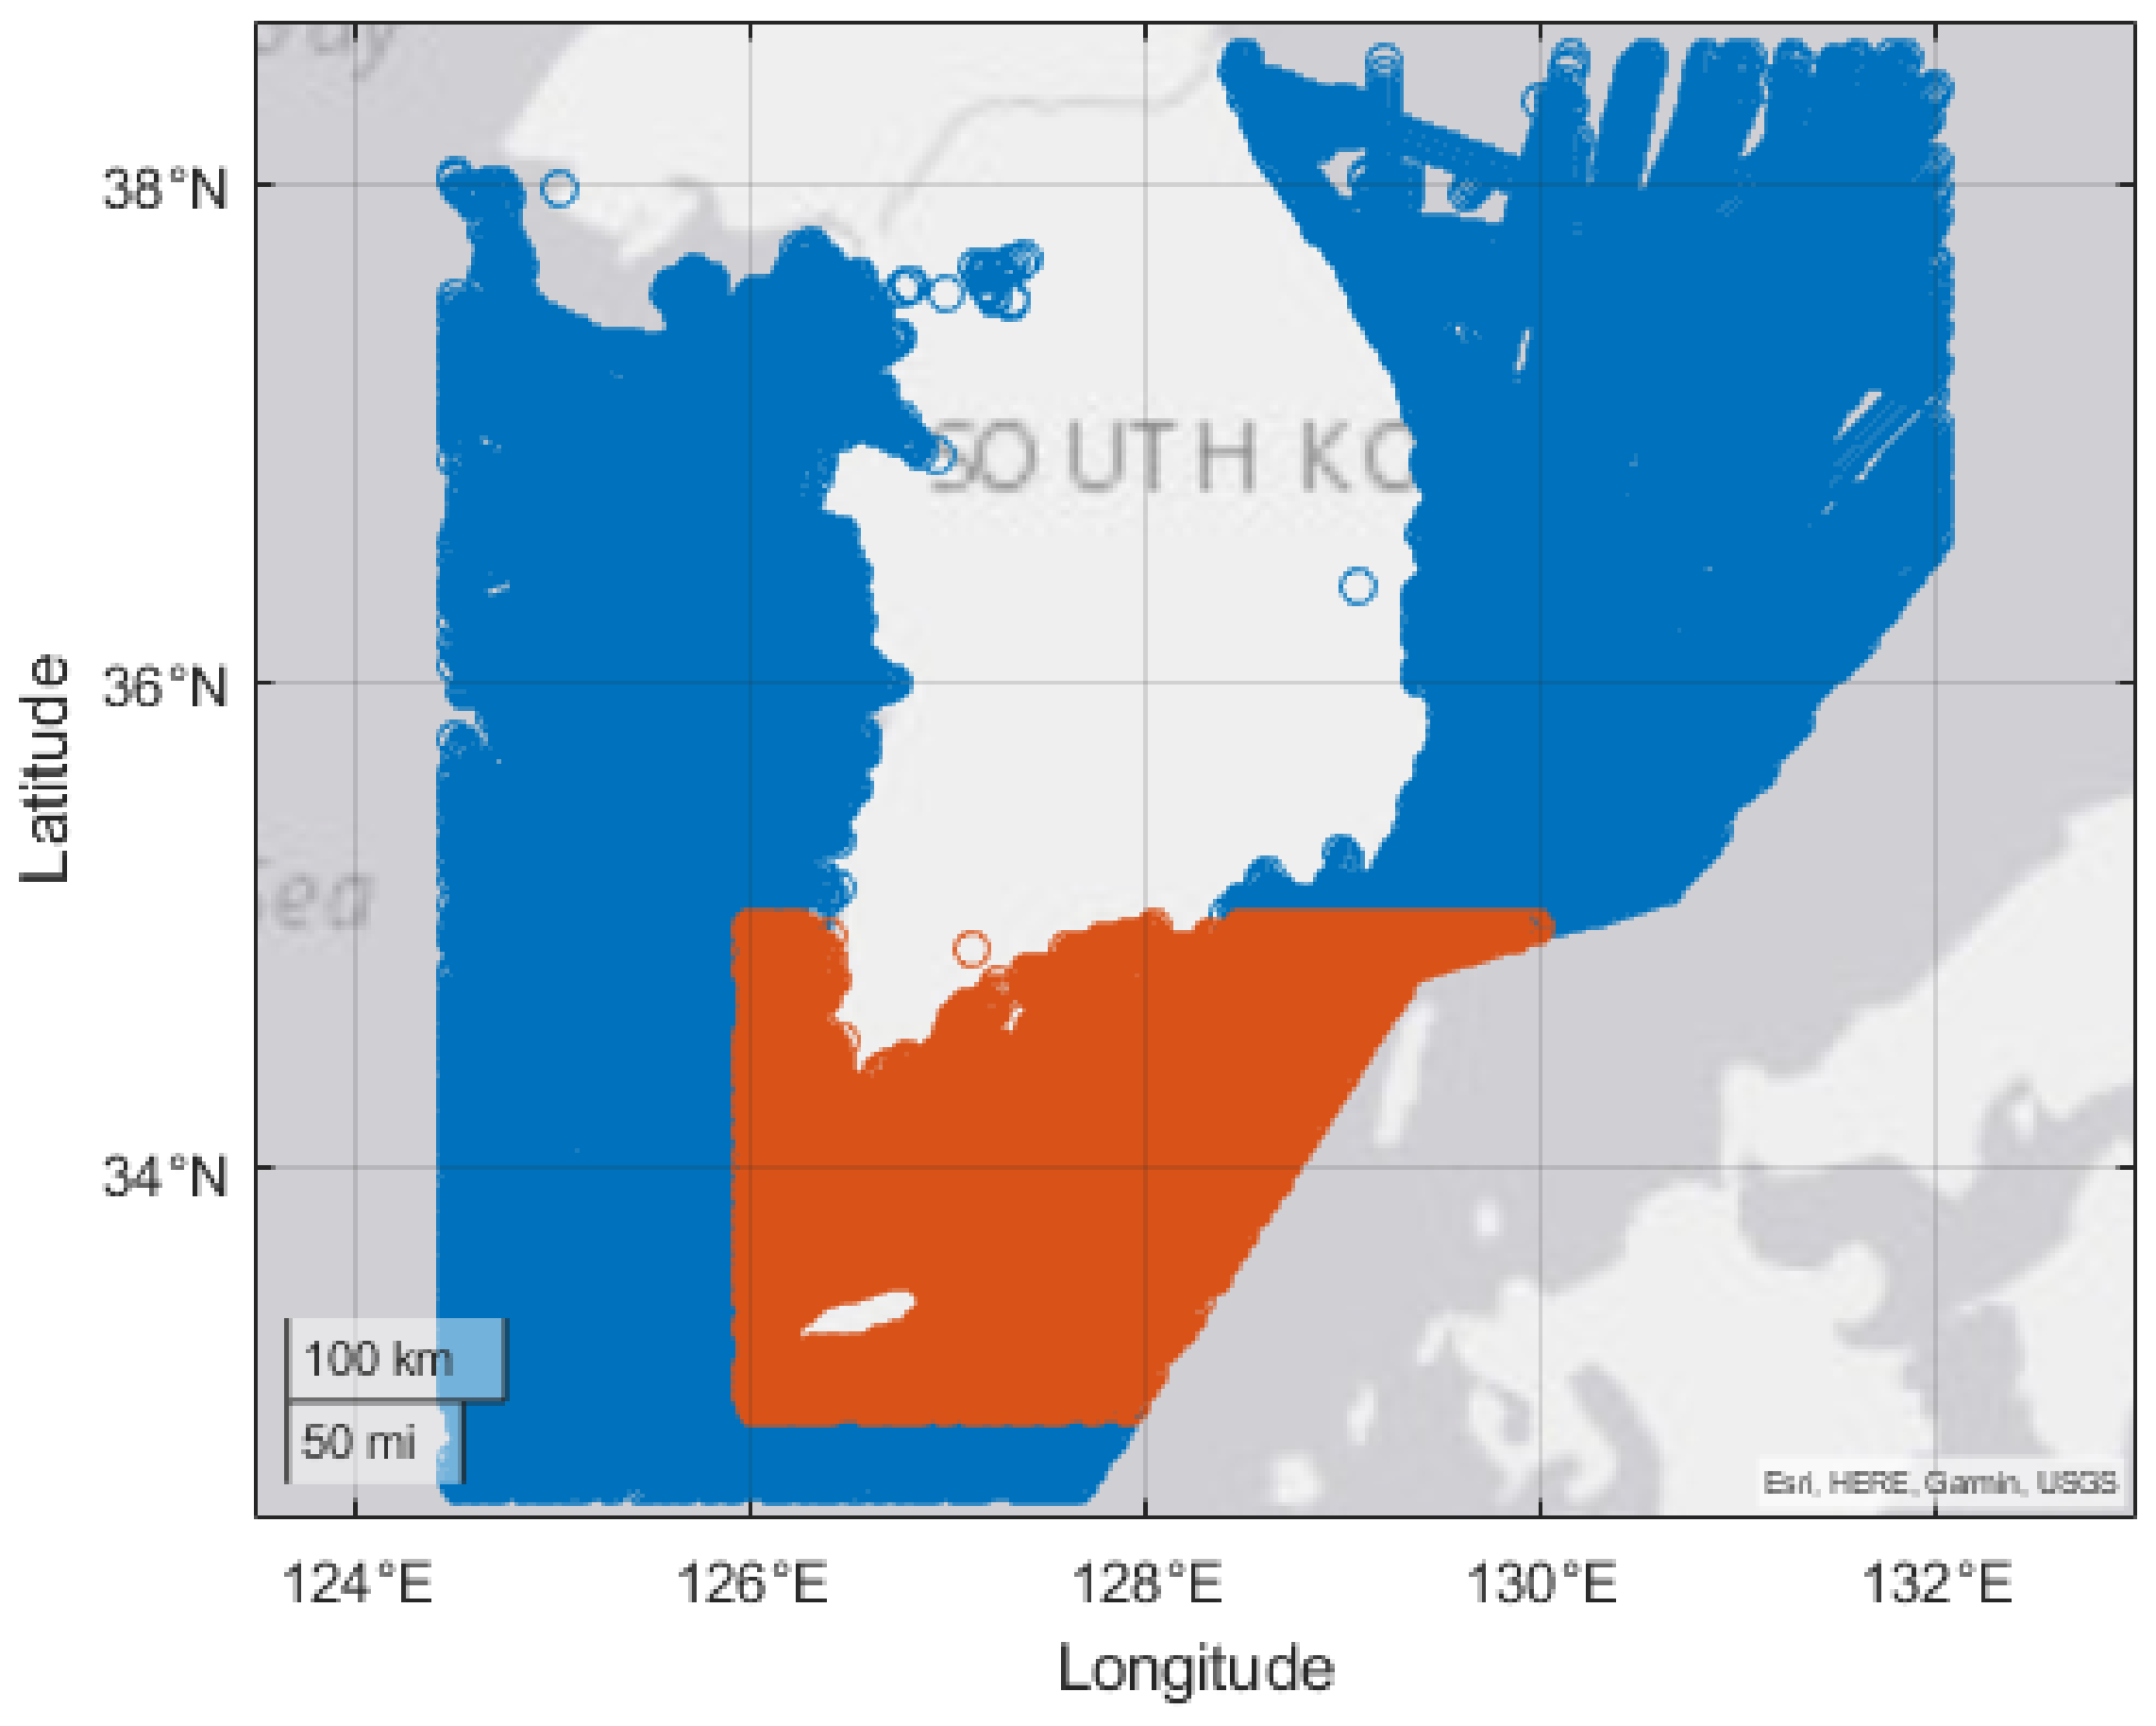
The purpose of the designed experiment conditions (
Table 1) was to extract the distribution of actual usage of the selected navigation elements. Thus, data for small crafts, anchored ships, drifting ships, and berthed ships were excluded. The covered area was the southern water area of South Korea, where dynamic ship movements are expected. The covered area is marked in orange in
Figure 2.
2.2.2. Navigation Element Extraction
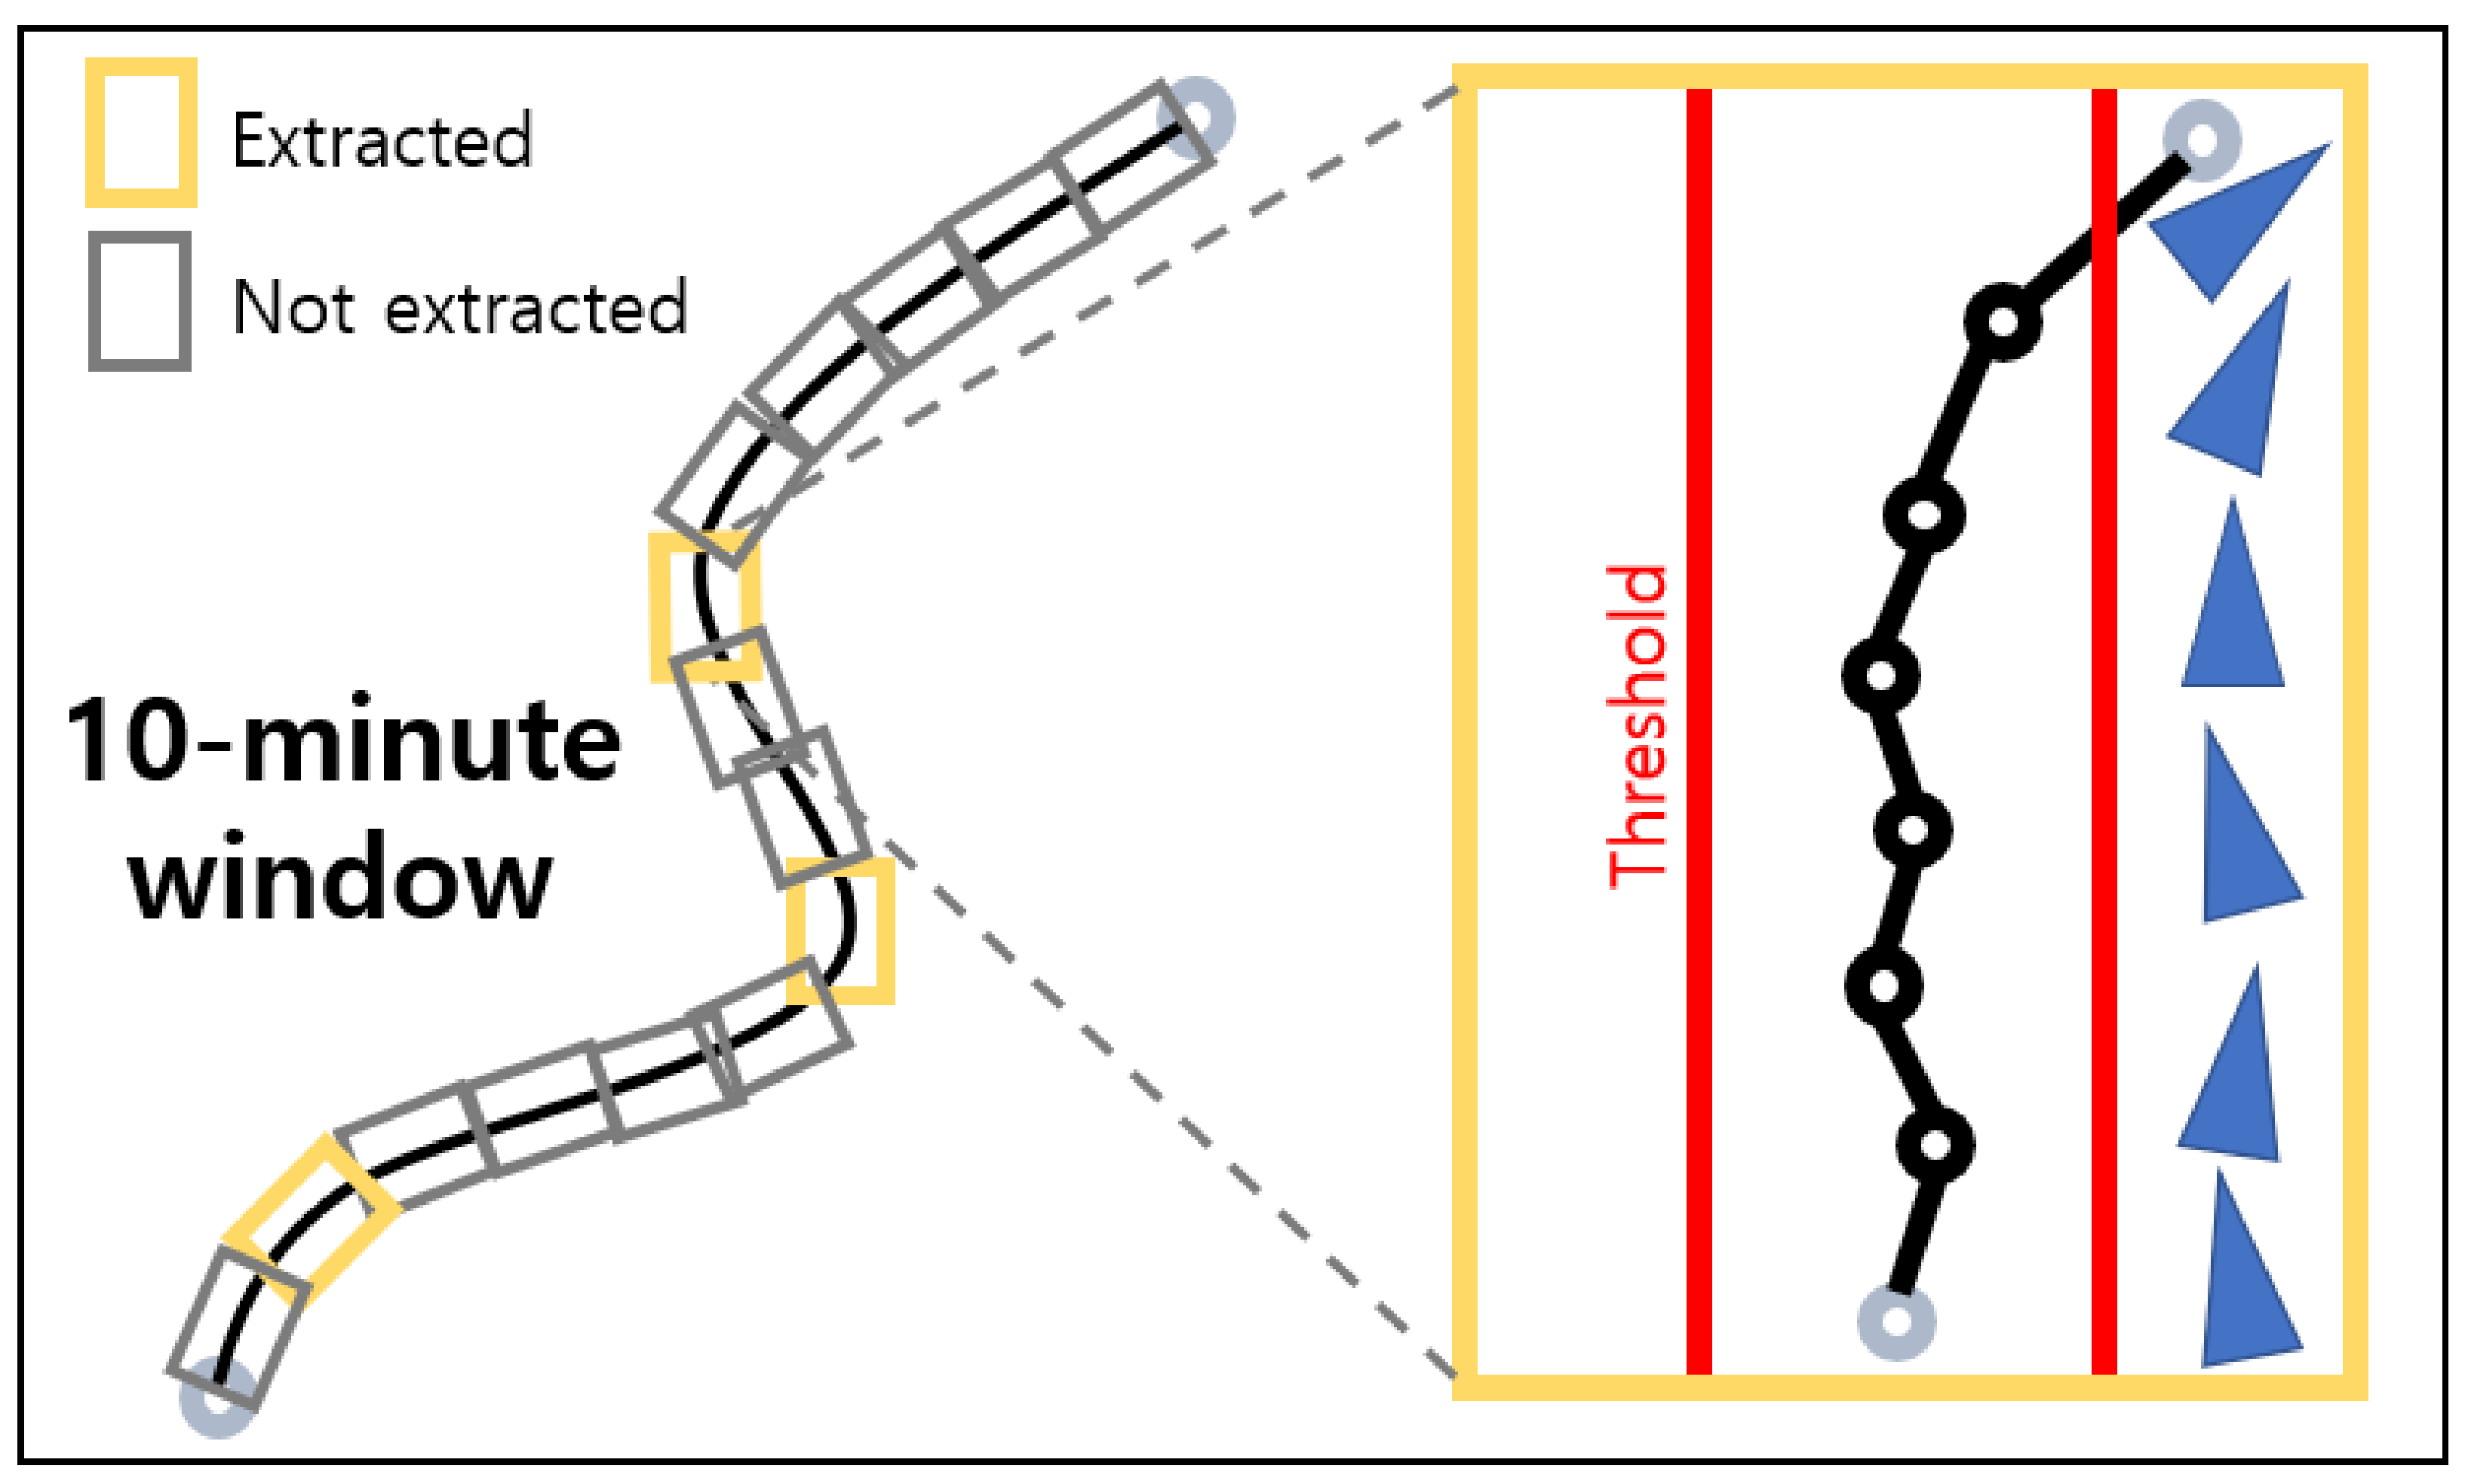
The features used from the data included “course over the ground (COG)” and the “date and time.” Since the GPS position data points are connected continuously without decided waypoints, the experiment had to use certain windows and thresholds to extract the element values. The time-series data were used as a window, and the standard deviation of the COG in the window was used as a threshold. In this study, a 10-minute window and 5-degree threshold for the standard deviation of COG were used for element extraction. In other words, when the ship had over five degrees of COG standard deviation in each 10-minute period of navigation, the “course altering angle at the waypoint” and the “distance between the waypoints” were extracted. The process is illustrated in
Figure 3 to support the explanation of element extraction.
The selected element’s values are the actual ship’s actions, including the decisions of the ship’s operators for all moments. Note that the size of the window and the threshold values can be optimized through repeated experiments; however, in this study, only the suggested window and threshold value were used in the element extraction process.
2.2.3. Navigation Elements Distribution Fitting
The selected navigation elements had plenteous values, showing the distribution. Since the frequency distribution was composed of discrete numbers, the distribution result was fitted in a probability density curve. Here, the “course altering angle at waypoints” element was fitted to the normal distribution, and the “distance between the waypoints” element was fitted to an inverse Gaussian distribution. Fitting was performed solely to convert discrete values to continuous values.
2.3. Navigation Elements Distribution Applications
2.3.1. Representative Value Decision
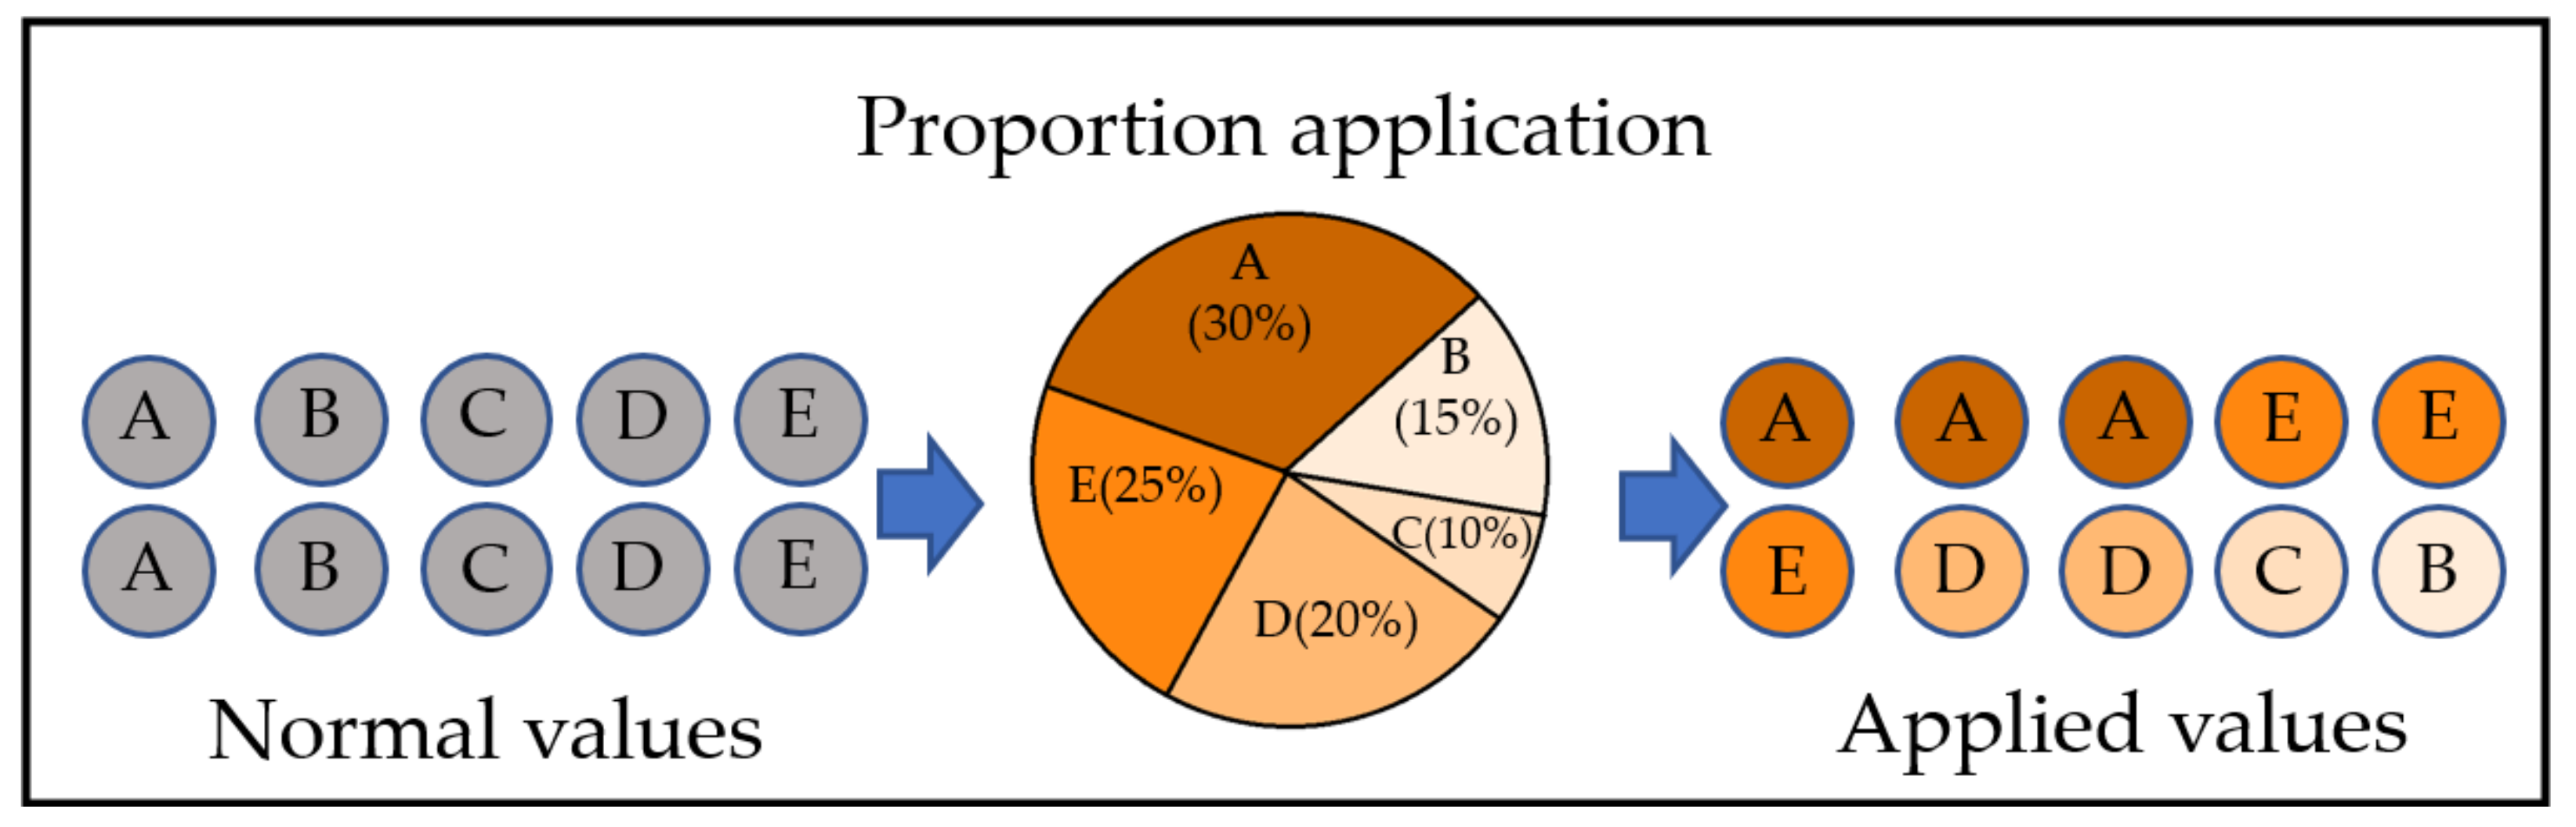
Once the distributions of the selected navigation elements were derived, we decided on the representative values. Since the distributions were fitted to the probability curve, we were able to calculate the occurrence probability for a certain range of distribution. Therefore, we divided the distributions of selected navigation elements into five with equal ranges. The median value of each division was decided as the representative value, and the probability for each division was calculated to determine the proportion of values.
2.3.2. Application of Proportion
The generation of navigation scenarios used the permutation. The permutation requires a certain number of components to calculate the outcomes. When the number of components is designated, the corresponding number of “Course altering angle” values and “Distance between waypoints” values are to be prepared as components of permutation. Once the number of components is decided, the representative values are designated with different proportions upon the occurrence probability. The representative value with a larger occurrence probability took the larger proportion of components.
Figure 4 shows an example of designating representative values upon the different proportions for ten components.
2.4. Permutation of Values in Different Proportions
When the values were prepared in different proportions, the permutation was conducted. The permutation calculation using
Figure 4 is presented below.
where “
” is the number of generated scenarios, “
” is the number of navigation elements, “
” is the number of components, and “
” is the proportion of representative values from A to E of navigation element k. As a result of generation, the example of a navigation scenario using the “course altering angle” element and “distance between waypoints” element is shown in
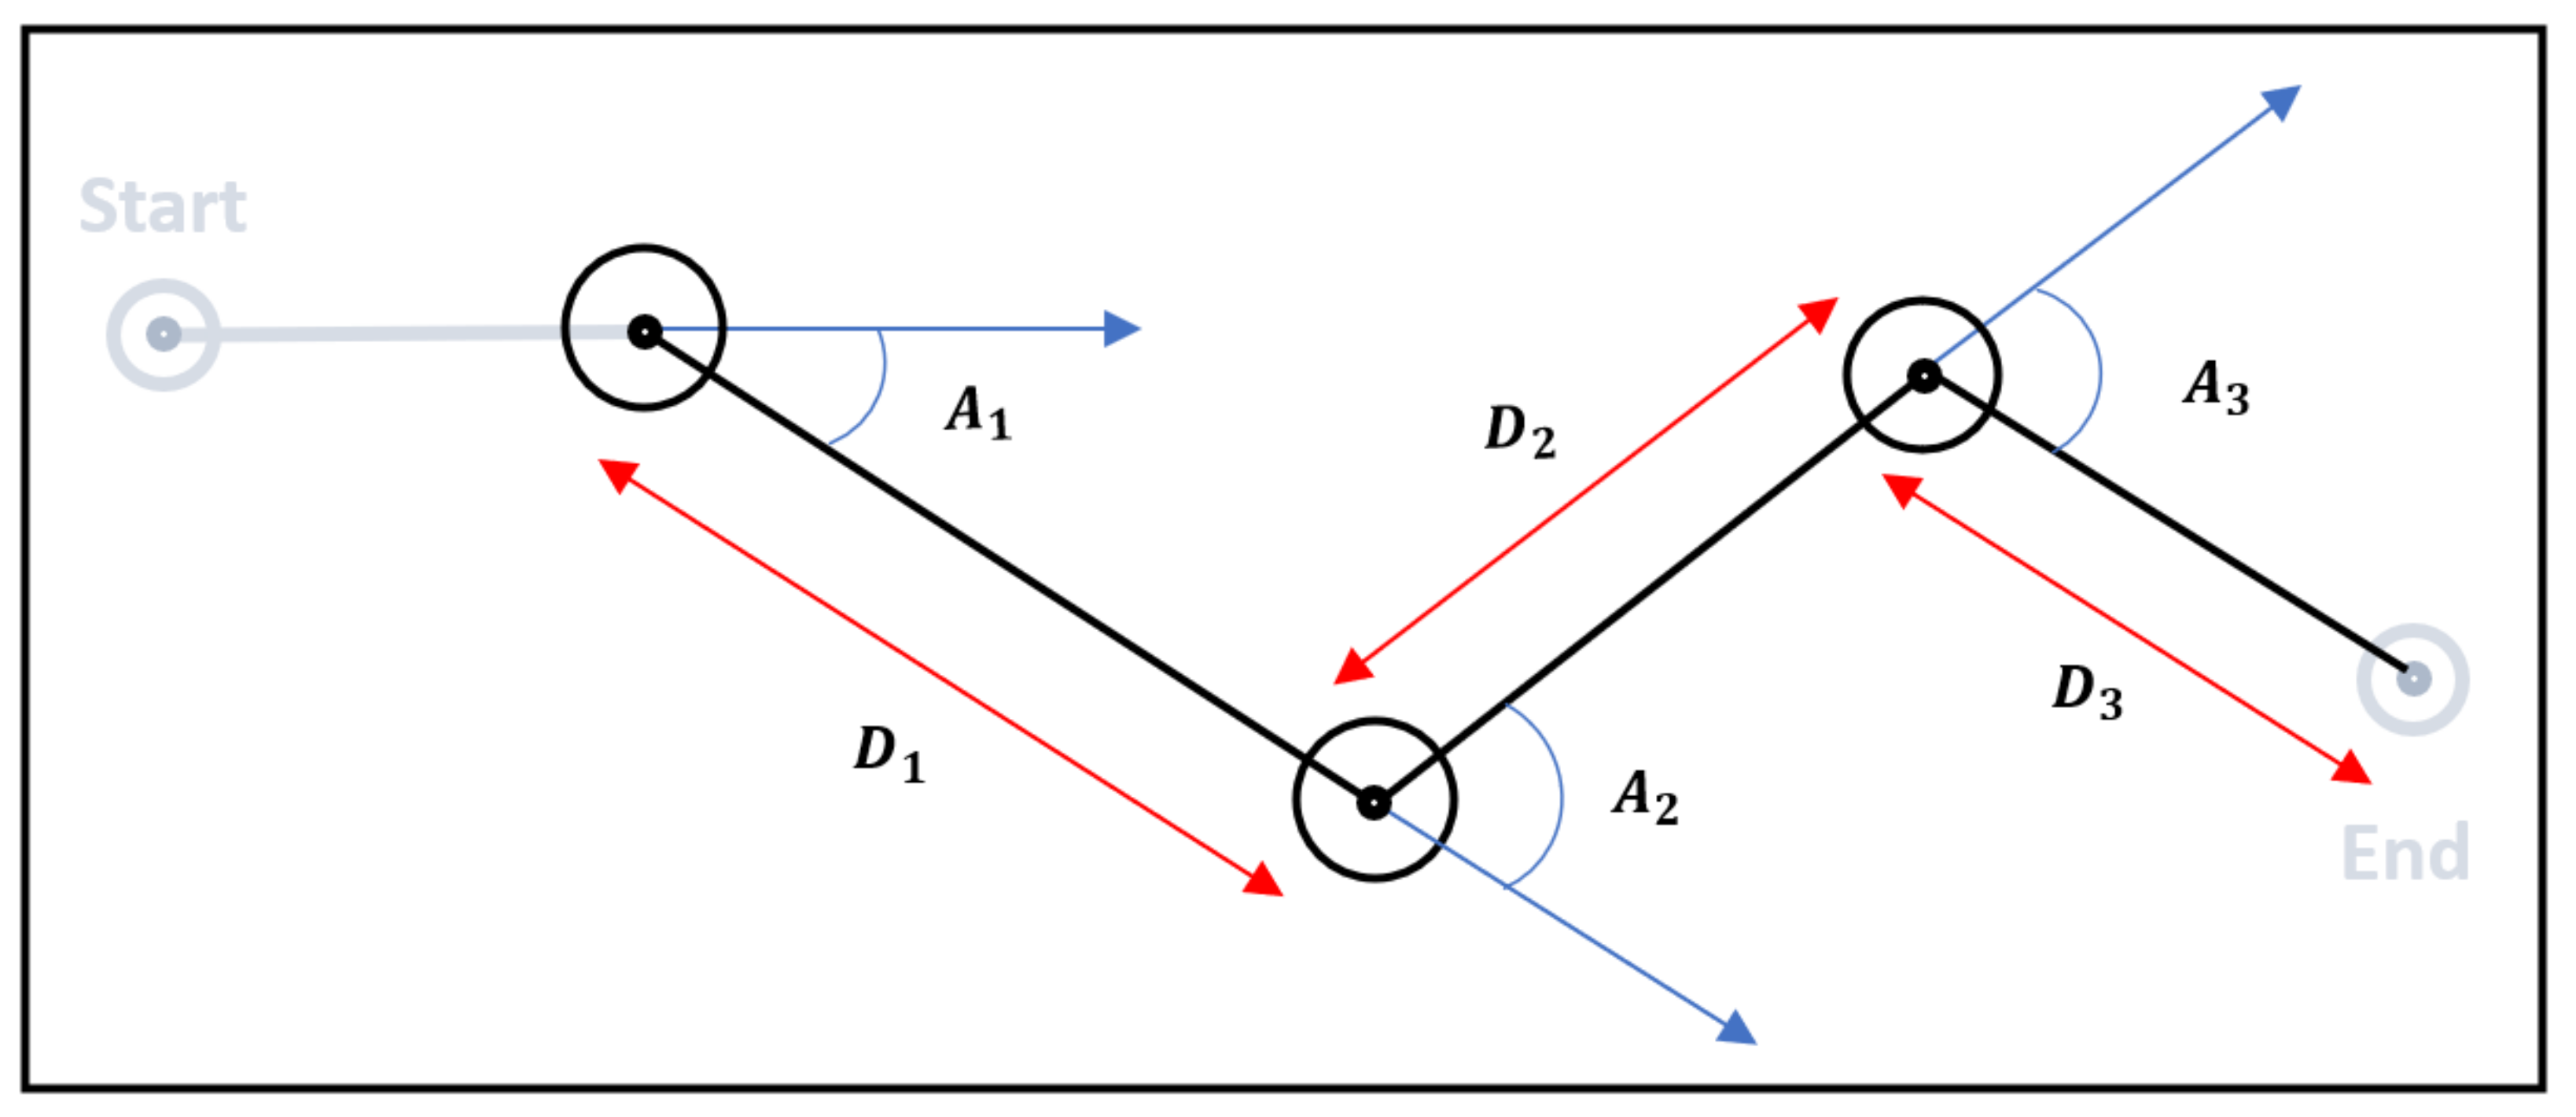
Figure 5.
The navigation scenario in
Figure 5 involves three components for each selected element. At the first waypoint, the “A1” degrees of altering and “D1” miles of proceeding are to be made, then second and third waypoint accordingly. The generation of navigation scenarios using the permutation model can derive a massive number of practical outcomes in the different shapes.
3. Results
The result obtained by the proposed method using the selected navigation elements is described in this section. The distribution of the selected elements was extracted and fitted in probability density curves, and the representative values with different proportions were prepared for the permutation. The comparison of the sample navigation scenario result from proposed methods and the sample navigation scenario from the other research was then conducted.
3.1. Distribution Analysis of Selected Navigation Elements
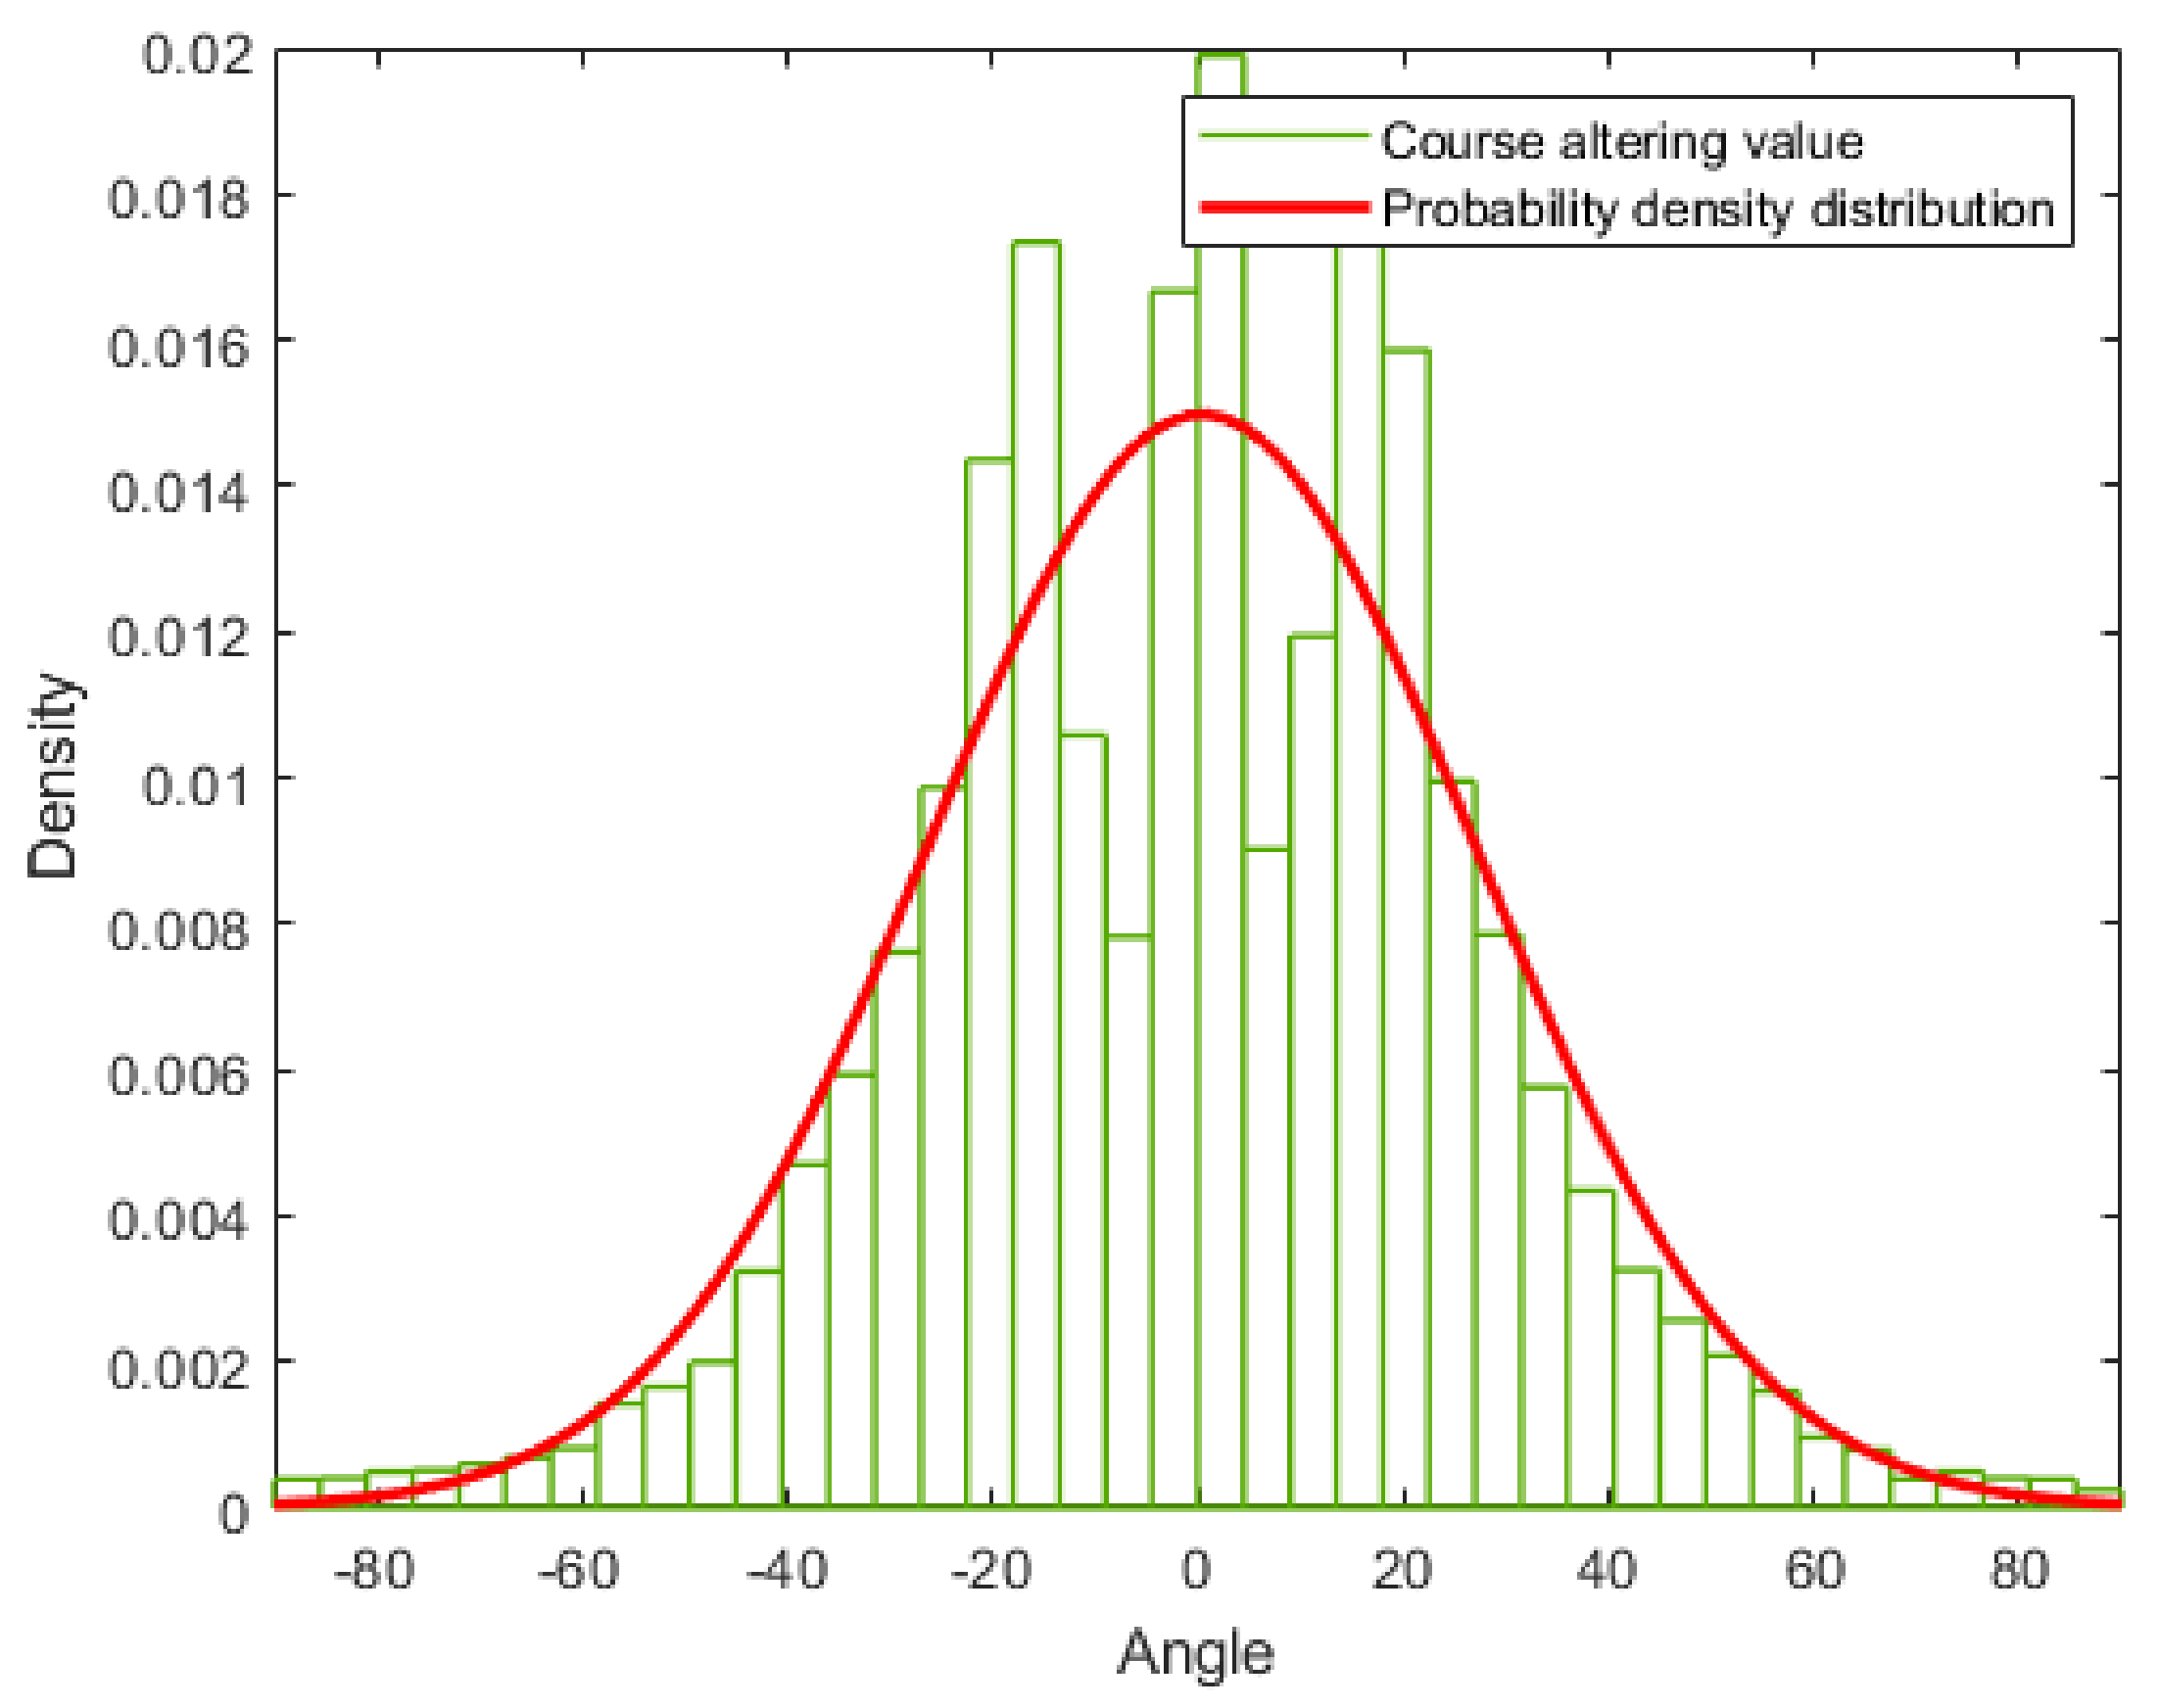
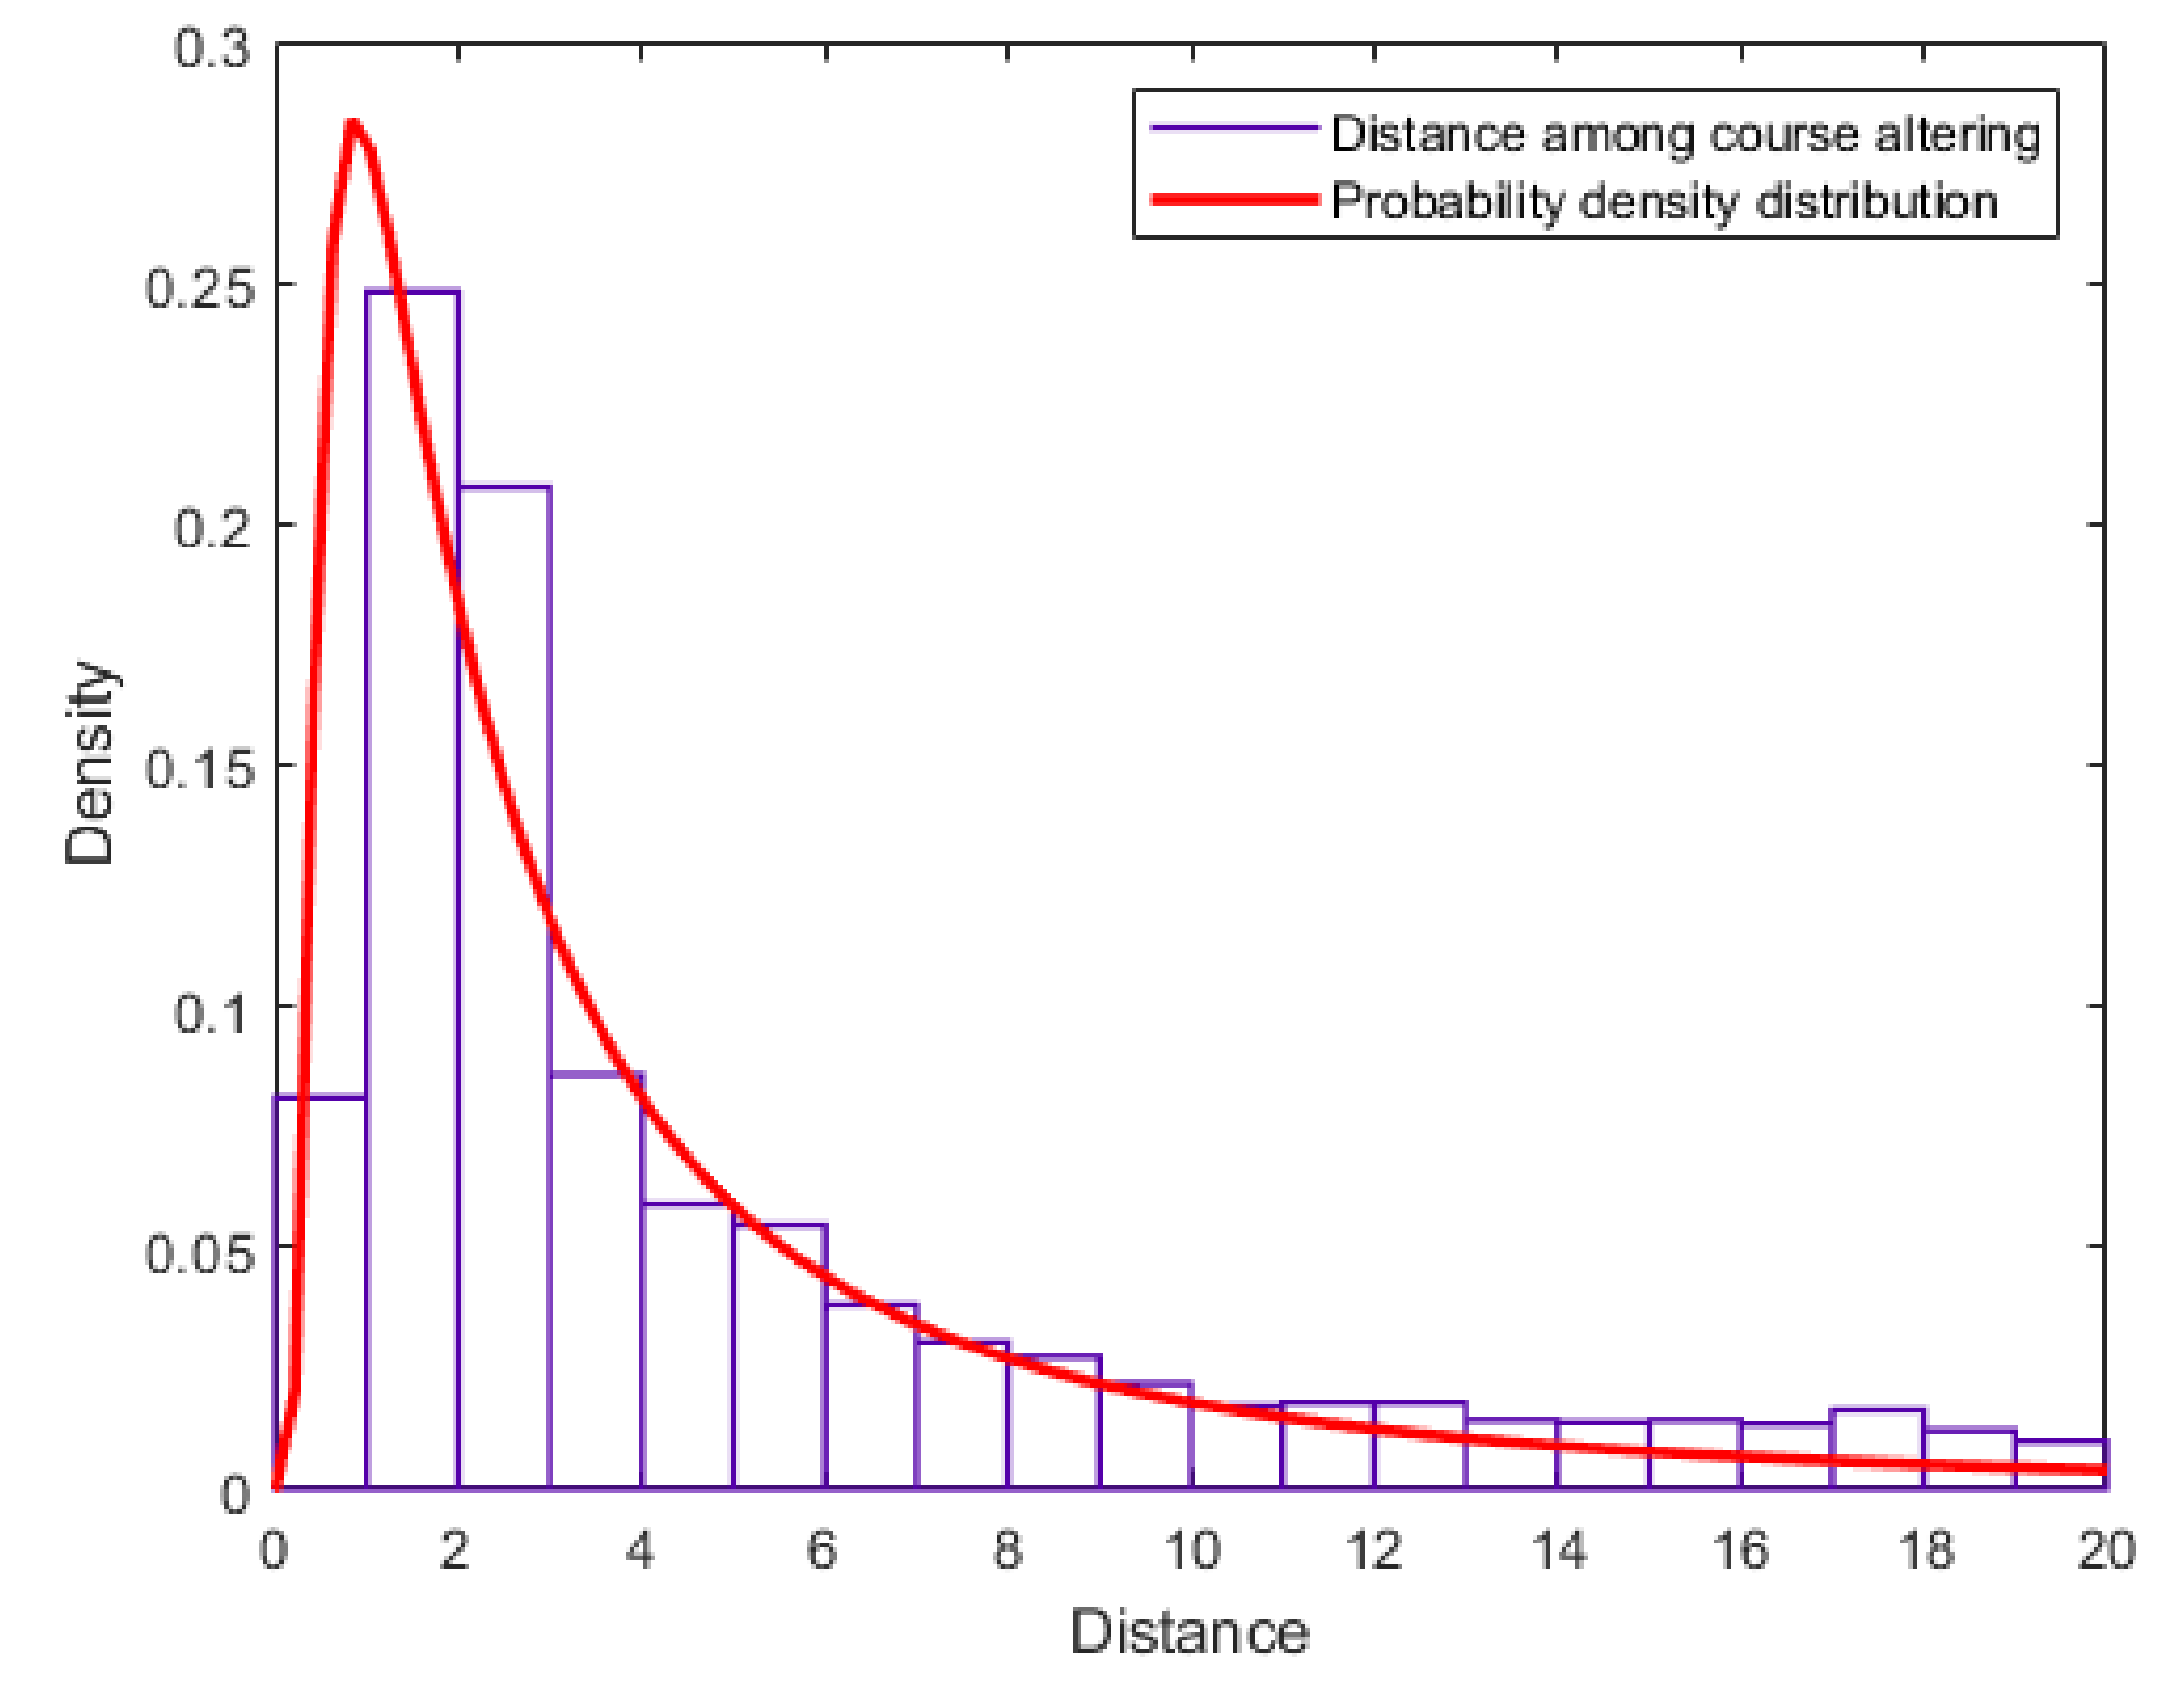
Here, we selected the “course altering angle at waypoint” element and the “distance between waypoints” element. The values of each element were extracted from a determined range. The “course altering angle at waypoint” element was extracted from negative 90 degrees to positive 90 degrees, and the “distance between waypoints” element was extracted from 1 nautical mile to 20 nautical miles. The extracted frequency distributions of the selected elements were then fitted to the probability density distributions.
Figure 6 and
Figure 7 show each distribution of each selected navigation element.
Figure 6 and
Figure 7 show the different shapes of distribution for each navigation element. As can be seen, the distribution of the “course altering at the waypoint” element was fitted in the normal distribution in a symmetrical shape, because the course altering has two directions of portside and starboard side. The distribution of the “distance between waypoint” element was fitted in the inverse Gaussian distribution of right-skewed shape, because the distance has positive values only.
3.2. Distribution Application of Selected Navigation Elements
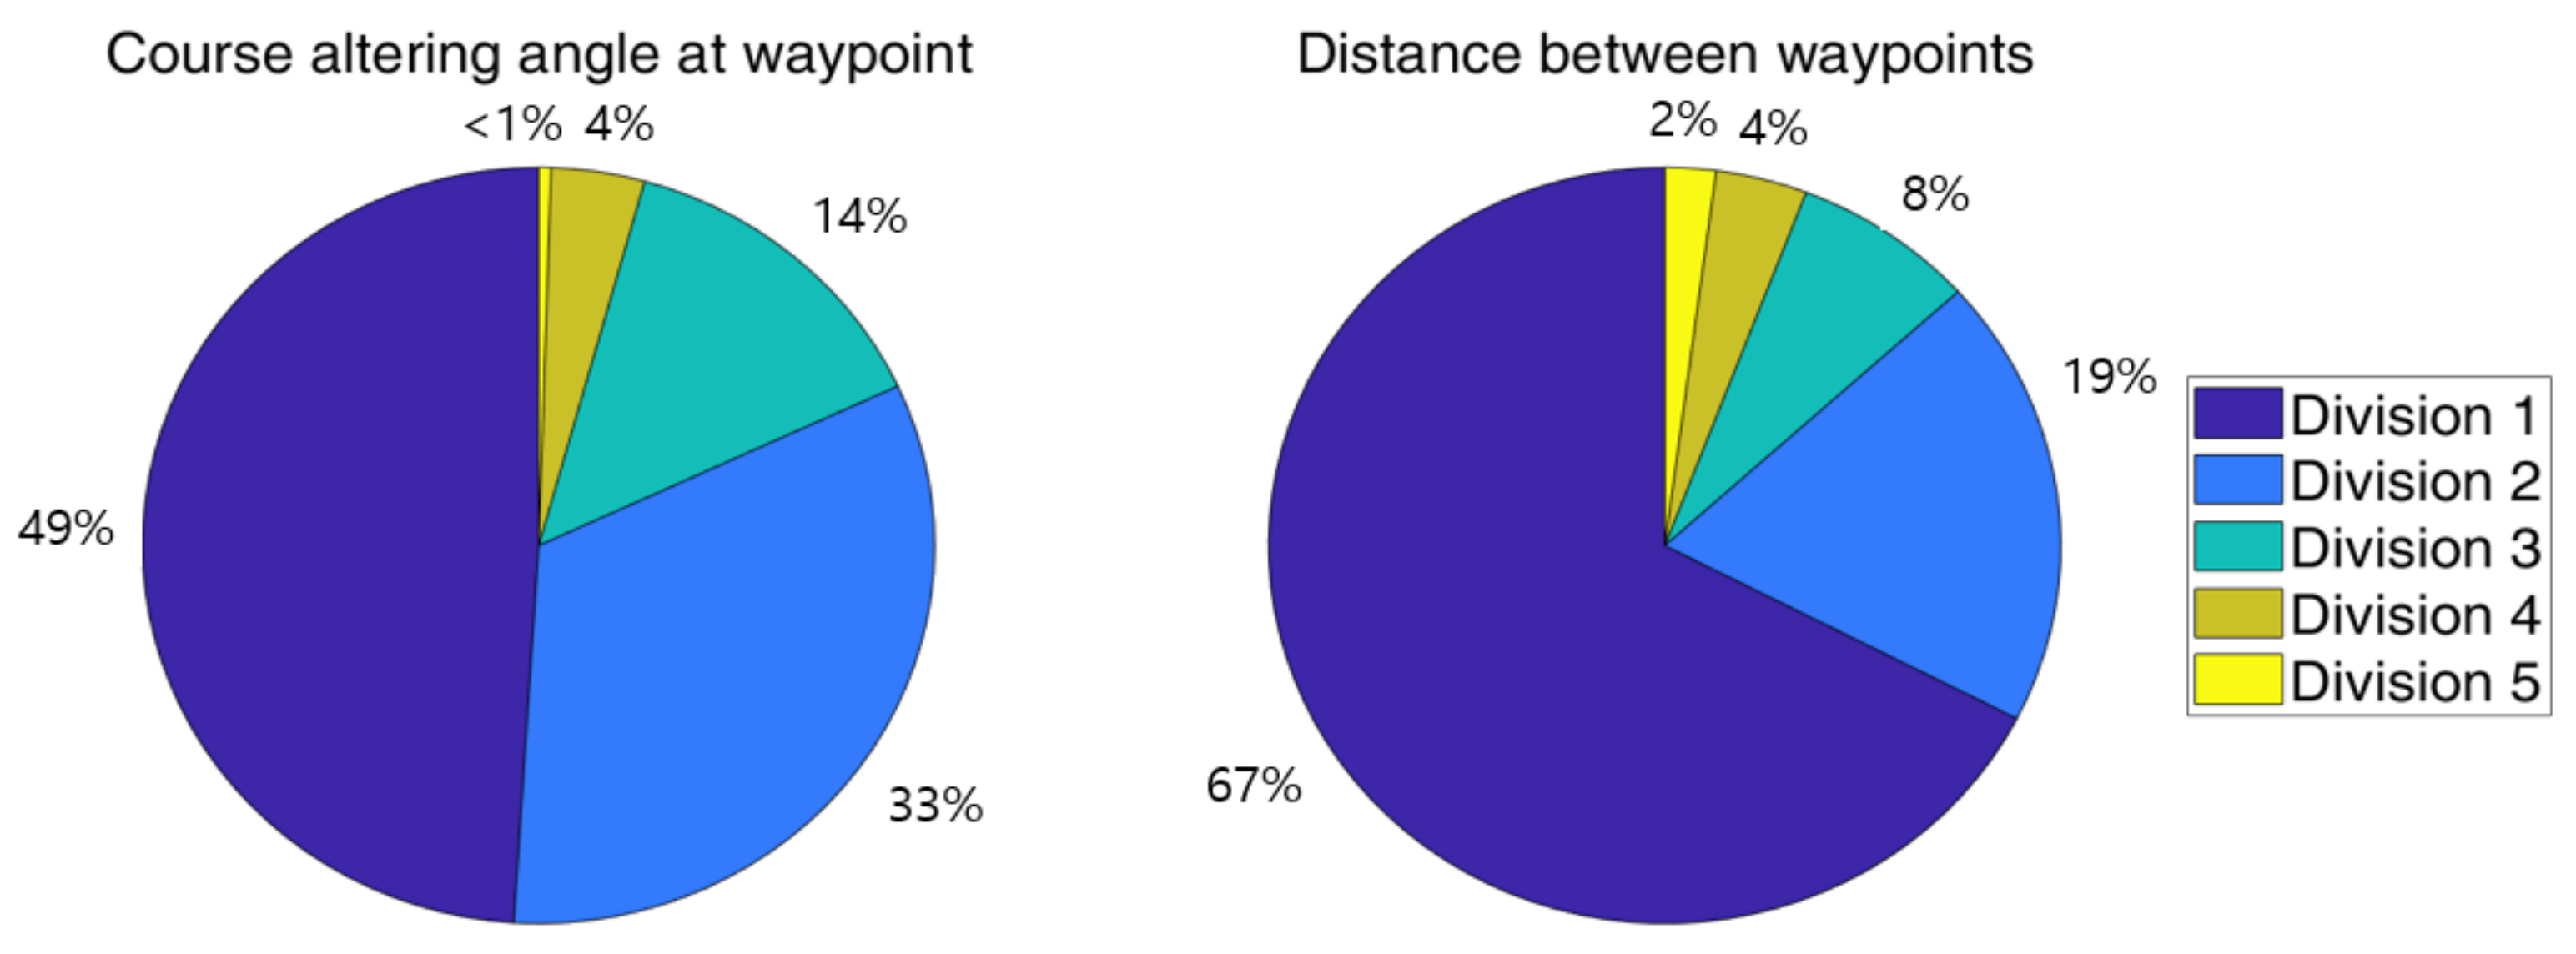
3.2.1. Representative Values and Proportion
The five divisions with equal ranges in the distribution results have a representative value and its proportion in percentage. The results of the selected navigation elements are presented in
Table 2.
3.2.2. Proportion Difference in Navigation Elements
The number of components was set as eight, and the representative values in
Table 2 were designated for the eight components considering the proportion. The proportion of each division is visualized in
Figure 8.
3.3. Permutation of Prepared Components and Sample Scenario
The representative values for the eight components for the permutation are presented in
Table 3 upon the proportion of each division.
Note that the “course altering angle at the waypoint” element involved two directions, “port side” and “starboard side,” so the number of permutation results considered the directions as well. Thus, the number of the permutation results for the “course altering angle” element is 1680, and the “distance between waypoint” element is 336. Therefore, the number of possible navigation scenarios in a permutation is 564,480 cases. The advantage of generating navigation scenarios using proposed methods is that every shape of generated navigation scenario is practical and applicable to the nautical chart in simulation because of the usual angle and distance value extracted from the actual trajectory data.
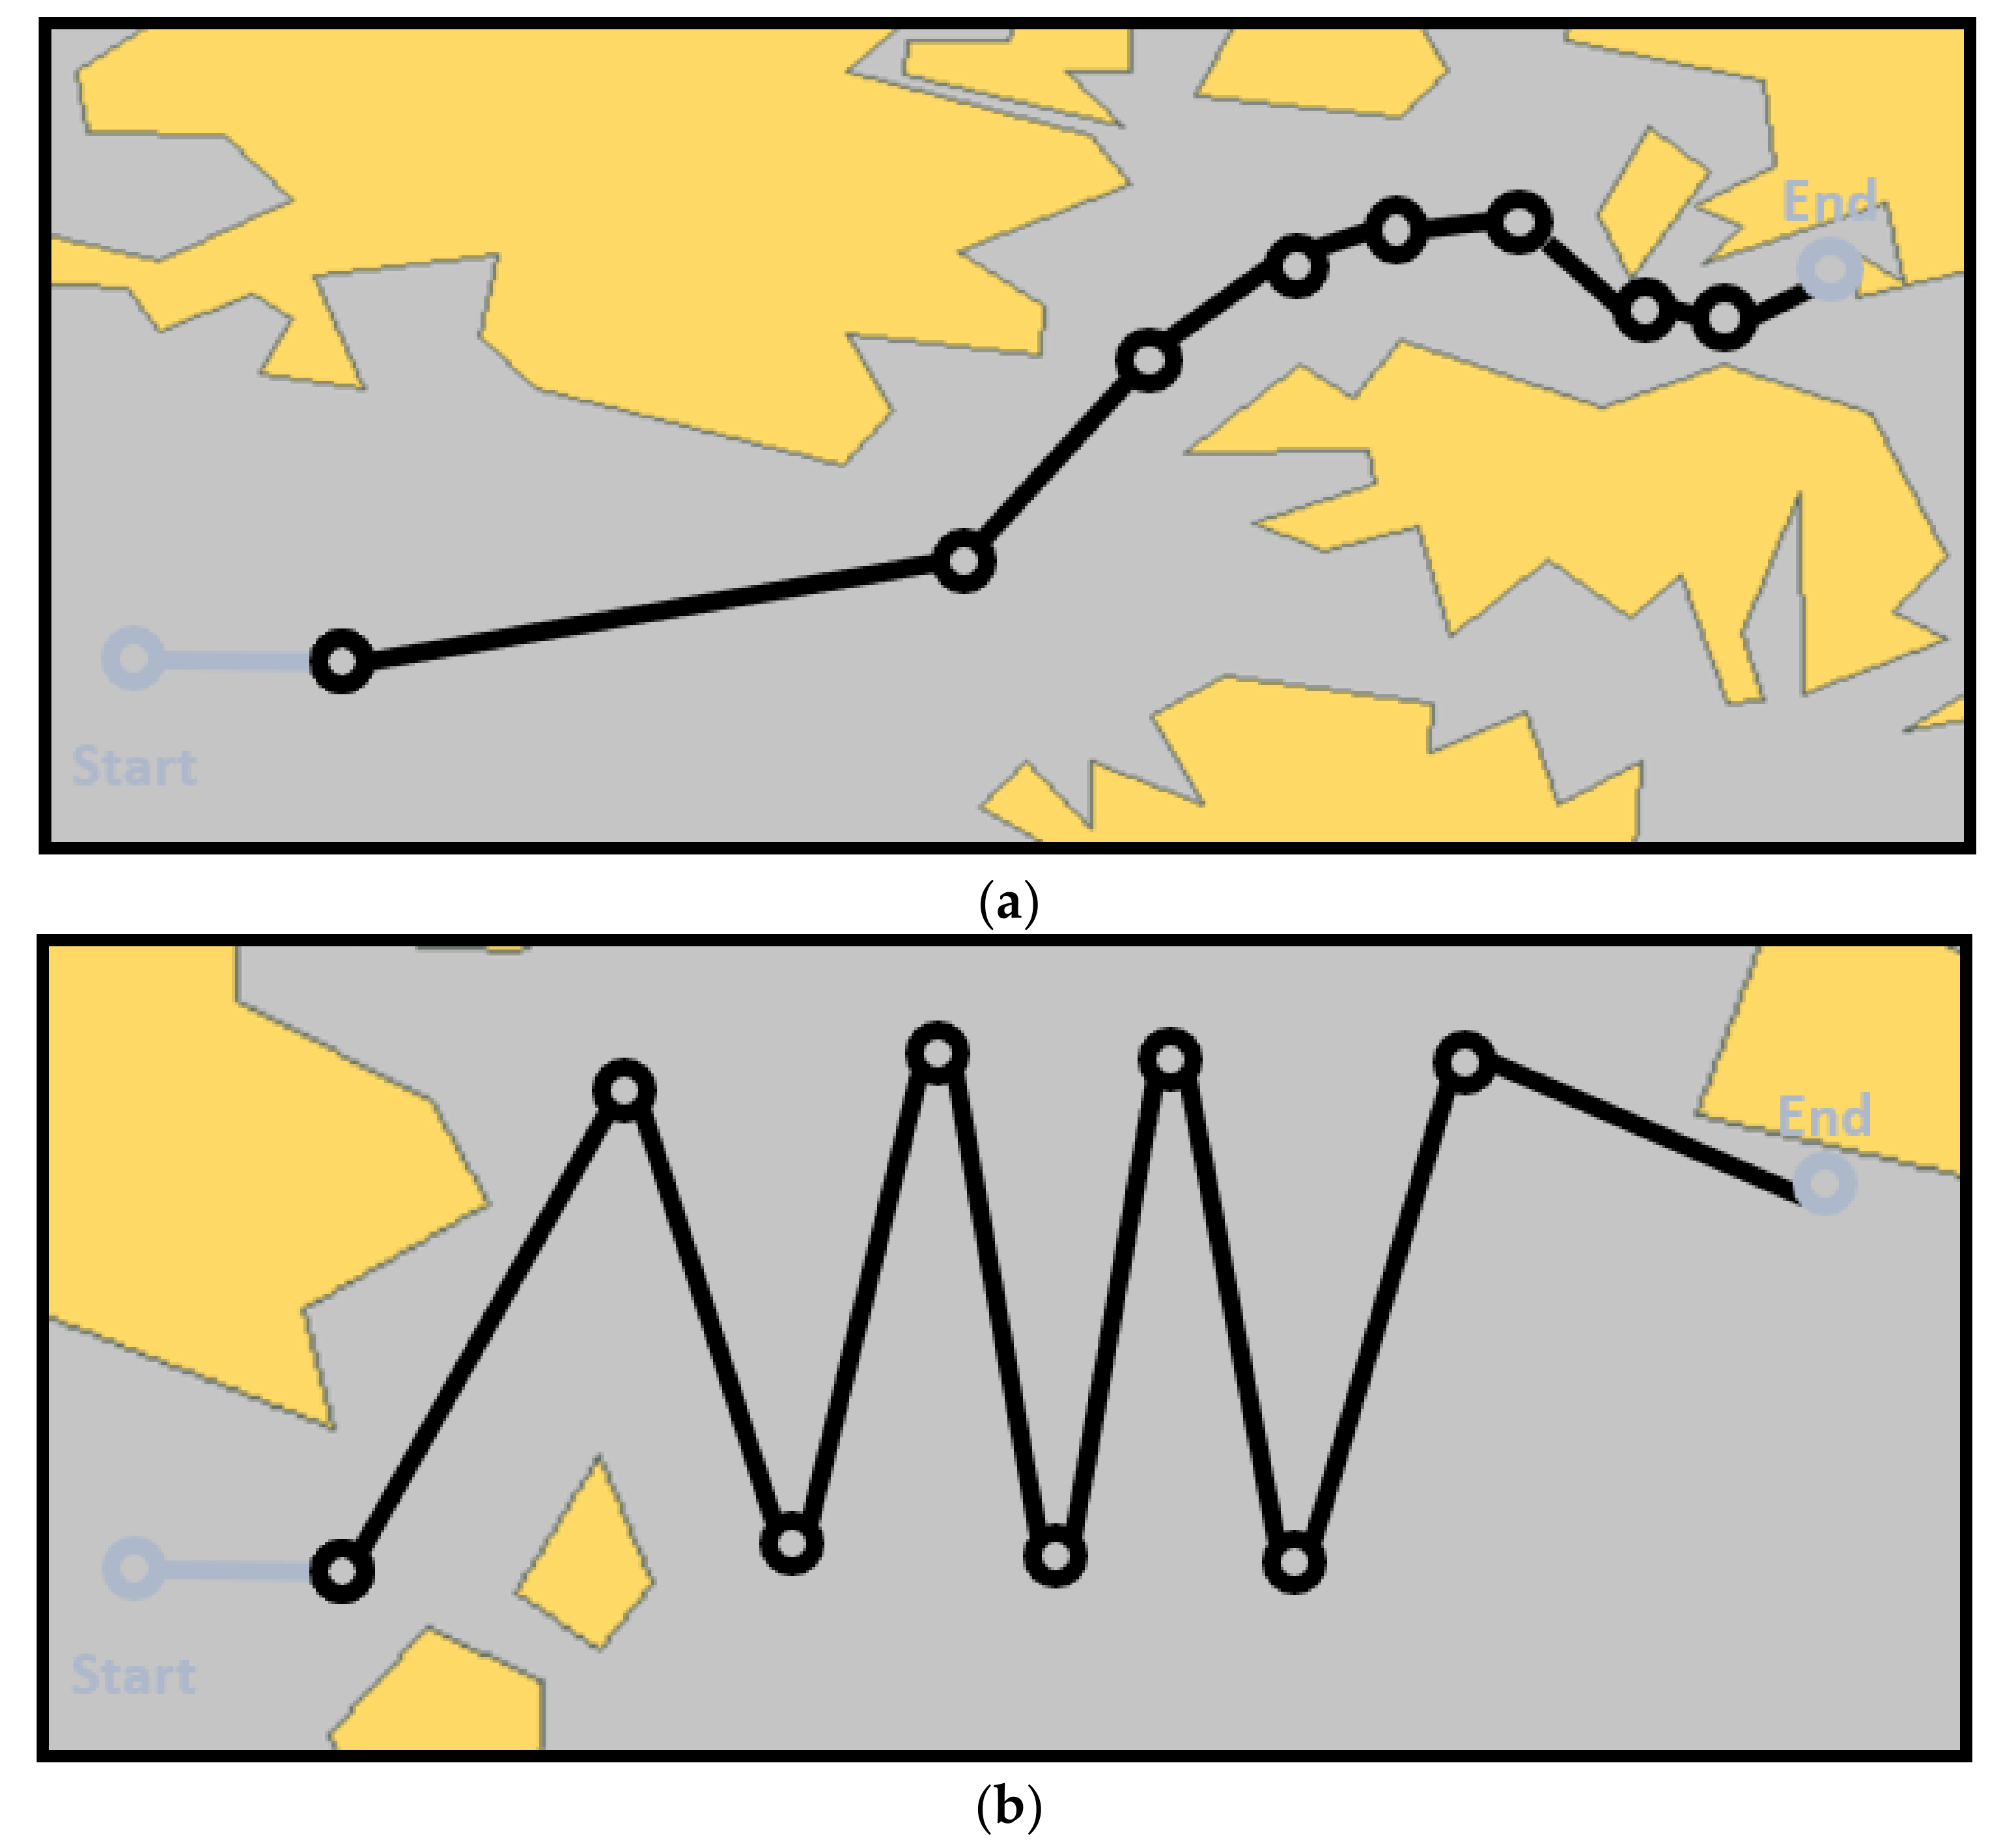
Figure 9 illustrates the difference between the outcome of the proposed methods and an example of an impractical navigation scenario with multiple large altering courses.
The sample navigation scenario generated by the proposed methods is similar to an actual navigation situation and suitable for training, but the example of an impractical navigation scenario is unsuitable for training.
4. Discussion
We have proposed methods to generate navigation scenarios in consideration of the real-world distribution of values. Our findings are discussed in the following subsections.
4.1. Distributions of Angle and Distance Elements
The selected elements “course altering angle at the waypoint” and “distance between waypoints” were extracted under the experimental conditions. The designed experimental condition focused on large ships, which are similar to autonomous ships that are currently under development. The distribution of navigation elements in
Figure 6 showed that ships in actual navigation situations tend to use smaller angles or shorter distances frequently than larger ones. Hence, the proportion of values had comparable differences.
4.2. Distribution Application of Selected Navigation Elements
We divided the distribution results into five divisions. The number of divisions can be any number, but if the number was higher or lower than five, the choices of value would be too plenteous or too few to suggest the concept of our proposed methods. The representative values and proportion of each division showed rather larger differences than expected ones. For example, the proportion of 9 degrees in “course altering” was 48.8%, which is almost half of possible course change, but 81 degrees was only 0.5%. In the same way, the proportion of 2 miles in “distance between waypoints” was 65%, but 18 miles was 3.2% only. Since the proportion was derived from the data-driven analysis, we had to take the results. However, we found the necessity of advanced methods for the selection of representative values.
4.3. Permutation Method of Navigation Scenario Generation
The permutation of the prepared values could result in massive outcomes of navigation scenarios that are practical and applicable for actual nautical chart information. As
Figure 9a shows, the sample of proposed methods was practical, and none of the permutation results was impractical as in
Figure 9b. The practical navigation scenarios that we are focused on were the usual and general navigation situations to train the remote operators of the ship’s handling. In this perspective, the multiple large altering navigation situations in
Figure 9b was considered impractical. The generation of navigation route was already conducted in other researches to design the ship’s route for coastal seas [
17] or ship’s route design between two ports using data-driven approaches [
18]. However, those researches were concentrated on the larger scale of navigation situations across the ports, not on the single altering scale. On the contrary, we used the distribution of plenteous values of the mariner’s decision in the ship’s handling on a relatively small scale. In addition, the massive generation of navigation scenarios is hard to be obtained manually, and if the general combination method is applied to the navigation elements, the outcome will include massive impractical navigation scenarios as well. Upon the proposed permutation methods, all of the outcomes are various, practical, and suitable for navigation training.
5. Conclusions
The background of research was the appearance of maritime autonomous surface ships and remote operators. When autonomous ships occupy a larger ratio of ships at sea, more remote operators will be needed. Accordingly, the training of remote operators should be effective enough to obtain navigation proficiency. The navigation proficiency requires a long period of training time as the conventional training of navigators takes months. In order to overcome the shortage of simulation training, we suggested the permutation model for a massive generation of navigation scenarios. When the systematical training of massive, various, practical navigation situations is conducted to the trainees of the autonomous ship remote operators, the experiences of the ship’s handling will be similar to the conventional navigators’ ones. Additionally, the permutation does not make the same results; the negative learning effects of trainees can be avoided as well. In future research, we hope to broaden the scope of this study by considering additional navigation elements and generating navigation scenarios for the training of remote operators.
Author Contributions
Conceptualization, T.H. and I.-H.Y.; Data curation, I.-H.Y.; Formal analysis, T.H.; Funding acquisition, I.-H.Y.; Methodology, T.H.; Project administration, I.-H.Y.; Supervision, I.-H.Y.; Visualization, T.H.; Writing—original draft, T.H.; Writing—review & editing, I.-H.Y. All authors have read and agreed to the published version of the manuscript.
Funding
This research and APC were funded by Ministry of Oceans and Fisheries in grant number 202106314.
Institutional Review Board Statement
Not applicable.
Informed Consent Statement
Not applicable.
Data Availability Statement
The data that support the findings of this study are available from the corresponding author upon reasonable request.
Acknowledgments
This research was a part of a project titled “Development of Smart Port-Autonomous Ships Linkage Technology” funded by the Ministry of Oceans and Fisheries, Korea.
Conflicts of Interest
The authors declare no conflict of interest.
References
- Zwolak, K. The ocean-going autonomous ship—Challenges and threats. J. Mar. Sci. Eng. 2020, 8, 41. [Google Scholar]
- Li, S.; Fung, K.S. Maritime autonomous surface ships (MASS): Implementation and legal issues. Maritime Bus. Rev. 2019, 4. [Google Scholar] [CrossRef] [Green Version]
- Mallam, S.C.; Nazir, S.; Sharma, A. The human element in future Maritime Operations–perceived impact of autonomous shipping. Ergonomics 2020, 63, 334–345. [Google Scholar] [CrossRef] [PubMed]
- Porathe, T.; Hoem, Å.; Rødseth, Ø.; Fjørtoft, K.; Johnsen, S.O. At least as safe as manned shipping? Autonomous shipping, safety and “human error”. In Safety and Reliability—Safe Societies in a Changing World, 1st ed.; Taylor & Francis Group: London, UK, 2018; pp. 417–425. [Google Scholar]
- Pundars, B. Autonomous Shipping in changing the structures-Future implications on Maritime Education and Training. Master’s Thesis, Novia University of Applied Sciences, Vaasa, Finland, May 2020. [Google Scholar]
- Salas, E.; Bowers, C.A.; Rhodenizer, L. It is not how much you have but how you use it: Toward a rational use of simulation to support aviation training. Int. J. Aviat. Psychol. 1998, 8, 197–208. [Google Scholar] [CrossRef] [PubMed]
- Lateef, F. Simulation-based learning: Just like the real thing. J. Emerg. Trauma Shock 2010, 3, 348. [Google Scholar] [CrossRef] [PubMed]
- Bakdi, A.; Glad, I.K.; Vanem, E.; Engelhardtsen, Ø. AIS-based multiple vessel collision and grounding risk identification based on adaptive safety domain. J. Mar. Sci. Eng. 2020, 8, 5. [Google Scholar] [CrossRef] [Green Version]
- Wang, Y.; Chin, H. An empirically-calibrated ship domain as a safety criterion for navigation in confined waters. J. Navig. 2016, 69, 257–276. [Google Scholar] [CrossRef] [Green Version]
- Meng, Q.; Weng, J.; Li, S. Analysis with automatic identification system data of vessel traffic characteristics in the Singapore strait. Transp. Res. Rec. 2014, 2426, 33–43. [Google Scholar] [CrossRef]
- Wu, X.; Mehta, A.L.; Zaloom, V.A.; Craig, B.N. Analysis of waterway transportation in Southeast Texas waterway based on AIS data. Ocean Eng. 2016, 121, 196–209. [Google Scholar] [CrossRef]
- Xiao, F.; Ligteringen, H.; Van Gulijk, C.; Ale, B. Comparison study on AIS data of ship traffic behavior. Ocean Eng. 2015, 95, 84–93. [Google Scholar] [CrossRef] [Green Version]
- Tan, W.C.; Weng, C.; Zhou, Y.; Chua, K.H.; Chen, I. Historical data is useful for navigation planning: Data driven route generation for autonomous ship. In Proceedings of the IEEE International Conference on Robotics and Automation (ICRA), Brisbane, Australia, 21–25 May 2018; pp. 7478–7483. [Google Scholar]
- Inoue, S.; Hirano, M.; Kijima, K.; Takashina, J. A practical calculation method of ship maneuvering motion. Int. Shipbuild. Prog. 1981, 28, 207–222. [Google Scholar] [CrossRef]
- Perera, L.P.; Ferrari, V.; Santos, F.P.; Hinostroza, M.A.; Soares, C.G. Experimental evaluations on ship autonomous navigation and collision avoidance by intelligent guidance. IEEE J. Ocean. Eng. 2014, 40, 374–387. [Google Scholar] [CrossRef]
- Xue, Y.; Clelland, D.; Lee, B.S.; Han, D. Automatic simulation of ship navigation. IEEE J. Ocean. Eng. 2011, 38, 2290–2305. [Google Scholar] [CrossRef]
- Zhang, D.; Zhang, Y.; Zhang, C. Data mining approach for automatic ship-route design for coastal seas using AIS trajectory clustering analysis. IEEE J. Ocean. Eng. 2021, 236, 236. [Google Scholar] [CrossRef]
- Wen, Y.; Sui, Z.; Zhou, C.; Xiao, C.; Chen, Q.; Han, D.; Zhang, Y. Automatic ship route design between two ports: A data-driven method. Appl. Ocean. Res. 2020, 96, 102049. [Google Scholar] [CrossRef]
| Publisher’s Note: MDPI stays neutral with regard to jurisdictional claims in published maps and institutional affiliations. |
© 2022 by the authors. Licensee MDPI, Basel, Switzerland. This article is an open access article distributed under the terms and conditions of the Creative Commons Attribution (CC BY) license (https://creativecommons.org/licenses/by/4.0/).


