1. Introduction
The 2011 magnitude (M) nine Tohoku earthquake off the Pacific coast and the huge tsunami it generated caused severe damage to coastal areas of Japan. The number of fatalities and missing persons exceeded 15,000 and 7000, respectively. The height of the tsunami at Onagawa exceeded 10 m, and the maximum run-up exceeded 40 m [
1]. The most effective way to prepare for a tsunami is to learn from the impact of previous tsunamis.
Ocean floor network systems for earthquakes and tsunamis, like the Dense Oceanfloor Network system for Earthquakes and Tsunamis (DONET [
2,
3,
4]) and the Seafloor Observation Network for Earthquakes and Tsunamis along the Japan Trench (S-net [
5,
6,
7,
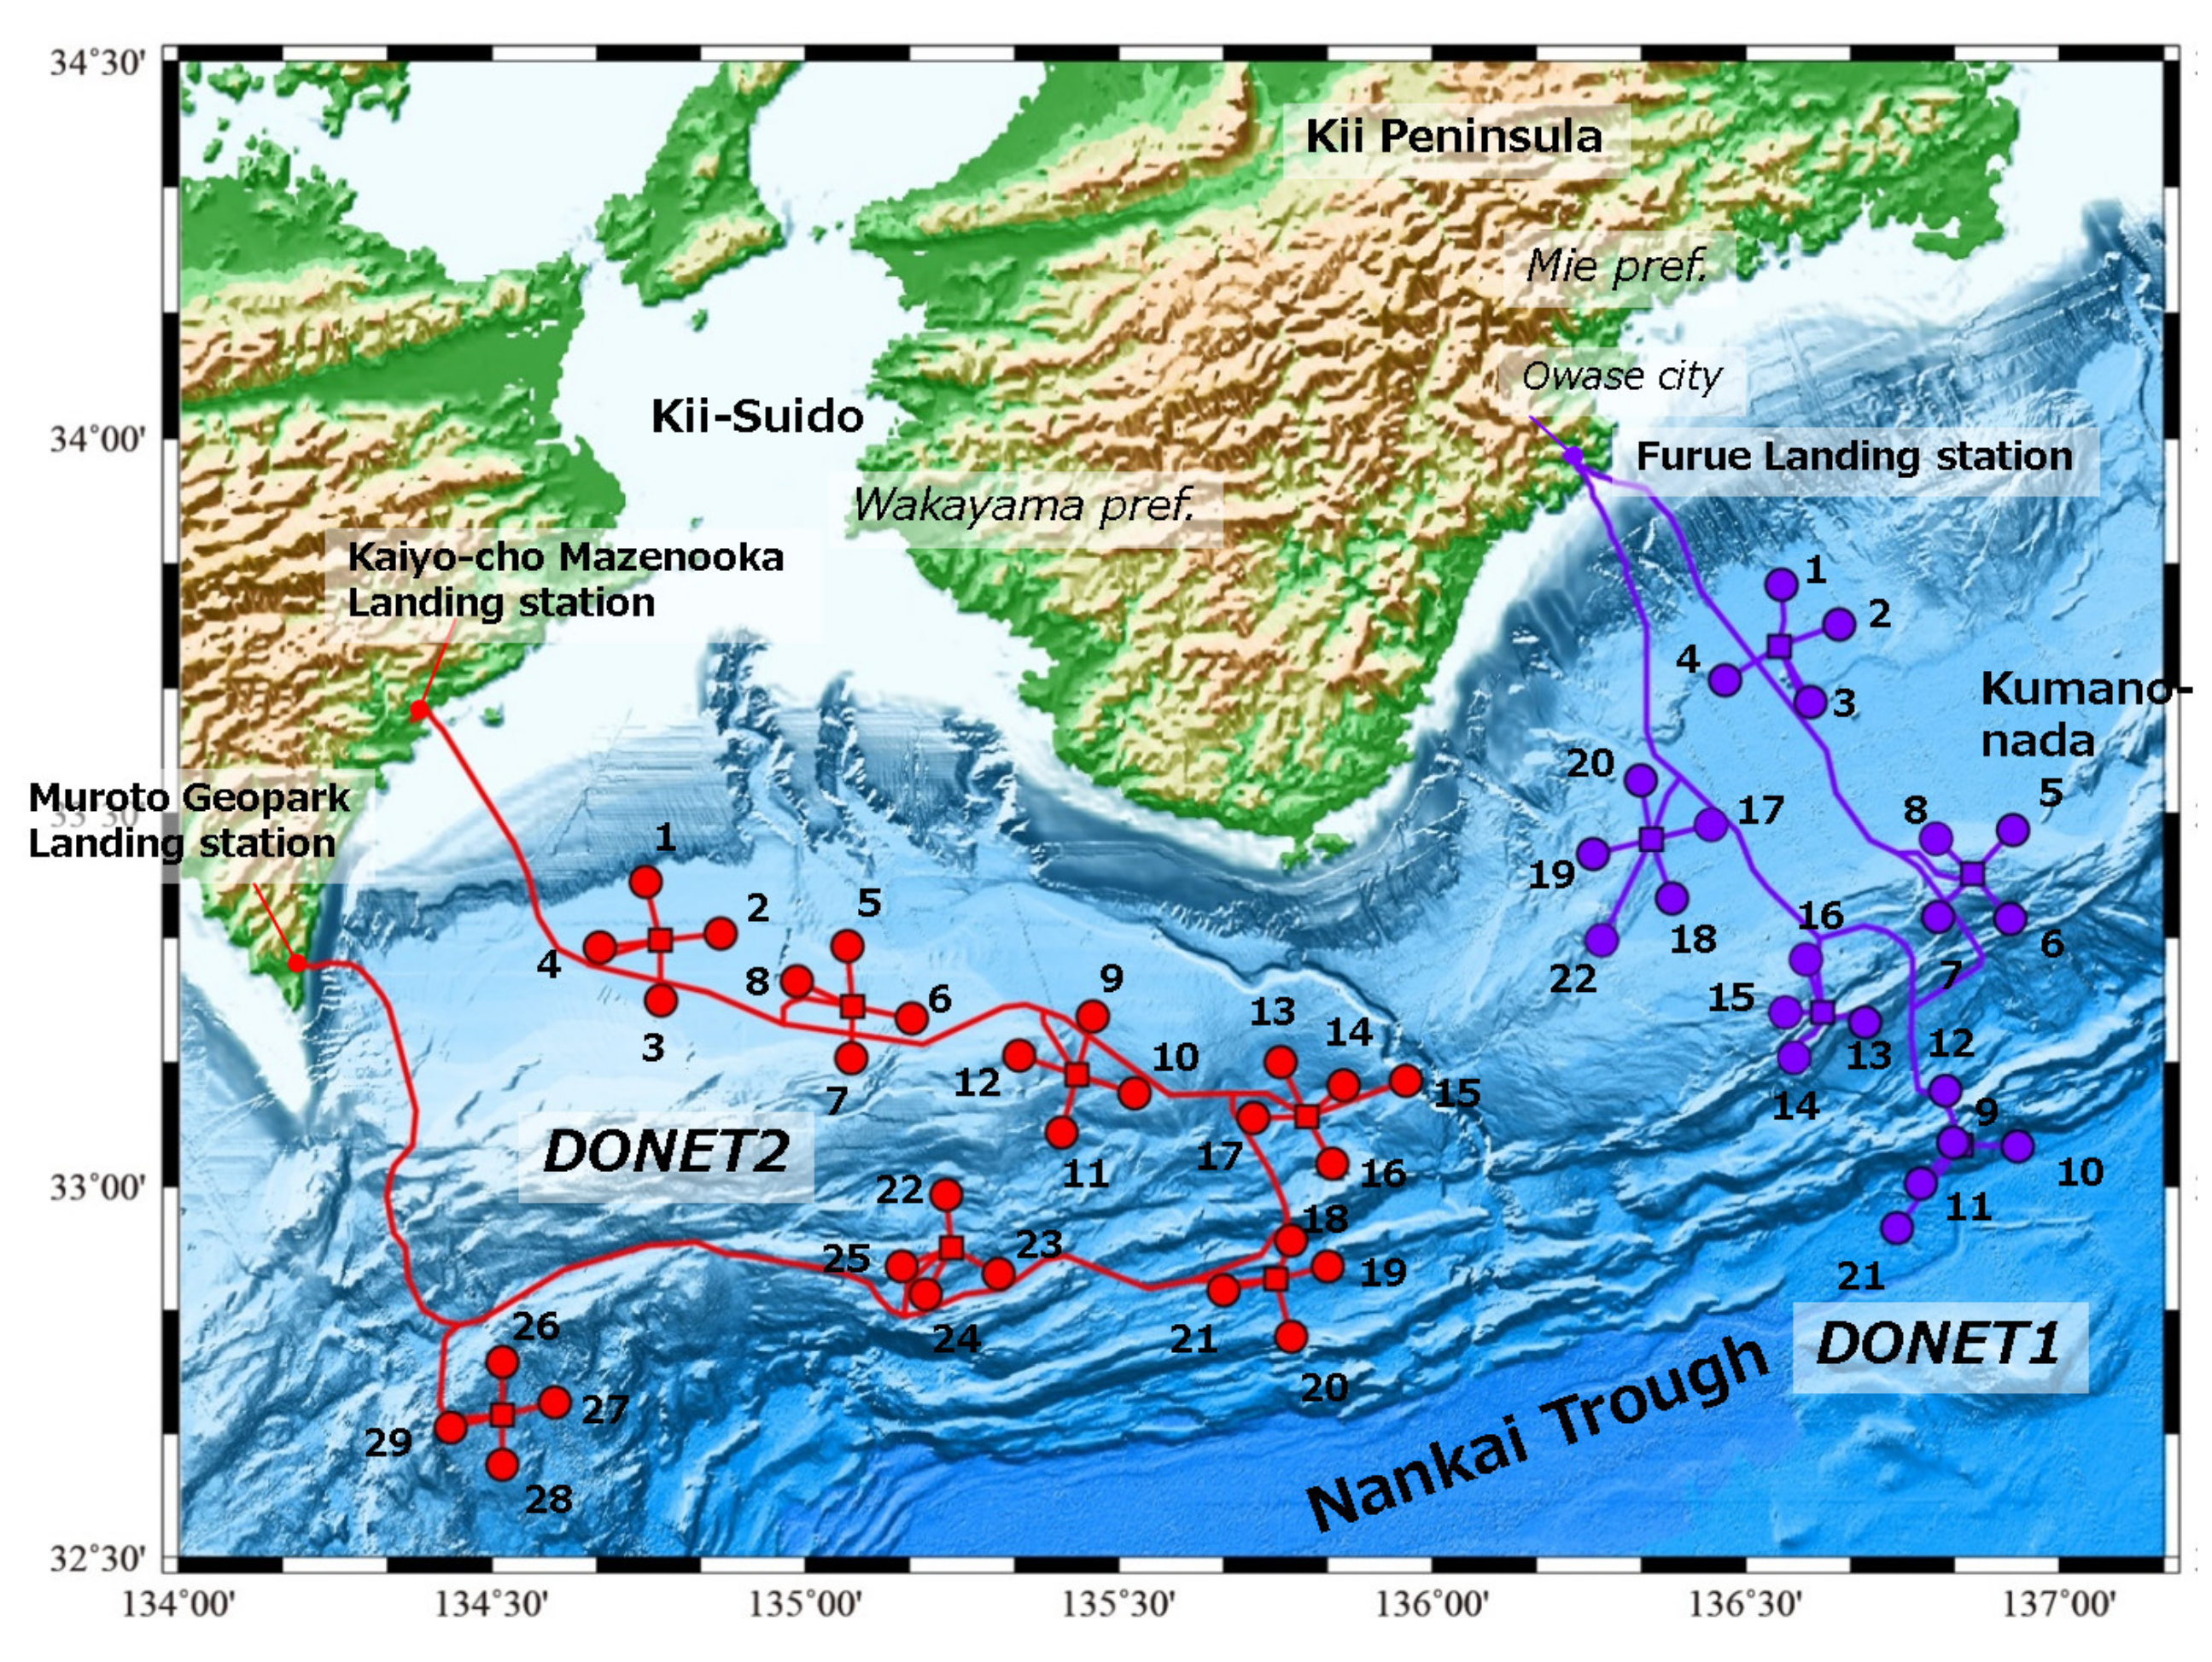
8]), have been installed around Japan and are being implemented by the National Research Institute for Earth Science and Disaster Resilience (NIED). These network systems are able to detect offshore earthquakes and tsunamis and consist of several kinds of seismometers and pressure sensors that are laid over wide areas of the seafloor from sites near coastal areas to trenches. The DONET was installed around the Nankai Trough area and is composed of two subsystems, DONET1 and DONET2, that together include 51 observatories. The DONET1 and DONET2 were installed in the Kumano-nada Sea and the Kii Strait, which are the locations of the first ruptures of the Tonankai and Nankai earthquakes, respectively (
Figure 1). The S-net installed around the Japan Trench area is composed of five subsystems, S1 to S6, and a total of 150 observatories. The S-net monitors for seismicity and the occurrence of tsunamis over an area that includes the rupture area of the 2011 earthquake off the Pacific coast of Tohoku and adjacent areas of concern with respect to earthquake activity, such as the area offshore from Tokachi to Nemuro, off Boso, and the outer-rise areas.
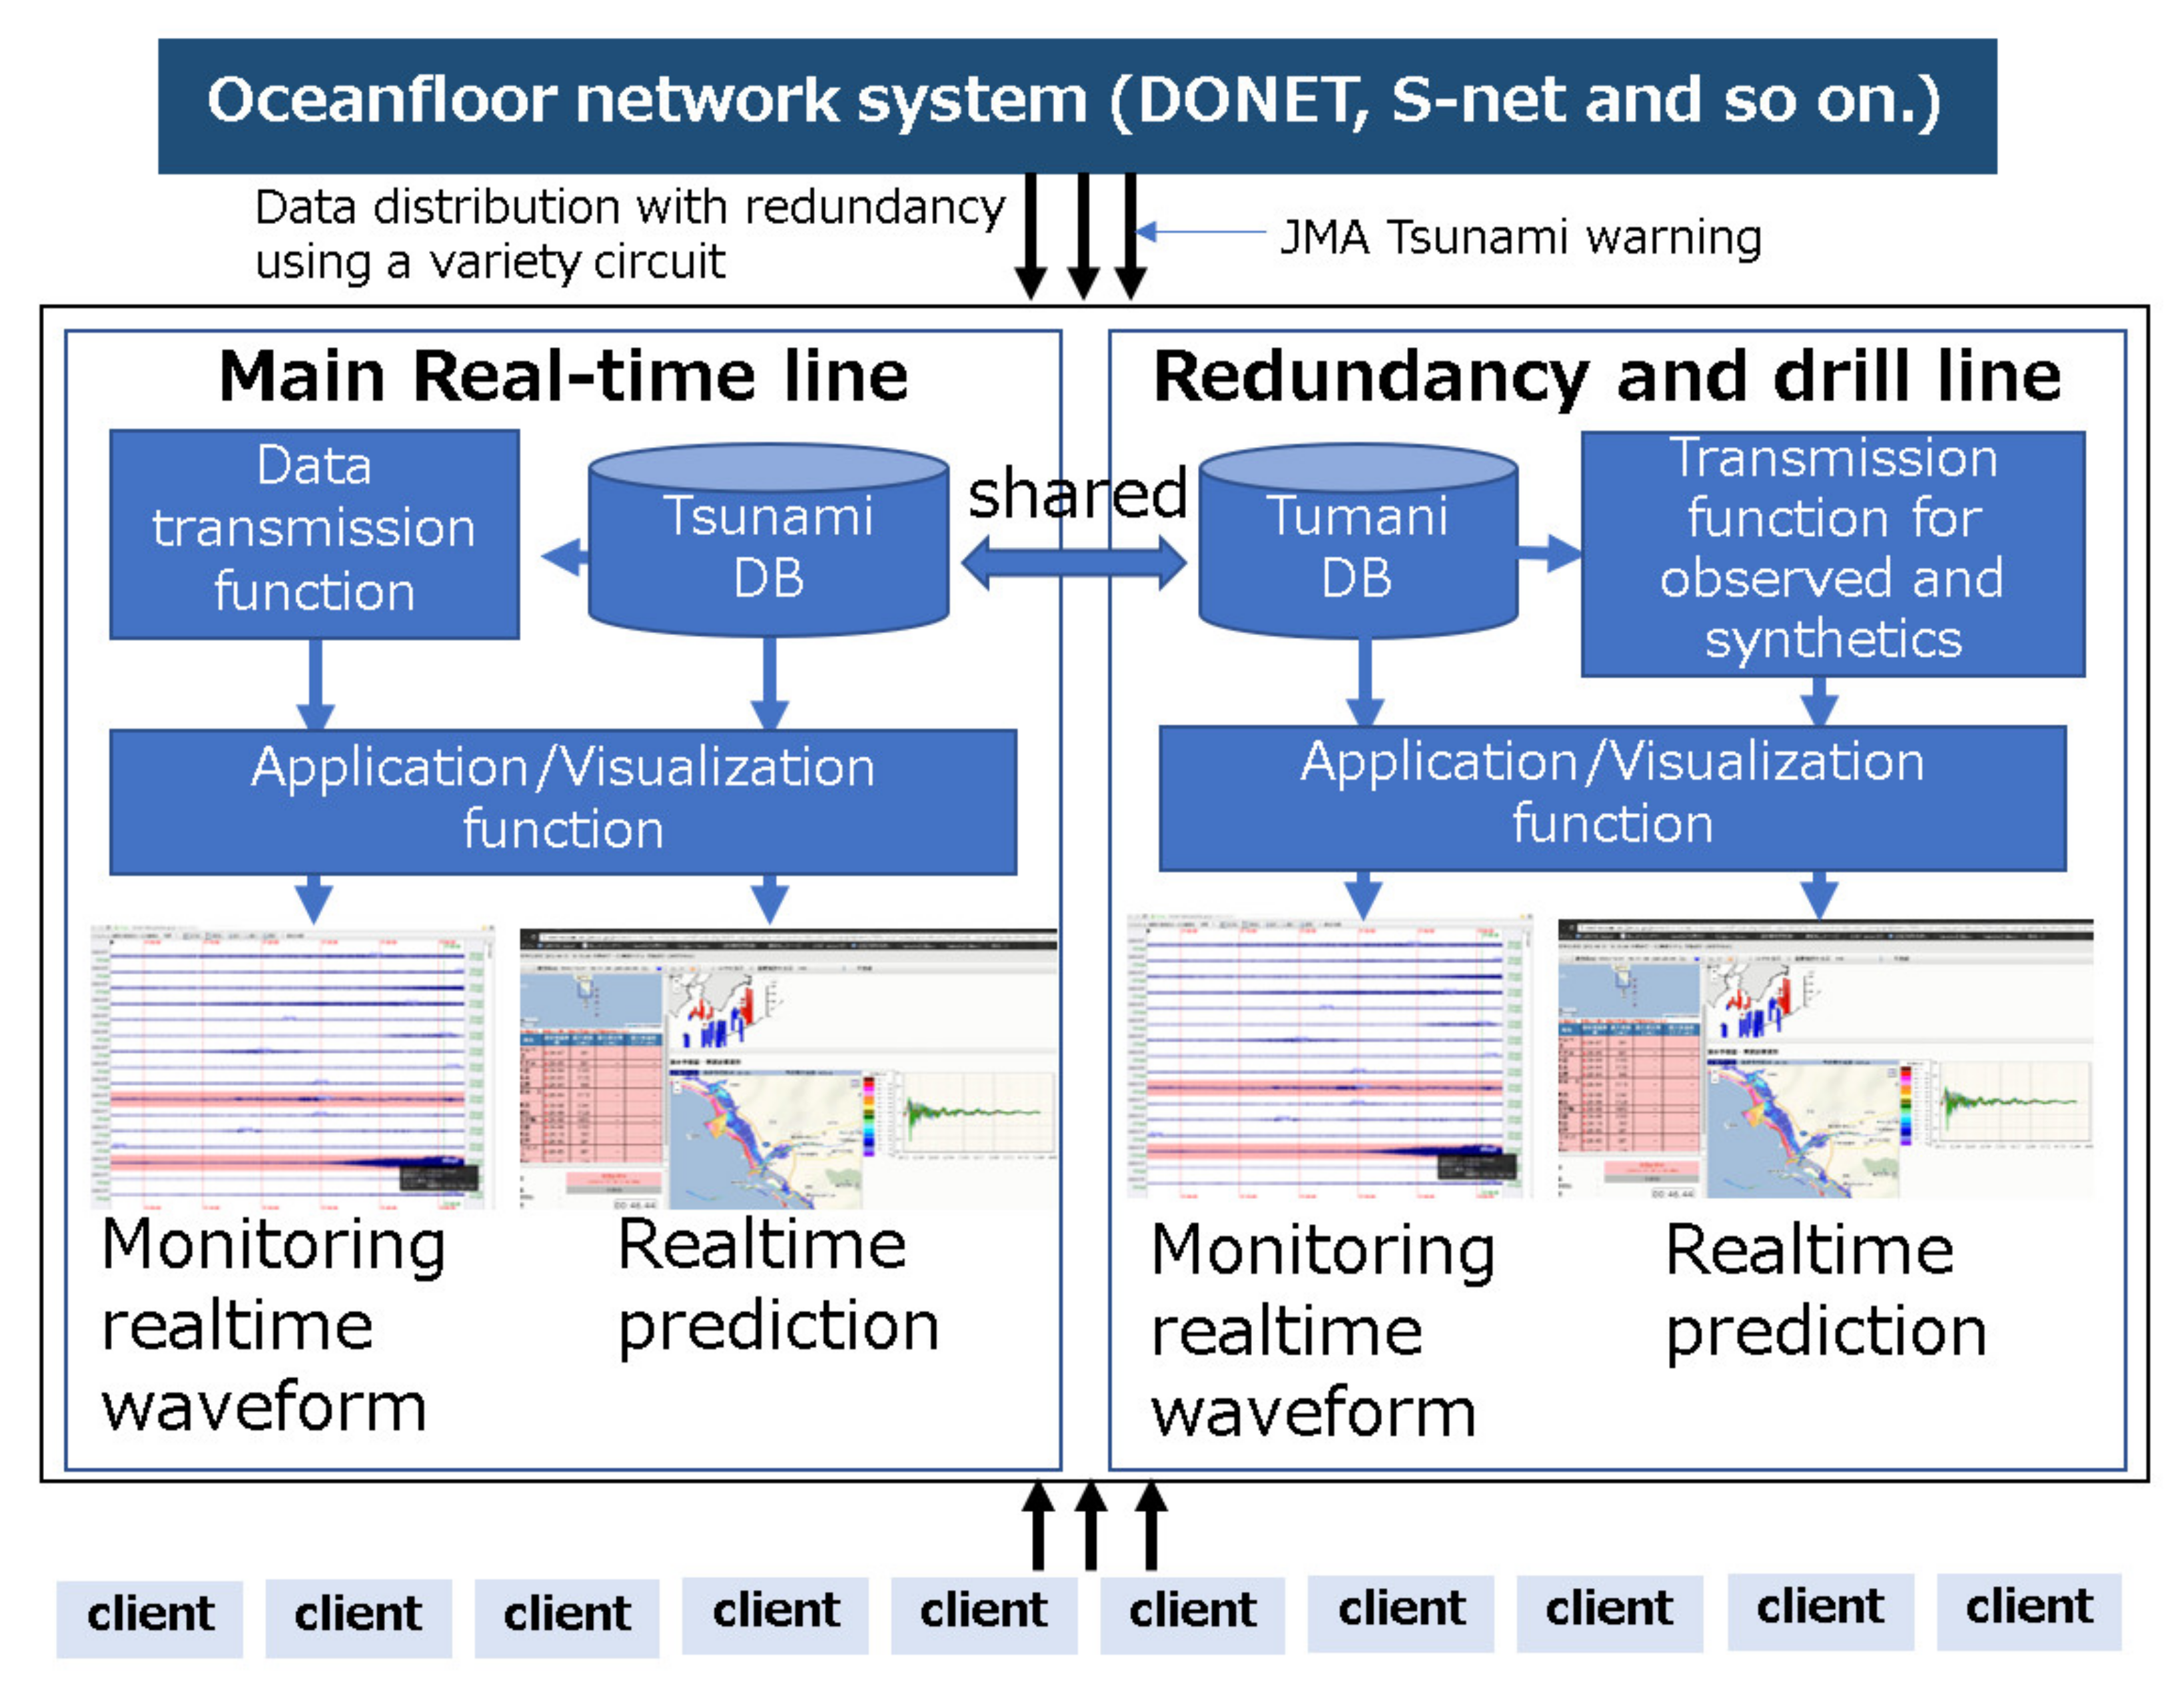
To answer the needs of society, it is essential that the network system be reliable and have redundancy. The system uses commercial base cables as backbone cables, and the longevity of those cables has been satisfactory. The need for redundancy is addressed by sending the observed data to two landing stations (except for two subsystems of the S-net) to reduce the risk of losing data. In addition, each observatory has multiple sensors for earthquakes and tsunamis. Crustal activities, including tsunamis, can continue to be observed even if one of the sensors experiences problems. These safeguards are indispensable for an ocean floor network system because continuity without missing data is important to their implementation and use in societies.
Data observed by these ocean floor network systems are sent in real time to the Japan Meteorological Agency (JMA), institutions related to earth science, and universities. The JMA uses the data to provide emergency early warnings of earthquakes and tsunamis. For tsunamis, a warning and emergency warning are announced to the public in areas where the tsunami height is expected to be 1–3 m or more than 3 m, respectively. The JMA sets regional classifications for these warnings and announces the warnings uniformly over all regions. We propose a different strategy to that of the JMA to announce tsunami warnings. Tsunami information produced by our system should be customized for each community and should depict not just the time of tsunami arrival and its height but also potential tsunami damage, including inundation area and depth. The published overview of our realtime tsunami predictions [
9,
10] can be found in Wakayama, Mie, and Chiba prefectures, the coastal city of Owase, at the Chubu Electric Power Company, and at Kagawa University. In
Section 2, we provide in-depth information about the methods used in our system.
The Japanese archipelago is surrounded by plate boundaries and offshore active faults, and near-field tsunamis have caused severe damage in Japan. Many earlier reports have documented the damage caused by tsunamis over more than 1000 years (e.g., [
11]). The JMA has previously estimated the height of tsunamis in real time using information on hypocenters and magnitude levels determined from land-based seismic stations (e.g., [
12]). Tsushima et al. (2009) [
13] have indicated that the tsunami waveform at the coast can be predicted by using pressure gauge data taken at the ocean bottom and a linear combination of pre-calculated Green’s functions. Baba et al. (2014) [
14], Yamamoto et al. (2016) [
15], and Igarashi et al. (2016) [
16] have adopted a model-based prediction methodology. They used a tsunami database of pre-calculated waveforms and inundation maps using many fault models. Baba et al. (2014) [
14] have reported that there is a close correlation between the average of the absolute pressures read by DONET and the calculated heights of the first tsunami waves in coastal areas. Yamamoto et al. (2016) [
15] have prepared a tsunami database using many fault models set on the plate boundary and have selected tsunami scenarios based on multiple indices of observed and calculated waveforms. Their method selects common fault models based on all of the data in the ocean floor network system. Igarashi et al. (2016) [
16] have applied a Gaussian process to the tsunami database and aimed to improve the accuracy of predictions for relatively large M earthquakes. Ohta et al. (2012) [
17] have developed a real-time Ground-Based Earth Observing Network (GEONET) analysis system for the rapid deformation monitoring (REGARD) application that determines a fault model using Global Navigation Satellite Systems (GNSS) data. Koshimura et al. (2014) [
18] have constructed a prediction system to calculate tsunami inundation in real time using a supercomputer and the REGARD application (vide supra). This method also determines a unique fault model for the prediction. Maeda et al. (2015) [
19] have proposed a tsunami prediction method using a data assimilation technique for the ocean floor network system. Makinoshima et al. (2021) [
20] have proposed a tsunami forecasting approach using convolutional neural networks through numerical experiments.
2. Real-Time Tsunami Prediction Technique
2.1. Overview of the Tsunami Prediction System
Here, we define that tsunami prediction information includes tsunami arrival time, the height, inundation area, and its depth distribution. There are many methods for real-time tsunami prediction, but there are many issues to make use of them for regional tsunami disasters and prevention. Network systems above the ocean floor have recently been implemented, and the technology of real-time tsunami prediction has evolved with the use of their data [
14,
15,
16].
It is essential for tsunami prediction that there is a close correlation between the average of the absolute pressures read by DONET and the calculated heights of the first tsunami waves in coastal areas [
14]. Our system basically adopts a model-based prediction like Baba et al. (2014) [
14]. DONET observatories record tsunamis and possible tsunami scenarios are then derived using the above correlation. At this stage, there are differences to select an appropriate fault model using statistical techniques. Our system predicts tsunami for each point along the coastal area because we consider that it is difficult to predict for each point using one common fault model due to heterogeneity on the slip distribution and other origins of tsunami-like seafloor landslides as described in
Section 2.2 and
Section 2.3.
In addition, the accuracy of the tsunami prediction depends on users’ motivation and their policy. Users may hope to avoid underestimation rather than to extract close tsunami height. We prepared some options for how to predict them according to the users’ preferences as described in
Section 2.4.
Real observed data include many types of noise. To install it as the system, it is significant to understand noise characteristics for each ocean floor network system. We described how to reduce the effects of noise in
Section 2.5.
2.2. Concept of the System
Our system adopted a model-based prediction method based on Baba et al. (2014) [
14] to predict tsunamis and their amplified heights using ocean floor network system data [
9,
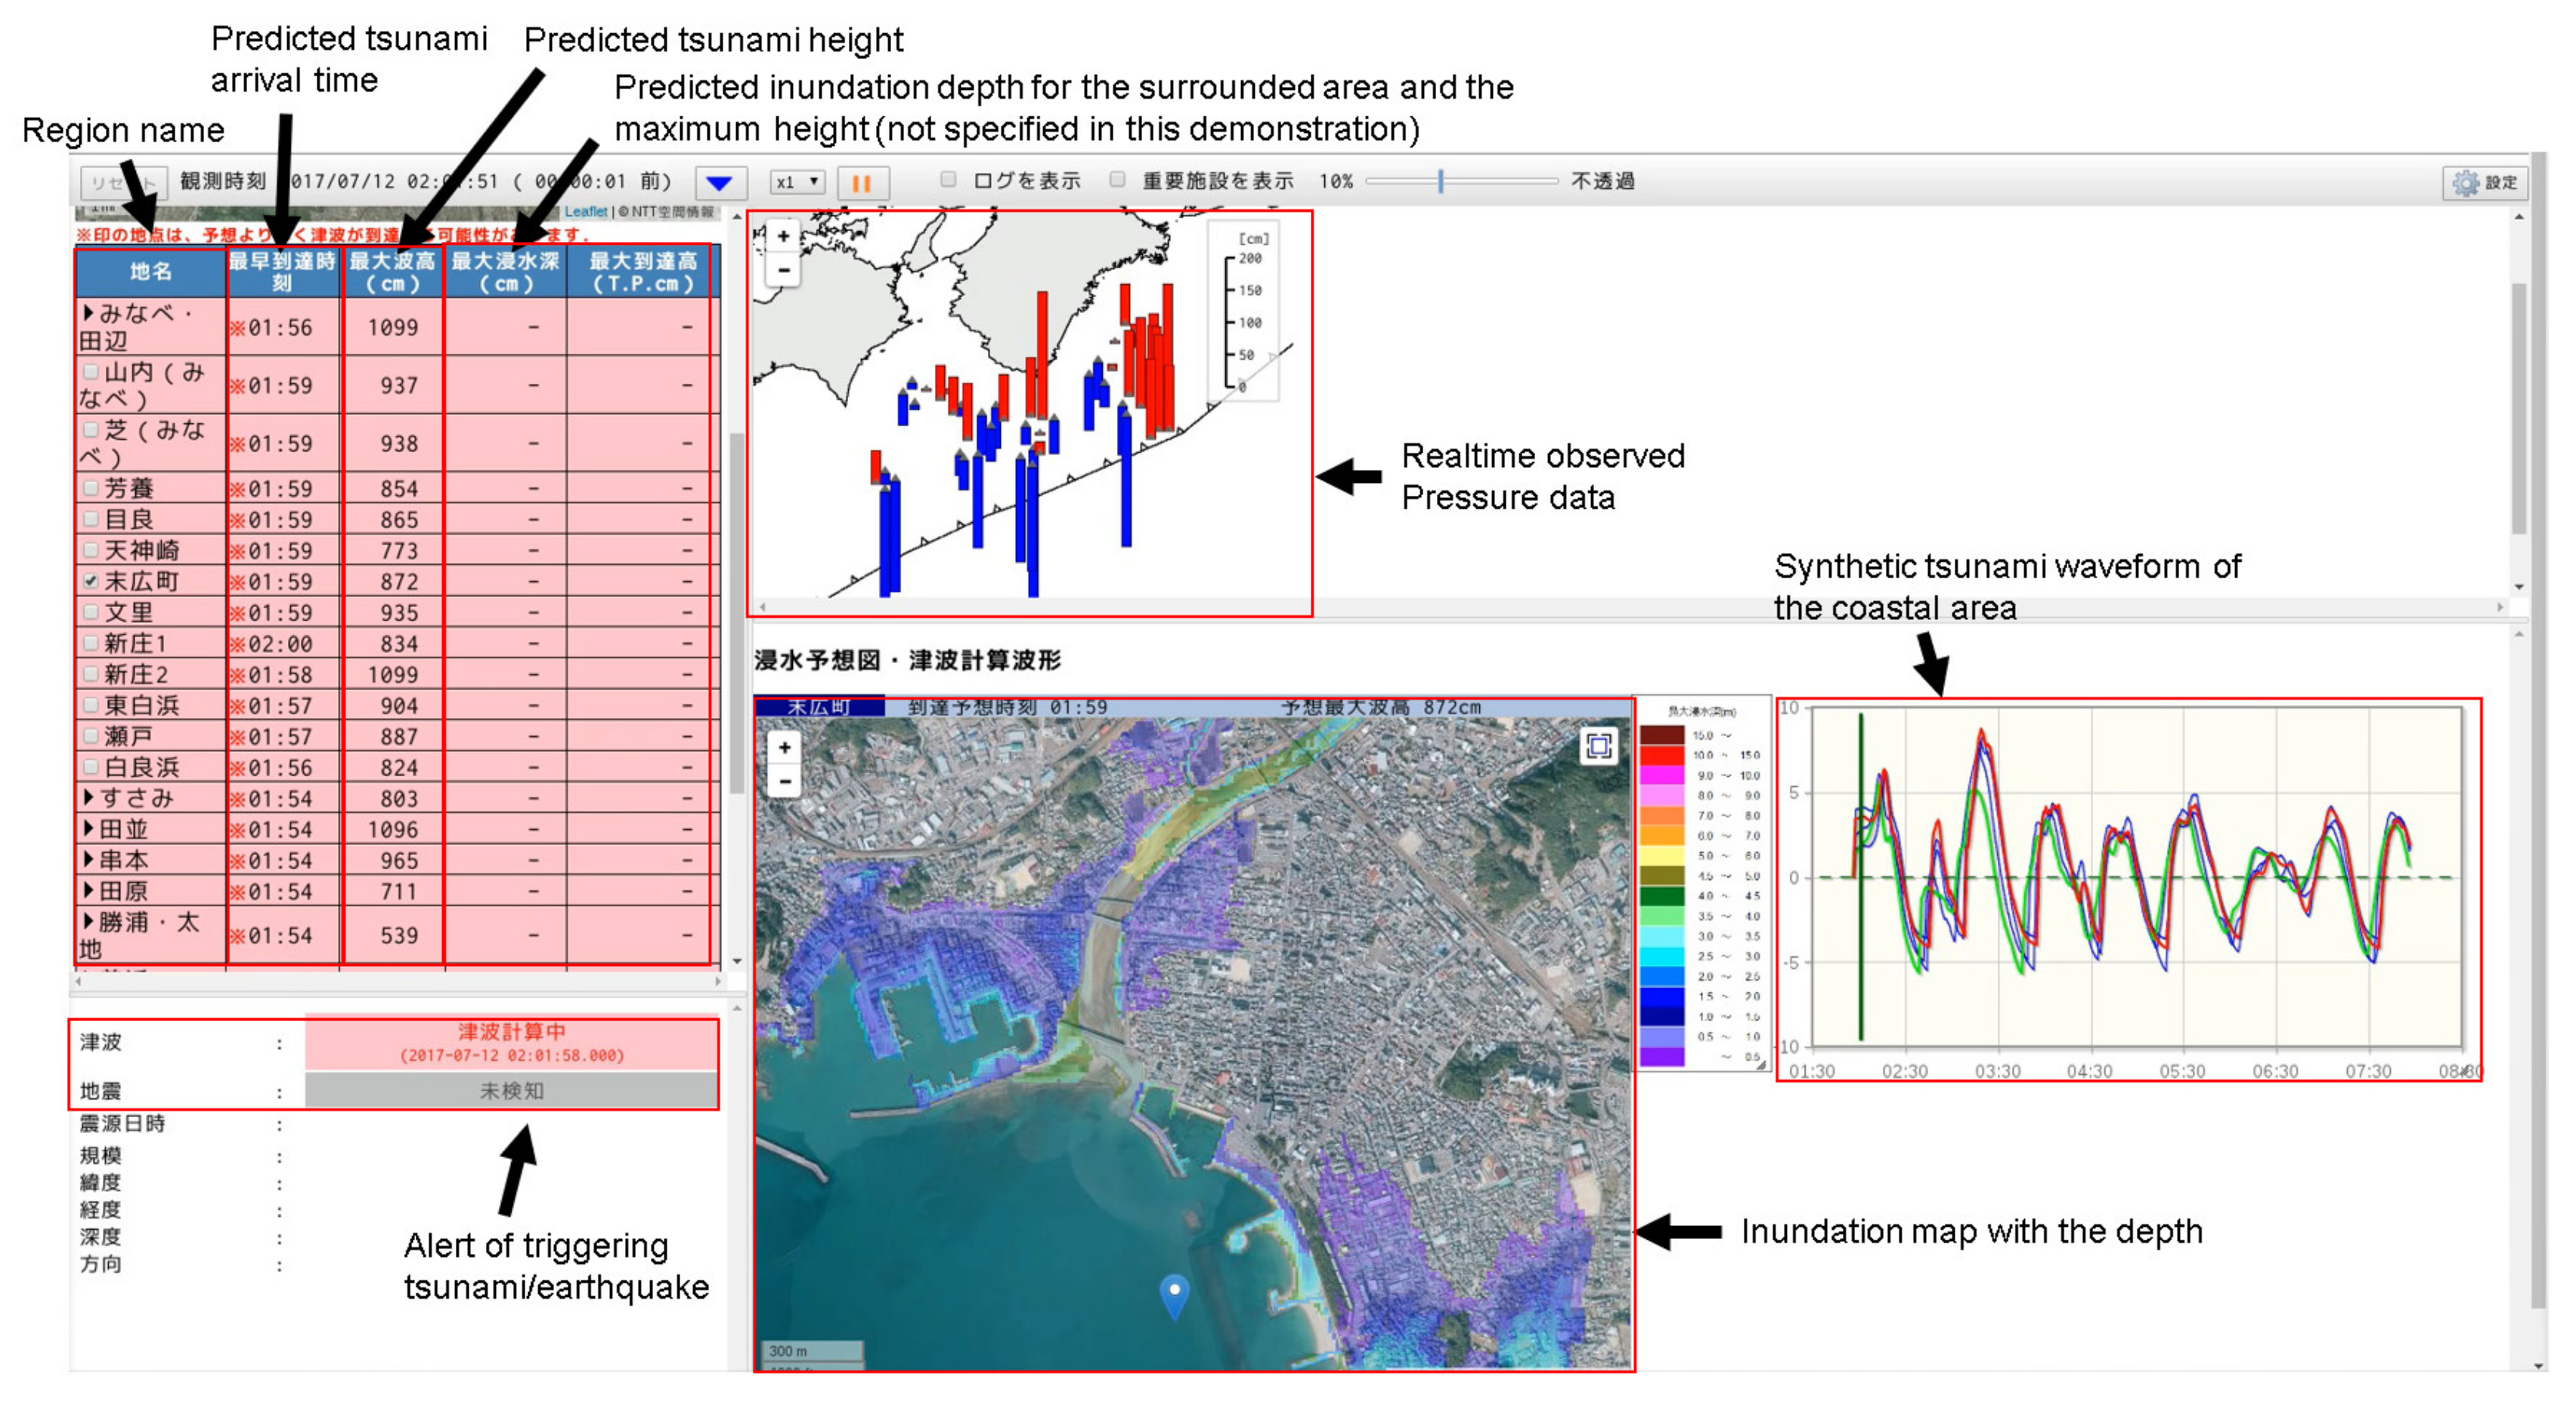
10]. The real-time tsunami prediction system that we developed predicts arrival times of the fastest tsunami, the tsunami height, and the inundation area with depth. The system also concurrently provides a visualization of the waveforms of the tsunami at the coastal points where the tsunami is predicted to make landfall using extracted fault models (
Figure 2). These predictions are provided for landfall sites in local regions.
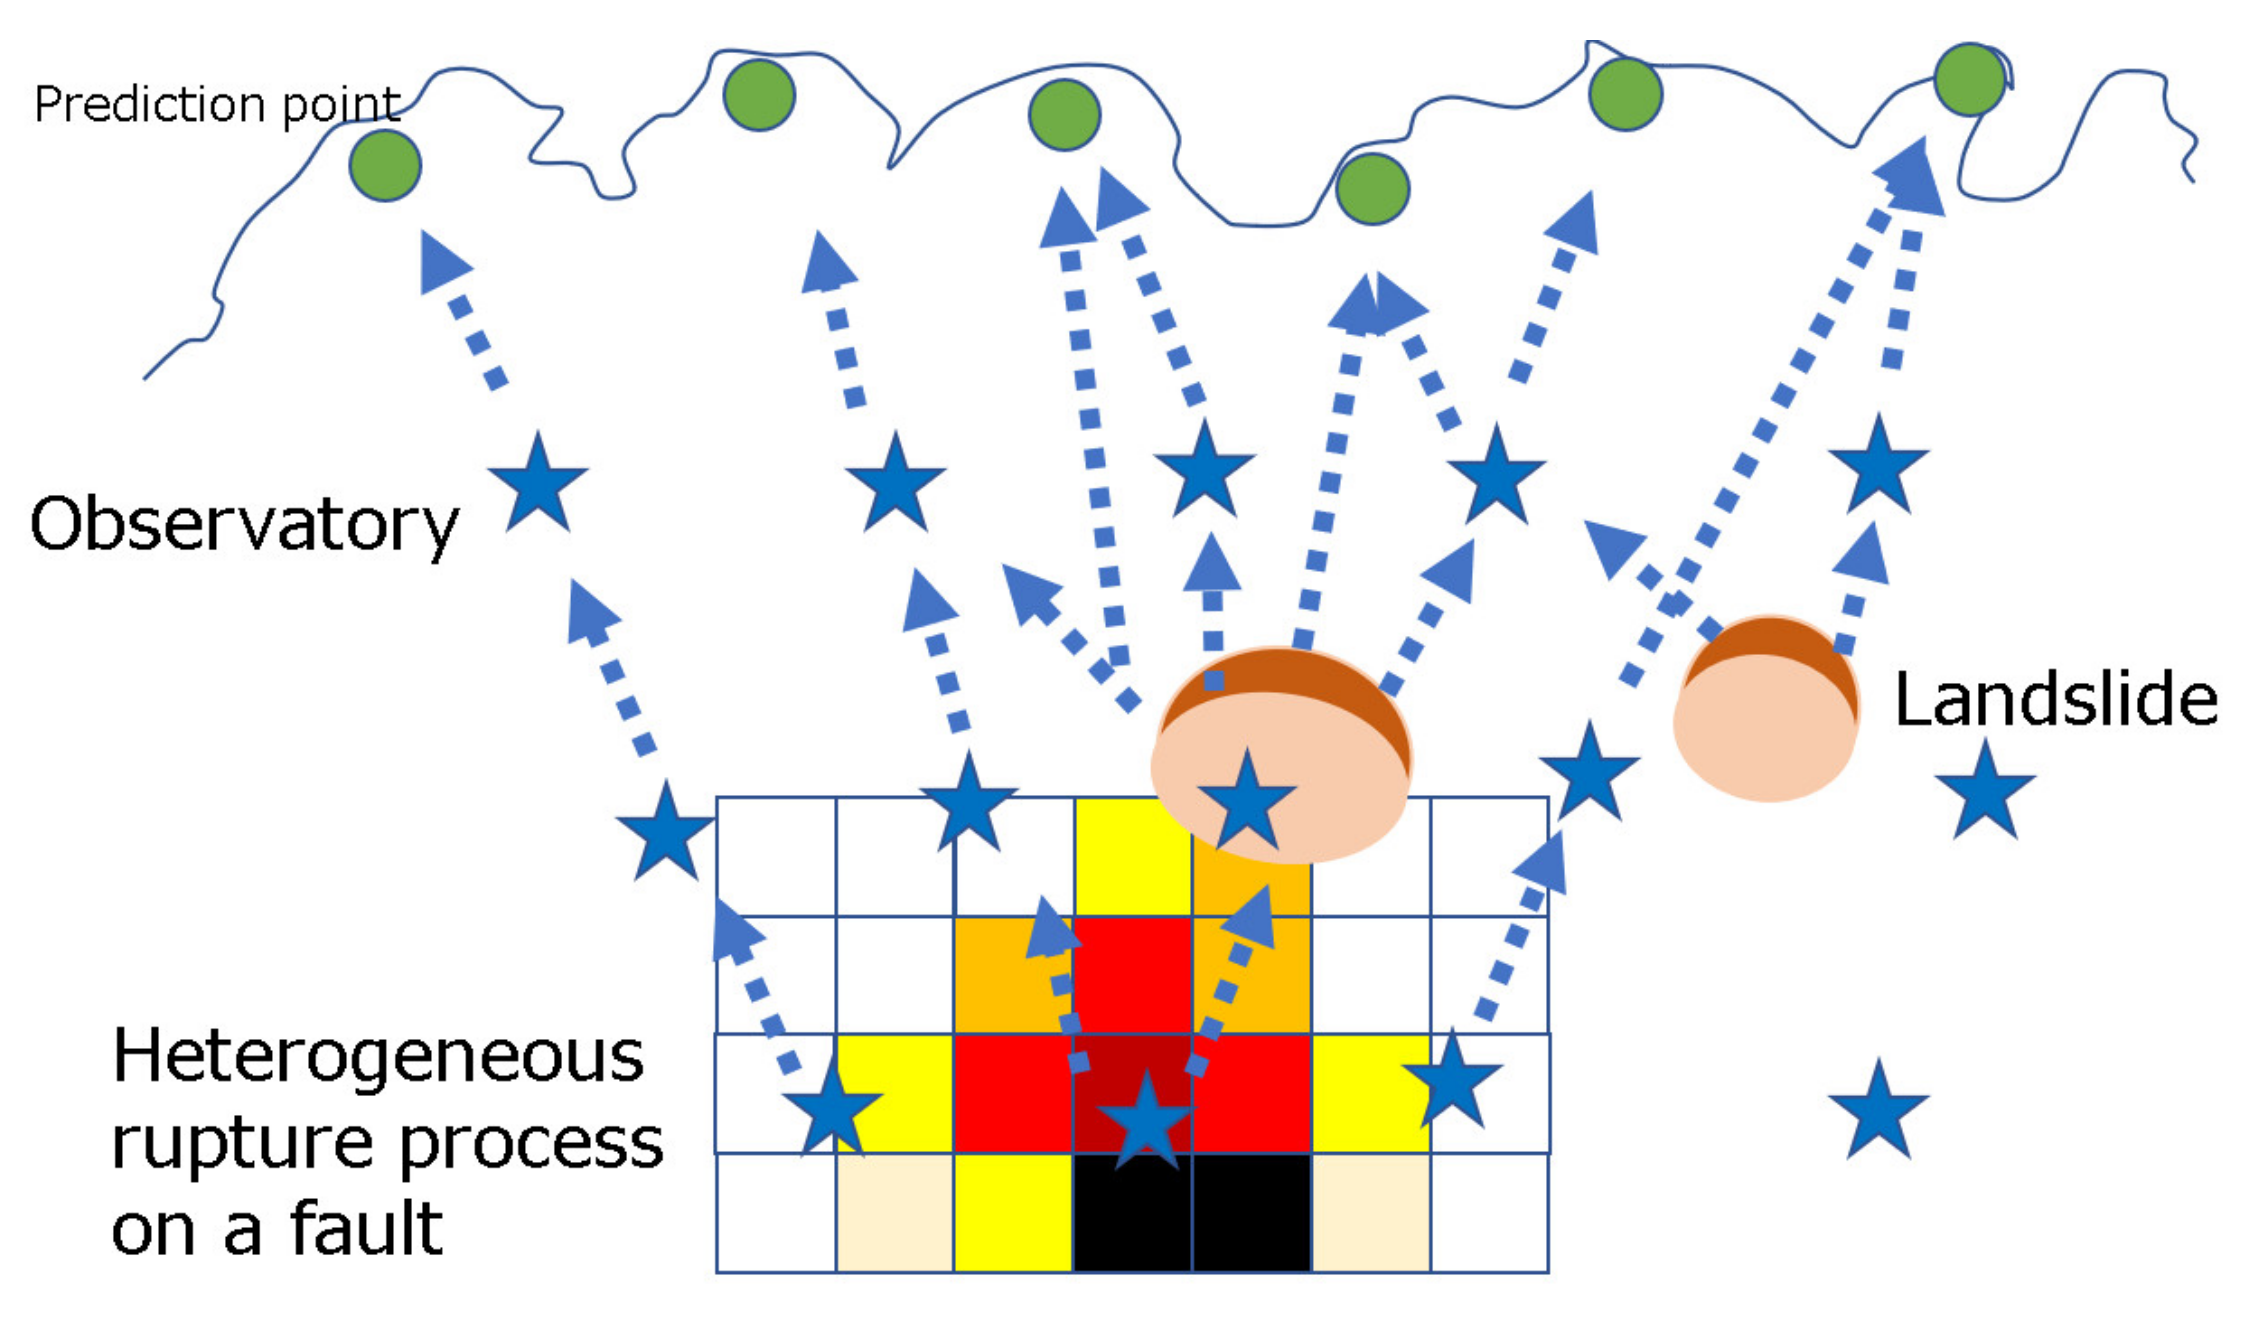
We prefer not to select a unique fault model for these predictions because we consider tsunamis to originate from seafloor landslides (
Figure 3). Such a tsunami may have local effects, and the determination of a unique model may lead to underestimation. Forearc regions around Japan are covered with soft sediment, and a local tsunami sometimes occurs. In fact, many seafloor slides can be traced on the forearc region along the Nankai Trough. During an amplified tsunami produced by a Nankai megathrust earthquake, a local tsunami generated by a seafloor slide may occur somewhere between the origin of the amplified tsunami and its arrival at the coast; in this case, the local tsunami height is added to the height of the amplified tsunami. Such local effects on the tsunami should be reflected in the prediction. Determination of one fault model may lead to underestimation of the tsunami height because it is difficult to take into account local effects on tsunami heights.
Although there are some approaches and characteristics to extract fault models for the prediction [
14,
15,
16], the fact that the correlation between the observed pressure data and calculated tsunami height was positive with dispersion is common. Baba et al. (2014) [
14] estimated correlation using pressure values for the first arrival and uses the average for selected models corresponding input data. Our system uses those for the entire waveform and extracts the absolute maximum tsunami height for all observatories and prediction points. How to extract the fault models considering the accuracy depends on the aim of users. For example, a local government prefers to avoid underestimation, so it can choose to extract models that predict the maximum tsunami height. Our system prepares options based on methods that users can select to extract models based on the goals of the users.
Here, we have developed our system using ocean floor network systems like DONET and S-net. However, coastal areas covered by the ocean floor network system like DOENT and S-net may be restricted. In such a case, buoy data is also available in this system. In fact, the entirety of Japan is not surrounded by such infrastructure. Although the number of the buoy station depends on the covered coastal area and the topography, our system has the extendibility to install on other areas and the logic of the prediction is suitable for easy adaptability.
2.3. Tsunami Database
The approach used to construct the tsunami database was basically similar to the above approach [
14]. We prepared many fault models along the Nankai Trough areas with a specified magnitude, depth, dip, and location and calculated tsunami waveforms using many fault models and JAGURS code [
21]. The locations necessarily had nothing to do with the distribution of the plate boundary. There are many branching faults on the Nankai forearc region, and proof of high-speed ruptures along branching faults has been obtained [
22]. Baba et al. (2014) [
14] have prepared fault models of over 3000 cases. However, such a large number of fault models is unnecessary to grasp the relationship between observed tsunami height at the ocean floor network observatories and predicted tsunami height at the predicted points of landfall. We, therefore, halved the number of fault models and were left with somewhat more than 1500 cases. The rationale is that the entire system should be no more complex than necessary to enable implementation by many kinds of users.
However, there were few high-magnitude fault models. The highest M earthquake in the tsunami database was 8.5. Takahashi et al. (2017) [
9] have indicated that tsunami prediction with the tsunami database is also focused on very large earthquakes (e.g., M9 [
23]) and that the prediction is valid. However, users may desire a greater number of fault models with a high M. In our system, it is easy to increase the number of fault models. We have added some fault models with the fault slide constant increased severalfold compared to the fault models with M9 as above. Igarashi et al. (2016) [
16] have applied extrapolation using a Gaussian process to estimate the height of a very large tsunami based on a small number of fault models in the database, but we increased the fault models because we needed models to visualize tsunami inundation areas along with the depth of inundation.
2.4. Improvement of the Prediction
Immediate and accurate predictions are needed to answer users’ needs. Our system therefore uses not only pressure data but also seismometer data. It is important to make accurate predictions using real-time information about source direction based on the concepts of our system. Event detection works in a normal manner on our system. After a seismometer and pressure gauge on the ocean floor network system are triggered, a judgment of the source direction is made using the time series of information from the seismometer and the pressure gauge data at the observatories. The speed of detection is faster for the seismometer than for the pressure gauge, and the first extraction from the tsunami database is performed using only seismometer data. The second extraction is then performed using the temporal order of tsunami detection among the observatories. As the extraction proceeds, the candidates among the fault models are narrowed as the data on pressure from observatories increases. Finally, the top four models and one model that predicts the highest tsunami and the fastest arrival time are selected and visualized.
The accuracy of the prediction depends on the dispersion of the relationship between the observed pressure data and calculated tsunami height [
9]. Although statistical processing can be applied (e.g., [
14,
15,
16]) to extract appropriate fault models, our system filters the selected models before statistical processing (
Figure 4). Dispersion means that there are two cases for each combination of input data: one case is a relatively high tsunami at the predicted points, and the other is a relatively low tsunami at the same points. The first case corresponds to positive interference between the tsunami and the subsequent or reflected wave, which should be included in the tsunami prediction. The other case corresponds to the scattering of the tsunami. During tsunami propagation from the source, the tsunami that reaches the coast can become scattered. For example, a snaking tsunami often reaches the coast in a narrow bay but the energy of a snaking or scattered tsunami is low compared with the energy of a direct tsunami. This fact means that it is essential to take into consideration the direction of an approaching tsunami to improve the accuracy of tsunami prediction. Our system, therefore, judges the direction of an approaching tsunami using seismometers on the ocean floor network system and the temporal order of tsunami triggering.
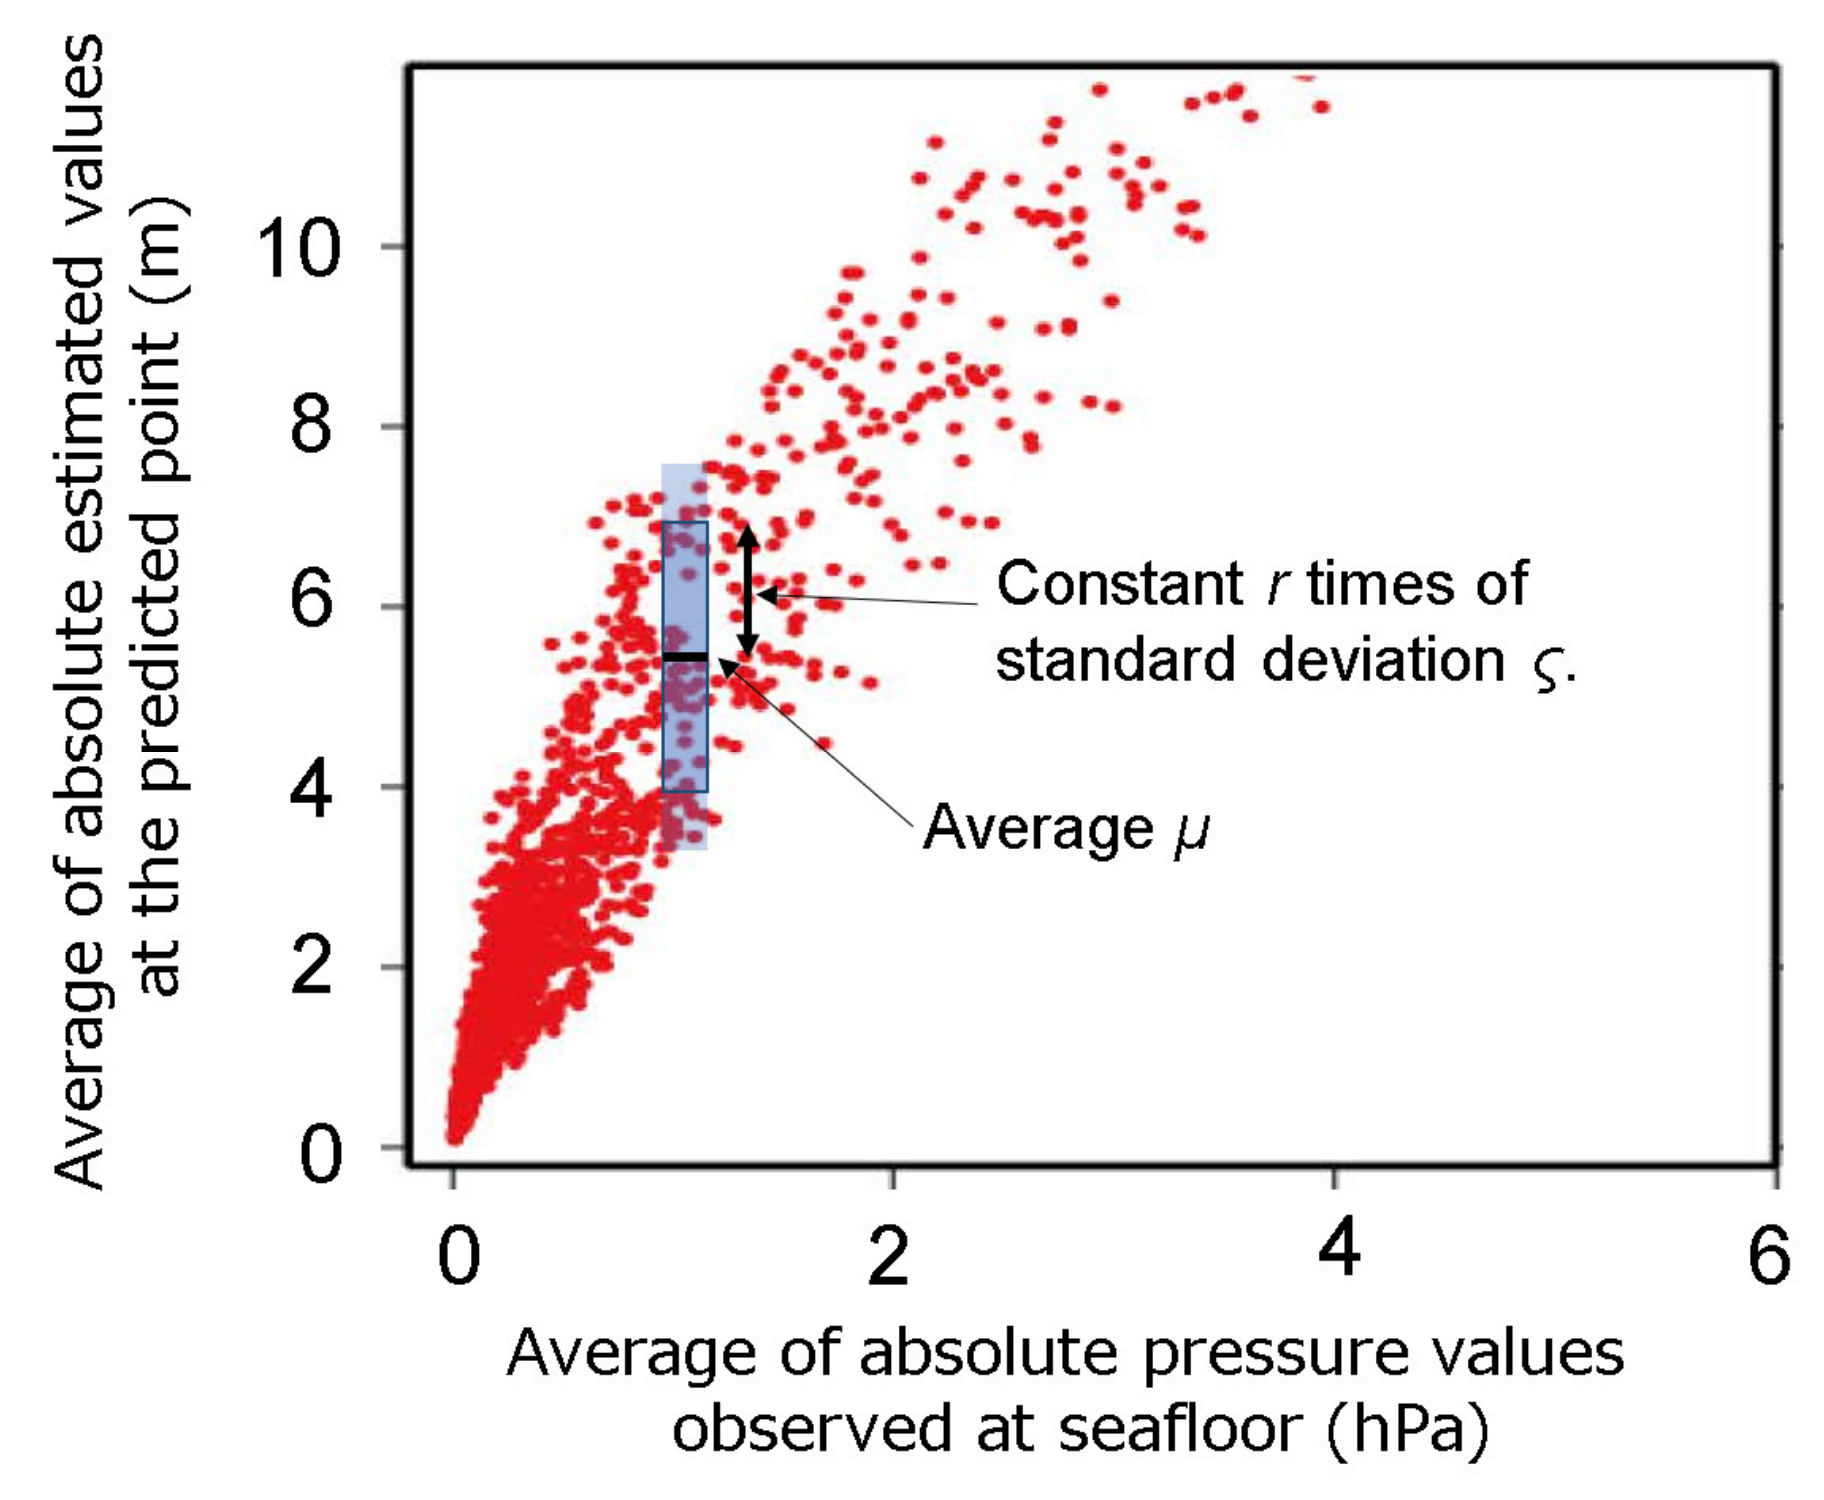
How the predicted information is used depends on the users. Local governments prefer to avoid underestimating the worst-case scenario, but other users might prefer to predict only tsunamis in the M8 category. Takahashi et al. (2017) [
9] have considered the evaluation of both the M9 and M8 models and have concluded that they might slightly overestimate compared to a model of the 1946 Nankai earthquake. We, therefore, prepared some alternatives to the fault models (
Figure 5). One is the extraction of the case corresponding to the greatest predicted height. The other is the extraction of models using simple equations for the average (µ) and standard deviation (ς). Users can extract fault models that correspond to a value equal to µ + rς (r: constant). The constant r can be set in the system as users prefer, and in this way, we have maintained flexibility with respect to users’ needs.
Another issue to be considered is the prediction of inundation. The importance of inundation has been shown by Ishibashi et al. (2018) [
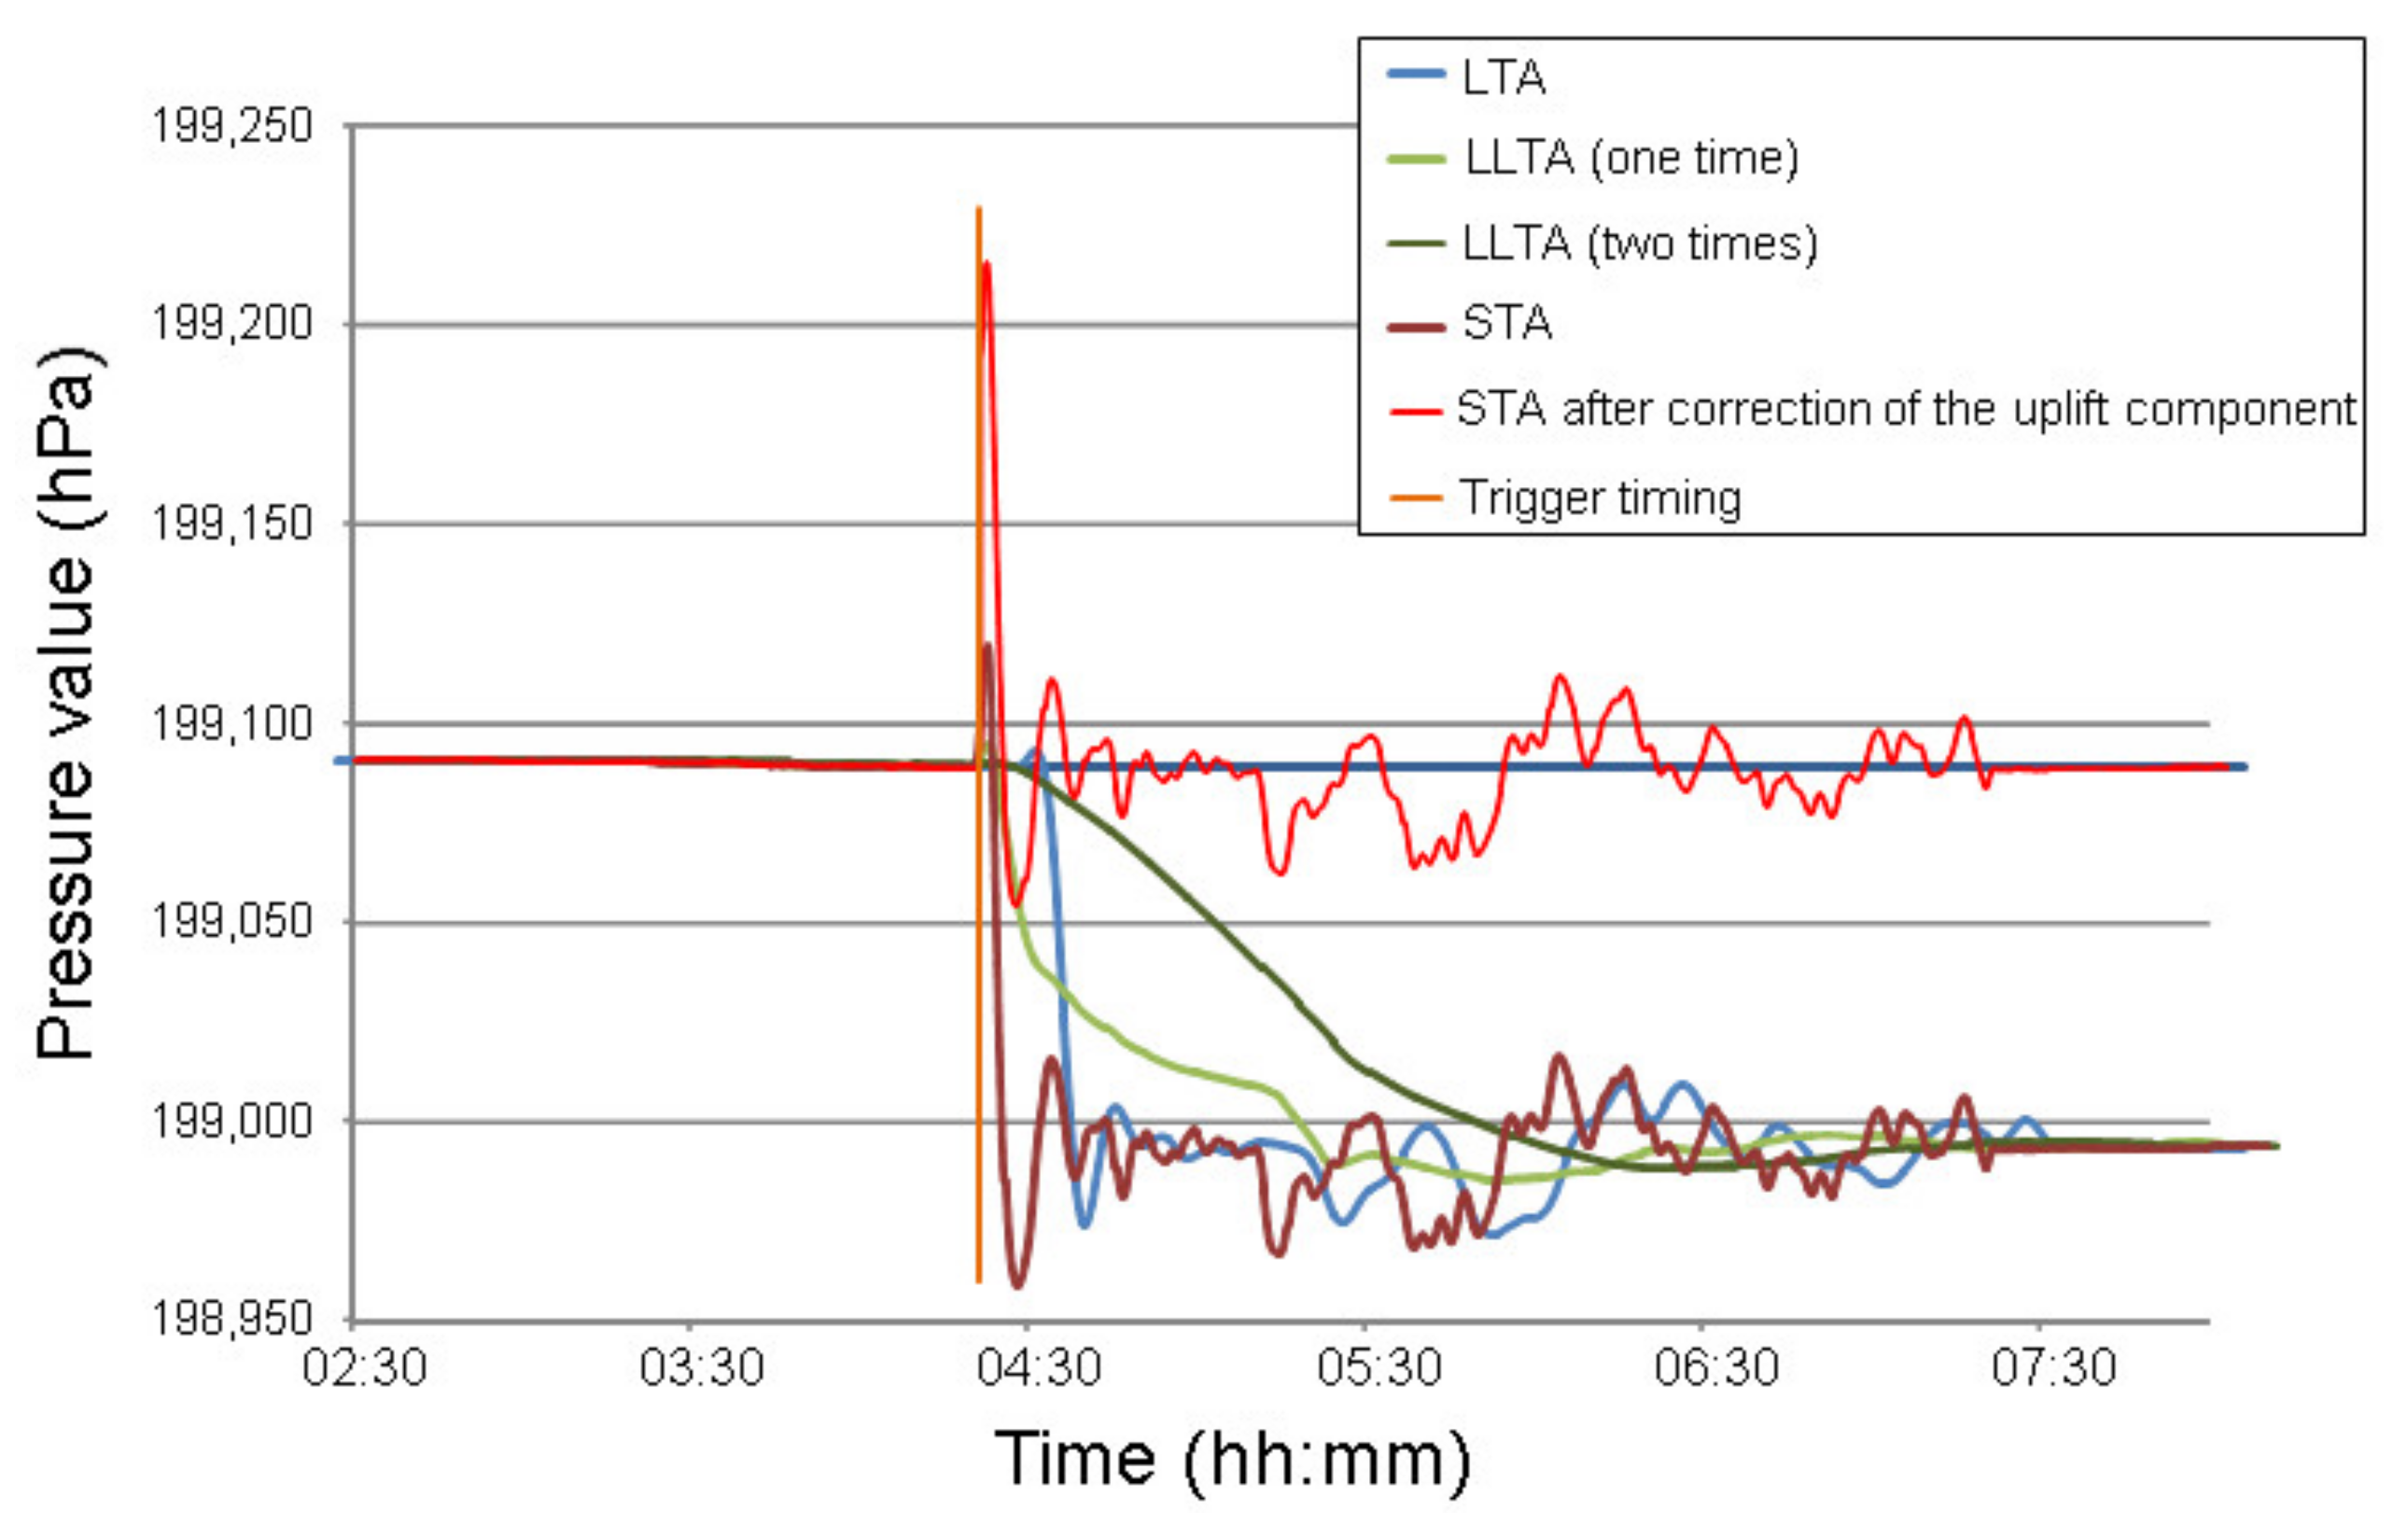
24], who reported the predicted inundation area compared to the observed area for the 1946 Nankai earthquake based on old monuments of the tsunami around the coastal area of Wakayama Prefecture. In cases with large crustal uplift at the points predicted by the extracted models, the inundation area could be underestimated, even if the predicted tsunami height was accurate. To avoid such cases, we introduced the composition of the crustal uplift into the pressure gauge data of the ocean floor network system (
Figure 6). Our system normally calculates a short-term window average (STA), a long-term window average (LTA), and a very long-term window average (VLTA), and it produces a graph of the distribution of the crustal uplift on the ocean floor network system in real time using VLTA. The default models are narrowed further using the graphed distribution of crustal uplift after extraction in the temporal order of the tsunami triggering. It takes several minutes for the distribution values to stabilize, and the length of the VLTA should be determined after taking into consideration the tsunami arrival time at the predicted points.
Another issue that should be considered in the prediction system is that of linked events. Linked events have occurred around the Nankai Trough area: the 1946 Nankai earthquake occurred after the 1944 Showa Tonankai earthquake with a time interval of two years, but the time interval between the 1854 Ansei Tonankai and Nankai earthquakes was 30 h in the Edo era [
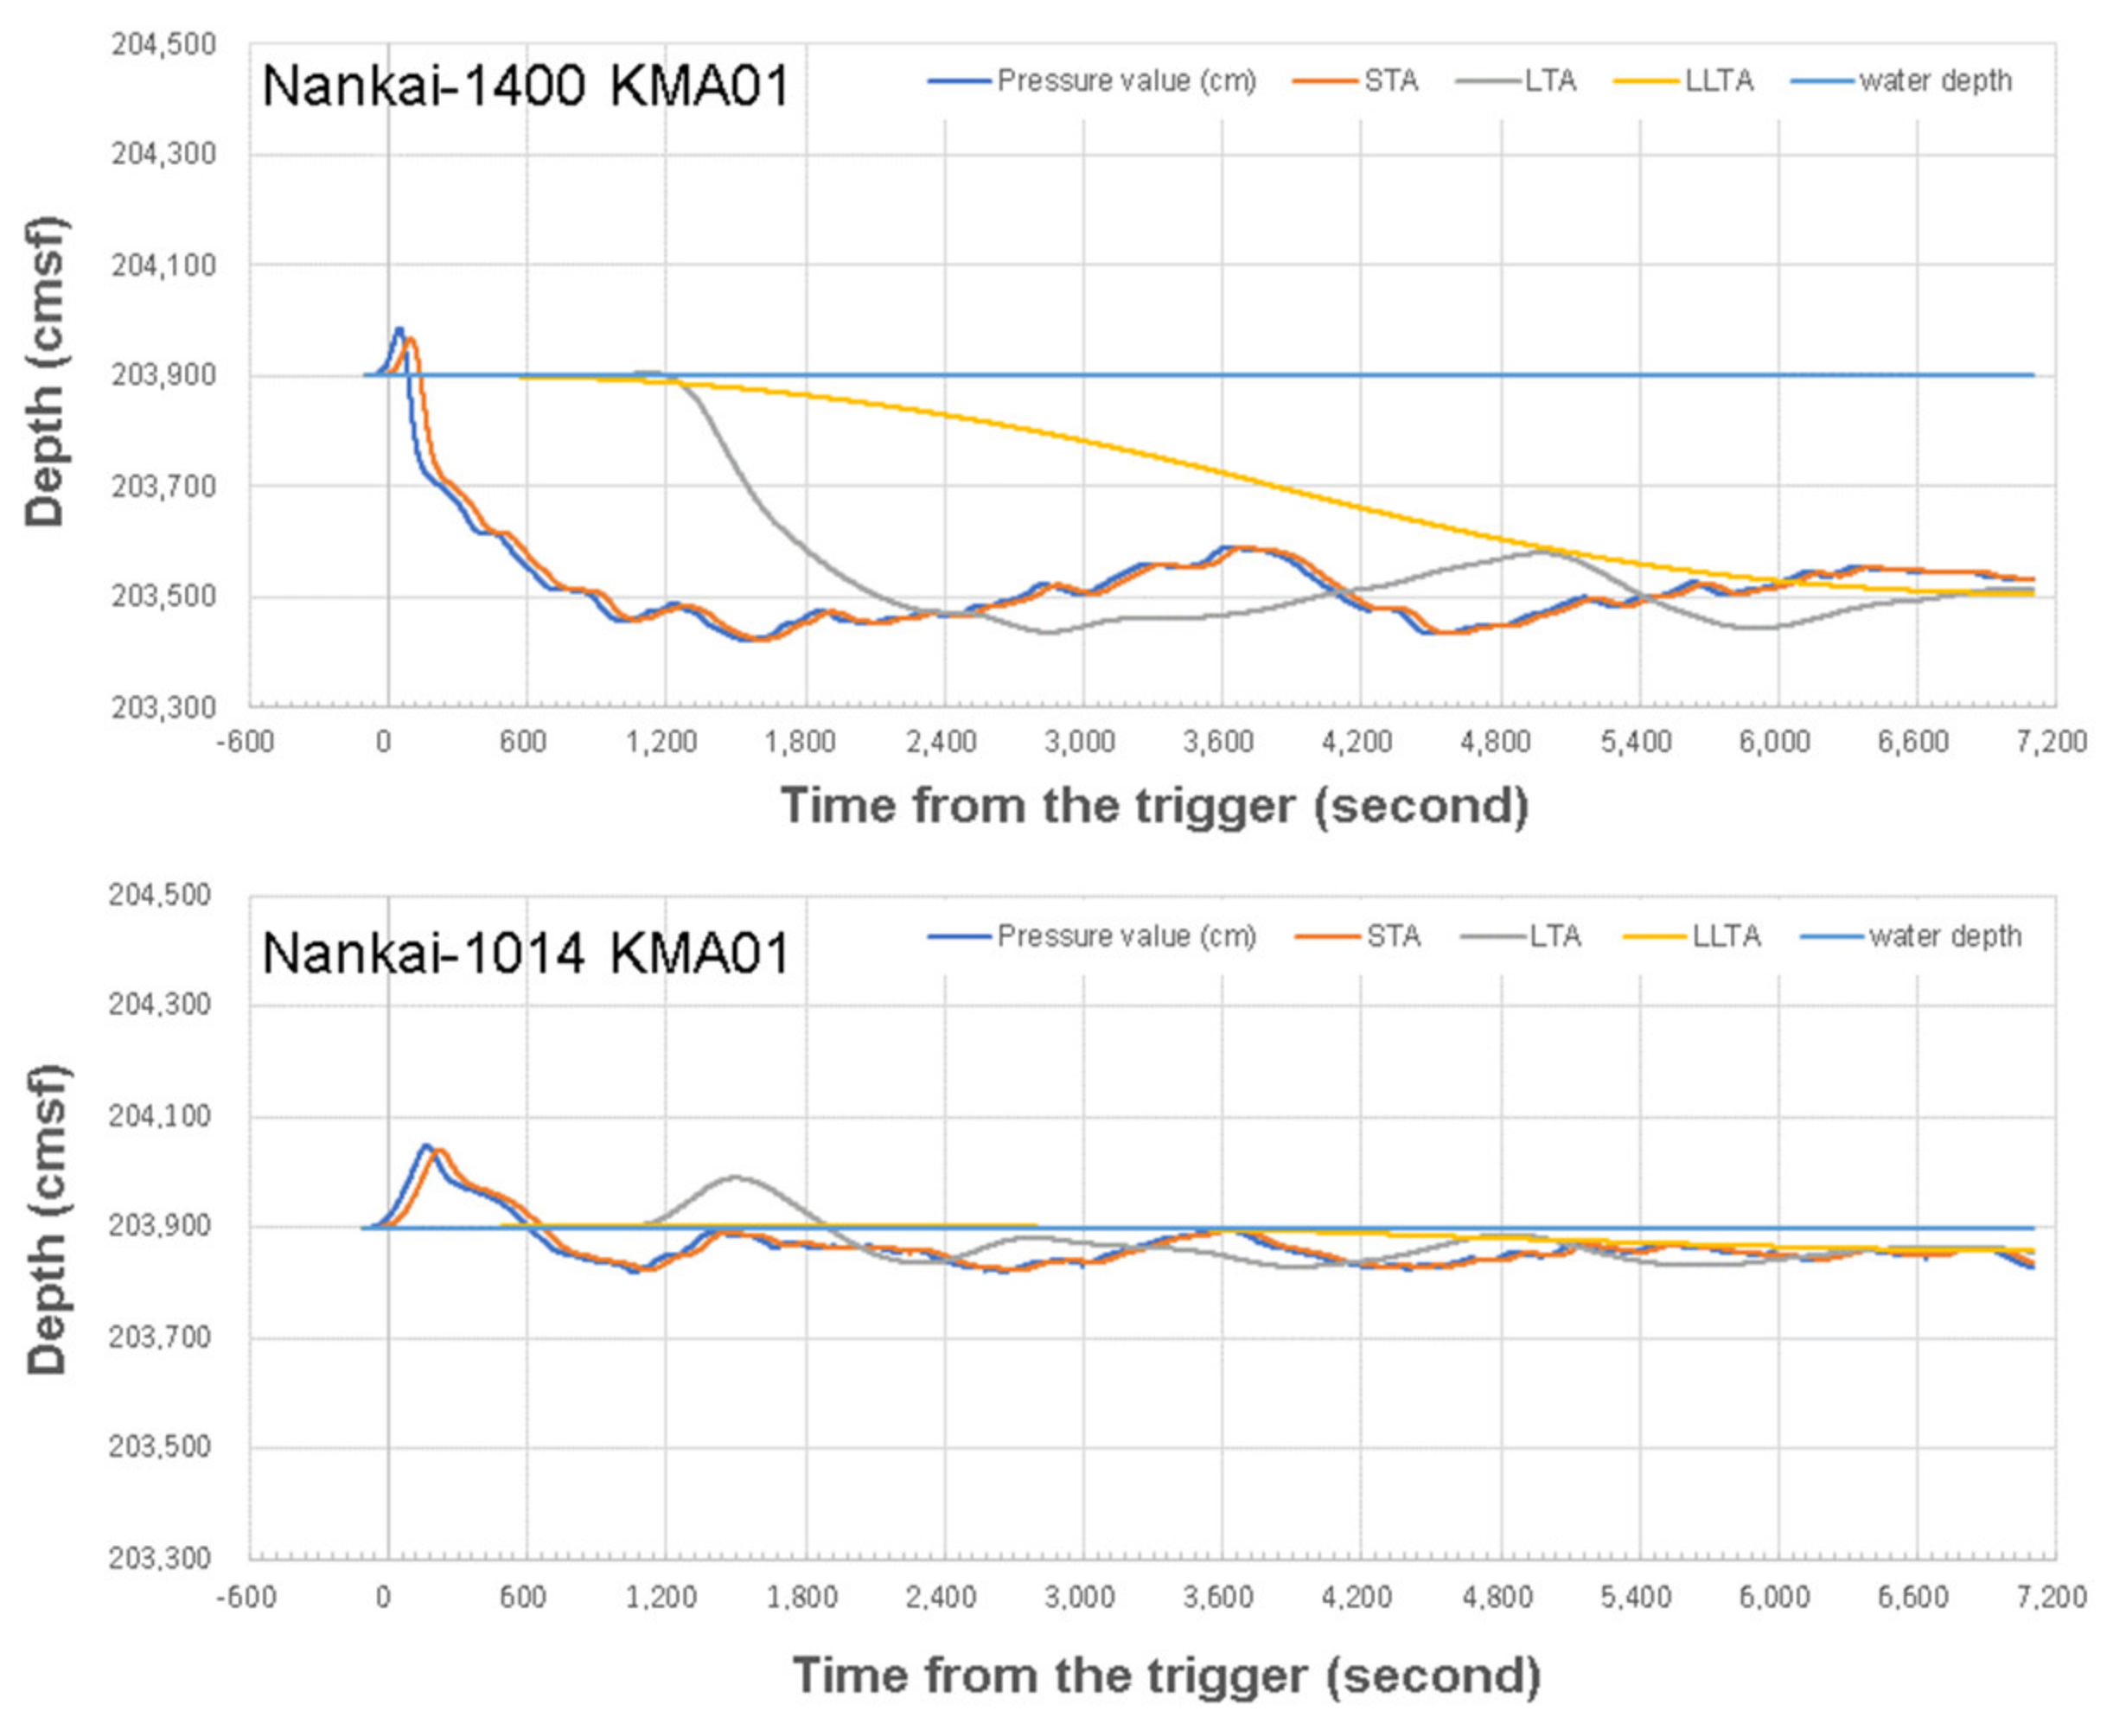
11]. Although no one can know the time interval between a pair of earthquakes, the prognostic system should predict the occurrence of earthquakes within a short time interval. It is difficult to distinguish between a tsunami component and a crustal uplift in real time. Our system, therefore, judges crustal uplift in real time using the ratio of the VLTA to the STA (
Figure 7). After detection of the first tsunami, the arrival time of the tsunami at each ocean floor observatory is evaluated. If tsunami convergence is detected, the trigger flag is down, and checking of the tsunami trigger is initiated. The time of tsunami arrival depends on the VLTA. The tsunami height observed on the pressure gauge is a value relative to the height at the time of tsunami detection. The base of the pressure gauge is, therefore, reset after detection of the arrival of the tsunami.
2.5. Processing for Input Data
To ensure the accuracy of the predictions, we adopted the logic and steps described in
Section 2.4; however, the quality of the real-time data was also one of the issues to be considered. Offsets and noise with frequencies similar to those of a tsunami may cause errors in the predictions. Therefore, it is necessary to identify as many kinds of noise as possible and reduce their effects in real time.
The signals to be reduced include tides, strong earthquake motions, and changes in the position of the pressure gauge. In addition, data missing because of troubles in data transmission and noise spikes caused by resets of the ocean floor network system are possible. The system considers a certain percentage of missing data to be not unusual but does not use the data if the percentage is higher. The S-net sometimes includes conspicuous noise with a frequency similar to that of a tsunami. The cause may be rotation and pitching of the seafloor observatory caused by strong underwater movement.
To reduce the effect of high-frequency signals like strong motion recorded in the pressure data, we apply a moving average technique twice using a multi-time window [
25]. We currently set the STA, LTA, and VLTA window widths to 50 s, 300 s, and 1 hour, respectively. After removing the tidal signal using the ocean tidal model [
26], our system calculates three types of moving averages real time. To record that a tsunami has been triggered, we use the ratio of STA to LTA [
9]. This technique can reduce the effects of background noise. In addition, we introduce a temporal gap between the STA and LTA to trigger the first arrival of a tsunami as precisely as possible. The effects on problems caused by missing data and spikes of noise are automatically removed by this system.
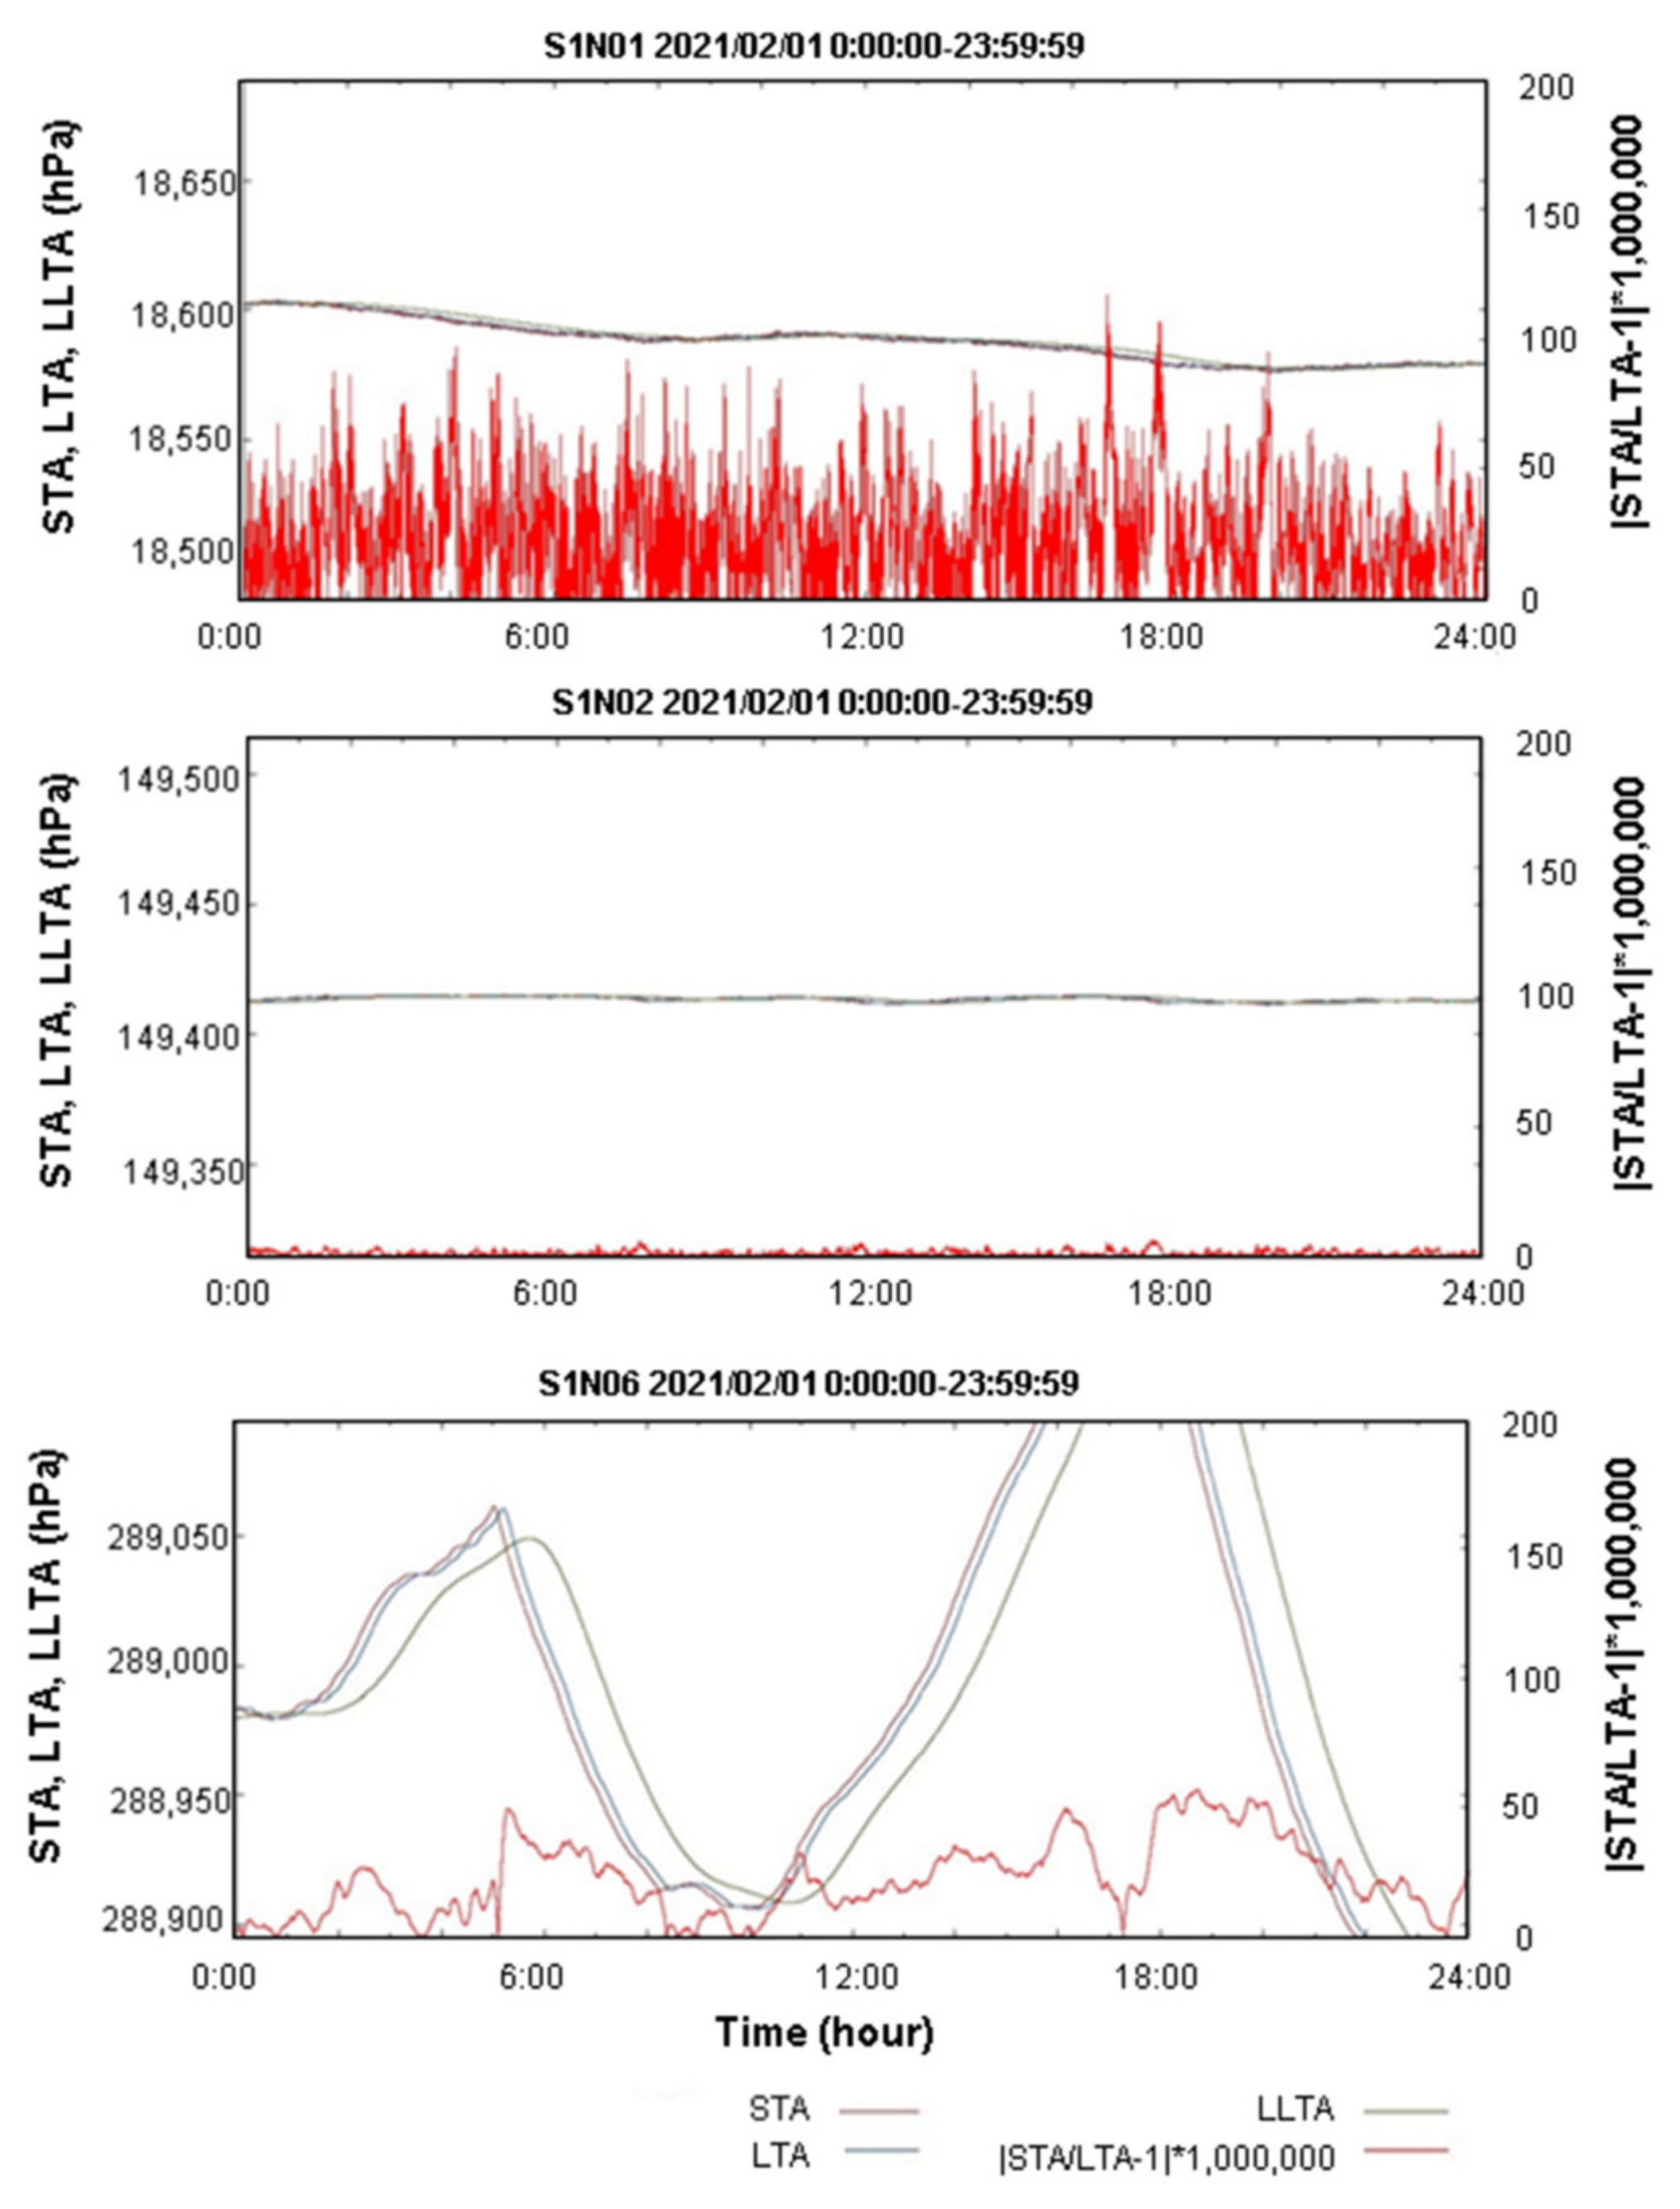
It is important to recognize background noise. In particular, a shallow region of approximately a few hundred meters includes much noise, and the frequency of the noise at some observatories is lower than background noise observed at deeper sites (
Figure 8). The effect of triggering by such noise can be restricted by using the ratio of the STA to the LTA, although such noise cannot be completely suppressed. We investigated background noise in advance, and we set the threshold level and the window width for calculating the moving average so that the noise issues were satisfactorily mitigated. The temporal gaps between the trigger times and the first arrivals of tsunami waves achieved by using different threshold levels at the different ocean floor observatories were correlated after triggering.
Noise with a frequency similar to that of a tsunami caused by rotation and pitching of in-line observatories like the S-net cannot be removed at the moment of triggering. In this system, a tsunami is considered to have been triggered if the value of a pressure gauge is a few times larger than the values of gauges at the other observatories around it. The 2021 earthquake off Fukushima-ken (13 March 2021, 23:08 JST; M7.3) did not cause a tsunami, but pressure gauges of 11 observatories (S2N01, S2N02, S2N03, N2S04, S2N10, S2N11, S2N12, S2N13, S2N14, S2N15, and S2N16) were triggered. Such noise was apparent at observatories less than ~100 km from the epicenter. However, there were no signals like a tsunami at the S-net observatories we installed off Chiba Prefecture. In such a case, the tsunami trigger can disappear after a short time because the system judges no tsunami propagation towards Chiba Prefecture.
3. Implementation of the Prediction System
3.1. System Specification
We considered that the system should be basically simple. The main tasks of the prediction system are receipt of data, management of the database, production of tsunami prediction data, and visualization. One server handles all these tasks (
Figure 9). If local governments and companies are users of the system, the cost of implementation needs to be low. In Japan, users have to obtain permission from the JMA to transmit predicted tsunami information to other organizations. We consider that the task burden and database should be as small as possible. For this reason, we reduced the number of fault models as described in
Section 2.3. Many users can connect to the server installed in our tsunami prediction application as clients using a PC.
We included many mechanisms to avoid various types of problems. For example, the 2011 earthquake off Tohoku cut some seafloor transmission cables off the Boso area. If the backbone cables had been cut on the seafloor, it would have been difficult to continue to predict tsunamis. Users should know the condition of the ocean floor network system in real time. Therefore, we prepared a monitoring system of seismometers and pressure gauges to detect waveforms in real time. We have asked users to check waveforms in real time when earthquakes and tsunamis are triggered.
How the predicted information is distributed can also be controlled. Some users want to control it using the JMA tsunami warning system, so such a switch has been installed in our system. Users may sometimes want to use their mobile devices to inform residents along a coastal area that a tsunami is coming. The system can be expanded to incorporate a variety of inputs that control the distribution of data and to output data to many types of devices.
The topography around the predicted point of landfall can be changed by construction projects, such as the replacement of breakwaters, renovation of fishery ports, and introduction of tetrapods to prevent erosion by ocean currents. In such cases, part of the tsunami database should be updated to maintain its accuracy. The prefecture can collect such construction information, and the prefecture itself can replace the database by recalculating the tsunami waveforms. Easy updating of the tsunami database is also one of the issues to be taken into consideration.
We have already implemented this system for some organizations. Many of them have prepared two systems to ensure redundancy. For example, some organizations use one of them for real-time prediction and the other for evacuation drills. We have prepared an option for evacuation drills that enables users to send calculated waveforms for seafloor observatories and the predicted points of landfall to the system as real-time input data. Users can select arbitrary waveforms using many fault models, for example, the Nankai fault models with M9 [
23].
3.2. Visualization
One of the practical applications of this system is the use of predictions by municipalities to protect coastal residents from disasters by using the system prefecture construct. The most important issue is the ability of an untrained person to visualize the impact of a tsunami on the display. On the map of the inundation area, there is a control window to select the location to be visualized, lists of arrival times and heights, and propagation of the tsunami with bar graphs of real-time pressure gauges and calculated waveforms of the predicted point are shown at the same time. Once the seafloor observatories detect that a tsunami has been triggered, the prediction is started. The inundation area is extended if the tsunami is propagating from a region near the Nankai Trough. The interval between successive predictions on the display depends on the model distribution in the database, but the prediction information itself is produced at an interval of one second.
The topography, including any construction on land, is represented using data gridded at 10 m intervals, and users can choose to zoom in. The conditions of the evacuation locations and key facilities such as municipalities are confirmed after the inundation. The ability of national roads to play a role as emergency routes can also be confirmed. If such facilities are in the inundation area, they are at risk of being isolated. Even if the depth of inundation is relatively shallow, the facilities may be surrounded by tsunami debris and fires. Prefectures and municipalities can grasp the situation in each area and identify locations that require help and support.
4. Summary
We have described the characteristics and logistics of our tsunami prediction system that uses ocean floor network systems like DONET and S-net for local regions and communities. It is important that the prediction logic and its implementation consider the situation of ocean floor observation in real-time including the noise and the needs of the end-users. Based on the logic described in Baba et al. (2014) [
14], we started to develop the system in 2012 and have improved it in collaboration with local governments, an infrastructure company, and Kagawa University.
The metrics to be predicted are tsunami arrival time, tsunami height, and tsunami inundation area, including the depth of inundation. We have taken steps to improve the accuracy of the tsunami prediction in real time and to achieve stable implementation by preventing contamination of real-time data by noise. To enable users to grasp the status of the tsunami, the propagation of the tsunami in offshore waters, and the continuation of the tsunami at each predicted point of landfall are also monitored. In the future, we will develop the model by introducing diversity related to the tsunami to easily visualize the disaster directly.

