Article

Quantitative Proteome Analysis in Response to Glucose Concentration in C2C12 Myotubes

1
Department of Nutritional Physiology, Institute of Medical Nutrition, Tokushima University Graduate School, 3-18-15 Kuramoto-cho, Tokushima 770-8503, Japan
2
Department of Orthopedics, Institute of Medical Biosciences, Tokushima University Graduate School, Tokushima 770-8503, Japan
3
Department of Urology, Tokushima University Graduate School of Biomedical Sciences, Tokushima 770-8503, Japan
*
Author to whom correspondence should be addressed.
Appl. Sci. 2022, 12(3), 1553; https://doi.org/10.3390/app12031553
Submission received: 30 December 2021 / Revised: 25 January 2022 / Accepted: 28 January 2022 / Published: 31 January 2022
(This article belongs to the Special Issue Advances in Skeletal Muscle)

Abstract

:
Glucose is important for the maintenance of muscle function; however, it is still unclear how changes in glucose concentration affect muscle. Here, we analyzed the effect of glucose concentration on protein expression under different glucose concentration media in C2C12 myotubes. First, we performed proteome analysis in C2C12 myotubes cultured in Low (1.0 g/L), Medium (2.0 g/L), and High (4.5 g/L) glucose media. Proteome analysis revealed 113 proteins were significantly changed in group cultured in Low or Medium glucose media compared to group cultured in High glucose media. Furthermore, glycolysis, oxidative phosphorylation, and fatty acid metabolism were increased in the Medium and Low groups. Among these pathways, HK2, PFKP, NDUFA11, and FABP3 were especially upregulated proteins in Low and Medium groups. In this context, ATP production in C2C12 myotubes cultured in Low and Medium glucose media was increased. There was no significant change in myotubes morphology and myogenic differentiation factors in all groups. Finally, we examined the effect on glucose concentration in culture media on myosin isoforms expression by qRT-PCR. As a result, Myh2 and Myh4 were significantly increased in Low and Medium conditions. Altogether, Low and Medium glucose conditions induced Myh expression probably via enhancement glucose utilization.

1. Introduction

Muscle fibers that make up skeletal muscle are composed of slow muscle fibers, which are rich in mitochondria and predominate in aerobic energy production pathways, and fast muscle fibers (or intermediate types), which predominate in anaerobic energy production pathways [1]. Therefore, energy metabolism and muscle fiber type are closely related. It is also well known that skeletal muscle changes its metabolic properties in response to changes in the systemic environment [2,3]. However, the mechanism that coordinates metabolic changes with muscle status remains unclear.
Glucose is one of the essential nutrients for living organisms, and it plays a particularly important role in energy production. Glucose is metabolized via glycolytic pathway to ATP and pyruvate, a substrate of the TCA cycle for more efficient ATP production. Although skeletal muscle is a major organ that metabolizes glucose, reduction in muscle mass and function cause disruption of glucose metabolism, result in the risk of developing type-2 diabetes [4,5]. Therefore, maintenance of muscle mass and function may be important for maintaining glucose metabolism.
In cultured cell lines, some research reported that glucose concentration in culture media affects muscle metabolism and morphology. Recently, Meng et al. reported that C2C12 myotubes themselves have a mechanism that senses a decrease in extracellular glucose concentration via the Baf60c-Deptor-AKT signaling pathway and increases glucose uptake from extracellular sources [6]. Furthermore, in C2C12 cells cultured in DMEM with Low glucose (1.0 g/L) or High glucose (4.5 g/L), which are commonly used for culture, mitochondria-mediated energy production was activated in cells cultured in Low glucose media compared to High glucose media [7]. In another study, the expression of GLUT1, which is responsible for glucose uptake into cells, and hexokinase II, a rate-limiting enzyme in the glycolytic system, was upregulated in C2C12 cells cultured in DMEM with Low glucose media [8]. In addition, the proliferative activity of muscle satellite cells, which plays a central role in muscle regeneration, was higher when cultured in glucose-free media than in High glucose media, suggesting that the High concentration of glucose in the culture media has a negative effect on muscle [9]. In other cell line, HT-29 cells cultured with Low glucose media showed increased mitochondrial respiratory activity and decreased lipid levels compared to those cultured with High glucose media, suggesting that Low glucose media enhances mitochondrial respiratory capacity [10].
Although these findings suggest the importance of glucose concentration in muscle, it remains unclear how glucose concentration affects muscle metabolism. To clarify this relationship, we tested C2C12 cells cultured in DMEM with High (4.5 g/L), Medium (2.0 g/L), and Low (1.0 g/L) concentrations.

2. Materials and Methods

2.1. Cell Culture

C2C12 myoblasts were cultured in Dulbecco’s modified Eagle’s medium (DMEM, Sigma, St. Louis, MO, USA) containing 10% fetal bovine serum (10099-141, Thermo Fischer Scientific, Waltham, MA, USA) and 1% penicillin–streptomycin mixture (26253-84, Nacalai Tesque, Kyoto, Japan) at three different glucose concentrations [1.0 g/L (Low), 2.0 g/L (Medium), and 4.5 g/L (High)] in a 5% CO2 atmosphere at 37 °C. After culturing to 100% confluence, the cells were cultured in DMEM containing 2% horse serum (16050-122, Thermo Fischer Scientific, Waltham, MA, USA) with different glucose concentrations to differentiate into myotubular cells. The differentiation media was changed every 2 days.

2.2. Proteomics

Myotubes at 5 days post-differentiation were washed with Hepes–Saline buffer [20 mM Hepes-NaOH (pH 7.5), 137 mM NaCl], and cells were lysed in guanidine hydrochloric acid buffer [6 M guanidine hydrochloride, 100 mM Tris-HCl (pH 8.0), 2 mM DTT]. Proteins were digested with Trypsin/Lys-C mix (Promega, Madison, WI, USA) at 37 °C overnight. Then, LC-MS/MS analysis of the resultant peptides (200 ng each) was conducted on an EASY-nLC 1200 UHPLC connected to a Q Exactive Plus mass spectrometer through a nanoelectrospray ion source (Thermo Fisher Scientific). The peptides were separated on a 75 µm inner diameter 120 mm C18 reversed-phase column (Nikkyo Technos, Tokyo, Japan) with a linear gradient from 4 to 28% acetonitrile for 0–150 min followed by an increase to 80% acetonitrile during min 150–170. The mass spectrometer was performed in a data-dependent acquisition mode with a top 10 MS/MS method. Raw data were analyzed directly against the SwissProt database restricted to Mus musculus using Proteome Discoverer, version 2.2 (Thermo Fisher Scientific) for identification and label-free precursor ion quantification. Normalization was performed in such a way that the total sum of abundance values for each sample over all peptides was the same [11]. We detected a total of 4099 proteins with LC-MS/MS analysis. Of the 4099 proteins, conditiona with “Protein FDR Confidence” value of High and “Peptides” value of 2 or more were extracted, then 3157 proteins were analyzed. Principal component analysis was performed with Python sklearn.decomposition library. Differentially expressed proteins were determined by an exact test after normalization. Hierarchical clustering of 113 differentially expressed proteins was performed by Python seaborn library. Pathway analysis was performed by using DAVID Bioinformatics Resources [12,13]. To visualize the results of proteomics, we analyzed the proteomics of C2C12 myotubes under High, Medium, and Low glucose conditions by IPA.

2.3. ATP Measurement

ATP concentration was measured by CellTiter-Glo 2.0 Cell Viability Assay (G9241, Promega, Madison, WI, USA) accodring to manufacuturer’s instruction. Myotubes at 5 days post-differentiation were equilibrated at room temperature for 30 min, and the same volume of CellTiter-Glo 2.0 Reagent as the culture media was added and incubated at room temperature for 10 min. The contents were then transferred to 1.5 mL microtubes and the luminescence was measured using a tube-based luminometer (Glomax 20/20 Luminometer, Promega, Madison, WI, USA).

2.4. Quantitative Real-Time PCR Analysis (qRT-PCR)

Myotubes at 3 or 5 days post-differentiation were lysed by ISOGEN Reagent (319-90211, Nippon Gene, Tokyo, Japan), mixed vigorously with chloroform, allowed to stand at room temperature for 3 min, and centrifuged at 12,000 rpm for 15 min at 4 °C. The supernatant was purified by isopropanol precipitation and 80% ethanol precipitation. The resulting precipitate was dissolved in DEPC-treated water to obtain RNA. Then, 1 µg of RNA was added to 10 µM Oligo dT Primer (Thermo Fisher Science, Waltham, MA, USA) and 10 µM Random Primer (Thermo Fisher Science, Waltham, MA, USA), heated at 70 °C for 5 min, and cooled at 4 °C for 5 min. The mixture was heated at 70 °C for 5 min and cooled at 4 °C for 5 min. Then, M-MLV Reverse Transcriptase (Promega, Madison, WI, USA), 2.5 mM dNTP MIX (Promega, Madison, WI, USA), and M-MLV RT 5X Buffer (Promega, Madison, WI, USA) were added, and the reaction was carried out at 42 °C for 1 h and at 95 °C for 5 min to prepare cDNA. The prepared cDNA was subjected to qRT-PCR using the ABI7300 real-time PCR system (Applied Biosystems, Waltham, MA, USA) with Power SYBR Green Master Mix (Thermo Fisher Science, Waltham, MA, USA). The primer sequences used are shown in Table 1. 18S rRNA was used as the internal control.

2.5. Statistical Analysis

All graphs represent mean values ± standard error. One-way ANOVA were used for three groups, and multiple comparison tests using the Tukey–Kramer method were performed as a subtest, with p < 0.05 being considered a significant difference. Statistical analysis were performed using Excel Statistics ver. 7.0 (Social Information System).

3. Results

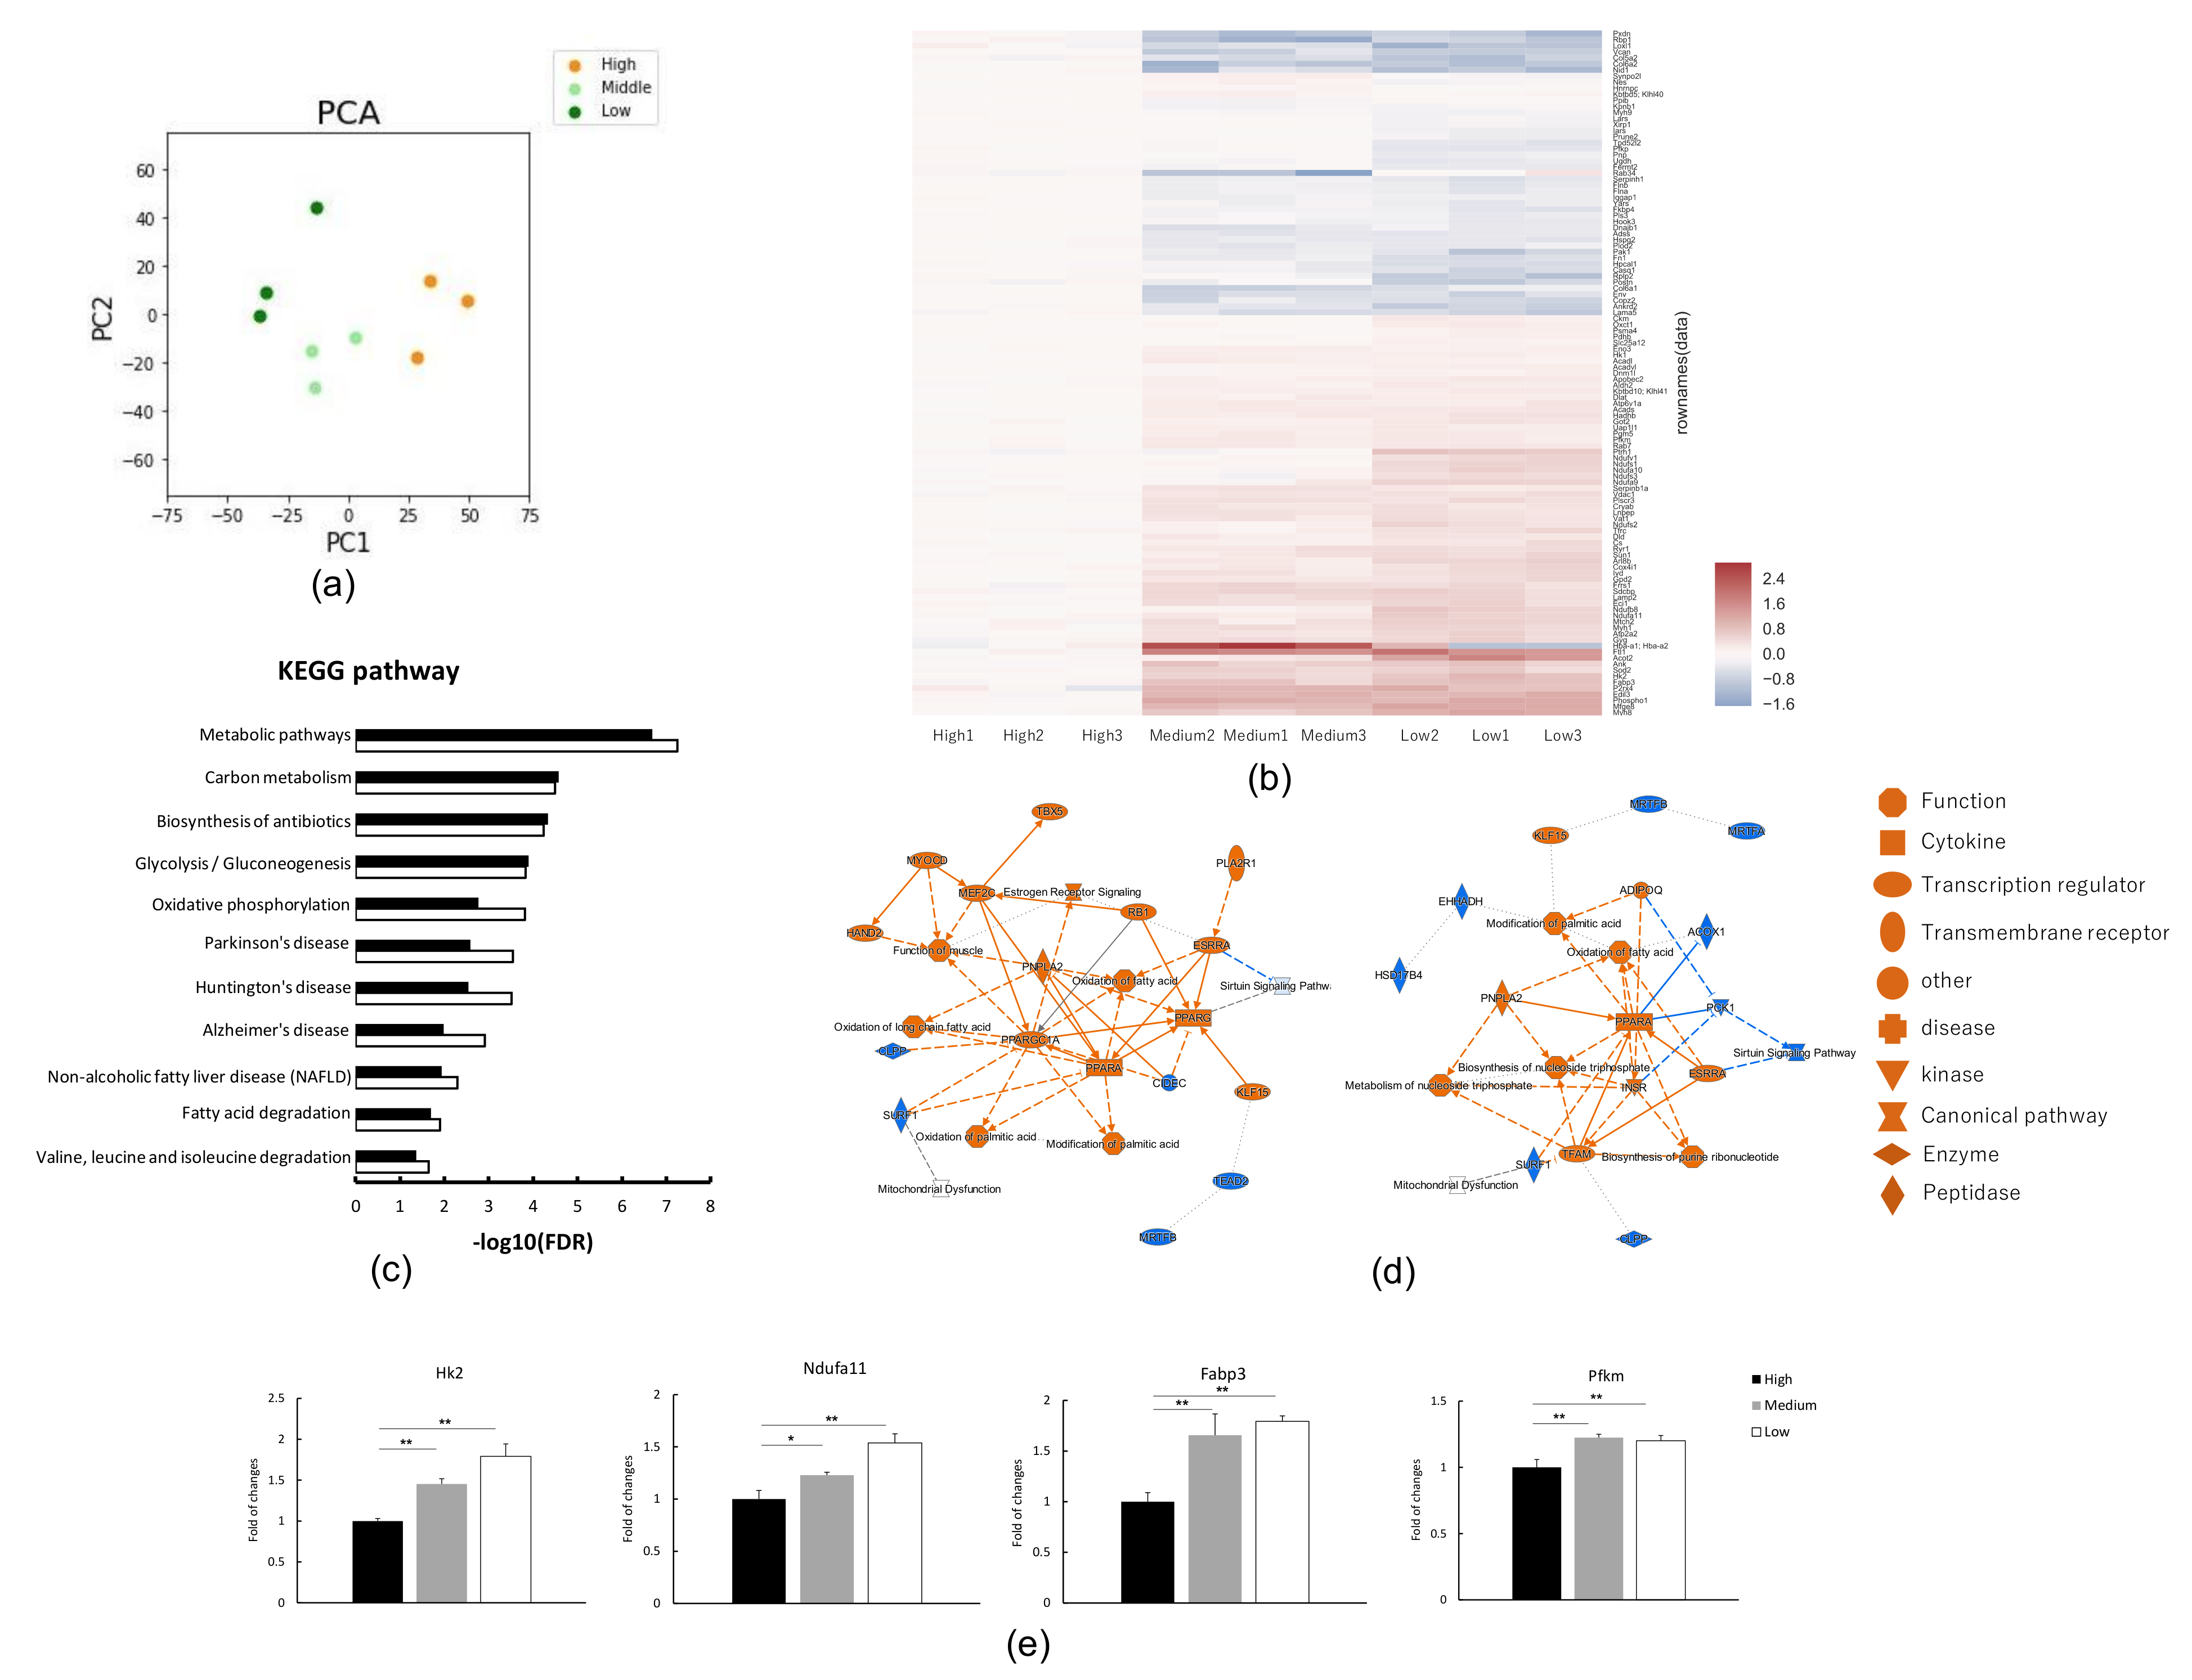
3.1. Proteome Analysis in C2C12 Myotubes under Low, Medium or High Glucose Conditions

C2C12 myotubes were cultured in Low (1.0 g/L), Medium (2.0 g/L), and High (4.5 g/L) glucose media. At 5 days post-differentiation, proteome analysis was performed to examine the intracellular dynamics of the C2C12 myotubes at different glucose concentrations in the culture media (Table S1). Principal component analysis (PCA) revealed three clusters of High, Medium, and Low groups (Figure 1a). The contribution ratio of PC1 and PC2 are 0.27 and 0.14, respectively. The p-value was corrected by empirical Bayes method. In total, 113 proteins were identified as differentially expressed proteins with statistical significance (q < 0.05) and were classified by their expression patterns into two major groups (Figure 1b). Compared with High, Low and Medium showed similar protein expression patterns. Comparison between Low and Medium did not show any statistically significant difference. The differentially expressed proteins were analyzed by KEGG pathway and IPA analysis (Figure 1c,d). The KEGG and IPA results showed that glycolysis, oxidative phosphorylation, and fatty acid metabolism were increased in the Medium and Low groups compared to the High group. It is noted that PPARGC1A was suggested as an upstream regulator in Medium condition (Figure 1d). Specifically, in the Medium and Low groups, the glycolytic pathways included hexokinase 2 (HK2), which catalyzes the reaction of glucose-to-glucose hexaphosphate, and phosphofructokinase (PFKP), which catalyzes the reaction of fructose hexaphosphate to fructose 1,6-bisphosphate was increased (Figure 1e). Moreover, the expression of NDUFA11, a subunit of mitochondrial complex 1 of the electron transport system [14], and the expression of FABP3, which is involved in the intracellular transport of fatty acids [15], were also increased (Figure 1e). Proteome analyses suggested that Low or Medium glucose media induces the metabolic change.

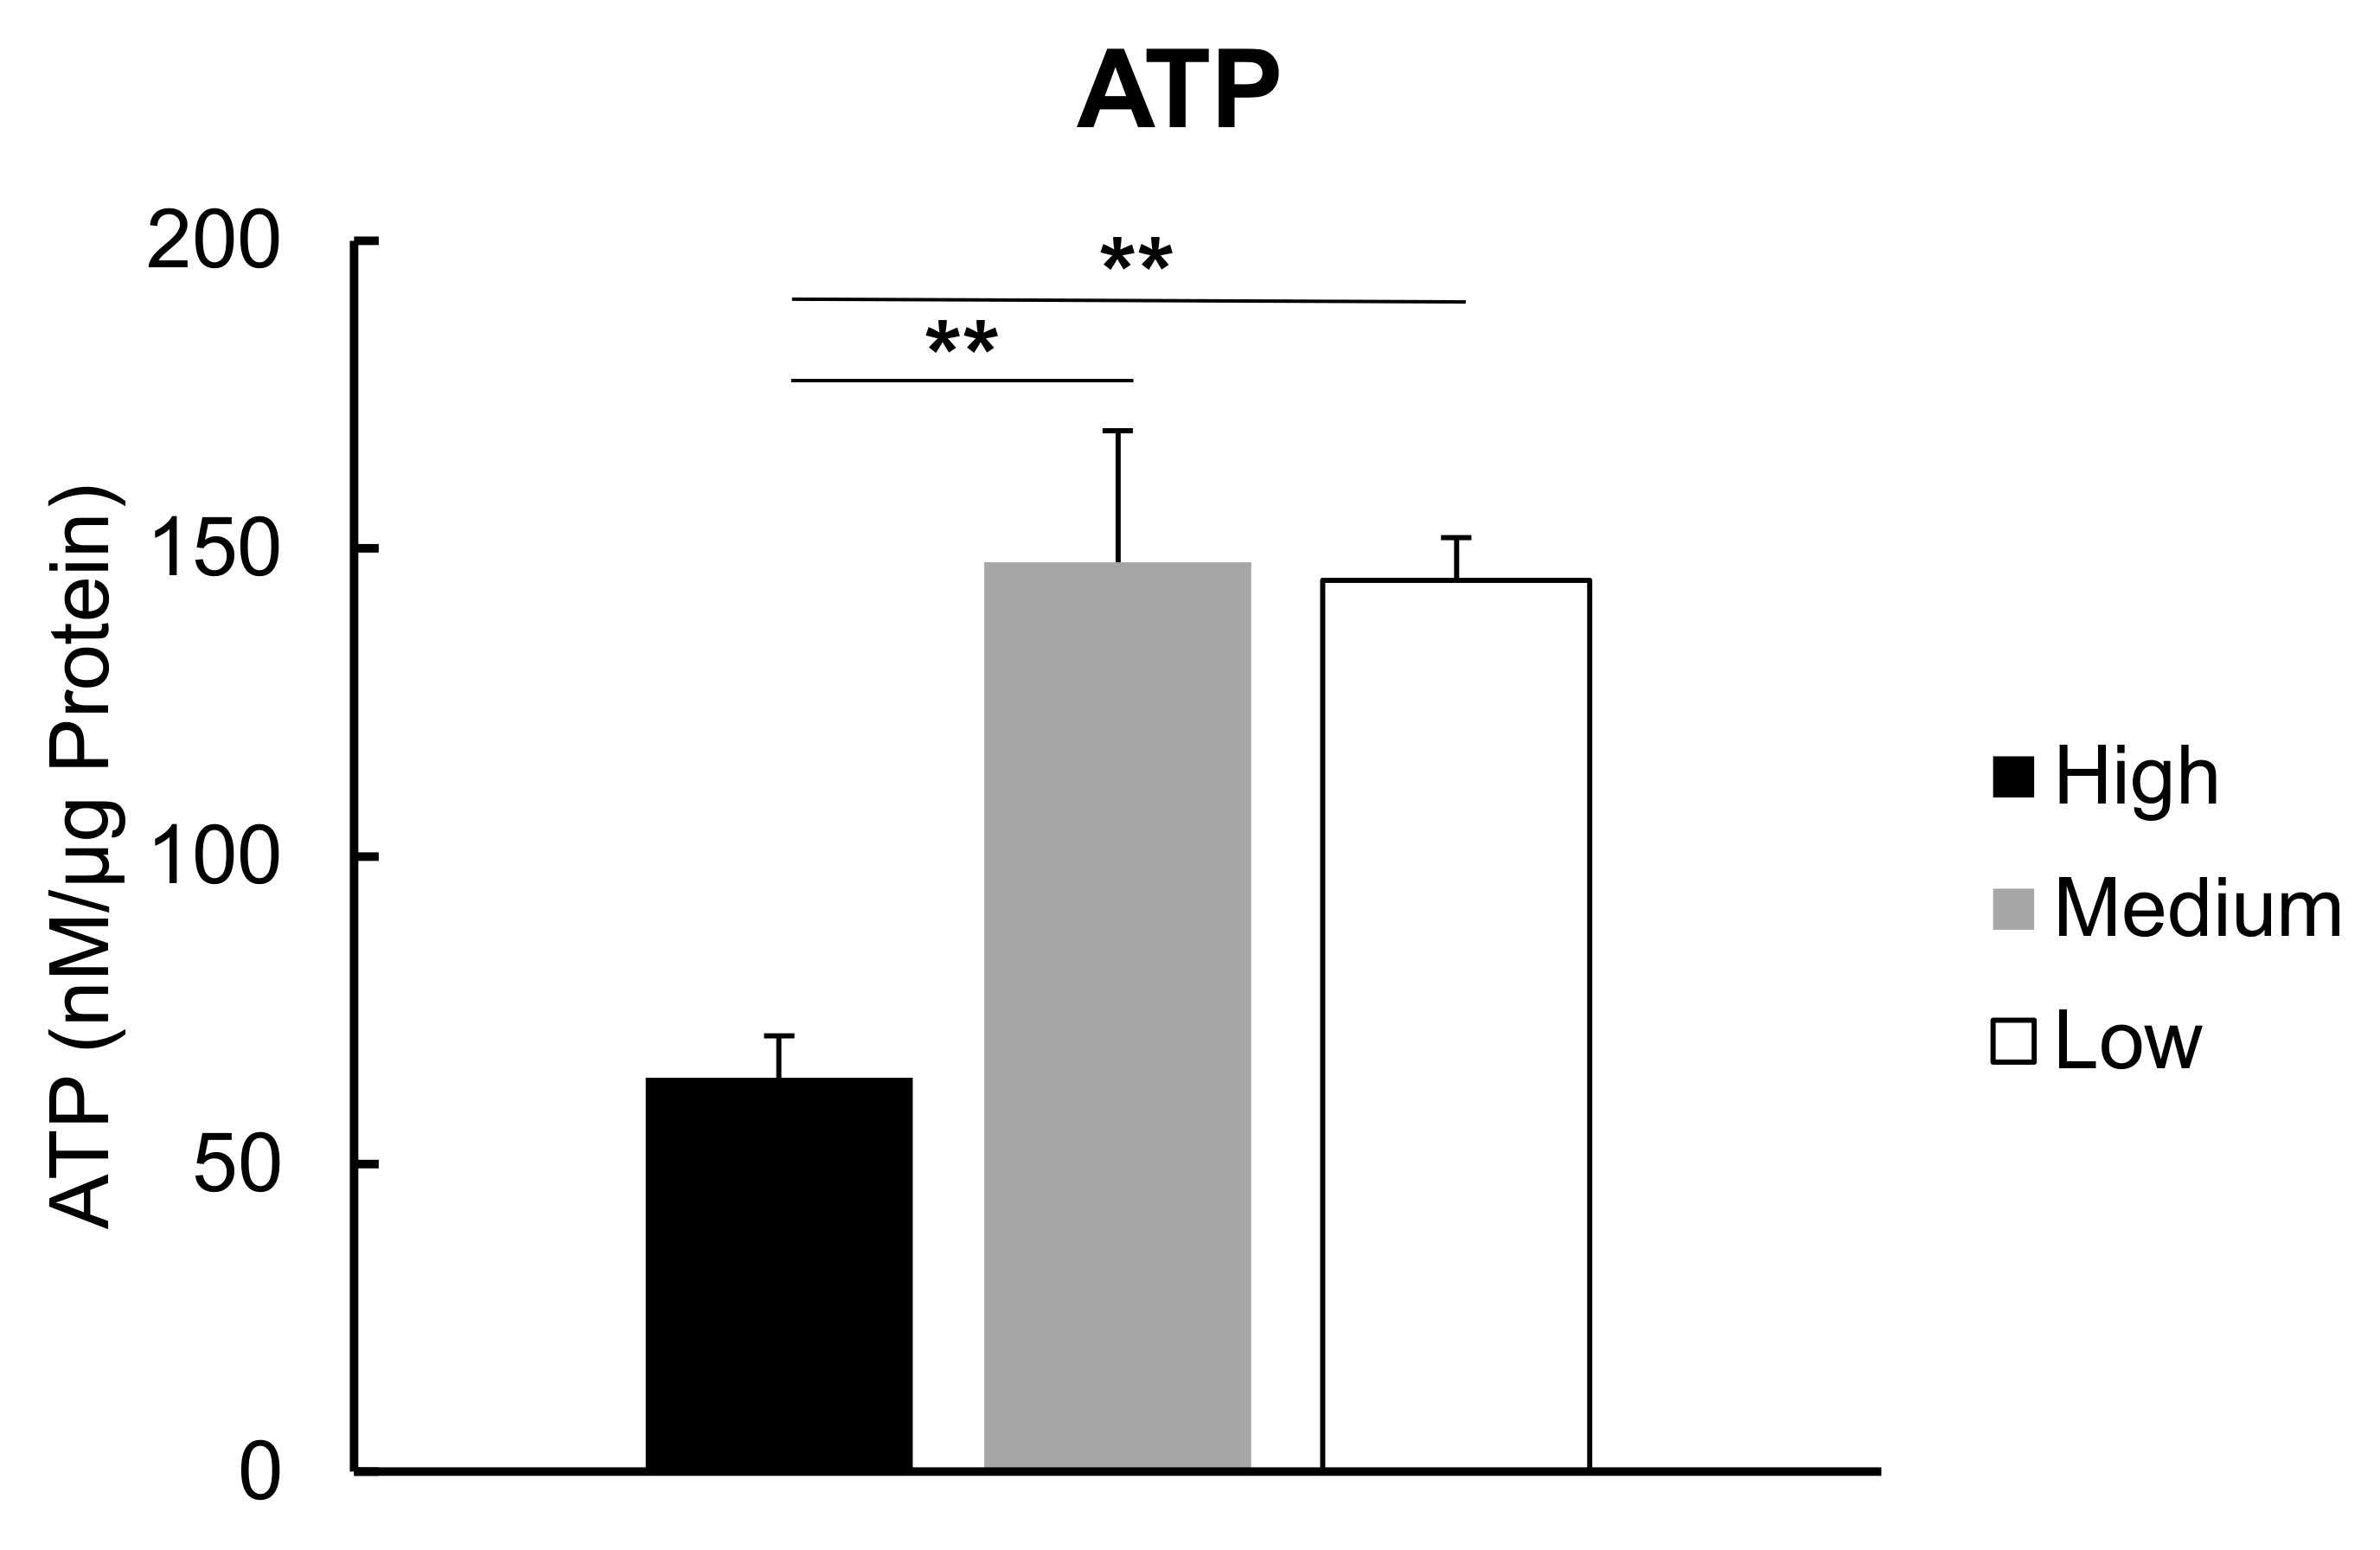
3.2. ATP Levels in C2C12 Myotubes under Low, Medium or High Glucose Conditions

To evaluate the metabolic impact of the glucose concentration in the culture media on energy metabolism, ATP levels were determined in C2C12 myotubes cultured in Low (1.0 g/L), Medium (2.0 g/L), and High (4.5 g/L) glucose media (Figure 2). The results showed that ATP levels were significantly increased in the Low and Medium groups compared to the High group. This result clearly indicated that increased expression of proteins involving glycolysis, oxidative phosphorylation, and fatty acid oxidation positively contributes to cellular ATP metabolism.

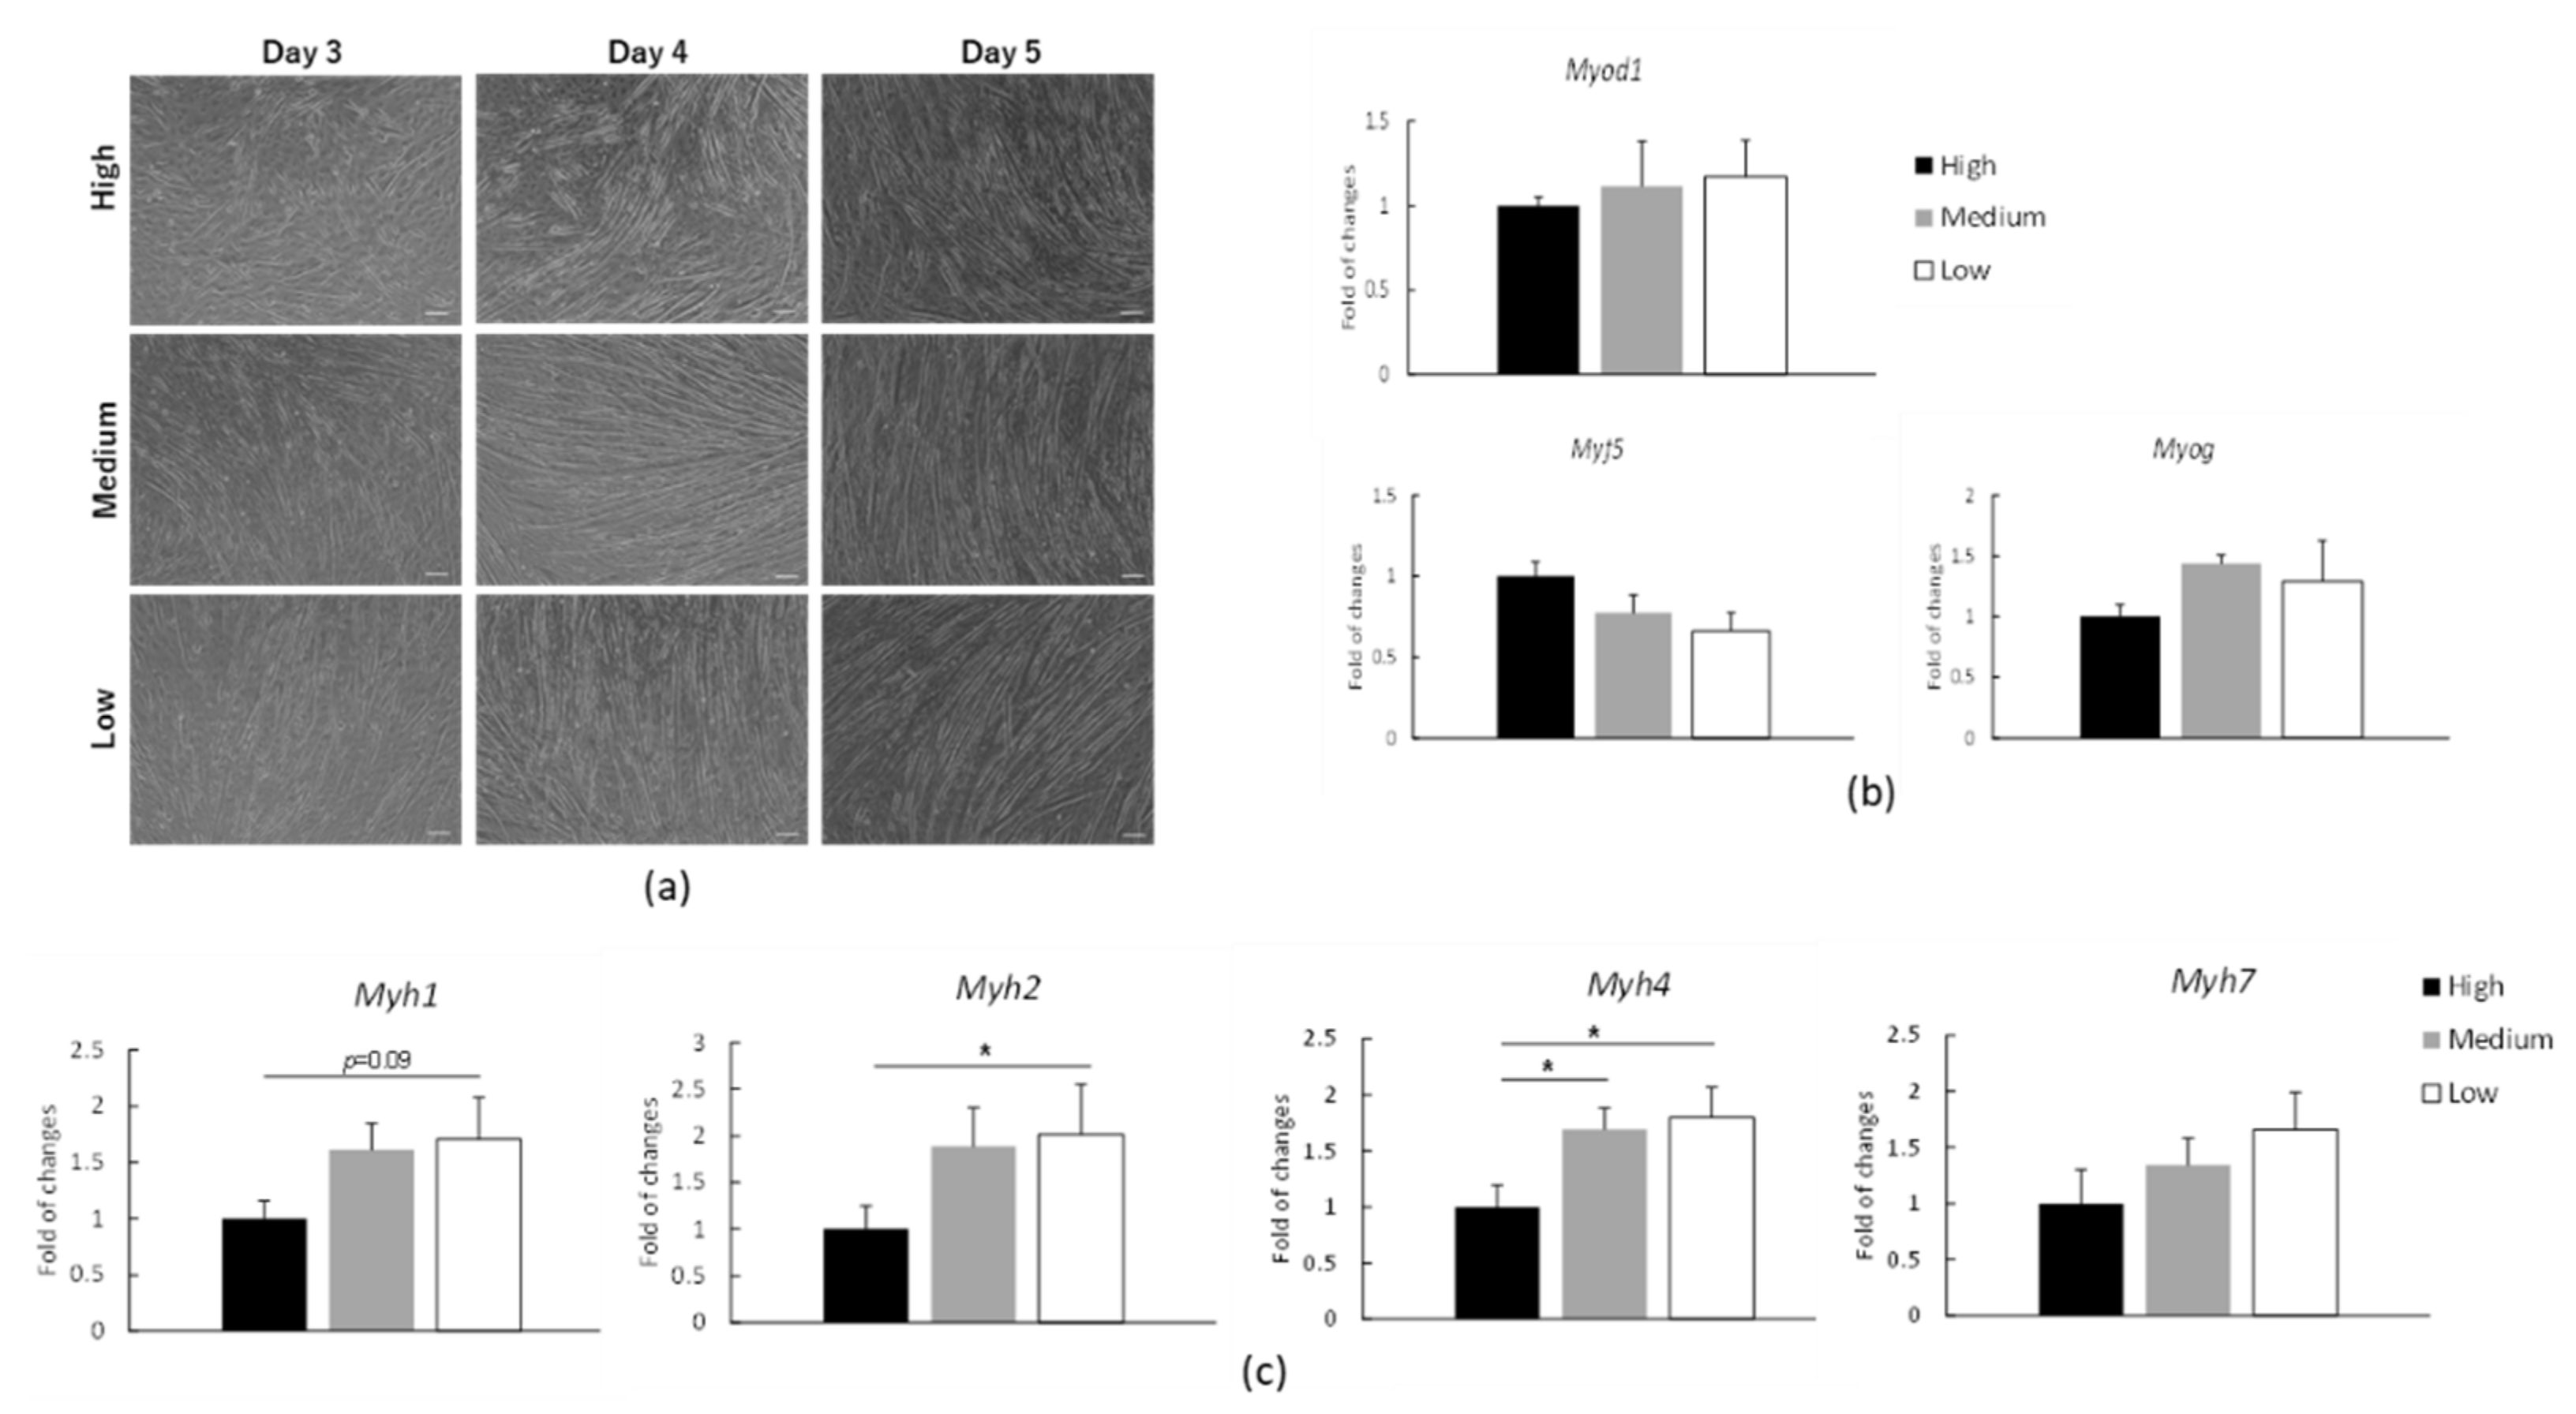
3.3. mRNA Expression of Myosin Heavy Chain (Myh) in C2C12 Myotubes under Low, Medium or High Glucose Conditions

Next, we examined the effects of glucose concentration in culture media on myotubes formation. First, we analyzed the morphology of C2C12 cells from 3 to 5 days post-differentiation using a phase-contrast microscope (Figure 3a). There was no significant change in myotubes formation in either group. To analyze the effects of glucose concentration on differentiation induction, transcriptomic changes of Myod1, Myog and Myf5, which are regulators of myogenic differentiation, were determined in myotubes at 3 days post-differentiation, and no significant changes were observed (Figure 3b).
Myofibers consist of slow and fast muscle fibers, which are classified by fiber type specific Myh proteins, and muscle fiber types are also characterized by different metabolic properties: Myh7/MyHCI, slow-oxidative; Myh2/MyHCIIA, fast-oxidative; Myh1/MyHCIIX, fast-glycolytic; Myh4/MyHCIIB fast-glycolytic [1]. Our proteome analysis revealed that Myh1/MyHCIIX and Myh8/MyHC perinatal were identified as differentially expressed proteins, which are increased in Low and Medium conditions compared with High condition (Figure 1c). To analyze the myosin composition under induced metabolic changes, the expression levels of each myosin isoform at 5 days post-differentiation were confirmed by qRT-PCR (Figure 3c). Myh2 and Myh4 were significantly upregulated in Low and Medium conditions compared with High condition. Myh1 isoform in the Low and Medium groups also showed an increased trend compared to the High group (p = 0.09). These results indicate that growth of C2C12 myocytes at Low and Medium glucose concentrations in culture media result in tendency to increase in myosin isoforms at transcriptional level.

4. Discussion

In this study, we clarified global protein levels under different glucose concentration media using proteome analysis. Low or Medium glucose media increased proteins involving glycolytic system, oxidative phosphorylation, and fatty acid metabolism. Consistent with the proteome observation, ATP contents were increased in myotubes under Low or Medium glucose media. Furthermore, culture in Low or Medium glucose media resulted in an increase in fast and slow Myh genes at the mRNA expression and protein levels.
We identified HK2 and FABP3 in this study. HK2 is an enzyme that catalyzes the first reaction in the glycolysis, producing glucose-6-phosphate from glucose. Four isoforms, HK1-4, exist in mammals, and HK2 is localized at the outer mitochondrial membrane [16]. it has been reported that HK2 can attenuate cellular senescence by maintaining carbohydrate hypermetabolism [16]. Cellular senescence promotes the age-related decline of the skeletal muscular system [17]. Conversely, it has been reported that HK2 activity is upregulated and oxidative phosphorylation is enhanced by 12-week resistance training in young men [18]. In addition, overexpression of FABP3 induces translocation of GLUT4 and enhances glucose uptake in C2C12 myocytes [19]. Based on these reports, the enhancement of glycolysis could be achieved by HK2, PFKP, and FABP3 increased in Low/Medium glucose concentrations in the culture media. Furthermore, NDUFA11, whose expression was found to be upregulated by incubation at Low/Medium glucose concentrations in the present study, is one of the subunits of mitochondrial respiratory chain complex I [14]. Mitochondrial respiratory chain complexes are composed of complex I to V, and complex I is the first enzyme in the respiratory chain reaction [20]. Specifically, it oxidizes NADH produced in the Krebs cycle in the mitochondrial matrix and uses two electrons to reduce ubiquinone to ubiquinol, thereby aiding in the process of ATP production [20]. Defects in human respiratory chain complex I cause impaired energy generation [21]. Furthermore, restoring respiratory chain complex I in mice with mitochondrial myopathy improves their symptoms [22]. These reports supported that upregulated proteins in the proteome analysis are beneficial for muscle health and provide new insights into the relationship between energy metabolism and glucose conditions.
Mitochondria generate energy for cellular activities through ATP production via oxidative phosphorylation [23]. PGC-1α is known to be a factor that enhances the biosynthesis and activity of mitochondria [24] and predicted as an up-stream regulator by IPA analysis (Figure 1d). Therefore, one of the reasons that ATP production was increased in the Low and Medium groups was that the activity of mitochondria was enhanced by the increased expression of PGC-1α. In addition, PGC-1α is also known as a master regulator of slow type fiber genesis, and its decreased expression in the unloading condition contributes to slow muscle fiber-dominant degradation [25]. In mice overexpressing PGC-1α, phosphorylation of Akt1 was observed, accompanied by increased phosphorylation of FOXO3a [26]. FOXO3a is a ubiquitin ligase that is important in muscle atrophy. FOXO3a is a transcription factor that induces the expression of Atrogin-1 and Murf1, ubiquitin ligases important in muscle atrophy, and is inactivated by phosphorylation [27]. Therefore, it would be necessary to examine activity of PGC-1α in order to clarify the molecular mechanism of metabolic protein expression changes induced by glucose concentration. Skeletal muscle fibers are composed of slow muscle fibers, which are rich in mitochondria and predominantly use an oxidative metabolism, and fast muscle fibers, which predominantly use glycolysis. Under conditions of reduced mechanical load, such as when bedridden or in space, it is known that slow muscle fibers are dominantly degraded accompanied with impaired oxidative metabolism [28]. Therefore, it is suggested that intracellular energy metabolism and myofiber degradation are tightly related. The metabolic reprograming by glucose concentration could counteract unloading-induced muscle atrophy. Actually, in this study, we observed increased Myh mRNA expression and proteins. It would be interesting to examine protective effect of Low glucose condition on muscle unloading stress in future sturdy.
Glucose induces nonenzymatic production of advanced glycation end products (AGEs) from proteins. AGEs are involved with senescence, diabetes, cardiovascular diseases, neurological disorders and cancers [29]. AGE’s action is mainly mediated by the binding to receptor of AGE (RAGEs), which activates various signaling pathways as the mitogen-activated protein kinases (MAPKs), extracellular signal-regulated kinases 1 and 2 (ERK), p21ras, p38, and Janus kinase [29]. In skeletal muscles, AGEs accumulate on skeletal muscles’ extracellular matrix (ECM), which increases stiffness and activates AGE–RAGE signaling in satellite cells and muscle fibers [30]. Recently, histone glycation has been reported as an epigenetic modification, which might affect the transcriptional regulation [31,32]. The underlying mechanism of glucose condition in this study might be related with AGE–RAGE signaling and/or epigenetic regulation by glycation of histone proteins.
In the present study, we found that the aerobic metabolism of C2C12 myocytes was activated by decreasing the glucose concentration in the culture media. We also identified the molecules responsible for these phenomena by proteomic analysis and found HK2, PFKP, FABP3, and NDUFA11 as targets. Now, we need to investigate whether these molecules play a key role in intracellular metabolism in cell/animal models in which the expression of individual molecules is regulated or overexpressed.

Supplementary Materials

The following supporting information can be downloaded at: https://www.mdpi.com/article/10.3390/app12031553/s1, Table S1: The C2C12 myotubes at different glucose concentrations in the culture media after 5 days post-differentiation.

Author Contributions

Conceptualization, T.U.; formal analysis, A.K. and T.F. (Taku Fukushima); investigation, A.K.; data curation, I.S.; writing—original draft preparation, A.K.; writing—review and editing, I.S., T.U., K.S. and T.F (Tomoya Fukawa); supervision, T.U.; project administration, T.U.; funding acquisition, T.U. and T.N. All authors have read and agreed to the published version of the manuscript.

Funding

This research was funded by the 3rd Joint research to explore new research themes, Nutraceuticals Division, Otsuka Pharmaceutical Co, Ltd., Saga, Japan, and Japan Society for the Promotion of Science (JSPS) KAKENHI Grants (20K19639 and 19KK0253).

Acknowledgments

IPA analysis was supported by Support Center for Advanced Medical Sciences, Tokushima University Graduate School of Biomedical Sciences. This research was also supported by Saga Nutraceuticals Research Institute, Otsuka Pharmaceutical Co, Ltd., Saga, Japan.

Conflicts of Interest

The authors declare no conflict of interest.

References

  1. Schiaffino, S.; Reggiani, C. Fiber types in mammalian skeletal muscles. Physiol. Rev. 2011, 91, 1447–1531. [Google Scholar] [CrossRef] [PubMed] [Green Version]
  2. Abdul-Ghani, M.A.; Defronzo, R.A. Pathogenesis of insulin resistance in skeletal muscle. J. Biomed. Biotechnol. 2010, 2010, 476279. [Google Scholar] [CrossRef] [PubMed] [Green Version]
  3. Lee, S.R.; Kim, H.K.; Song, I.S.; Youm, J.; Dizon, L.A.; Jeong, S.H.; Ko, T.H.; Heo, H.J.; Ko, K.S.; Rhee, B.D.; et al. Glucocorticoids and their receptors: Insights into specific roles in mitochondria. Prog. Biophys. Mol. Biol. 2013, 112, 44–54. [Google Scholar] [CrossRef] [PubMed]
  4. Mesinovic, J.; Zengin, A.; De Courten, B.; Ebeling, P.R.; Scott, D. Sarcopenia and type 2 diabetes mellitus: A bidirectional relationship. Diabetes Metab. Syndr. Obes. Targets Ther. 2019, 12, 1057–1072. [Google Scholar] [CrossRef] [Green Version]
  5. Seok, W.P.; Goodpaster, B.H.; Jung, S.L.; Kuller, L.H.; Boudreau, R.; De Rekeneire, N.; Harris, T.B.; Kritchevsky, S.; Tylavsky, F.A.; Nevitt, M.; et al. Excessive loss of skeletal muscle mass in older adults with type 2 diabetes. Diabetes Care 2009, 32, 1993–1997. [Google Scholar] [CrossRef] [Green Version]
  6. Meng, Z.X.; Gong, J.; Chen, Z.; Sun, J.; Xiao, Y.; Wang, L.; Li, Y.; Liu, J.; Xu, X.Z.S.; Lin, J.D. Glucose Sensing by Skeletal Myocytes Couples Nutrient Signaling to Systemic Homeostasis. Mol. Cell 2017, 66, 332–344.e4. [Google Scholar] [CrossRef] [Green Version]
  7. Elkalaf, M.; Anděl, M.; Trnka, J. Low Glucose but Not Galactose Enhances Oxidative Mitochondrial Metabolism in C2C12 Myoblasts and Myotubes. PLoS ONE 2013, 8, 2–9. [Google Scholar] [CrossRef] [Green Version]
  8. Nakai, N.; Kitai, S.; Iida, N.; Inoue, S.; Nakata, K.; Murakami, T.; Higashida, K. Induction of Autophagy and Changes in Cellular Metabolism in Glucose Starved C2C12 Myotubes. J. Nutr. Sci. Vitaminol. 2020, 66, 41–47. [Google Scholar] [CrossRef] [Green Version]
  9. Furuichi, Y.; Kawabata, Y.; Aoki, M.; Mita, Y.; Fujii, N.L.; Manabe, Y. Excess Glucose Impedes the Proliferation of Skeletal Muscle Satellite Cells Under Adherent Culture Conditions. Front. Cell Dev. Biol. 2021, 9, 640399. [Google Scholar] [CrossRef]
  10. Bekebrede, A.F.; van Deuren, T.; Gerrits, W.J.J.; Keijer, J.; de Boer, V.C.J. Butyrate alters pyruvate flux and induces lipid accumulation in cultured colonocytes. Int. J. Mol. Sci. 2021, 22, 10937. [Google Scholar] [CrossRef]
  11. Ohigashi, I.; Tanaka, Y.; Kondo, K.; Fujimori, S.; Kondo, H.; Palin, A.C.; Hoffmann, V.; Kozai, M.; Matsushita, Y.; Uda, S.; et al. Trans-omics Impact of Thymoproteasome in Cortical Thymic Epithelial Cells. Cell Rep. 2019, 29, 2901–2916.e6. [Google Scholar] [CrossRef] [PubMed]
  12. Huang, D.W.; Sherman, B.T.; Lempicki, R.A. Systematic and integrative analysis of large gene lists using DAVID bioinformatics resources. Nat. Protoc. 2009, 4, 44–57. [Google Scholar] [CrossRef] [PubMed]
  13. Huang, D.W.; Sherman, B.T.; Lempicki, R.A. Bioinformatics enrichment tools: Paths toward the comprehensive functional analysis of large gene lists. Nucleic Acids Res. 2009, 37, 1–13. [Google Scholar] [CrossRef] [PubMed] [Green Version]
  14. Wirth, C.; Brandt, U.; Hunte, C.; Zickermann, V. Structure and function of mitochondrial complex I. Biochim. Biophys. Acta 2016, 1857, 902–914. [Google Scholar] [CrossRef]
  15. Storch, J.; Thumser, A.E. The fatty acid transport function of fatty acid-binding proteins. Biochim. Biophys. Acta 2000, 1486, 28–44. [Google Scholar] [CrossRef] [Green Version]
  16. Lis, P.; Dylag, M.; Niedźwiecka, K.; Ko, Y.H.; Pedersen, P.L.; Goffeau, A.; Ułaszewski, S. The HK2 dependent “Warburg effect” and mitochondrial oxidative phosphorylation in cancer: Targets for effective therapy with 3-bromopyruvate. Molecules 2016, 21, 1730. [Google Scholar] [CrossRef] [Green Version]
  17. Baar, M.P.; Perdiguero, E.; Muñoz-Cánoves, P.; de Keizer, P.L. Musculoskeletal senescence: A moving target ready to be eliminated. Curr. Opin. Pharmacol. 2018, 40, 147–155. [Google Scholar] [CrossRef]
  18. Tang, J.E.; Hartman, J.W.; Phillips, S.M. Increased muscle oxidative potential following resistance training induced fibre hypertrophy in young men. Appl. Physiol. Nutr. Metab. 2006, 31, 495–501. [Google Scholar] [CrossRef]
  19. Kusudo, T.; Kontani, Y.; Kataoka, N.; Ando, F.; Shimokata, H.; Yamashita, H. Fatty acid-binding protein 3 stimulates glucose uptake by facilitating AS160 phosphorylation in mouse muscle cells. Genes Cells 2011, 16, 681–691. [Google Scholar] [CrossRef]
  20. Sharma, L.K.; Lu, J.; Bai, Y. Mitochondrial respiratory complex I: Structure, function and implication in human diseases. Curr. Med. Chem. 2009, 16, 1266–1277. [Google Scholar] [CrossRef] [Green Version]
  21. Lazarou, M.; Thorburn, D.R.; Ryan, M.T.; McKenzie, M. Assembly of mitochondrial complex I and defects in disease. Biochim. Biophys. Acta Mol. Cell Res. 2009, 1793, 78–88. [Google Scholar] [CrossRef] [PubMed] [Green Version]
  22. Pereira, C.V.; Peralta, S.; Arguello, T.; Bacman, S.R.; Diaz, F.; Moraes, C.T. Myopathy reversion in mice after restauration of mitochondrial complex I. EMBO Mol. Med. 2020, 12, e10674. [Google Scholar] [CrossRef] [PubMed]
  23. Popov, L.D. Mitochondrial biogenesis: An update. J. Cell. Mol. Med. 2020, 24, 4892–4899. [Google Scholar] [CrossRef] [PubMed] [Green Version]
  24. Venditti, P.; Di Meo, S. The role of reactive oxygen species in the life cycle of the mitochondrion. Int. J. Mol. Sci. 2020, 21, 2173. [Google Scholar] [CrossRef] [Green Version]
  25. Cannavino, J.; Brocca, L.; Sandri, M.; Grassi, B.; Bottinelli, R.; Pellegrino, M.A. The role of alterations in mitochondrial dynamics and PGC-1α over-expression in fast muscle atrophy following hindlimb unloading. J. Physiol. 2015, 593, 1981–1995. [Google Scholar] [CrossRef] [Green Version]
  26. Geng, T.; Li, P.; Yin, X.; Yan, Z. PGC-1α promotes nitric oxide antioxidant defenses and inhibits FOXO signaling against cardiac cachexia in mice. Am. J. Pathol. 2011, 178, 1738–1748. [Google Scholar] [CrossRef]
  27. Sandri, M.; Sandri, C.; Gilbert, A.; Skurk, C.; Calabria, E.; Picard, A.; Walsh, K.; Schiaffino, S.; Lecker, S.H.; Goldberg, A.L. Foxo transcription factors induce the atrophy-related ubiquitin ligase atrogin-1 and cause skeletal muscle atrophy. Cell 2004, 117, 399–412. [Google Scholar] [CrossRef] [Green Version]
  28. Wang, Y.; Pessin, J.E. Mechanisms for fiber-type specificity of skeletal muscle atrophy. Curr. Opin. Clin. Nutr. Metab. Care 2013, 16, 243–250. [Google Scholar] [CrossRef]
  29. Perrone, A.; Giovino, A.; Benny, J.; Martinelli, F. Advanced Glycation End Products (AGEs): Biochemistry, Signaling, Analytical Methods, and Epigenetic Effects. Oxid. Med. Cell. Longev. 2020, 2020. [Google Scholar] [CrossRef] [Green Version]
  30. Olson, L.C.; Redden, J.T.; Schwartz, Z.; Cohen, D.J.; Mcclure, M.J. Advanced Glycation End-Products in Skeletal Muscle Aging. Bioengineering 2021, 8, 168. [Google Scholar] [CrossRef]
  31. Zheng, Q.; Osunsade, A.; David, Y. Protein arginine deiminase 4 antagonizes methylglyoxal-induced histone glycation. Nat. Commun. 2020, 11, 3241. [Google Scholar] [CrossRef] [PubMed]
  32. Zheng, Q.; Omans, N.D.; Leicher, R.; Osunsade, A.; Agustinus, A.S.; Finkin-Groner, E.; D’Ambrosio, H.; Liu, B.; Chandarlapaty, S.; Liu, S.; et al. Reversible histone glycation is associated with disease-related changes in chromatin architecture. Nat. Commun. 2019, 10, 1289. [Google Scholar] [CrossRef] [PubMed] [Green Version]
Figure 1. Proteome analysis with C2C12 myotubes under Low, Medium, or High glucose conditions. (a) Principal components analysis with proteome analysis of C2C12 myotubes under Low, Medium, or High glucose conditions (n = 3, each group). (b) Hierarchical clustering of 113 Differentially expressed proteins in proteome analysis of C2C12 myotubes under Low, Medium, or High glucose conditions (n = 3, each group). The scale value is logarithm of fold change to the base 2. (c) KEGG pathway analysis for upregulated proteins in Low or Medium glucose condition. (d) Left: Pathway diagram for Low glucose compared with High glucose condition analyzed by IPA. Right: Pathway diagram for Medium glucose compared with High glucose condition analyzed by IPA. Upregulated and downregulated pathways are indicated in orange and blue, respectively. Directly regulated and indirectly regulated are indicated in solid lines and dotted lines, respectively. (e) Protein levels of HK2, Ndufa11, Fabp3, Pkfm were obtained from proteome analysis of C2C12 myotubes under Low, Medium, or High glucose conditions (n = 3, each group). * p < 0.05, ** p < 0.01.
Applsci 12 01553 g001
Figure 2. ATP levels in C2C12 myotubes under Low, Medium, or High glucose conditions. ATP levels were determined in C2C12 myotubes under Low, Medium, or High glucose conditions (n = 3, each group). ** p < 0.01.
Applsci 12 01553 g002
Figure 3. Myh expression in C2C12 myotubes under Low, Medium, or High glucose conditions (a) Picture of C2C12 myotubes at 3~5 days post-differentiation under Low, Medium, or High glucose conditions. Scale bar = 50 μm. (b) mRNA expression levels of Myod1, Myf5, Myog were determined in C2C12 myotubes at 3 days post-differentiation under Low, Medium, or High glucose conditions (n = 4, each group). (c) mRNA expression levels of Myh1, Myh2, Myh4 and Myh7 were determined in C2C12 myotubes at 5 days post-differentiation under Low, Medium, or High glucose conditions (n = 4, each group). * p < 0.05.
Applsci 12 01553 g003
Table 1. Sequence of the oligonucleotides for qRT-PCR.
Gene NameForward (5′-3′)Reverse (5′-3′)
Myod1AGGAGCACGCACACTTCTCTTCTCGAAGGCCTCATTCACT
Myf5AGACGCCTGAAGAAGGTCAAGTTCTCCACCTGTTCCCTCA
MyogCTACAGGCCTTGCTCAGCTCACGATGGACGTAAGGGAGTG
Myh1AATCAAAGGTCAAGGCCTACAAGAATTTGGCCAGGTTGACAT
Myh2CAGCACGAGCTGGAGGAAGCTCGCTTCGGTCATTCCAC
Myh4GCTGAGGAGGCTGAGGAACGTGTGAACCTCTCGGCTCTT
Myh7AGTCCCAGGTCAACAAGCTGTTCCACCTAAAGGGCTGTTG
18S rRNACATTCGAACGTCTGCCCTACCTGCTGCCTTCCTTGGA
Publisher’s Note: MDPI stays neutral with regard to jurisdictional claims in published maps and institutional affiliations.

