
Diffusional Behavior of New Insulating Gas Mixtures as Alternatives to the SF6-Use in Medium Voltage Switchgear

 ,
,  ,
,  , , ,
, , ,
Abstract
:
1. Introduction
2. Materials and Methods
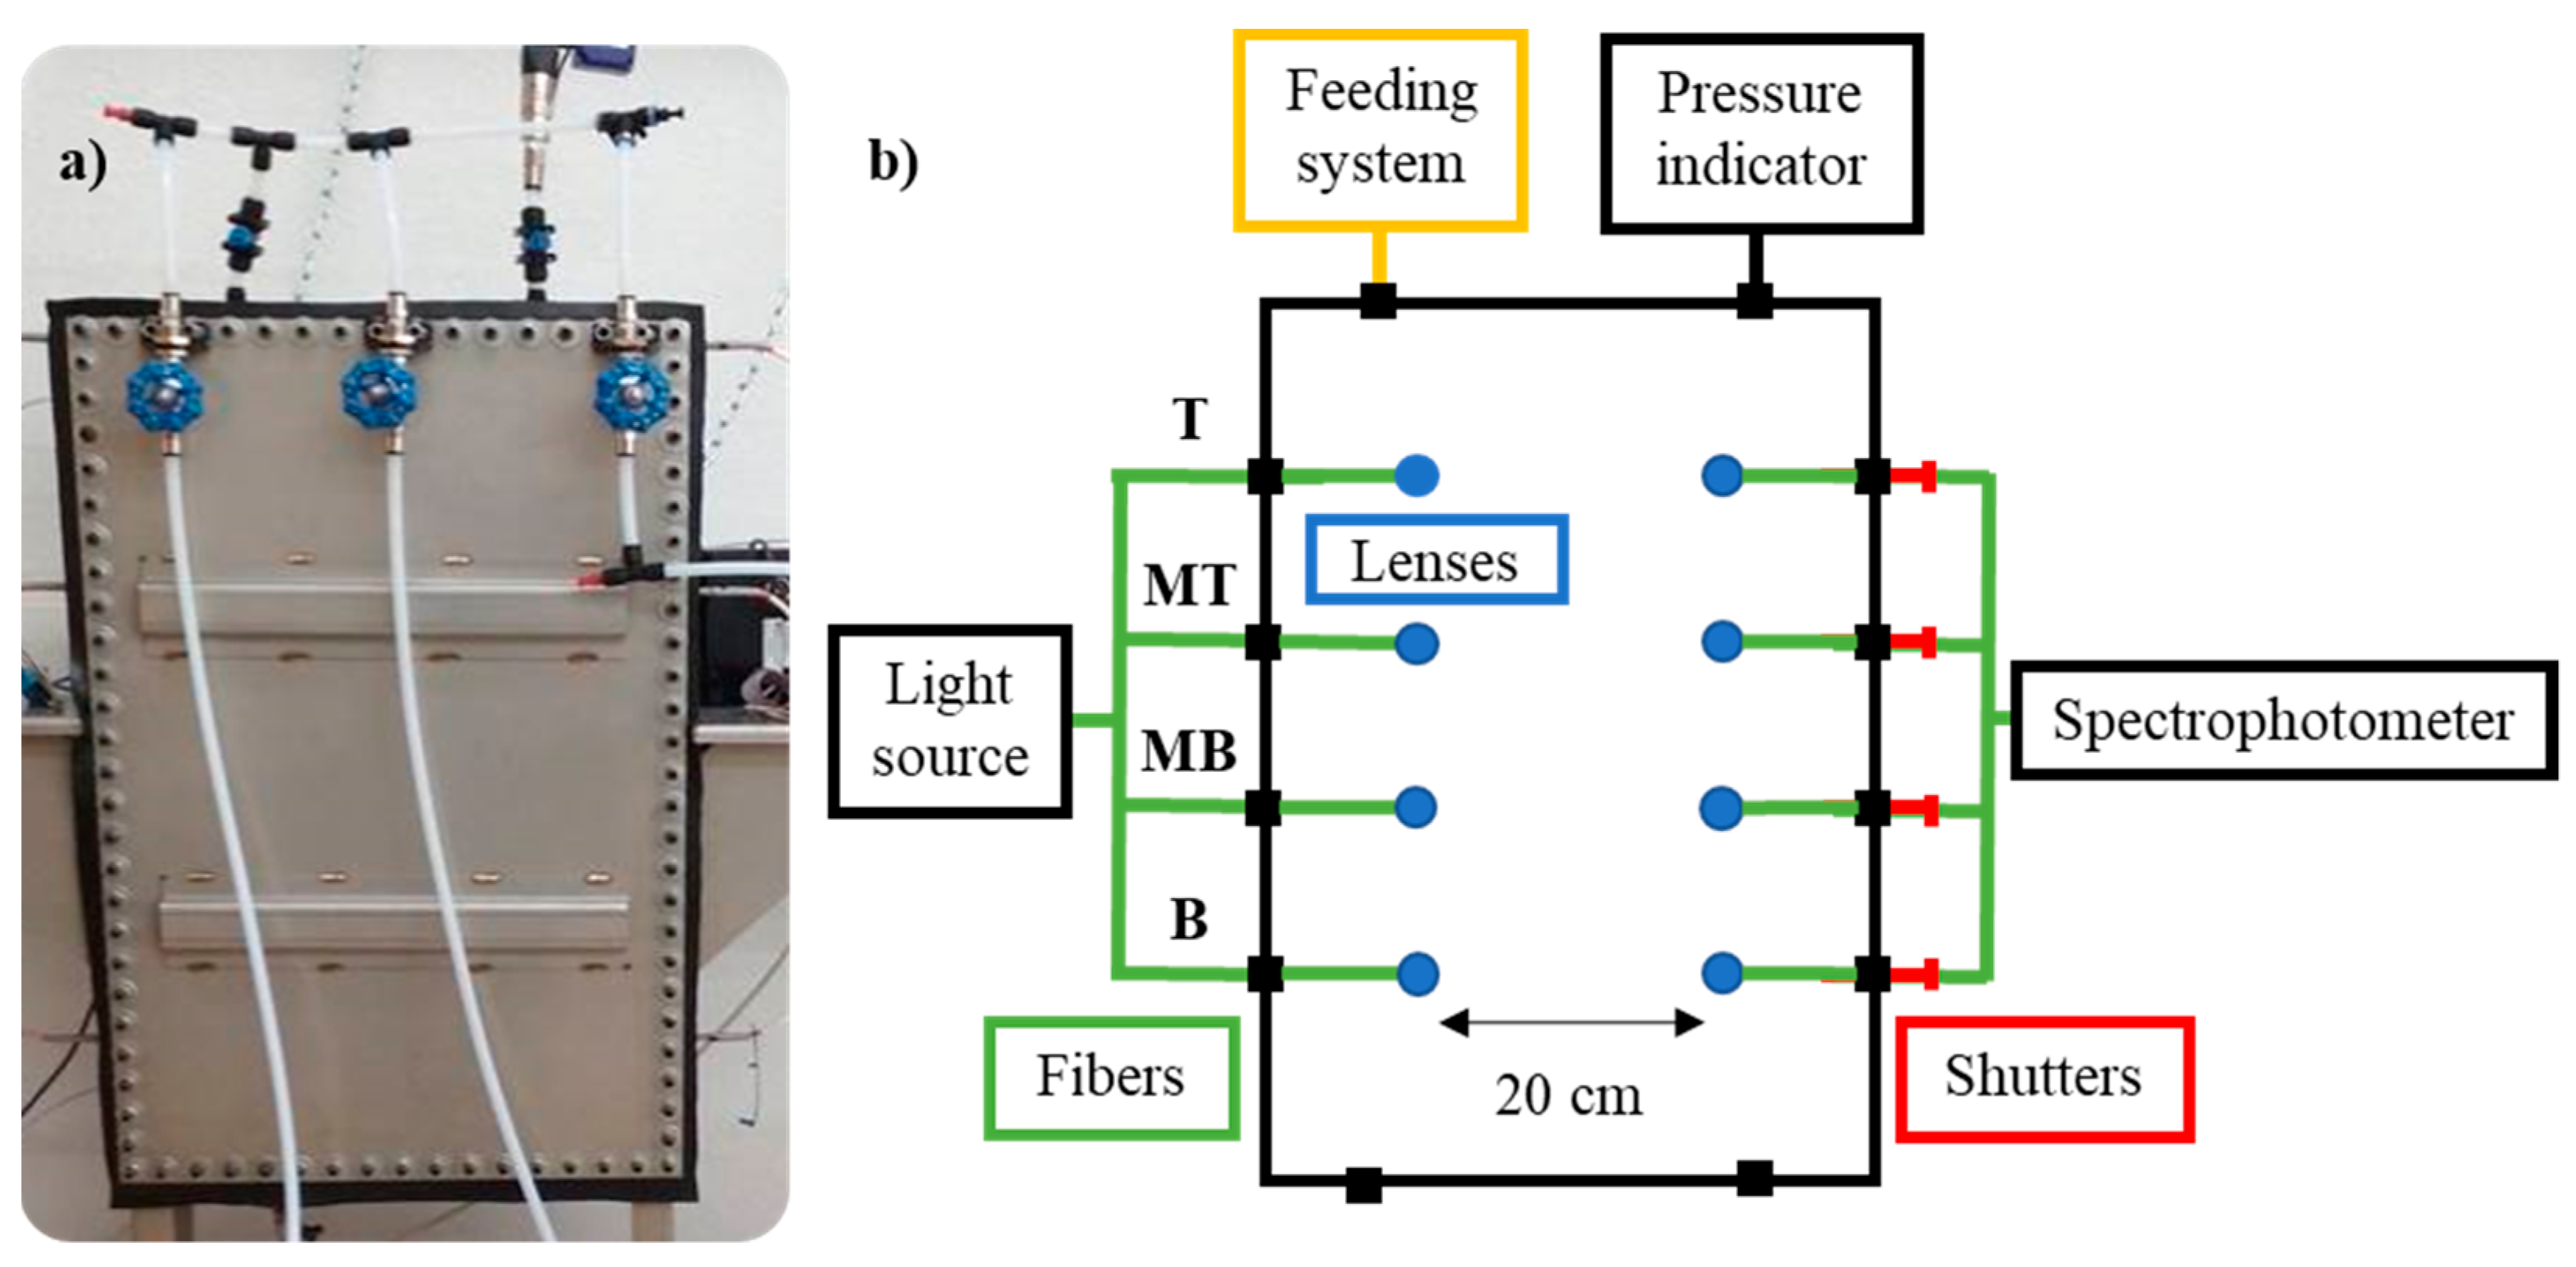
2.1. Experimental Equipment
2.2. Mixing Process Tracking
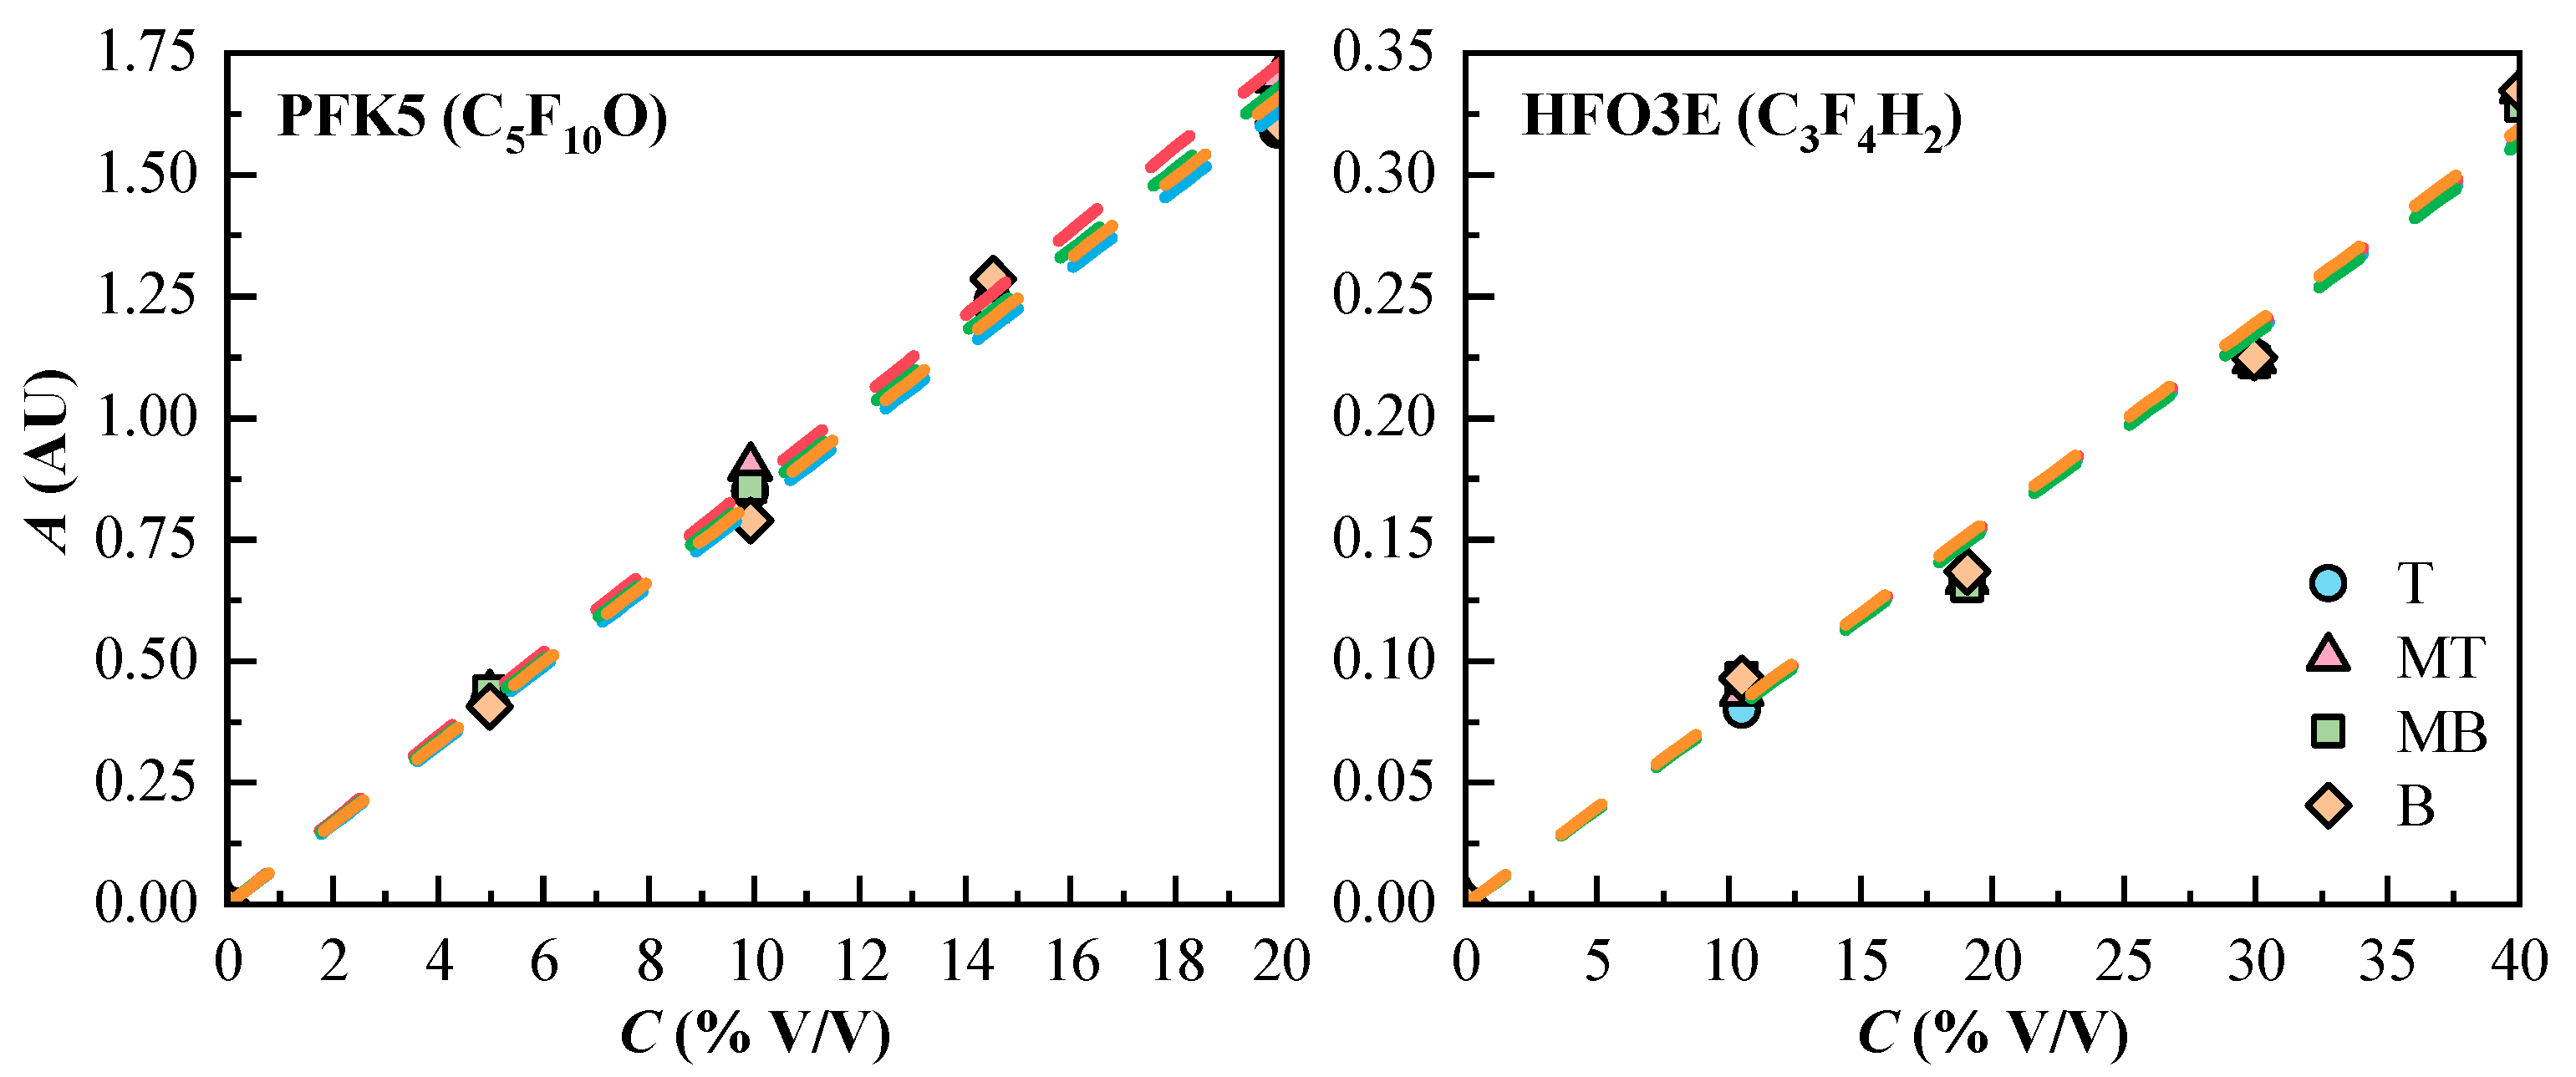
2.2.1. Determination of the Concentration
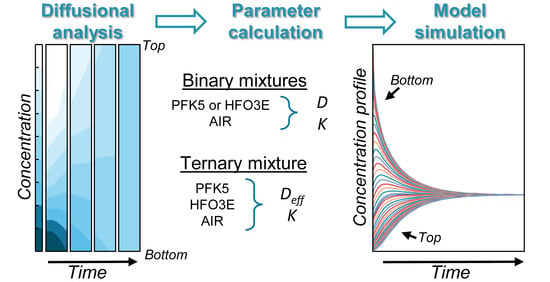
2.2.2. Diffusional Model
3. Results and Discussion
3.1. Mixing Process Tracking
3.1.1. Determination of the Concentration
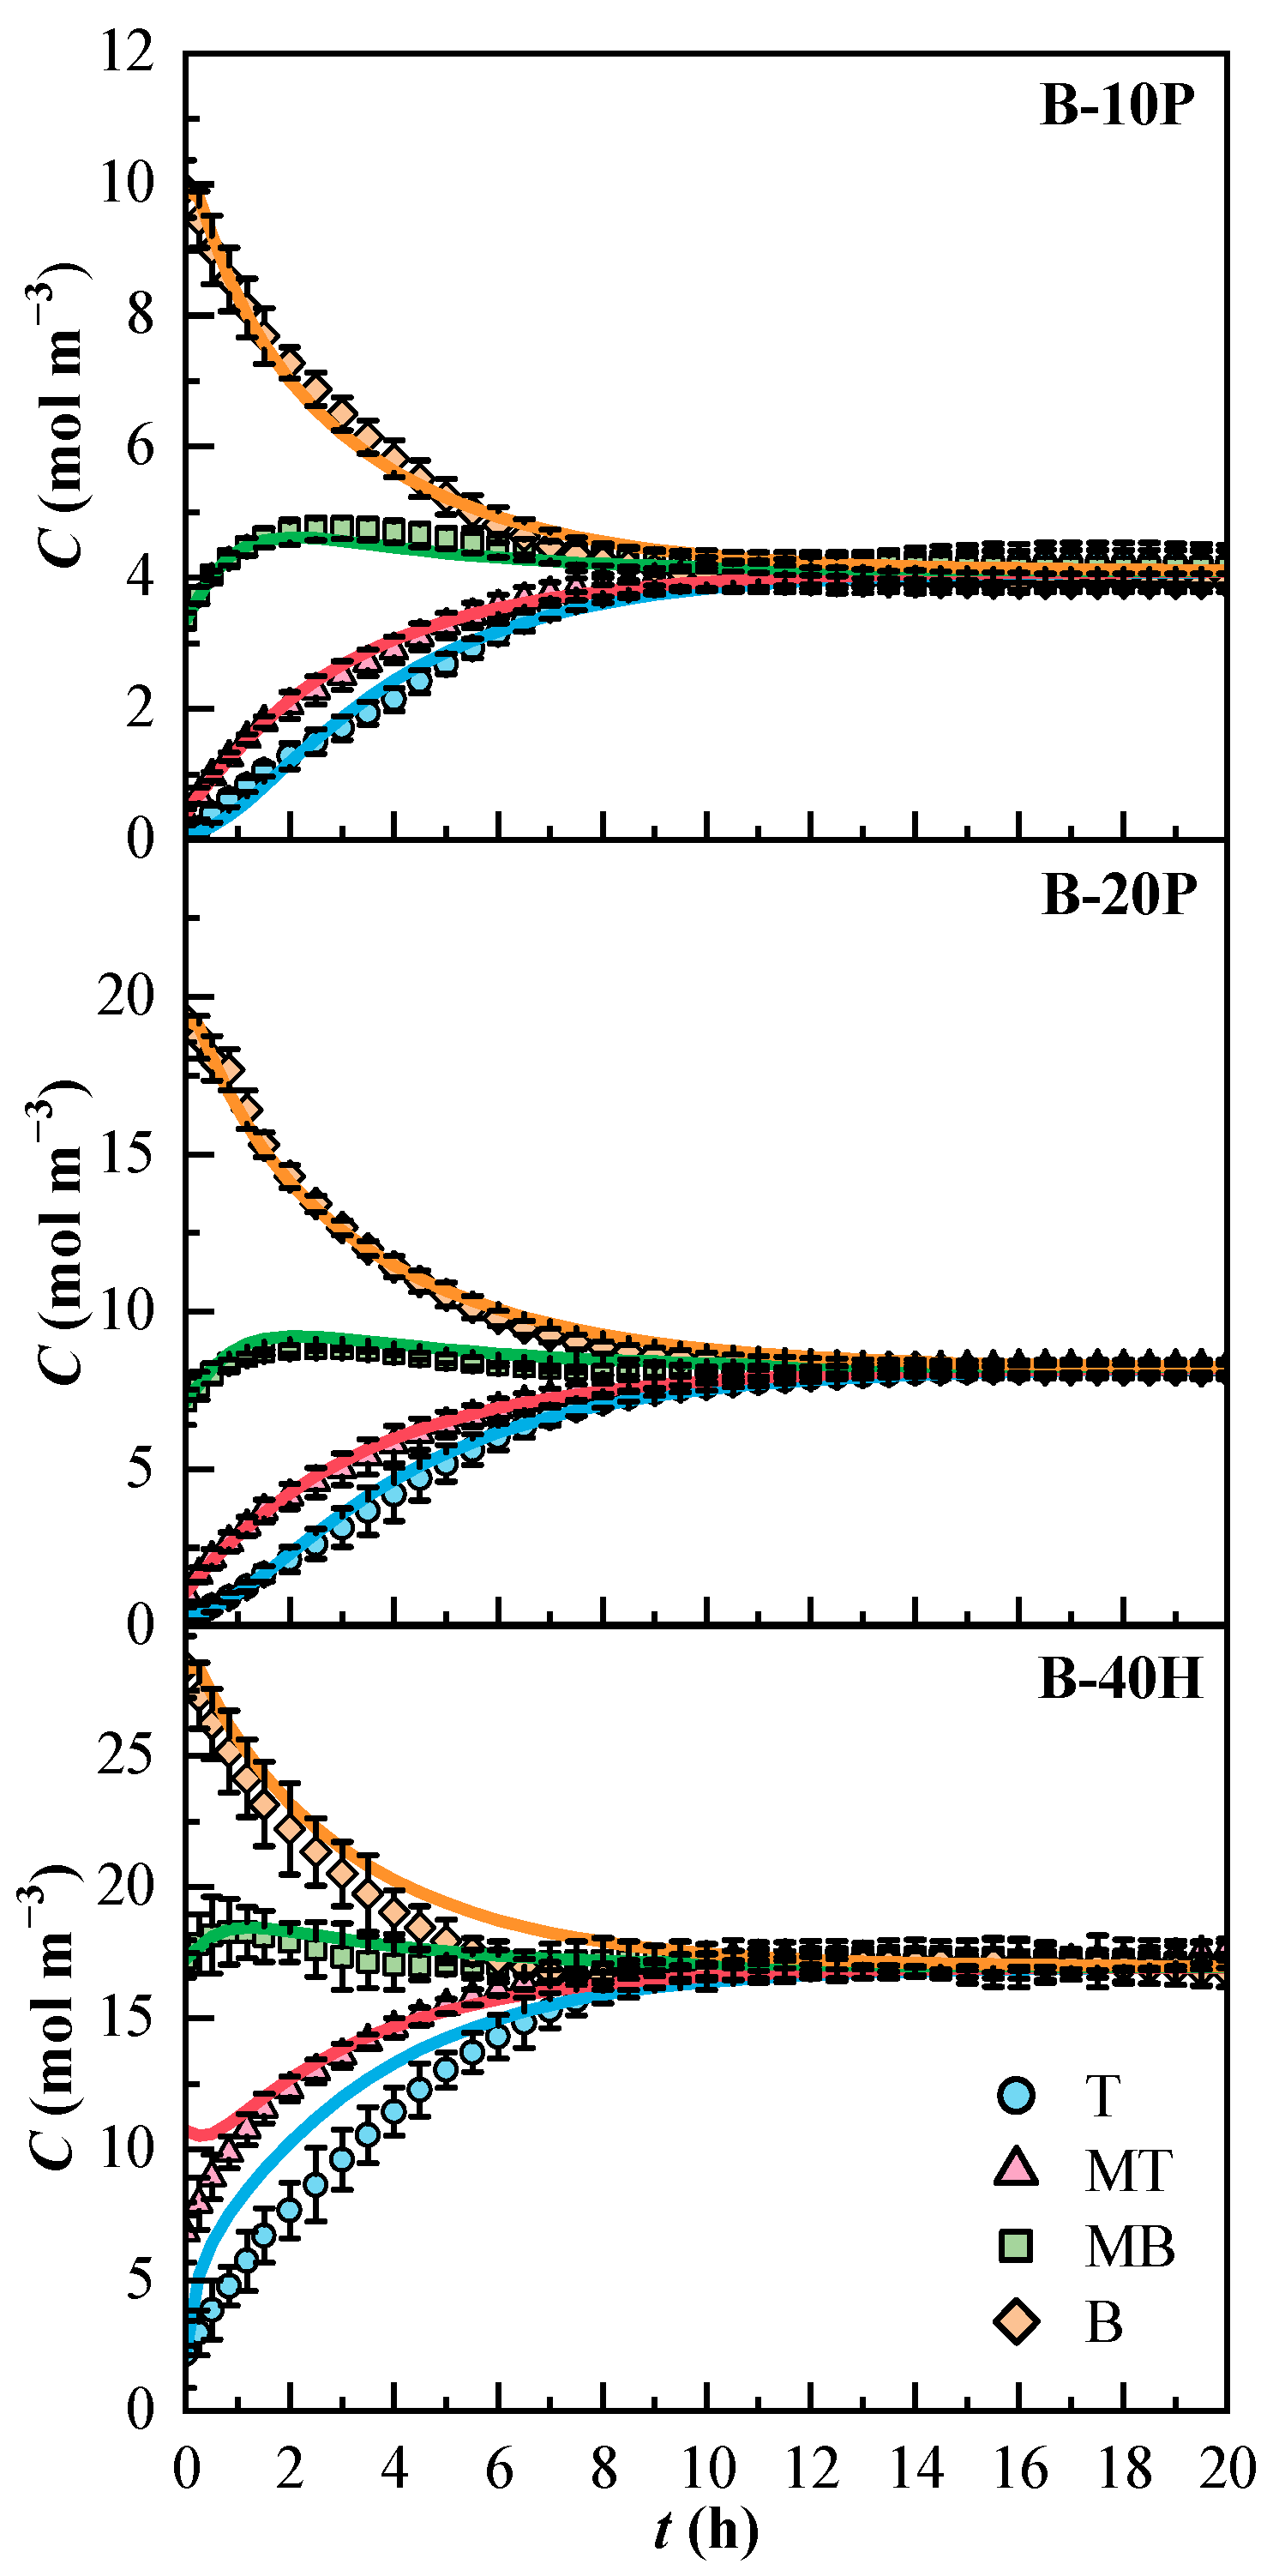
3.1.2. Diffusional Model
3.1.3. Model Validation
4. Conclusions
Author Contributions
Funding
Institutional Review Board Statement
Informed Consent Statement
Data Availability Statement
Conflicts of Interest
References
- Tsai, W.-T. The decomposition products of sulfur hexafluoride (SF6): Reviews of environmental and health risk analysis. J. Fluor. Chem. 2007, 128, 1345–1352. [Google Scholar] [CrossRef]
- Xiao, S.; Zhang, X.; Tang, J.; Liu, S. A review on SF6 substitute gases and research status on CF3I gases. Energy Rep. 2018, 4, 486–496. [Google Scholar] [CrossRef]
- Stocker, T.F.; Qin, D.; Plattner, G.-K.; Tignor, M.M.B.; Allen, S.K.; Boschung, J. Climate Change 2013: The Physical Science Basis. Intergovernmental Panel on Climate Change. 2013. Available online: https://www.ipcc.ch/report/ar5/wg1/ (accessed on 13 December 2021).
- United Nations. Kyoto Protocol to the United Nations Framework Convention on Climate Change. 1998. Available online: https://unfccc.int/kyoto_protocol (accessed on 14 December 2021).
- Hyrenbach, M.; Paul, T.A.; Owens, J. Environmental and safety aspects of AirPlus insulated GIS. In Proceedings of the 24th International Conference & Exhibition on Electricity Distribution, Glasgow, UK, 12–15 June 2017. [Google Scholar]
- Weiss, R.F.; Mühle, J.; Salameh, P.K.; Harth, C.M. Nitrogen trifluoride in the global atmosphere. Geophys. Res. Lett. 2008, 35, L20821. [Google Scholar] [CrossRef] [Green Version]
- Morais, A.R.C.; Harders, A.N.; Baca, K.R.; Olsen, G.M.; Befort, B.J.; Dowling, A.W.; Maginn, E.J.; Shiflett, M.B. Phase Equilibria, Diffusivities, and Equation of State Modeling of HFC-32 and HFC-125 in Imidazolium-Based Ionic Liquids for the Separation of R-410A. Ind. Eng. Chem. Res. 2020, 59, 18222–18235. [Google Scholar] [CrossRef]
- Mühle, J.; Ganesan, A.L.; Miller, B.R.; Salameh, P.K.; Harth, C.M.; Greally, B.R.; Rigby, M.; Porter, L.W.; Steele, L.P.; Trudinger, C.M.; et al. Perfluorocarbons in the global atmosphere: Tetrafluoromethane, hexafluoroethane, and octafluoropropane. Atmos. Chem. Phys. 2010, 10, 5145–5164. [Google Scholar] [CrossRef] [Green Version]
- Corr, S. 1,1,1,2-Tetrafluoroethane; from refrigerant and propellant to solvent. J. Fluor. Chem. 2002, 118, 55–67. [Google Scholar] [CrossRef]
- Akasaka, R.; Zhou, Y.; Lemmon, E.W. A Fundamental Equation of State for 1,1,1,3,3-Pentafluoropropane (R-245fa). J. Phys. Chem. Ref. Data 2015, 44, 013104. [Google Scholar] [CrossRef]
- The European Parliament and the Council of the European Union. Regulation (EU) No 517/2014 of the European Parliament and of the Council of 16 April 2014 on Fluorinated Greenhouse Gases and Repealing Regulation (EC) No 842/2006. 2014, 150/195-230. Available online: https://eur-lex.europa.eu/eli/reg/2014/517/oj (accessed on 14 December 2021).
- European Commission. Climate Action: EU Legislation to Control F-Gases. Available online: https://ec.europa.eu/clima/policies/f-gas/legislation_en (accessed on 14 December 2021).
- Nagarsheth, R.; Singh, S. Study of gas insulated substation and its comparison with air insulated substation. Int. J. Electr. Power Energy Syst. 2014, 55, 481–485. [Google Scholar] [CrossRef]
- Sato, J.; Sakaguchi, O.; Kubota, N.; Makishima, S.; Kinoshita, S.; Shioiri, T.; Yoshida, T.; Miyagawa, M.; Homma, M.; Kaneko, E. New technology for medium voltage solid insulated switchgear. In Proceedings of the IEEE Transmission and Distribution Conference and Exhibition, Yokohama, Japan, 6–10 October 2002. [Google Scholar]
- Hyrenbach, M.; Zache, S. Alternative insulation gas for medium-voltage switchgear. In Proceedings of the 2016 Petroleum and Chemical Industry Conference Europe, Berlin, Germany, 14–16 June 2016. [Google Scholar]
- Kieffel, Y.; Irwin, T.; Ponchon, P.; Owens, J. Green Gas to Replace SF6 in Electrical Grids. IEEE Power Energy Mag. 2016, 14, 32–39. [Google Scholar] [CrossRef]
- Pionteck, J.; Wypych, G. Handbook of Antistatics, 2nd ed.; ChemTech Publishing: Toronto, ON, Canada, 2016. [Google Scholar]
- Kieffel, Y.; Biquez, F. SF6 alternative development for high voltage switchgears. In Proceedings of the 2015 IEEE Electrical Insulation Conference, Seattle, WA, USA, 7–10 June 2015. [Google Scholar]
- Izcara, J.; Larrieta, J. Electrical Insulation System for Medium- and High-voltage Electrical Switchgear. U.S. Patent 10,607,748 B2, 31 March 2020. [Google Scholar]
- Glasmacher, P. Fluorinated Ketones as a High-Voltage Insulating Medium. WO Patent 2010/146022A1, 23 December 2010. [Google Scholar]
- Mantilla, J.; Claessens, M.-S.; Gariboldi, N.; Grob, S.; Skarby, P.; Paul, T.A.; Mahdizabed, N. Dielectric Insulation Medium. U.S. Patent 8,822,870 B2, 2 September 2014. [Google Scholar]
- Kieffel, Y.; Girodet, A.; Piccoz, D.; Maladen, R. Use of a Mixture Comprising a Hydrofluoolefin as a Medium-voltage Arc-extiguishing and/or Insulating Gas and Medium-Voltage Electrical Device Comprising Same. U.S. Patent 9,491,877, 8 November 2016. [Google Scholar]
- Preve, C.; Piccoz, D.; Maladen, R. Validation methods of SF6 alternatives gas. In Proceedings of the 23rd International Conference on Electricity Distribution, Lyon, France, 15–18 June 2015. [Google Scholar]
- Pang, X.; Wu, H.; Pan, J.; Qi, Y.; Li, X.; Zhang, J.; Xie, Q. Analysis of correlation between Internal discharge in GIS and SF6 decomposition products. In Proceedings of the IEEE International Conference on High Voltage Engineering and Application, Athens, Greece, 10–13 September 2018. [Google Scholar]
- Katagiri, H.; Kasuya, H.; Mizoguchi, H.; Yanabu, S. Investigation of the performance of CF3I Gas as a Possible Substitute for SF6. IEEE Trans. Dielectr. Electr. Insul. 2008, 15, 1424–1429. [Google Scholar] [CrossRef]
- Skaggs, S.R.; Rubenstein, R. Setting the occupational exposure limit for CF3I. In Proceedings of the Halon Options Technical Working Conference, Albuquerque, NM, USA, 27–29 April 1999. [Google Scholar]
- Widger, P.; Haddad, A. Analysis of gaseous by-products of CF3I and CF3I-CO2 after high voltage arcing using a GCMS. Molecules 2019, 24, 1599. [Google Scholar] [CrossRef] [Green Version]
- Wang, Y.; Gao, Z.; Wang, B.; Zhou, W.; Yu, P.; Luo, Y. Synthesis and dielectric properties of trifluoromethanesulfonyl fluoride: An alternative gas to SF6. Ind. Eng. Chem. Res. 2019, 58, 21913–21920. [Google Scholar] [CrossRef]
- Hu, S.; Wang, Y.; Zhou, W.; Qiu, R.; Luo, Y.; Wang, B. Dielectric Properties of CF3SO2F/N2 and CF3SO2F/CO2 Mixtures as a Substitute to SF6. Ind. Eng. Chem. Res. 2020, 59, 15796–15804. [Google Scholar] [CrossRef]
- Long, Y.; Guo, L.; Wang, Y.; Chen, C.; Chen, Y.; Li, F.; Zhou, W. Electron Swarms Parameters in CF3SO2F as an Alternative Gas to SF6. Ind. Eng. Chem. Res. 2020, 59, 11355–11358. [Google Scholar] [CrossRef]
- Wang, X.; Zhong, L.; Yan, J.; Yang, A.; Han, G.; Wu, Y.; Rong, M. Investigation of dielectric properties of cold C3F8 mixtures and hot C3F8 gas as Substitutes for SF6. Eur. Phys. J. D 2015, 69, 240. [Google Scholar] [CrossRef]
- Deng, Y.; Li, B.; Xiao, D. Analysis of the insulation characteristics of C3F8 gas mixtures with N2 and CO2 using boltzmann equation method. IEEE Trans. Dielectr. Electr. Insul. 2015, 22, 3253–3259. [Google Scholar] [CrossRef]
- Trudinger, C.M.; Fraser, P.J.; Etheridge, D.M.; Sturges, W.T.; Vollmer, M.K.; Rigby, M.; Martinerie, P.; Mühle, J.; Worton, D.R.; Krummel, P.B.; et al. Atmospheric abundance and global emissions of perfluorocarbons CF4, C2F6 and C3F8 since 1800 inferred from ice core, firn, air archive and in situ measurements. Atmos. Chem. Phys. 2016, 16, 11733–11754. [Google Scholar] [CrossRef] [Green Version]
- Li, Y.; Zhang, X.; Xiao, S.; Chen, Q.; Tang, J.; Chen, D.; Wang, D. Decomposition Properties of C4F7N/N2 Gas Mixture: An Environmentally Friendly Gas to Replace SF6. Ind. Eng. Chem. Res. 2018, 57, 5173–5182. [Google Scholar] [CrossRef]
- Chachereau, A.; Hösl, A.; Franck, C.M. Electrical insulation properties of the perfluoronitrile C4F7N. J. Phys. D. Appl. Phys. 2018, 51, 495201. [Google Scholar] [CrossRef] [Green Version]
- Andersen, M.P.S.; Kyte, M.; Andersen, S.T.; Nielsen, C.J.; Nielsen, O.J. Atmospheric Chemistry of (CF3)2CF–C≡N: A Replacement Compound for the Most Potent Industrial Greenhouse Gas, SF6. Environ. Sci. Technol. 2016, 51, 1321–1329. [Google Scholar] [CrossRef]
- Zhao, M.; Han, D.; Zhou, Z.; Zhang, G. Experimental and theoretical analysis on decomposition and by-product formation process of (CF3)2CFCN mixture. AIP Adv. 2019, 9, 105204. [Google Scholar] [CrossRef]
- Koch, M.; Franck, C.M. High voltage insulation properties of HFO1234ze. IEEE Trans. Dielectr. Electr. Insul. 2015, 22, 3260–3268. [Google Scholar] [CrossRef]
- Liang, Y.; Wang, F.; Sun, Q.; Zhai, Y. Molecular structural and electrical properties of trans-1,3,3,3-tetrafluoropropene and 2,3,3,3-tetrafluoropropene under external electric fields. Comput. Theor. Chem. 2017, 1120, 79–83. [Google Scholar] [CrossRef]
- Wang, J.; Li, Q.; Liu, H.; Huang, X.; Wang, J. Theoretical and experimental investigation on decomposition mechanism of eco-friendly insulation gas HFO1234zeE. J. Mol. Graph. Model. 2020, 100, 107671. [Google Scholar] [CrossRef] [PubMed]
- Mantilla, J.D.; Gariboldi, N.; Grob, S.; Claessens, M. Investigation of the insulation performance of a new gas mixture with extremely low GWP. In Proceedings of the IEEE Electrical Insulation Conference, Philadelphia, PA, USA, 8–11 June 2014. [Google Scholar]
- Simka, P.; Ranjan, N. Dielectric strength of C5 perfluoroketone. In Proceedings of the 19th International Symposium on High Voltage Engineering, Pilsen, Czech Republic, 23–28 August 2015. [Google Scholar]
- Li, Y.; Zhang, X.; Xiao, S.; Chen, Q.; Wang, D. Decomposition characteristics of C5F10O/air mixture as substitutes for SF6 to reduce global warming. J. Fluor. Chem. 2018, 208, 65–72. [Google Scholar] [CrossRef]
- Preve, C.; Piccoz, D.; France, P.S.; Maladen, R. Comparison of Alternatives to SF6 Regarding EHS and End of Life. In Proceedings of the 25th International Conference on Electricity Distribution, Madrid, Spain, 3–6 June 2019. [Google Scholar]
- Zhuo, R.; Chen, Q.; Wang, D.; Fu, M.; Tang, J.; Hu, J.; Jiang, Y. Compatibility between C6F12O–N2 Gas Mixture and Metal Used in Medium-Voltage Switchgears. Energies 2019, 12, 4639. [Google Scholar] [CrossRef] [Green Version]
- Blázquez, S.; Antiñolo, M.; Nielsen, O.J.; Albaladejo, J.; Jiménez, E. Reaction kinetics of (CF3)2CFCN with OH radicals as a function of temperature (278–358 K): A good replacement for greenhouse SF6? Chem. Phys. Lett. 2017, 687, 297–302. [Google Scholar] [CrossRef]
- Kramer, A.; Over, D.; Stoller, P.; Paul, T.A. Fiber-coupled LED gas sensor and its application to online monitoring of ecoefficient dielectric insulation gases in high-voltage circuit breakers. Appl. Opt. 2017, 56, 4505. [Google Scholar] [CrossRef]
- Saxegaard, M.; Seeger, M.; Kristoffersen, M.; Germany, A.; Stoller, P.; Landsverk, H. Dielectric properties of gases suitable for secondary medium voltage switchgear. In Proceedings of the 23rd International Conference om Electricity Distribution, Lyon, France, 15–18 June 2015. [Google Scholar]
- Kuffel, E.; Zaengl, W.S.; Kuffel, J. High Voltage Engigeering Fundamentals, 2nd ed.; Elsevier: Amsterdam, The Netherlands, 2000. [Google Scholar]
- Maikala, R.V. Modified Beer’s Law—Historical perspectives and relevance in near-infrared monitoring of optical properties of human tissue. Int. J. Ind. Ergon. 2010, 40, 125–134. [Google Scholar] [CrossRef]
- Seader, J.D.; Henley, E.J.; Roper, D.K. Separation Process Principles; Wiley: Hoboken, NJ, USA, 2011. [Google Scholar]
- Taylor, R.; Krishna, R. Multicomponent Mass Transfer; Wiley: Hoboken, NJ, USA, 1993. [Google Scholar]
- Bird, R.B.; Stewart, W.E.; Lightfoot, E.N. Transport Phenomena, 2nd ed.; Wiley: Hoboken, NJ, USA, 2002. [Google Scholar]
- Johnson, R.A. Miller and Freud’s Probability and Statistics for Engineers, 9th ed.; Pearson: London, UK, 2018. [Google Scholar]
- Fuller, E.N.; Schettler, P.D.; Giddings, J.C. A new method for prediction of binary gas-phase diffusion coefficients. Ind. Eng. Chem. 1966, 58, 18–27. [Google Scholar] [CrossRef]
- Fuller, E.N.; Ensley, K.; Giddings, J.C. Diffusion of halogenated hydrocarbons in helium. The effect of structure on collision cross sections. J. Phys. Chem. 1969, 73, 3679–3685. [Google Scholar] [CrossRef]
- Hu, X.; Yu, X.; Hou, H.; Wang, B. Stereo-dependent dimerization, boiling points, diffusion coefficients, and dielectric constants of E/Z-HFO-1234ze. Int. J. Quantum Chem. 2022, 122, e26848. [Google Scholar] [CrossRef]


| Component | LT (yr) * | GWP100 * | Application |
|---|---|---|---|
| Sulfur hexafluoride SF6 | 3200 | 23,500 | Electrical insulation, polycrystalline silicone layer etching, blanketing gas for aluminum or magnesium [1] |
| Nitrogen trifluoride NF3 | 500 | 16,100 | Microelectronic equipment cleaning, etching in microelectronics, liquid crystal displays, photovoltaic cells [6] |
| Difluoromethane CH2F2 | 5.2 | 677 | Refrigeration [7] |
| Perfluoromethane CF4 | 50,000 | 6630 | Semiconductor manufacturing, microelectronic equipment cleaning, etching in microelectronics, chemical vapor decomposition [8] |
| 1,1,1,2-tetrafluoroethane CF3CHF2 | 28.2 | 3170 | Refrigeration, propellant applications, vapor-phase solvent, electronic degreasing [9] |
| Perfluoroethane C2F6 | 10,000 | 11,100 | Semiconductor manufacturing, microelectronic equipment cleaning, etching in microelectronics, chemical vapor decomposition [8] |
| 1,1,1,3,3-pentafluoropropane CF3CH2CHF2 | 7.7 | 858 | Chemical blowing agent, refrigerant [10] |
| Perfluoropropane C3F8 | 2600 | 8900 | Refrigeration, semiconductor manufacturing, microelectronic equipment cleaning, etching in microelectronics, chemical vapor decomposition [8] |
| Component | Mixture | Erel | GWP100 | TB (K) | LT (yr) | TLV-TWA (ppmv) | Decomposition Products | Ref. |
|---|---|---|---|---|---|---|---|---|
| Sulfur hexafluoride (SF6) | Pure | 1 | 23,500 | 209 | 3200 | 1000 | COF2, F2, HF, H2S, NF3, F2O, SO2, S2F10, SF4, SO2F2 | [1,23,24] |
| Trifluoroiodomethane (CF3I) | Pure | 1.2 | <5 | 251 | 0.005 | 150 | CF4, C2F6, C2F4, C3F8, C3F6, C4F8, C2F5I, C3F7I, C2F6O3, C3F7IO | [2,25,26,27] |
| 30% CF3I/CO2 | 0.8 | |||||||
| Trifluoromethanesulphonyl fluoride (CF3SO2F) | Pure | 1.4 | 3678 | 251 | 40 | * | No products after alternating current (AC) voltage breakdown | [28,29,30] |
| 50% CF3SO2F/N2 | 1 | |||||||
| Octafluoropropane (C3F8) | Pure | 0.9 | 7000 | 236 | 2600 | [31,32,33] | ||
| 20% C3F8/N2 | 0.6 | |||||||
| Heptafluorobutyronitrile (C4F7N) | Pure | 2 | 2100 | 268 | 47 | 65 | CF4, C2F6, C3F6, C3F8, C2F4, F3CC≡CCF3, CF3CF=CFCF3, (CF3)3CF, CF3CN, C2F5CN, CNCN, HF, HCN, CO, CF3CN, C2F6 | [34,35,36,37] |
| 5% C4F7N/N2 | 0.9 | |||||||
| 20% C4F7N/CO2 | 1 | |||||||
| 1,3,3,3-Tetrafluoropropene (C3F4H2) | Pure | 0.8 | 6 | 254 | 0.05 | 1000 | CF3CCH, CF3CCF, C2H2, C2HF, CF4, HF, CF3H, C2F6, C2F4, C2HF5, CF3HCF3H, C3F8 | [23,38,39,40] |
| Heptafluoroisopropyl trifluoromethyl ketone (C5F10O) | Pure | 2 | <1 | 300 | 0.04 | 225 | CF4, C2F6, C3F8, C3F6, C4F10, CF2O | [15,41,42,43,44] |
| 5% C5F10O/Air | 0.6 | |||||||
| Perfluoro-2-methyl-3-pentanone (C6F12O) | Pure | 2.7 | <1 | 322 | 0.02 | 150 | [15,41,45] |
| Name | CPFK5 (%) | CHFO3E (%) | CDRY AIR (%) |
|---|---|---|---|
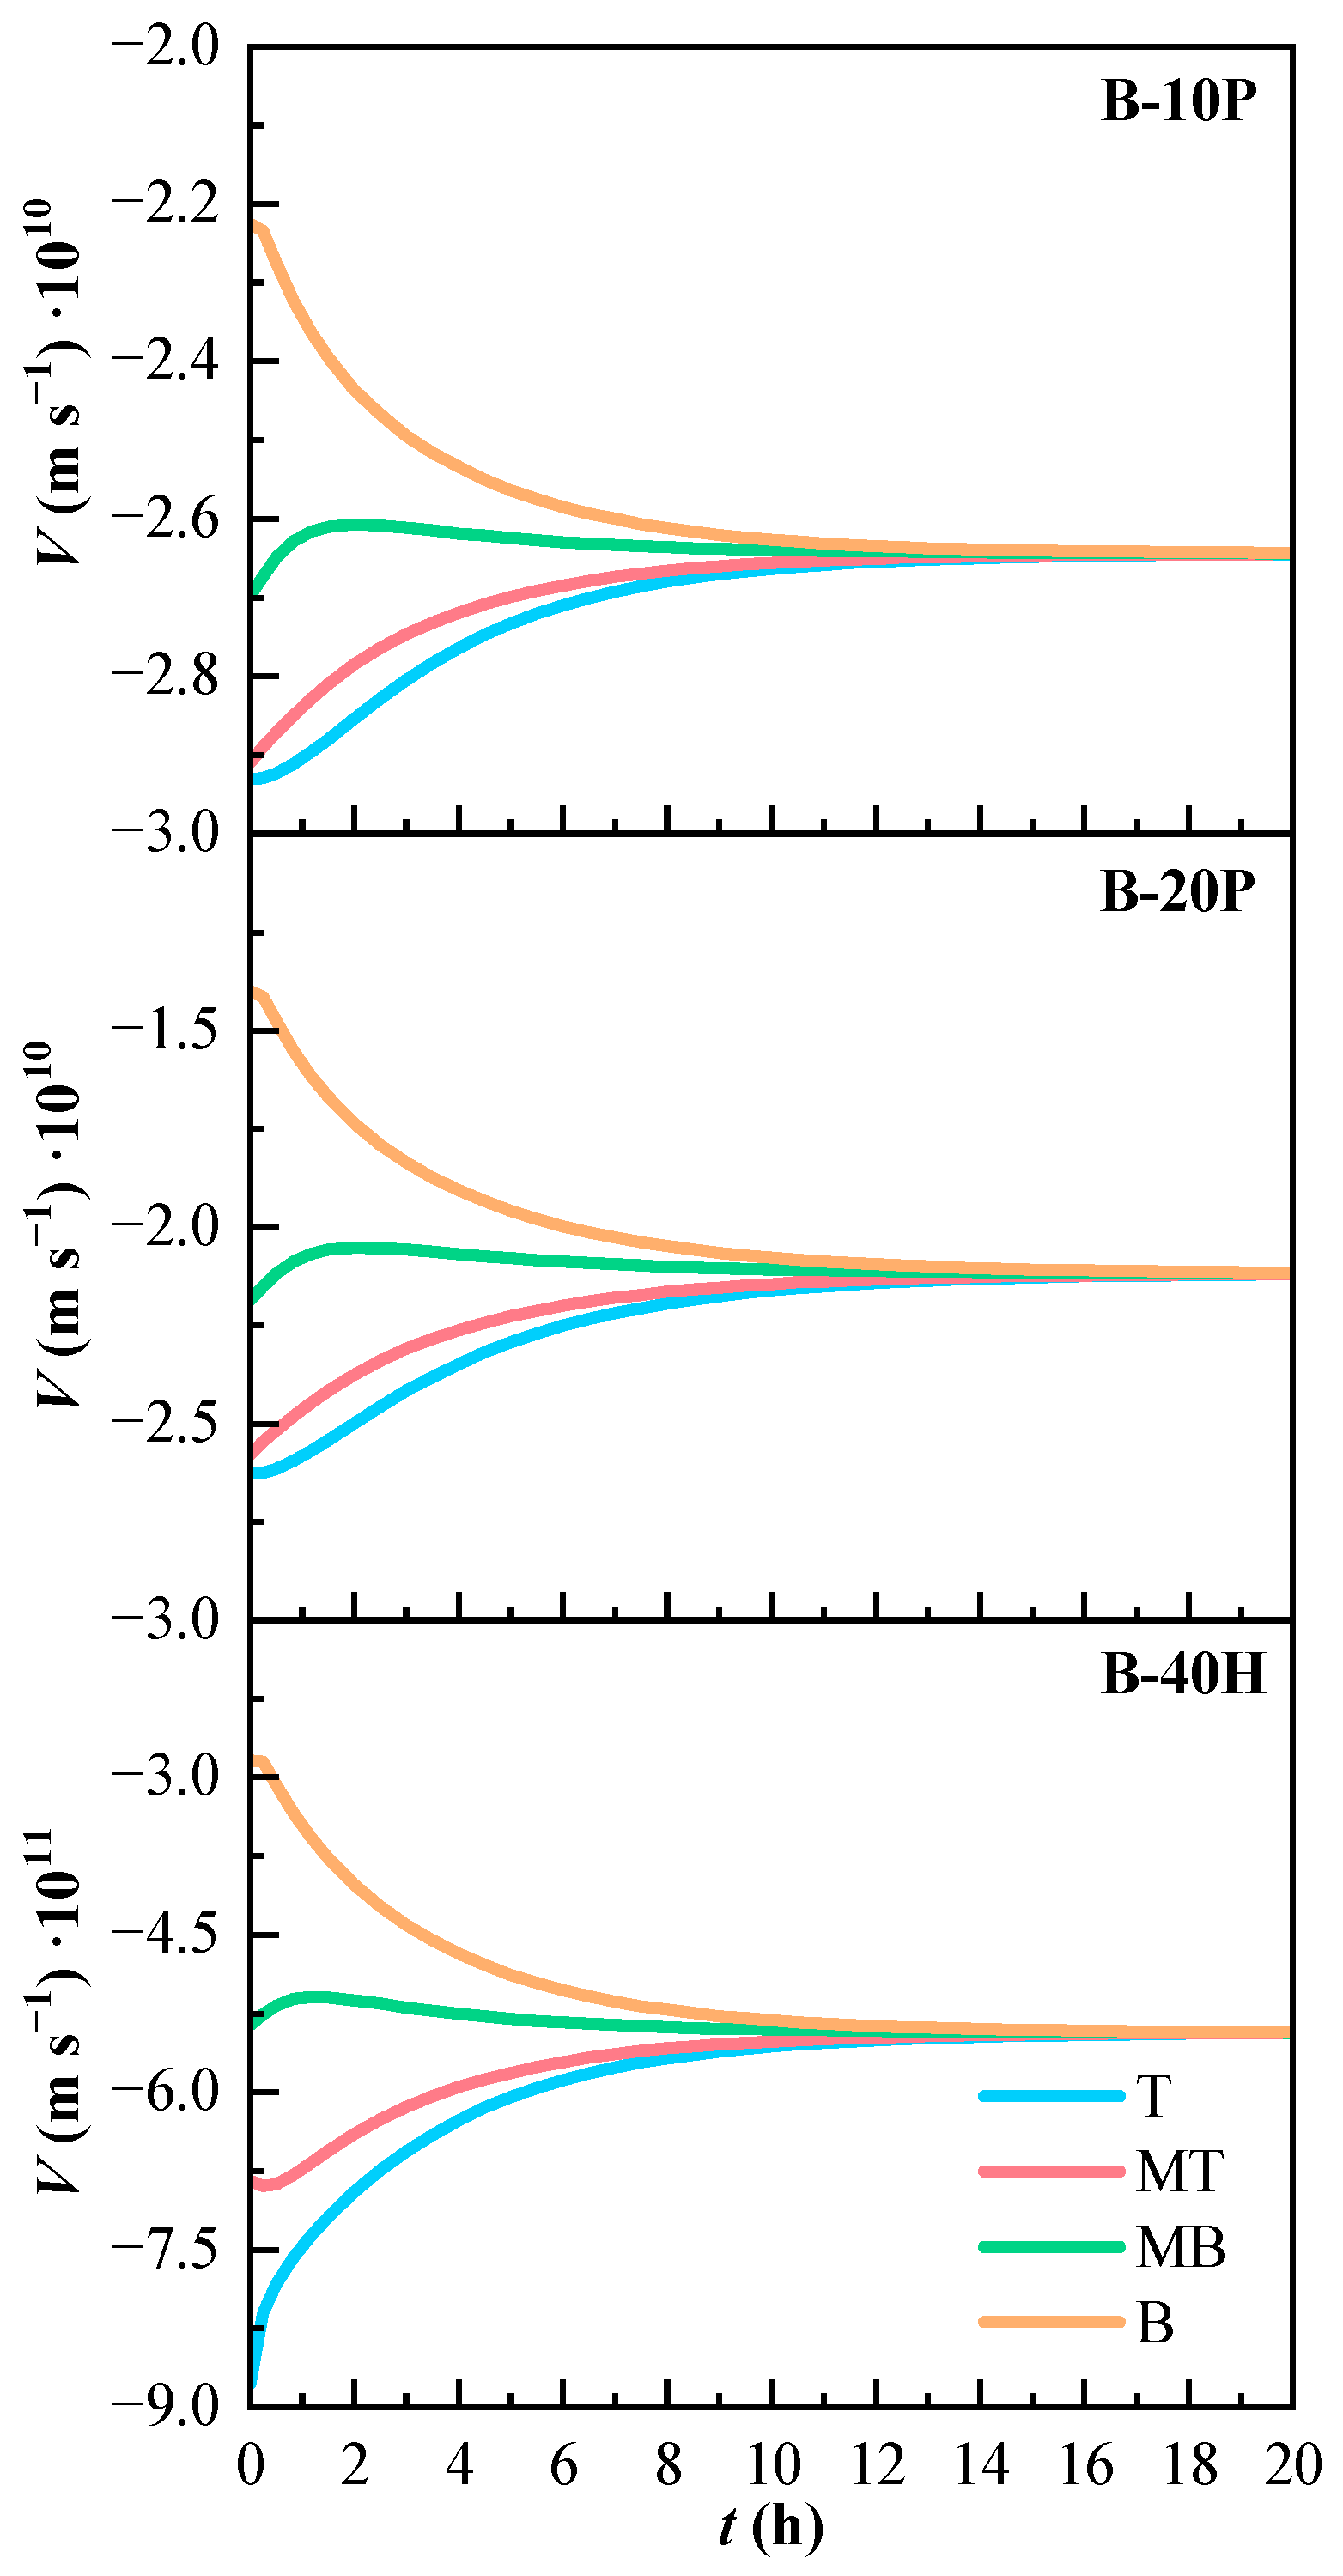
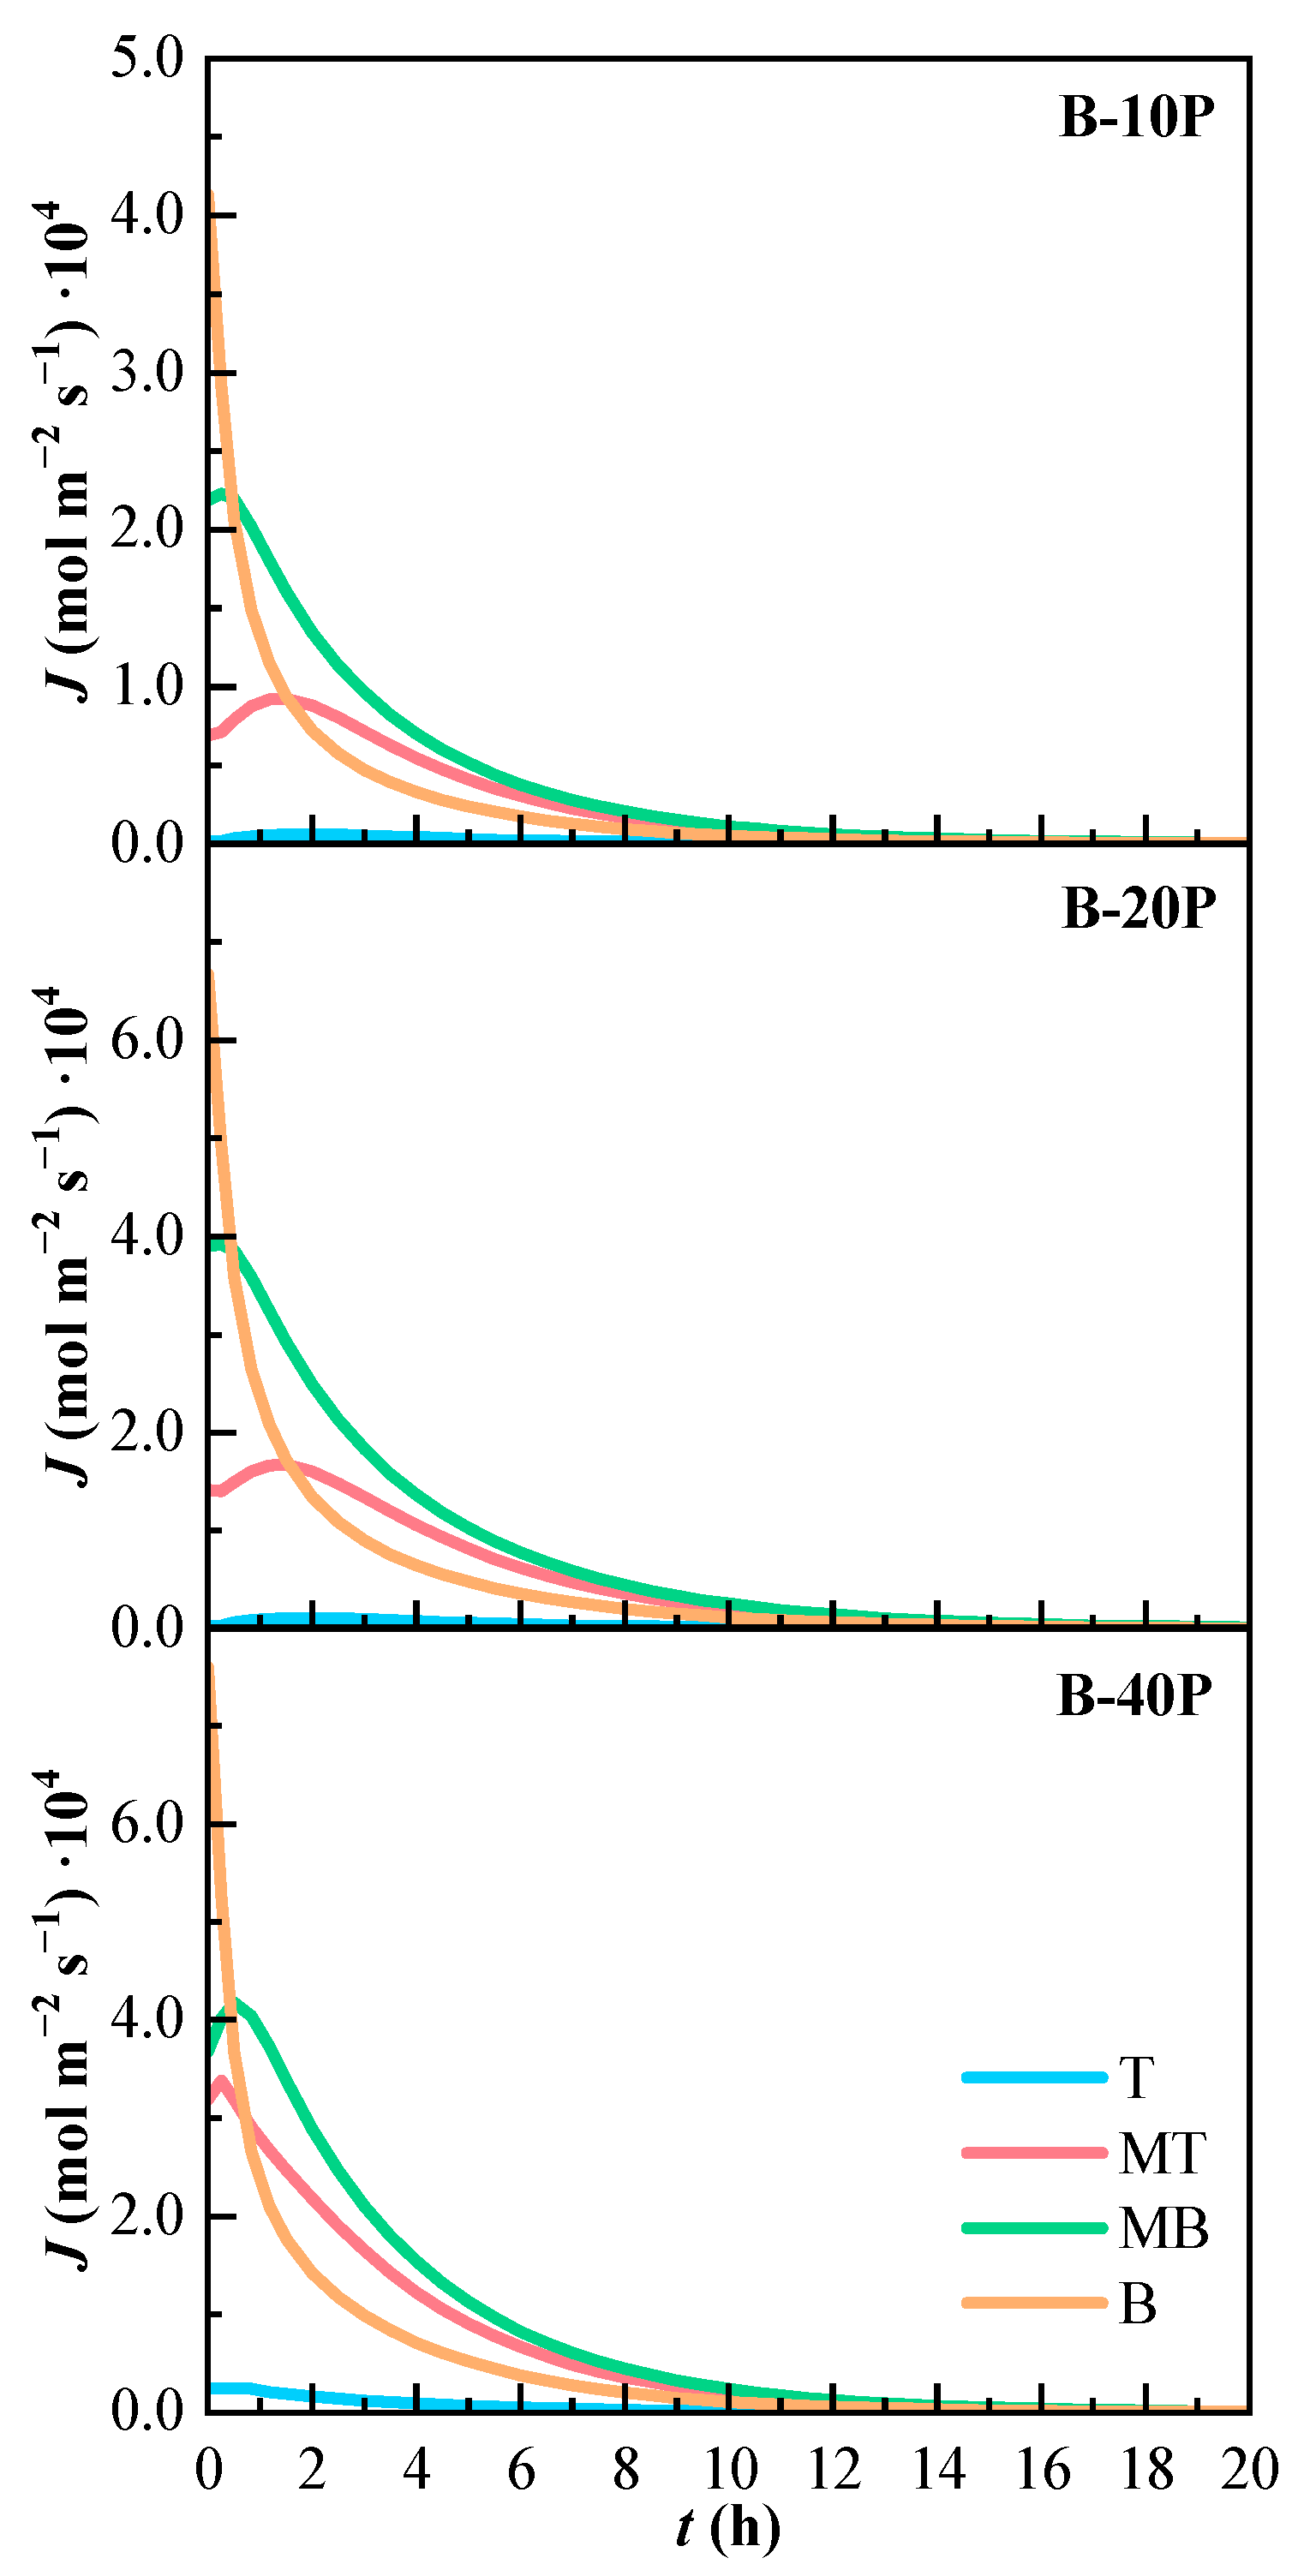
| B-10P | 10 | 0 | 90 |
| B-20P | 20 | 0 | 80 |
| B-40H | 0 | 40 | 60 |
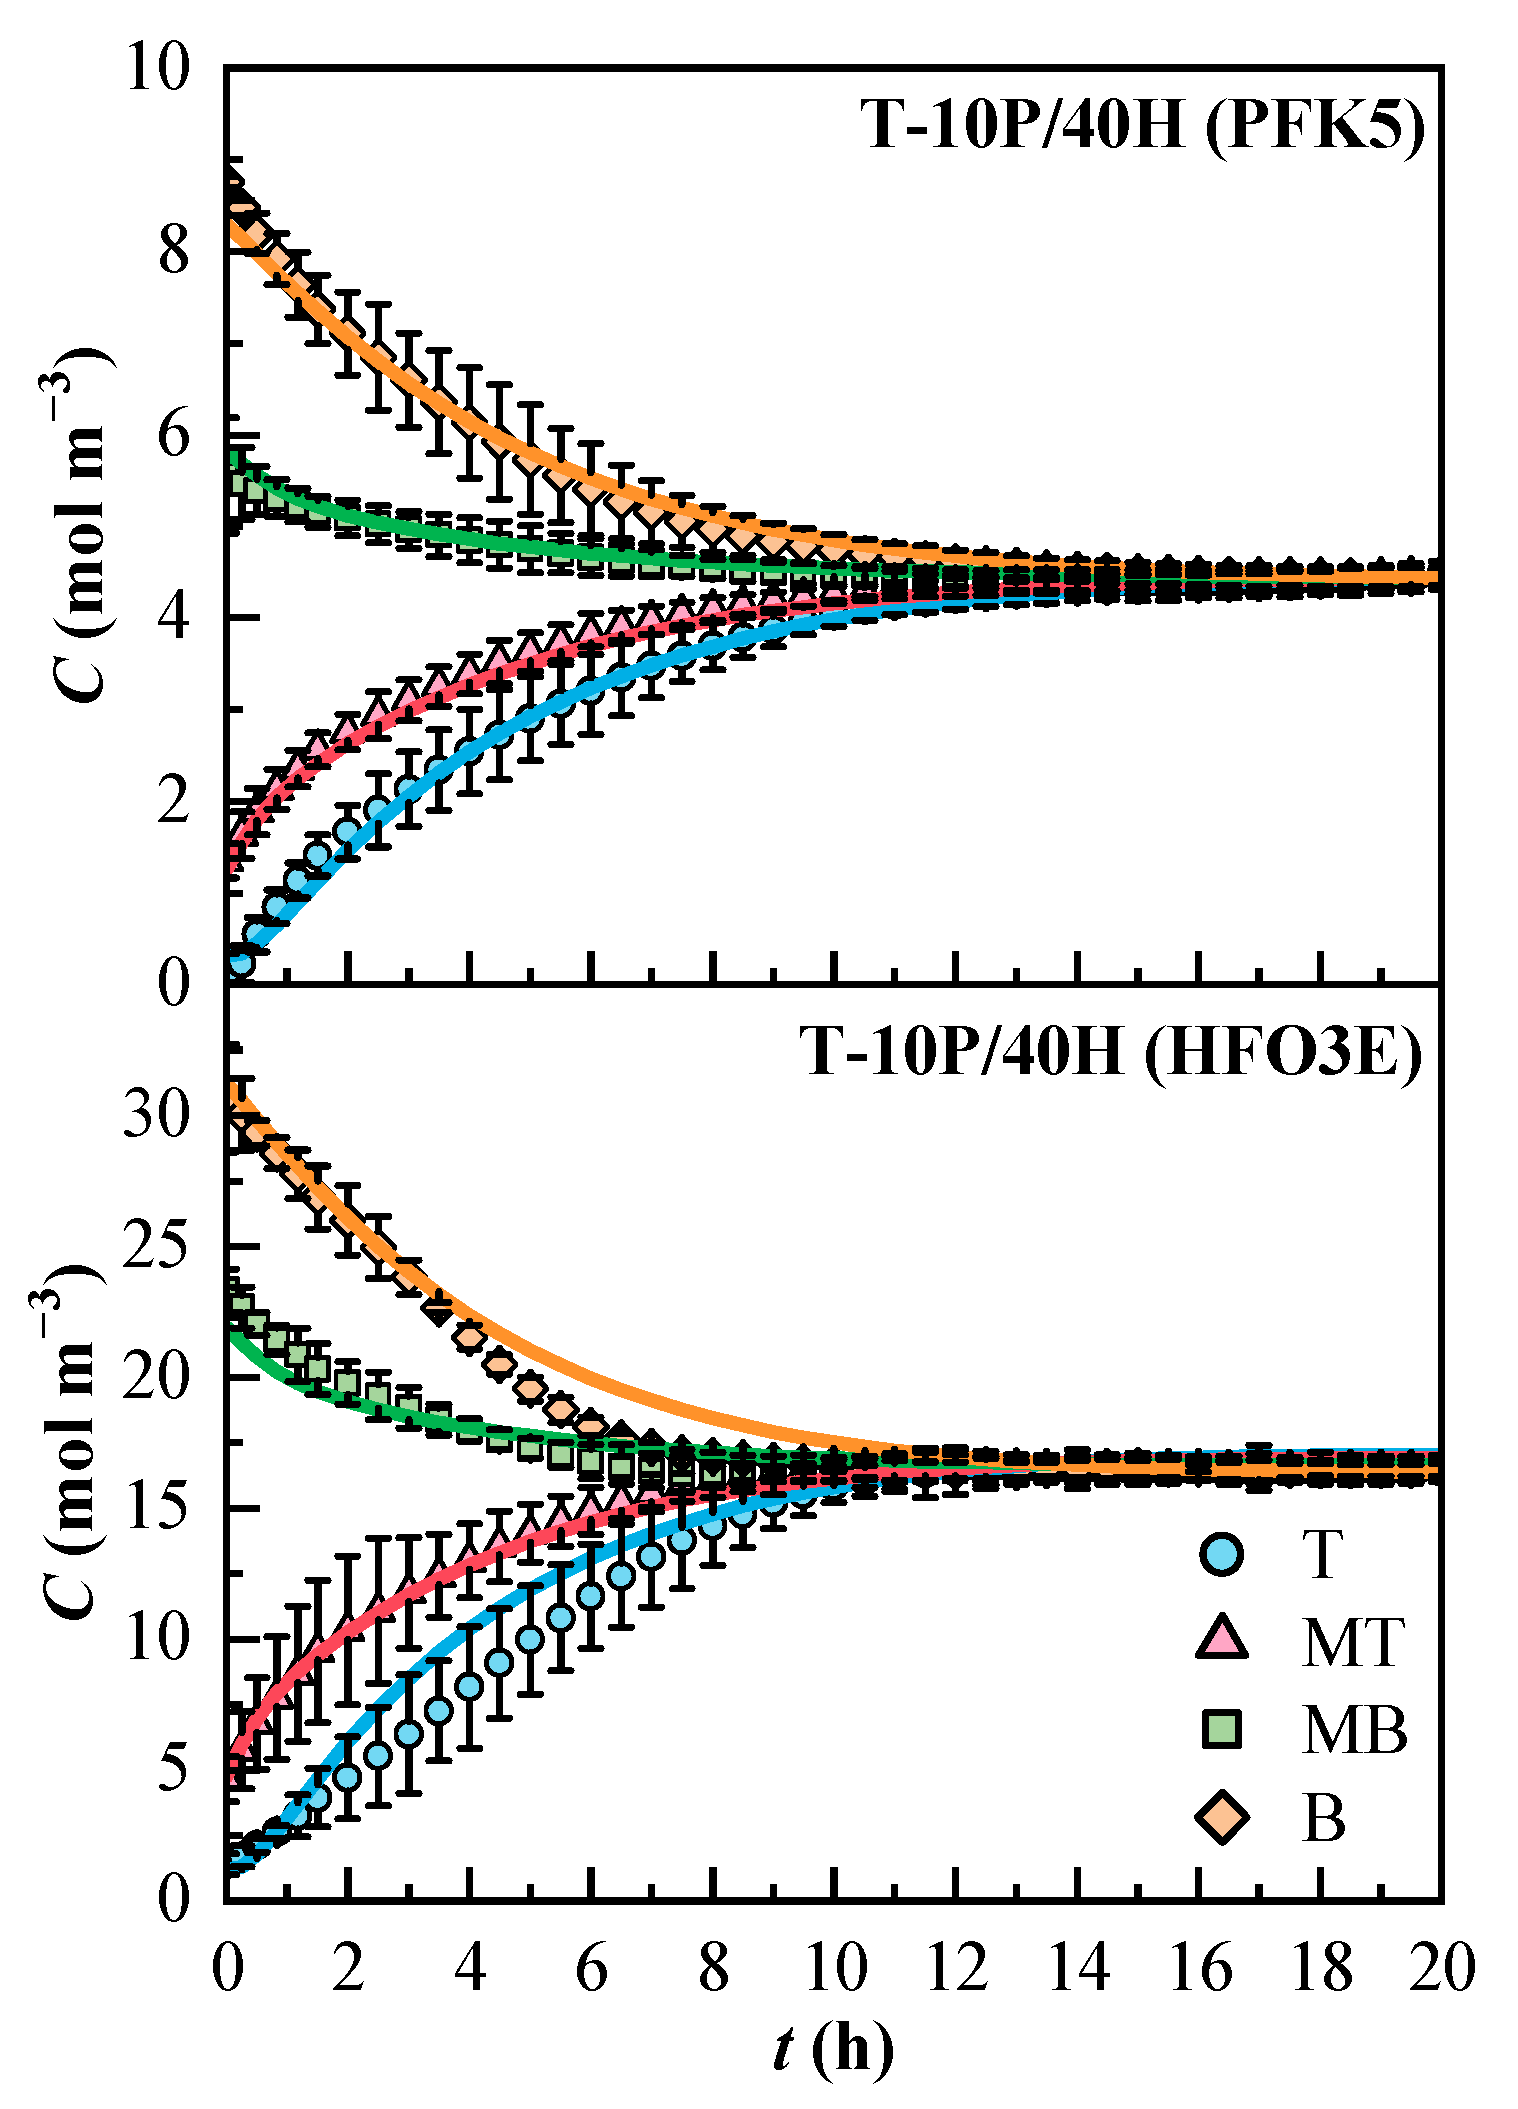
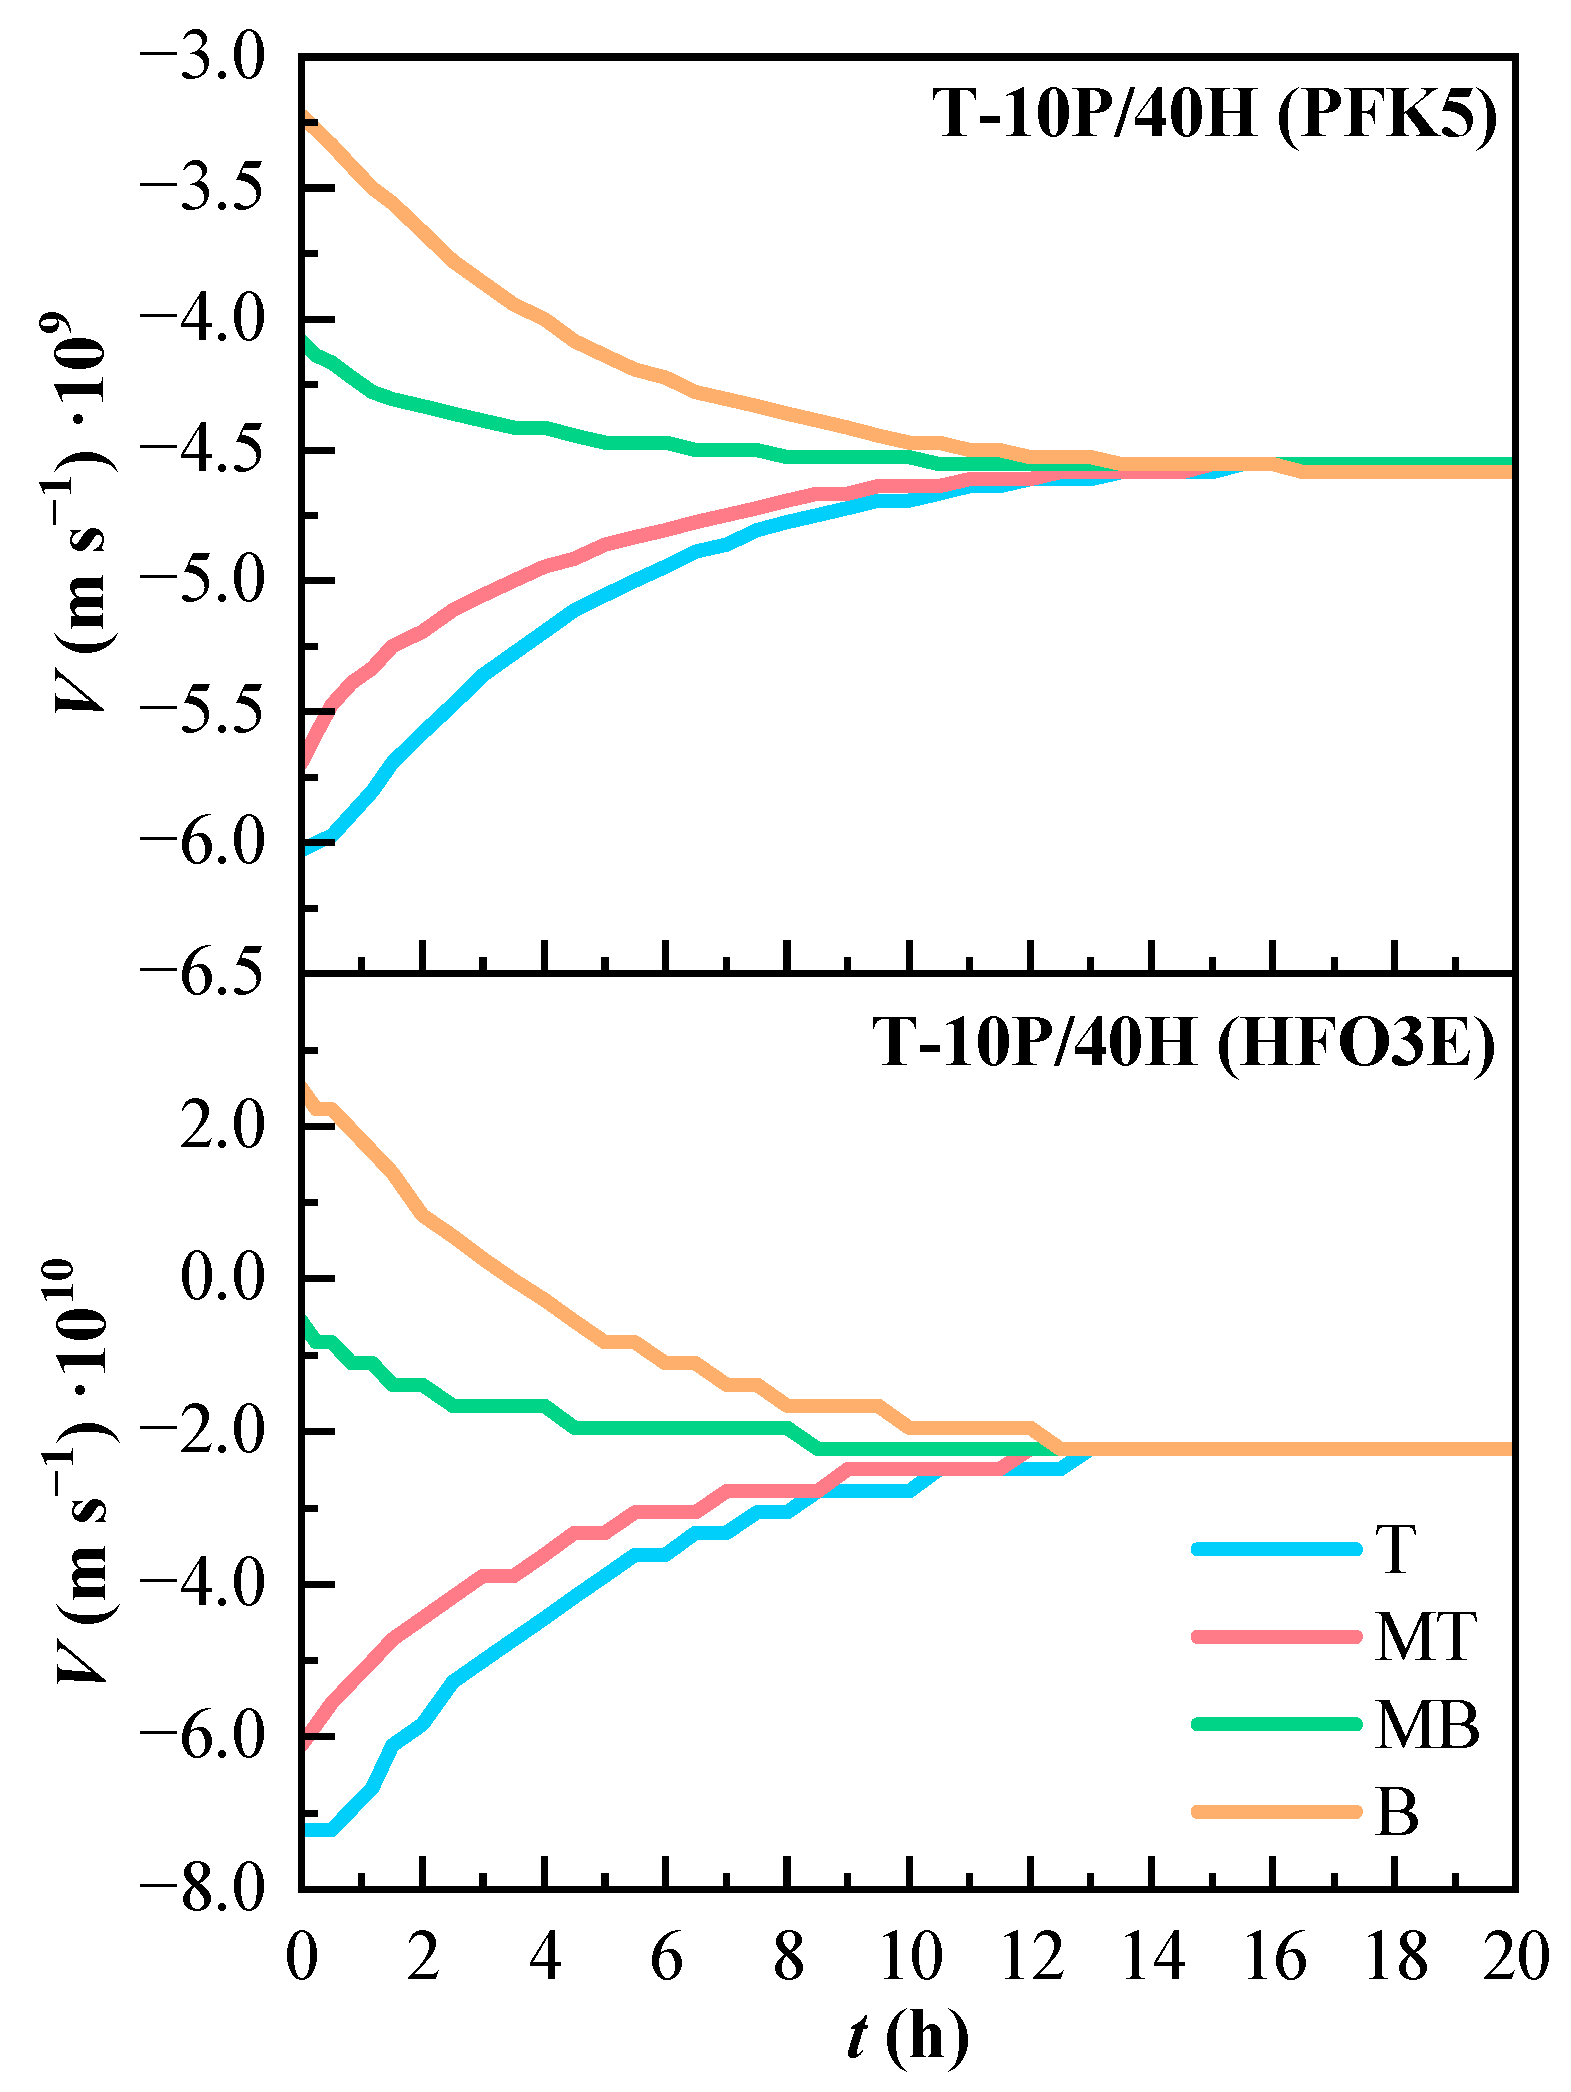
| T-10P/40H | 10 | 40 | 50 |
| Line | Linear Regression | r2 | εM (m3 mol−1 cm−1) | |
|---|---|---|---|---|
| PFK5 | T | y = 0.0811x | 0.997 | 9.9 |
| MT | y = 0.0852x | 0.999 | 10.4 | |
| MB | y = 0.0827x | 0.999 | 10.1 | |
| B | y = 0.0826x | 0.994 | 10.1 | |
| HFO3E | T | y = 0.0081x | 0.991 | 0.99 |
| MT | y = 0.0081x | 0.989 | 0.99 | |
| MB | y = 0.0079x | 0.988 | 0.97 | |
| B | y = 0.0081x | 0.989 | 0.98 |
| Mixture | DE * (m2 s−1)·106 | D (m2 s−1)·106 | K (m4 kg−1 s−1)·1014 | RSE (%) |
|---|---|---|---|---|
| B-10P | 5.4 | 5.2 | 3.1 | 3.8 |
| B-20P | 5.4 | 4.8 | 2.7 | 2.6 |
| B-40H | 7.9 | 5.3 | 2.7 | 5.3 |
| Component | Deff,E * (m2 s−1)·106 | Deff (m2 s−1)·106 | K (m4 kg−1 s−1)·1011 | RSE (%) |
|---|---|---|---|---|
| PFK5 | 2.9 | 3.6 | 0.6 | 2.2 |
| HFO3E | 4.4 | 3.9 | 2.2 | 4.4 |
| Name | CPFK5 (%) | CHFO3E (%) | CDRY AIR (%) |
|---|---|---|---|
| B-5P | 5 | 0 | 95 |
| B-15P | 15 | 0 | 85 |
| B-15H | 0 | 15 | 85 |
| B-30H | 0 | 30 | 70 |
| T-20P/40H | 20 | 40 | 50 |
| Mixture | Minimum Absolute Residuals | Maximum Absolute Residuals | |||||
|---|---|---|---|---|---|---|---|
| Value·103 (mol m−3) | t (h) | Line | Value (mol m−3) | t (h) | Line | ||
| PFK5 | B-10P | 9 | 0.5 | MT | 0.34 | 0.5 | B |
| B-20P | 0.83 | 1.5 | T | 0.73 | 1 | B | |
| T-10P/40H | 2 | 8 | T | 0.34 | 0.5 | B | |
| B-5P | 0.33 | 5.5 | B | 0.28 | 2.5 | T | |
| B-15P | 3 | 2.5 | MB | 1.88 | 0.5 | B | |
| T-20P/40H | 3.4 | 8.5 | MB | 4.09 | 0.5 | B | |
| HFO3E | B-40H | 2.4 | 8 | MB | 2.73 | 1 | T |
| T-10P/40H | 20 | 10 | T | 2.25 | 3.5 | T | |
| B-15H | 40 | 7.5 | T | 3.57 | 2.5 | B | |
| B-30H | 300 | 10 | MB | 3.51 | 3 | B | |
| T-20P/40H | 450 | 10 | T | 7.39 | 3.5 | B | |
Publisher’s Note: MDPI stays neutral with regard to jurisdictional claims in published maps and institutional affiliations. |
© 2022 by the authors. Licensee MDPI, Basel, Switzerland. This article is an open access article distributed under the terms and conditions of the Creative Commons Attribution (CC BY) license (https://creativecommons.org/licenses/by/4.0/).
Share and Cite
Espinazo, A.; Lombraña, J.I.; Asua, E.; Pereda-Ayo, B.; Alonso, M.L.; Alonso, R.M.; Cayero, L.; Izcara, J.; Izagirre, J. Diffusional Behavior of New Insulating Gas Mixtures as Alternatives to the SF6-Use in Medium Voltage Switchgear. Appl. Sci. 2022, 12, 1436. https://doi.org/10.3390/app12031436
Espinazo A, Lombraña JI, Asua E, Pereda-Ayo B, Alonso ML, Alonso RM, Cayero L, Izcara J, Izagirre J. Diffusional Behavior of New Insulating Gas Mixtures as Alternatives to the SF6-Use in Medium Voltage Switchgear. Applied Sciences. 2022; 12(3):1436. https://doi.org/10.3390/app12031436
Chicago/Turabian StyleEspinazo, Ane, José Ignacio Lombraña, Estibaliz Asua, Beñat Pereda-Ayo, María Luz Alonso, Rosa María Alonso, Leire Cayero, Jesús Izcara, and Josu Izagirre. 2022. "Diffusional Behavior of New Insulating Gas Mixtures as Alternatives to the SF6-Use in Medium Voltage Switchgear" Applied Sciences 12, no. 3: 1436. https://doi.org/10.3390/app12031436
APA StyleEspinazo, A., Lombraña, J. I., Asua, E., Pereda-Ayo, B., Alonso, M. L., Alonso, R. M., Cayero, L., Izcara, J., & Izagirre, J. (2022). Diffusional Behavior of New Insulating Gas Mixtures as Alternatives to the SF6-Use in Medium Voltage Switchgear. Applied Sciences, 12(3), 1436. https://doi.org/10.3390/app12031436