Article

Position Sensing with a Compact 0.1 THz Amplitude Modulated Source

Faculty of Electrical Engineering, University of Ljubljana, Tržaska 25, SI-1000 Ljubljana, Slovenia
*
Author to whom correspondence should be addressed.
Appl. Sci. 2022, 12(3), 1439; https://doi.org/10.3390/app12031439
Submission received: 7 January 2022 / Revised: 26 January 2022 / Accepted: 27 January 2022 / Published: 28 January 2022
(This article belongs to the Section Electrical, Electronics and Communications Engineering)

Abstract

:
Position determination is an important manufacturing process in many modern industries. The objective of this paper is to present an affordable measurement system that can replace optical position measurement with a laser beam in an opaque environment that prevents the laser beam from penetrating through the fog of gases or other materials that are opaque to optical light. THz waves are a good example of replacing a laser beam, as shown in this article. It is known that THz rays can penetrate fabrics, wood, Styrofoam, etc. The triangulation method using an amplitude modulated THz source proved to be a cost-effective solution for position determination in opaque environments.

1. Introduction

The THz band, which is defined in the frequency range from about 100 GHz to 10 THz [1], is one of the least explored ranges of the electromagnetic (EM) spectrum, due to technological difficulties in fabricating compact and inexpensive THz sources [2]. From 1980 onwards, research in the THz range began to expand, mainly due to major advances in optics (higher frequency range) and microwave technology (lower frequency range), which reduced costs and improved access to the required elements [2].
There are two main methods used in THz systems which differ according to the source of the THz wave. The first is an optical method in which the laser beam (frequencies in the THz range (1015 Hz), mainly pulsed, with low power) is converted to the THz range [3]. Nonlinear crystals [4], photoconductive antennas [5] and free electron lasers (FEL—Free Electron Laser) [6] are used to achieve the THz range. The second method is the so-called electronic method, where microwaves (frequencies in the GHz range, mainly continuous waves and higher powers) are converted up to the THz range [2]. Electronic oscillators (in the MHz range) are usually used as a base and multiply the microwave input with diodes, exploiting their nonlinear property.
Just as there are different THz sources, there are also different THz detectors. Further information about the development of the state-of-the-art THz sources, detectors and their use can be found in more detail in various books written on the topic [1,2].
In the last decade, THz systems are increasingly used in industry as a safe and cost-effective replacement for X-ray systems [7] or to provide added value in industrial automation control [8]. However, in many industries, the laser beam technology is still used for distance and position monitoring. Often the heavy industries, fog or dust are produced as a by-product in the environment, which makes the surrounding area very opaque for the laser technology. Much effort is invested into compensating for the error of the laser beam when penetrating the opaque area, as it is known that it refracts light and thus introduces errors into the position measurement. In some heavier industries, for example, a steel plant, there are cases where the mixture of gasses and dust is so thick that the laser cannot penetrate the fog and the laser measurement is useless. With a THz system, those issues can be solved, as the THz waves can penetrate many materials, such as fabrics, wood and Styrofoam, to detect hidden objects [9], and thus an opaque area comprised of fog will not pose a problem. Primarily, a frequency modulated continuous wave (FMCW) source is used as a replacement for other technologies in the industry [10]. This method is well known, as it is not complex to implement. The distance can be detected as a mixed product of the transmitted and reflected signals’ frequencies, which is processed using the fast Fourier transform (FFT) algorithm [11]. The major drawback of FMCW sources is their high cost, as a wide frequency modulation bandwidth is required to achieve a good distance measurement resolution. The trend in THz radar systems is to develop less expensive and more compact sources, which are still not good enough in some industry applications, due to the low power of the source. For example, there are some semiconductor companies offering components for radar systems, such as the integrated circuit families from Texas Instruments, where the entire FMCW system including the transmitting and receiving antennas is offered on the demo board [12]. The weakness of the aforementioned system is the low bandwidth of 4 GHz, which corresponds to a distance resolution of about ±1.875 cm, and the low transmitting power compared to other FMCW sources. Furthermore, due to the principle of operation of FMCW systems that use stronger sources, some additional components are required that occupy additional volume for proper operation. FMCW systems usually require voltage-controlled oscillators (VCO), signal mixers and enough processing/computing power to compute the FFT and extract the distance information from the received frequency spectrum. All of these issues can make an FMCW system expensive and unwieldy.
In comparison, THz systems using amplitude modulated (AM) sources are smaller, and signal processing software implementation is simpler. Due to the nature of the AM THz system, the signal mixing elements and a frequency synthesizer are not required, making the system more compact. In recent years, many articles have been written on the topic of using an AM method in new ways to obtain comparable results to other FMCW THz systems in terms of distance measurements. One of those examples is using two different amplitude modulation frequencies simultaneously [13].
Due to the aforementioned reasons, this paper proposes an AM THz system, using the triangulation principle for distance measuring. Triangulation is used for many purposes, including surveying, navigation, metrology and astrometry. In industry, the triangulation principle is already used in laser technology measurements [14], and thus it makes sense to use an AM THz system in the same way to show the improvements to the distance and position measurement. In the paper, a measurement setup is introduced that takes advantage of the triangulation principle. Measurements were performed using a metal plate as the object of interest for the position measurement. Additional measurements were also performed using a Styrofoam covering to confirm the advantage of the THz position measurement compared to the laser beam measurement method.

2. Materials and Methods

In this section, the measurement setup of the triangulation method is explained in more detail. The measurement setup consists of an AM THz source with a custom-made horn, focal lenses and the broadband antenna-coupled titanium-based microbolometer, designed and fabricated in the Laboratory for Microelectronics (LMFE, Ljubljana, Slovenia), as the sensing element [15]. A linear stepper motor from Thorlabs is used for sensor positioning [16]. On a custom-made printed circuit board (PCB), a Texas Instruments ADS8568 analog-to-digital converter (ADC) [17] and an Atmel SAMD21E18A microcontroller [18] are used to feed the sensor data to the PC for further processing and display. Each system part is explained in detail in the next subsection.

2.1. THz Triangulation Measurement Setup

The proposed layout of the measurement setup can be seen in Figure 1, which shows the source, two focal lenses, the sensor plane and the object of interest represented by a horizontal plane. THz illumination propagates in all directions, unlike a laser beam, and its direction is defined by the direction of the horn antenna at the end of the source. A focal lens is needed to focus the THz illumination on the object of interest and to focus the signal reflected from the object on the sensor plane.
In Figure 1a, the horizontal plane is in the mid vertical position and the signal is focused on it. With the proposed setup, the reflected signal is directed to the centre of the sensor plane. When the horizontal plane is shifted vertically, simulating the change of height of the observed object (which depends by the application), the focus position of the reflected THz signal on the sensor plane changes.
Figure 1b shows an example where the horizontal plane is raised vertically, closer to the source. Due to the setup and angle of incidence, the THz signal is reflected from a point closer to the source, compared to Figure 1a, so the reflected signal will hit the lens on the left side. In this case, the signal goes through the central part of the lens at a certain angle. Therefore, the signal is focused on a different part of the sensor plane and is further to the right, as in the case shown in Figure 1a.
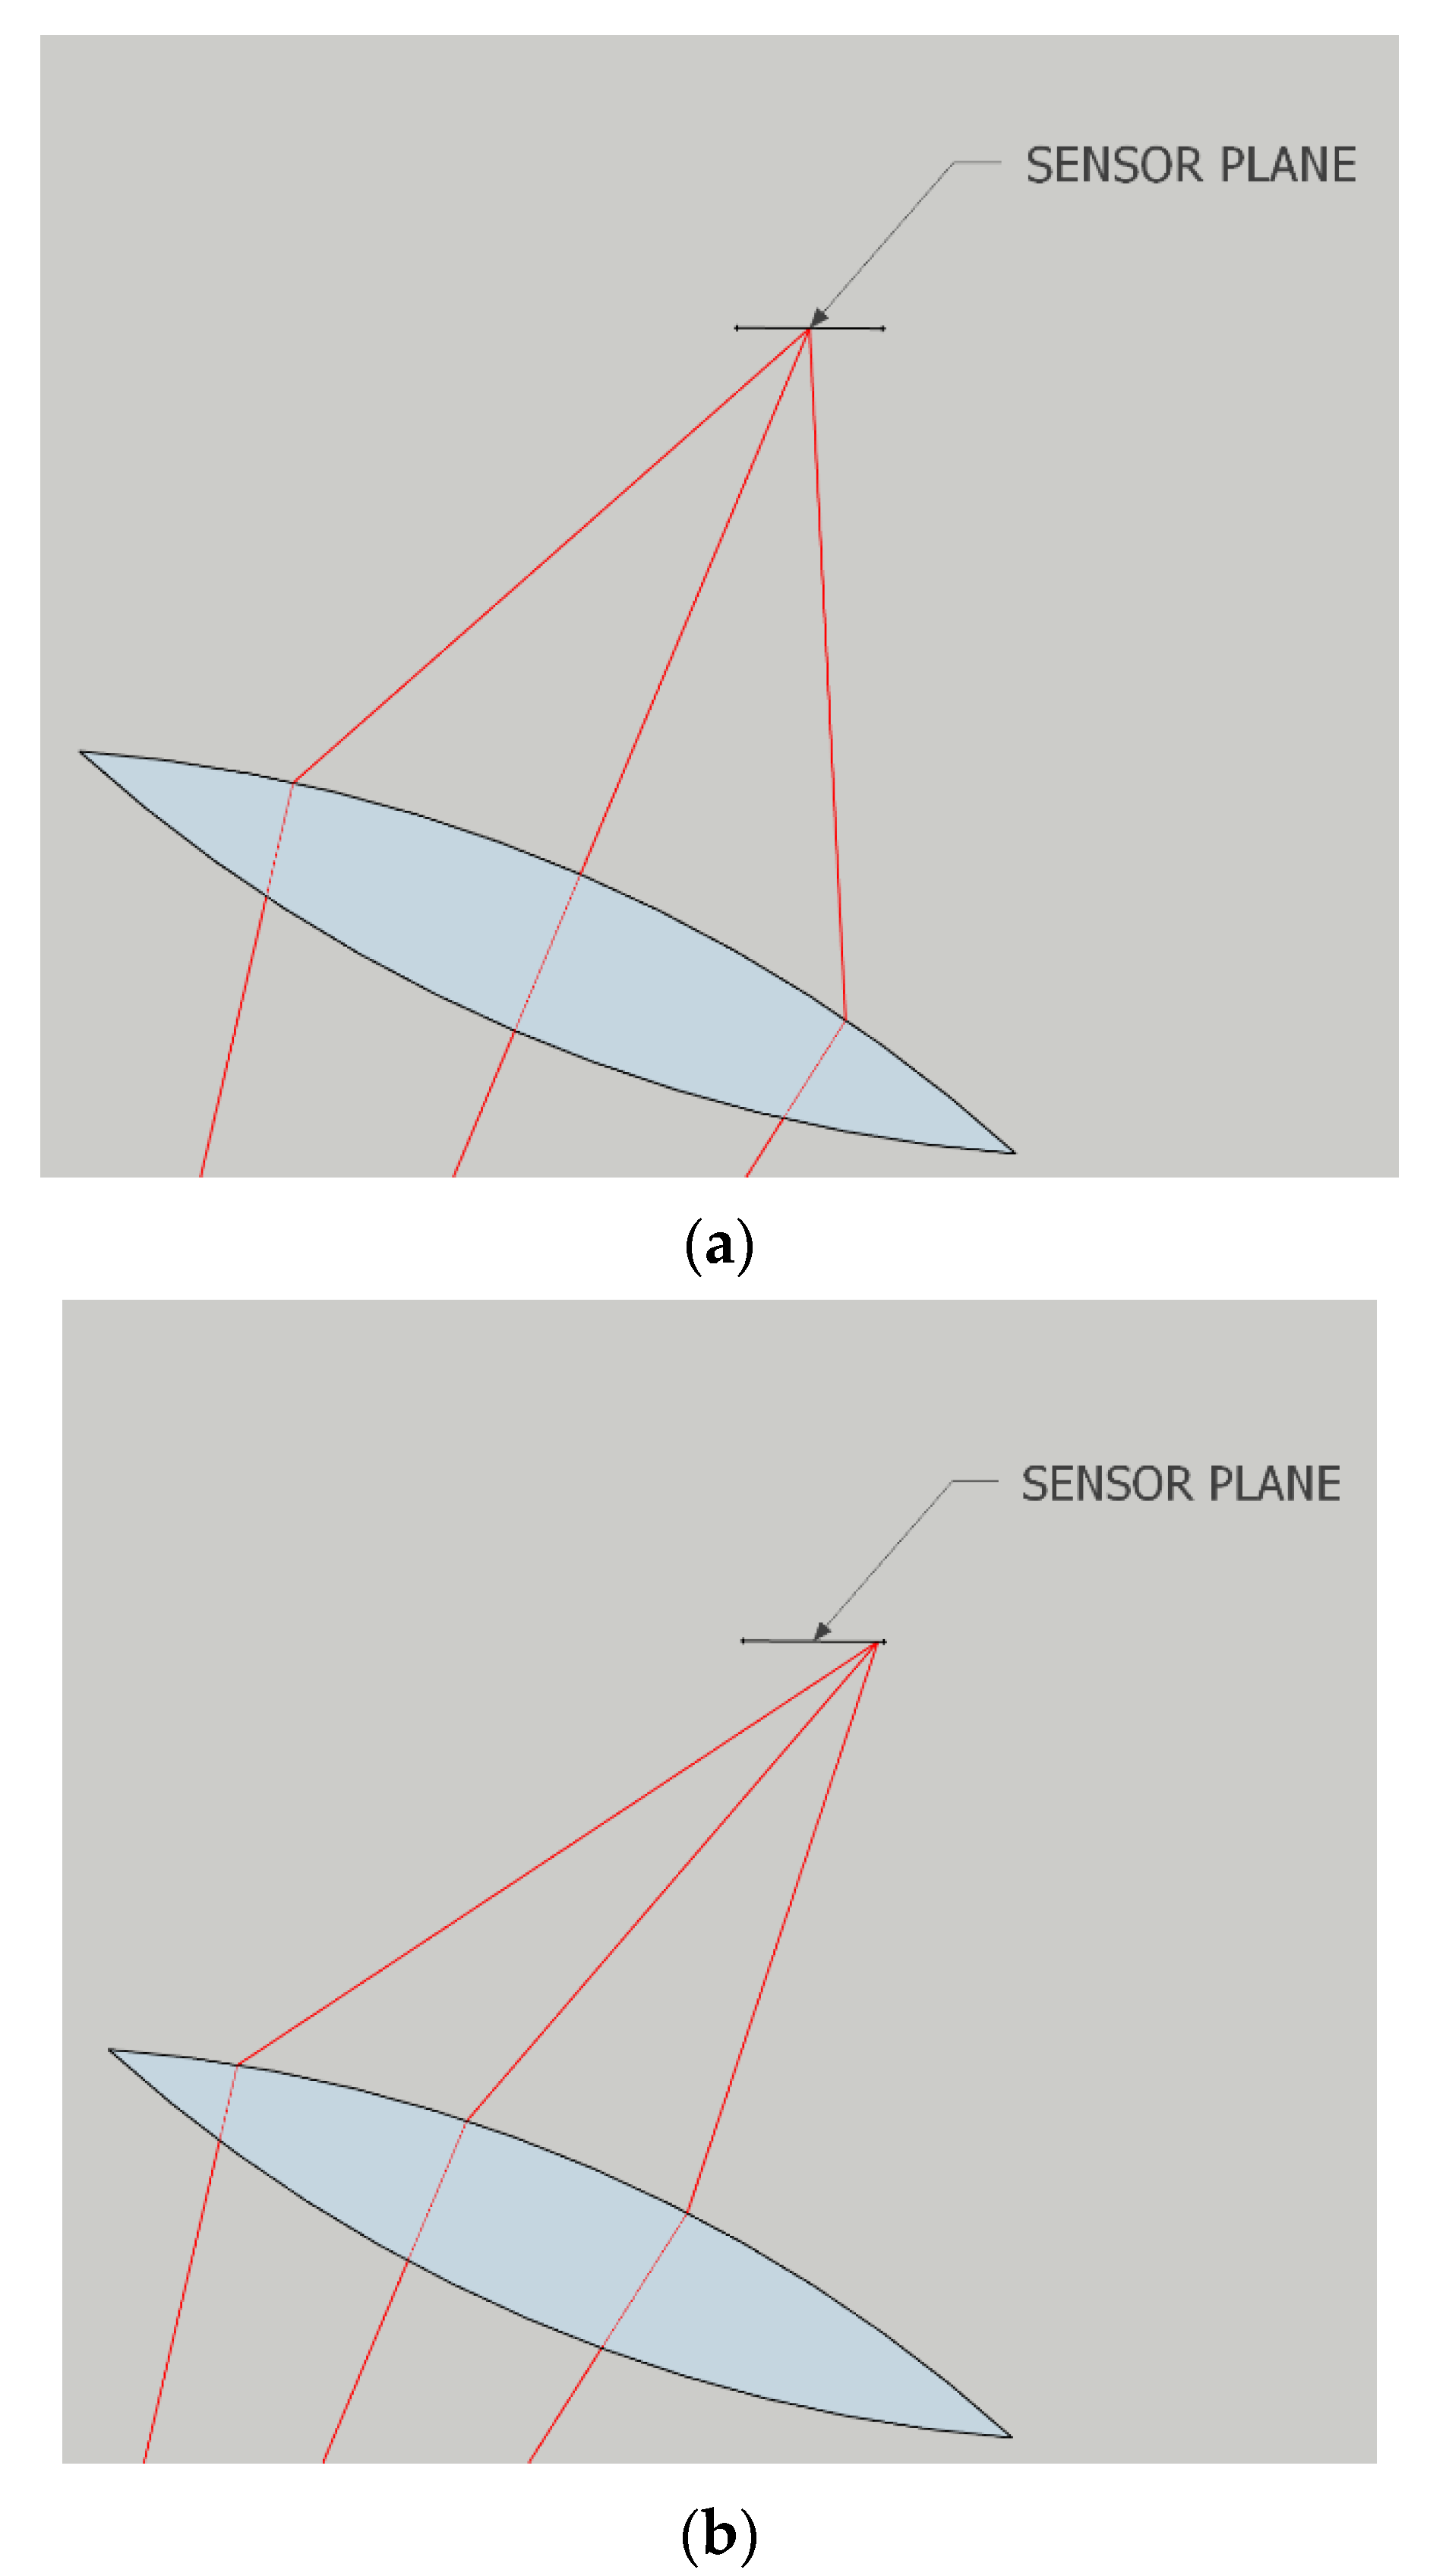
Similarly, if the horizontal plane is vertically further away from the THz source, as shown in Figure 1c, the reflected signal is horizontally further away from the source and, consequently, the reflected signal passes the lens further to the right part. As a result, the signal is focused on the left part of the sensor plane. A more detailed look at the sensor plane is shown in Figure 2.
When a series of sensors is used or the sensor plane is scanned with a single sensor, the proposed measurement setup can transfer the vertical/height detection of the observed object to the horizontal detection, where the focus of the received signal is on the sensor plane.

2.2. Structure of the THz System Layout and Devices Used

The schematic diagram of the experimental setup which corresponds with the proposed measurement setup from the previous sections can be seen in Figure 3.
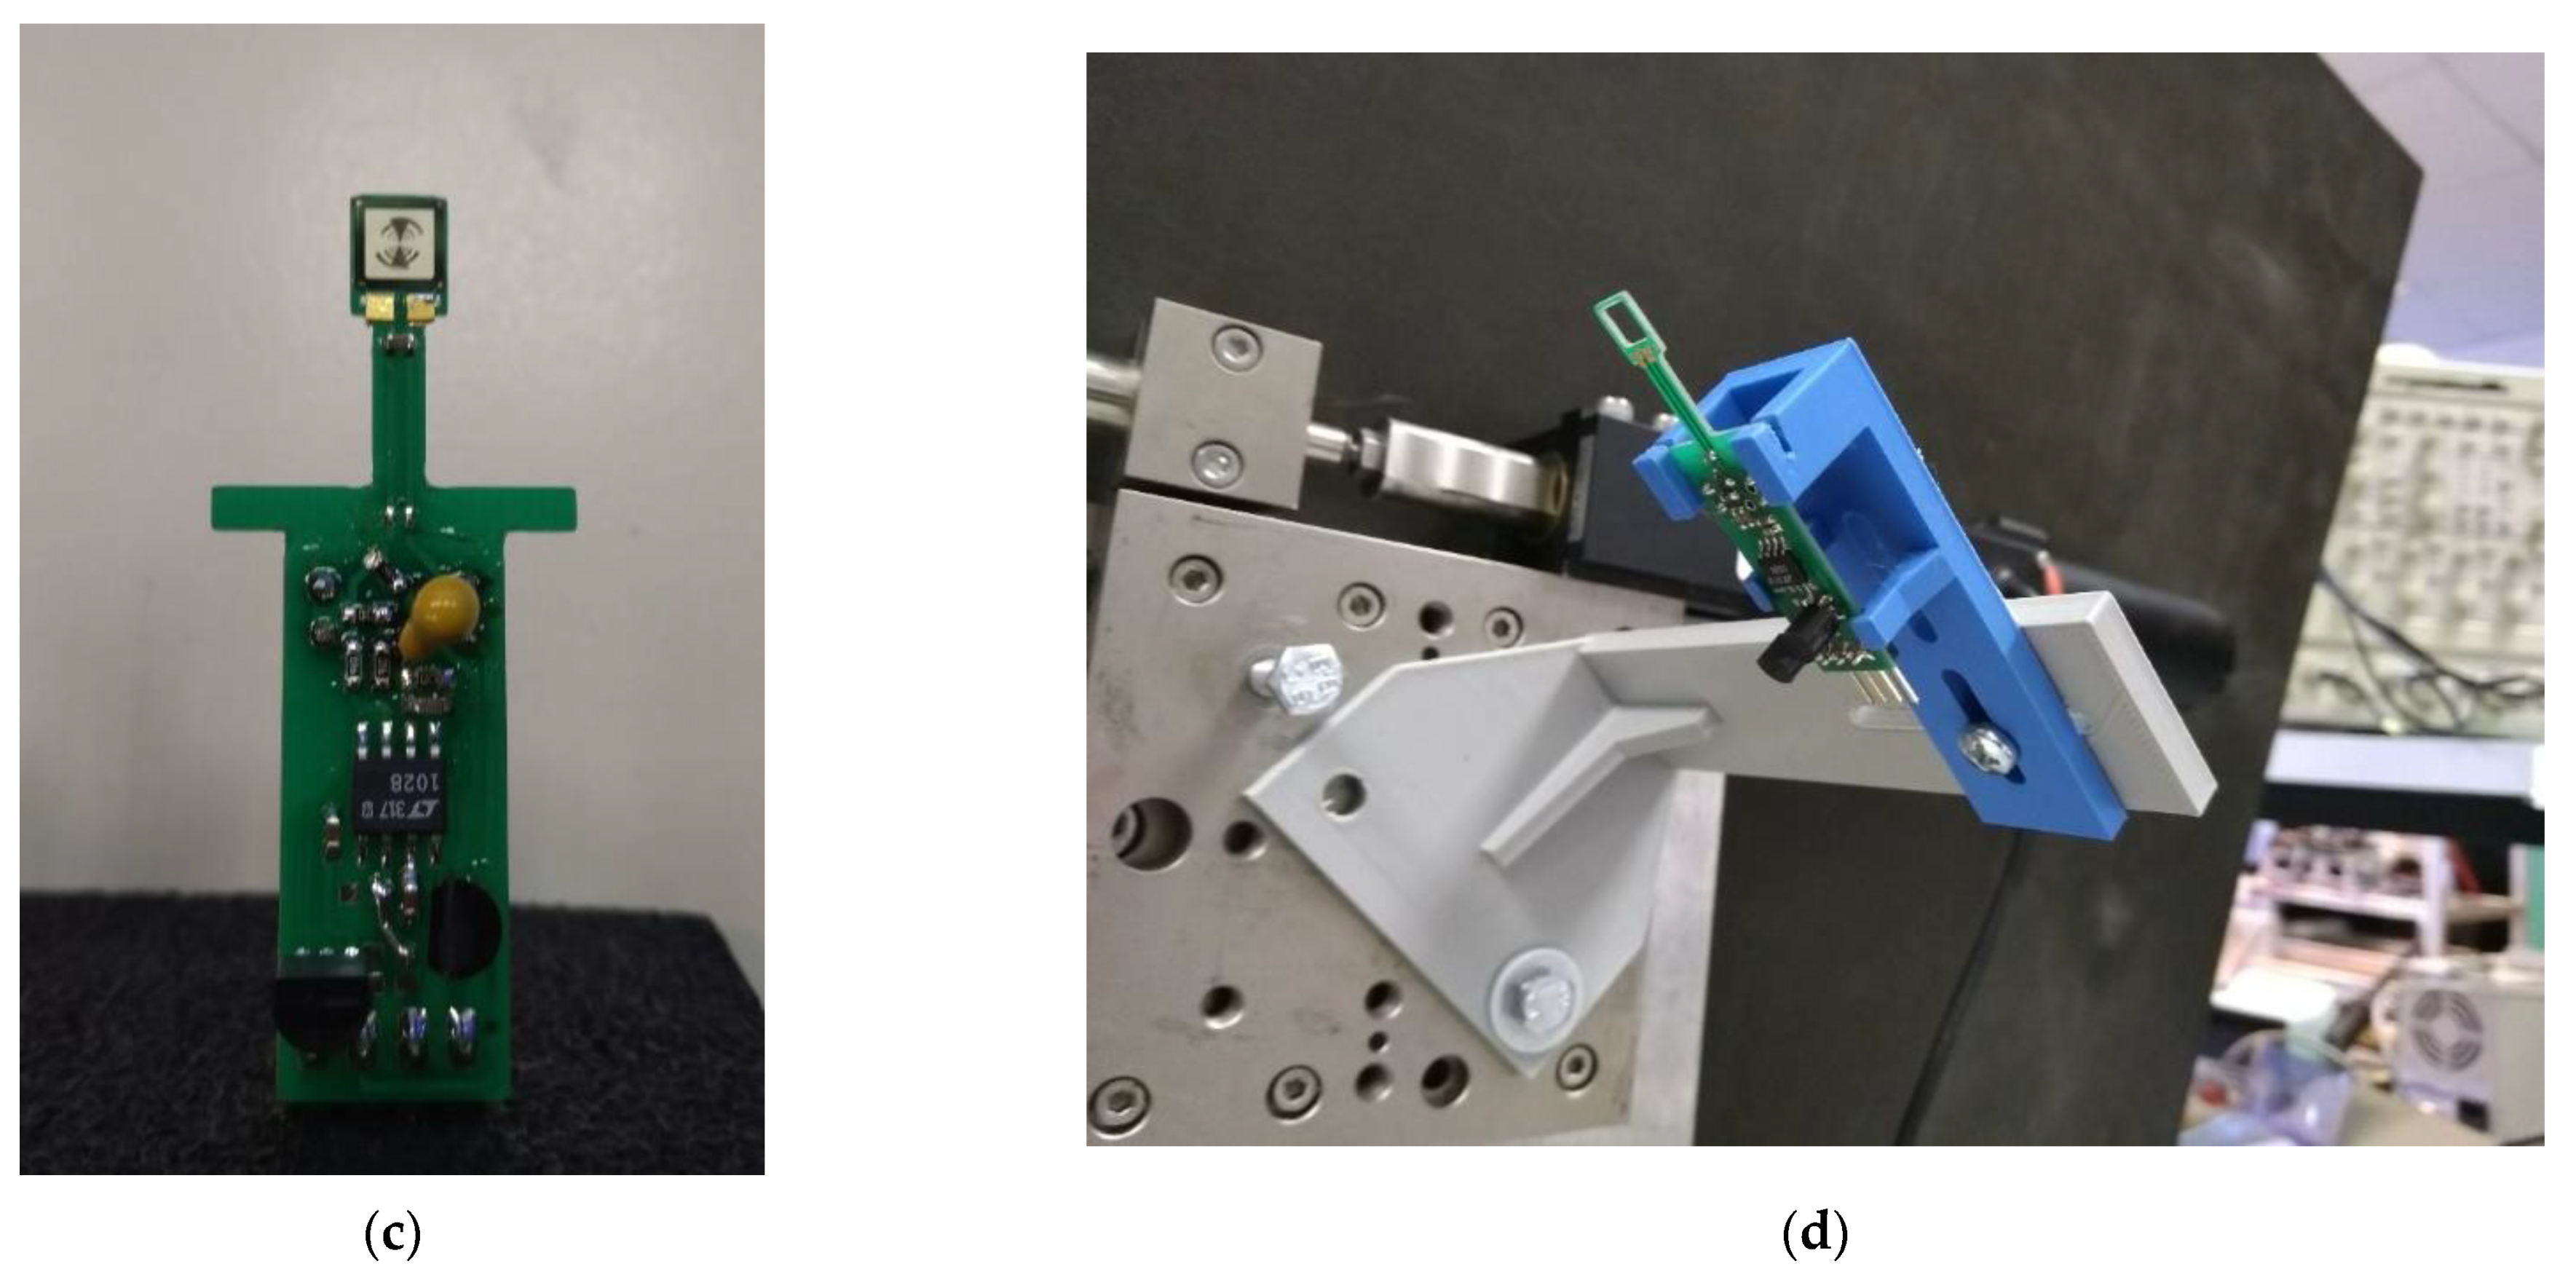
The THz source used was a Gunn diode source with a central frequency of 100 GHz and modulation frequency of 1 kHz, as shown in Figure 4a. The horn antenna, which is also part of the source system, was designed and fabricated in LMFE to direct the signal in the desired direction.
The focal lenses were represented by two polyethylene lenses [19]. The lens diameter was d = 70 mm and the focal point was f = 115 mm. The source and lens were mounted on a custom 3D-printed mount and then positioned on a tripod so that the height and angle of the source could be changed. The THz source has an additional lens holder to focus the illumination. The setup described can be seen in Figure 4b.
The sensing element in the measurement setup is a titanium-based broadband microbolometer coupled to an antenna. The main property of the microbolometer is the thermally dependent electrical resistance [20]. The antenna is tuned to a certain THz band, receives the incident wave power and transmits it to the microbolometer. The higher the electromagnetic signal power, the larger the thermal changes and the larger the resistance difference and, thus, higher voltage drop, on the element. The whole sensor is built on a silicon membrane [20] with the frame on a printed circuit board (PCB). The size of the sensor and antenna depends on the application and frequency range used. The membrane size is in the range from 2.5 × 2.5 to 5 × 5 mm. In the presented measurement setup, a broadband log-periodic antenna with a diameter of 3 mm fabricated on a 5 × 5 mm membrane was used. The sensor mounted on the PCB used can be seen on the upper part of the PCB in Figure 4c.
The sensor PCB consists of two voltage regulators, a LT1028 low noise operational amplifier (LNA) and passive elements. The sensor PCB is supplied with ±5 V, which is regulated by two voltage regulators. The output of the antenna-coupled titanium-based microbolometer is a 1 kHz analog signal. Due to the low frequency, no impedance matching was required for the input of the LNA. The LNA with a gain of 1000 is needed to amplify the output signal of the sensor (in the µV). This is required to achieve higher resolution using ADC.
A linear sampling method with a linear stepper motor from Thorlabs was used to simulate the sensor array. The maximum range of the stepper motor is 50 mm. The stepper motor and the sensor PCB on the holder can be seen in Figure 4d.
Data acquisition was performed using a custom-made PCB with the ADS8568 from Texas Instruments (ADC) and the Atmel SAMDE18A microcontroller (MCU) from Microchip. The sensor PCB and the data acquisition PCB were connected via a coaxial cable with a SubMiniature Version A (SMA) connector. The MCU controls data acquisition and conversion of the ADC and performs data synchronization with the PC via universal serial bus (USB).
To process and display the acquired sensor data on PC, National Instruments LabVIEW software was used. The LabVIEW program also controls the stepper motor and synchronizes the data acquisition with the stepper motor position.

2.3. The Scheimpflug Principle

Looking at the measurement setup proposed in Figure 1, it can be noticed that the optics are inclined and require the application of the Scheimpflug principle [21]. The Scheimpflug principle is a geometric rule that describes orientation of the focal plane of an optical system when the lens plane is not parallel to the image plane. The Scheimpflug principle can be seen in Figure 5.
Due to this principle, the lenses used are slightly tilted so that the focus is always on the sensor plane. The result of the incorrect use of Scheimpflug principle is more obvious for highly focused EM signals, such as lasers, than for the propagating waves in the THz range. Nevertheless, in the proposed setup, the Scheimpflug principle results in changes in the maximum signal intensity when scanning through the sensor plane.

3. Results

To test the proposed system layout, a level measurement experiment was conducted. In this section, the experiment and its results are presented.

Distance Measurement

The distance between the source and the aluminium plate was about 75 cm, which also corresponds to the distance between the sensor and the aluminium plate. The THz wave’s angle of incidence on the plate was 37°. The value of the angle is a compromise between the desired resolution and measurement range. As a result of the triangulation, a bigger angle of incidence means a better measuring resolution but smaller measuring range, and vice versa. The incidence angle was defined by some preliminary measurements to satisfy both the measurement range and resolution.
A distance manipulator was used to manually change the height of the plate. The measurement protocol consisted of 40 measurements per height with a sensor scanning step of 1 mm. The sampling rate of the system was 50 kHz with 5000 samples per position for data acquisition, so the minimal requirement was to stay at a position for at least 100 ms. Since a stable measurement was desired after the movement, a 500 ms delay was applied after each movement of the sensor to minimize vibrations. Therefore, additional noise in the signal caused by sensor vibrations was avoided.
All the data acquisition and signal processing were conducted on a 1 kHz signal. The signal acquisition time was 100 ms, which is enough for FFT calculations to obtain an accurate signal representation. Thus, the entire scanning process takes about 20 s for the whole 40 mm scanning range, with the acquisition of one sample per 1 mm step. For the measurement concept test, long acquisition time was not an issue. It was assumed that the system will be used in applications where the observed surface distance to the THz system will not change drastically in the few seconds of measurement.
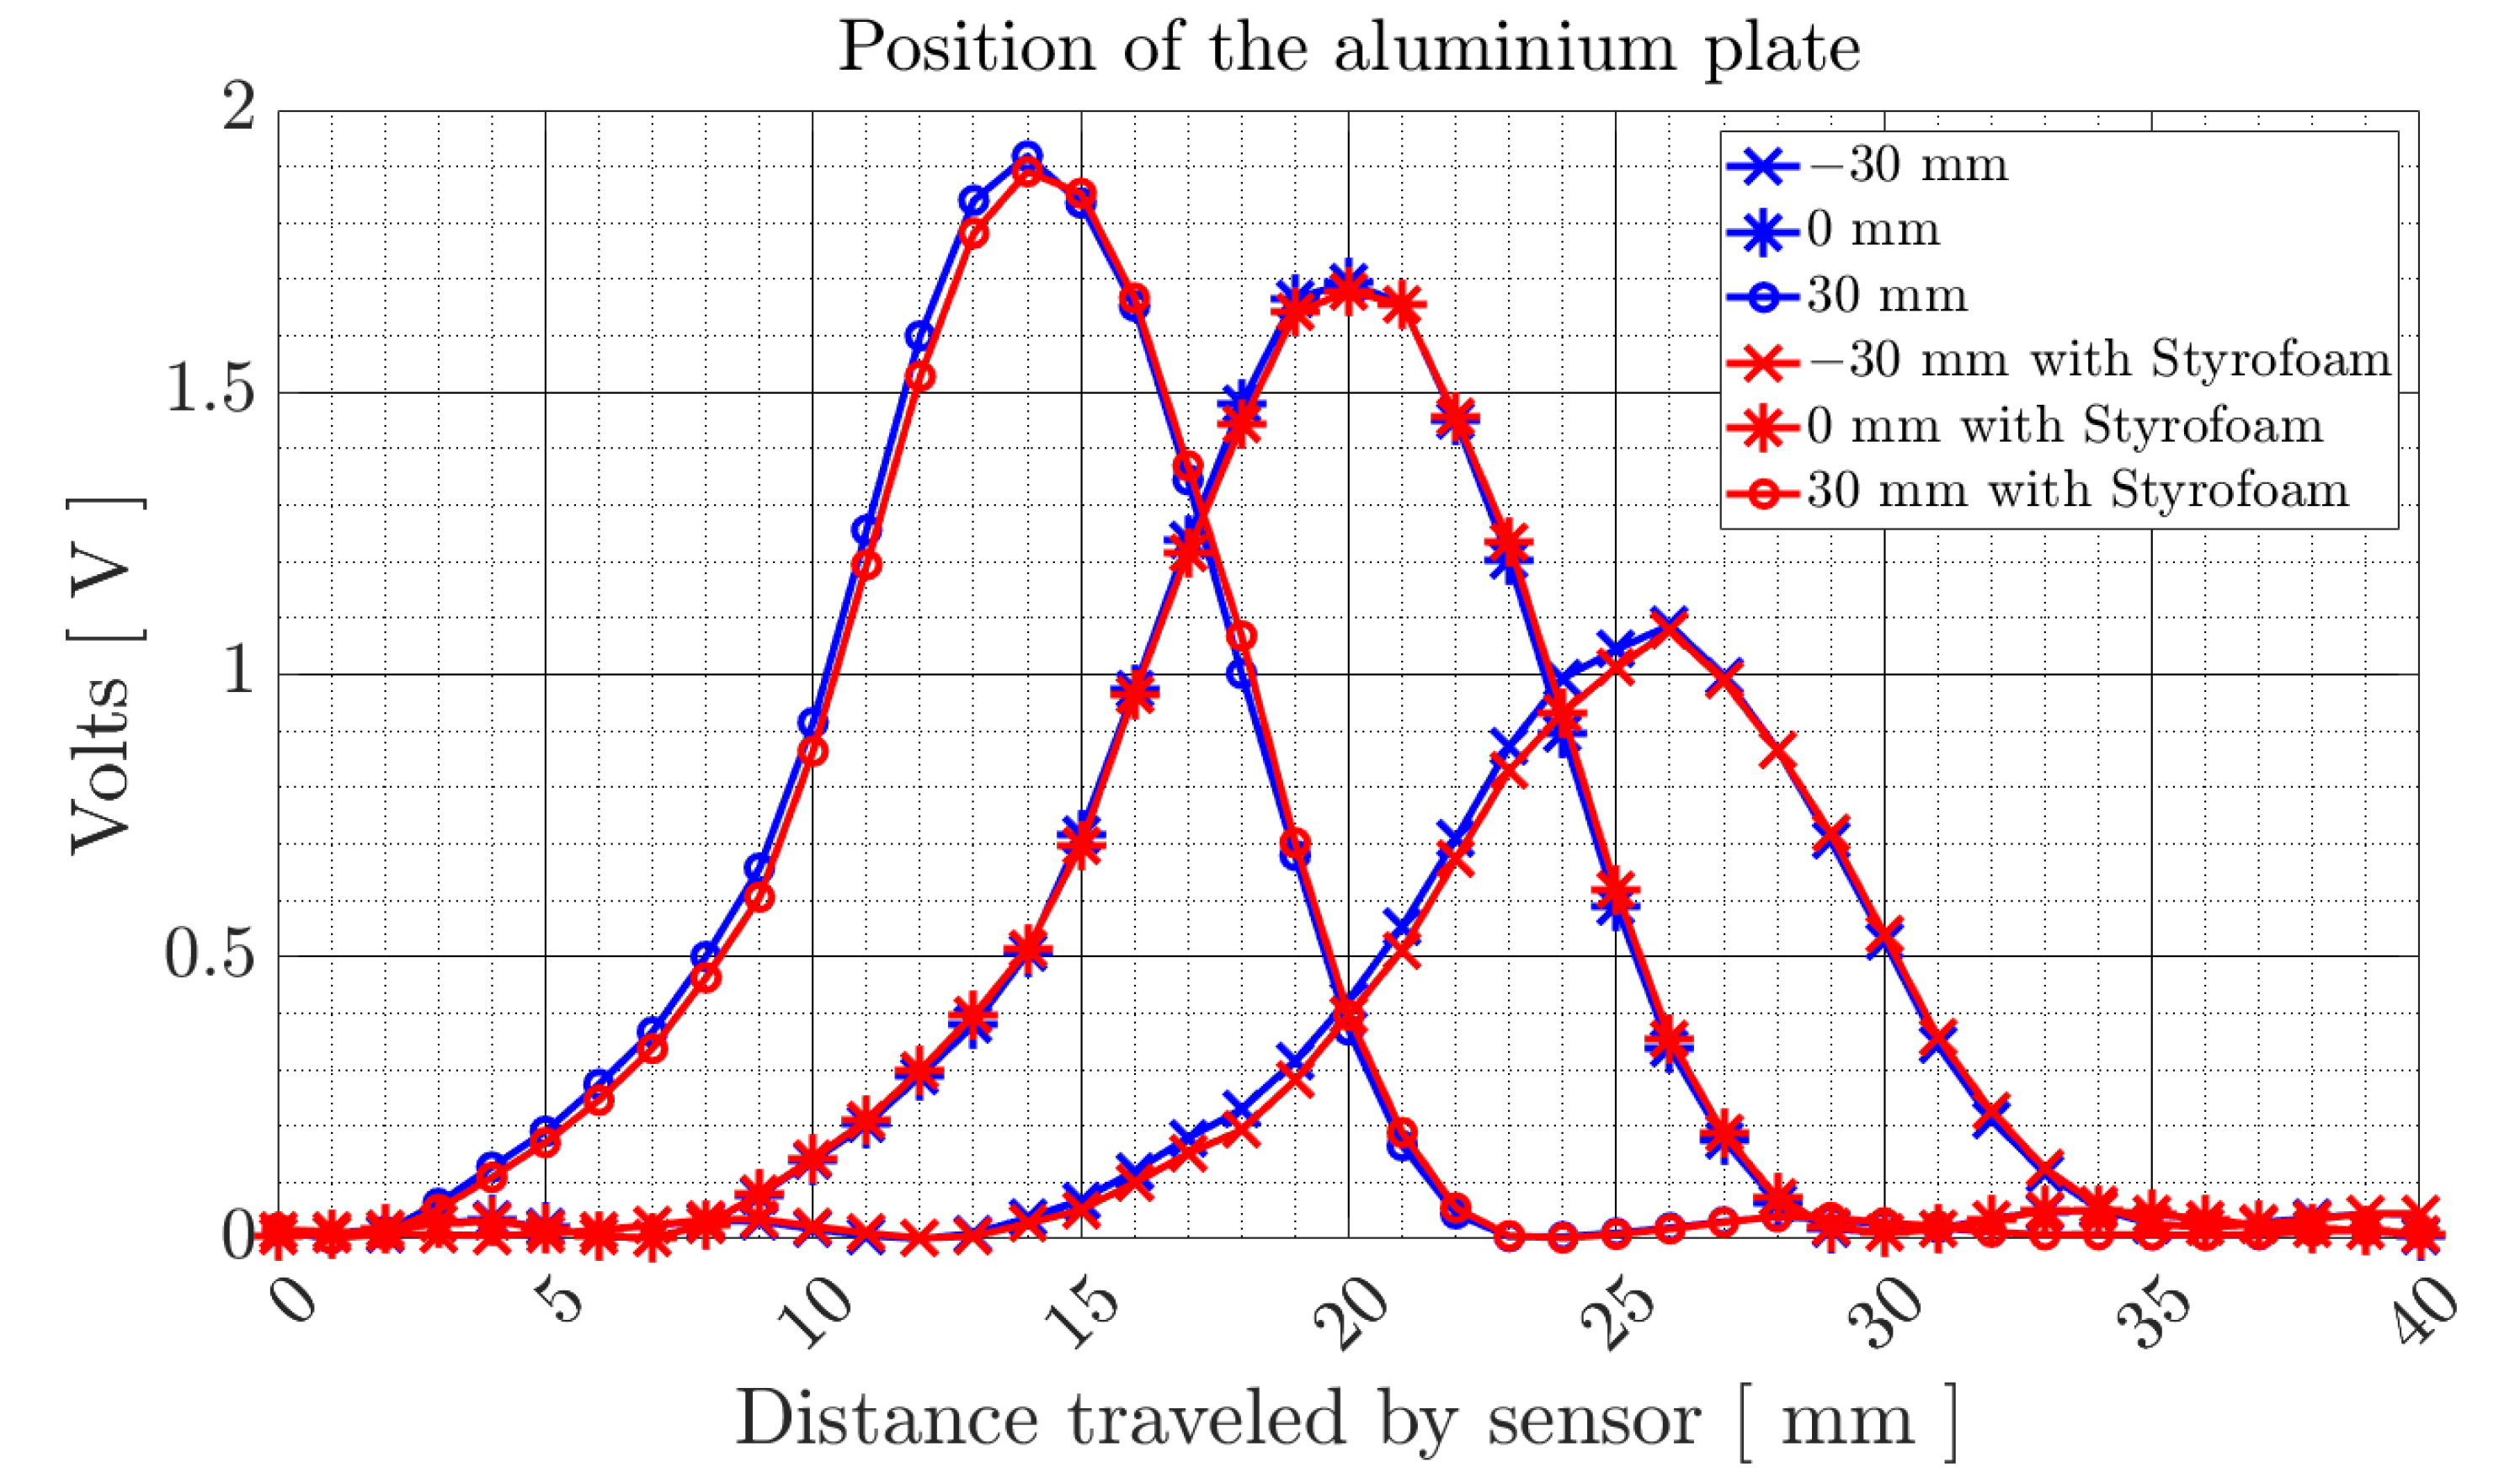
After the completed scanning process, the vertical plane of the plate was changed for 5 mm and the measurement was repeated. This protocol was repeated 12 times, resulting in 12 different vertical aluminium plate levels. Additional measurements were taken with additional 5 cm Styrofoam covers and with the same measurement protocol. As expected, Styrofoam did not influence the measurement. The results of the starting vertical height, maximum vertical height and minimal vertical height measurement with and without Styrofoam covering can be seen in Figure 6.
In Figure 6, the signal labelled 0 mm represents the initial plate level (as shown in Figure 1a). The signal labelled with −30 mm represents a lifted plate (as shown in Figure 1b) for 30 mm and the signal labelled 30 mm represents a lowered plate for 30 mm (as shown in Figure 1c). The x-axis represents the distance travelled by the sensor, 0 mm represents the closest point and 40 mm represents the point furthest from the source. Each marked point on the resulting curve represents a measurement during scanning.
From the results shown in Figure 6, how the level of the plate affects the measurement and that the maximum amplitude of the THz illuminations changes along the scan line can be understood. The results confirm the presentation of the measurement setup described in the previous section. When the plate was vertically higher and the travelled distance of the THz signal was shorter (label −30 mm), the lens focused the signal on the point of distance travelled by the sensor of about 26 mm. When the plate was lower and the travelled distance of the THz signal was longer (label 30 mm), the lens focused the signal on a point of the distance travelled by the sensor of about 14 mm. When the plate was at the initial reference position (label 0 mm), the lens focused the signal on the sensor whose scanning distance was at about 20 mm.
The displacement of the maximum vertical height and minimal vertical height measurement corresponds to about 12 mm scanning distance difference. This results in a ±2.5 mm resolution of the distance measurement at the scanning step of 1 mm.
The difference from the reference position can be seen in the signal peak amplitude. This is due the fact that the focus is not perfect because of the change of the travelled distance of the THz signal. All the positions of the sensor PCB, lenses and THz source were set by an operator, and human error mainly contributed to the difference in amplitude.
The measurement with Styrofoam cover is an easy display of the THz measurement’s method ability to replace laser position measurement, which does not penetrate into Styrofoam or other visible light opaque materials. This is especially important in environments where thick fog/gas could be present and a laser light has difficulties with the distance measurement, which leads to an error in industrial processes.
Furthermore, the usage of other materials instead of a metal plate for distance measurement in this research is redundant. If, for example, water, mirror or any other reflective material were to be used instead of a metal plate, the position measurement would be the same. The only difference would be in the amplitude of the signal, which is defined by the reflective index of the material.

4. Discussion and Conclusions

In this paper, the method and setup for concealed target position monitoring using a THz system is presented. The vertical level height of the obscured target object was successfully determined using an AM THz system, where the laser technology could not or where it had problems. When the resolution of the proposed method is compared with the resolution of a commercially available FMCW method, comparable results are obtained. The resolution of the FMCW sources depends on the bandwidth used, using the equation ΔR = c/2B, where ΔR is the resolution of the FMCW system, c is the speed of light and B is the bandwidth of the system. For example, the-state-of the-art FMCW sources with 40 GHz bandwidth have a measurement resolution of ±1.875 mm. The results of the resolution of the AM system depend on the measurement setup. With the change in the angle of incidence, the same or better resolution as the FMCW source can be achieved, but for the cost of the smaller measurement range. Furthermore, the AM method is less efficient due to the limited scanning range. The FMCW method has a measuring range of 10 m to 100 m, while the AM method with the proposed setup has a relative range of ±10 cm around the reference point.
Nevertheless, the AM method has the potential to be used in applications where the area of interest is small and the budget of the system is an important factor. An array of sensors is planned to be used in the current scanning system, and future investigations of the proposed measurement method will be carried out.

Author Contributions

Conceptualization, funding acquisition, and supervision, J.T.; methodology, software, formal analysis and writing original draft preparation, T.K.; writing—review and editing, T.K., A.Š. and J.T. All authors have read and agreed to the published version of the manuscript.

Funding

This research received no external funding.

Institutional Review Board Statement

Not applicable.

Informed Consent Statement

Not applicable.

Data Availability Statement

The data used in this article is reported in the paper’s figures.

Acknowledgments

The authors thank the Slovenian Research Agency (ARRS) for their support.

Conflicts of Interest

The authors declare no conflict of interest.

References

  1. Mittleman, D. (Ed.) Sensing with THZ Radiation; Springer: Berlin/Heidelberg, Germany, 2003. [Google Scholar]
  2. Lee, Y.-S. Principles of Terahertz Science and Technology; Springer: Berlin/Heidelberg, Germany, 2009. [Google Scholar]
  3. Andreeva, V.A.; Esaulkov, M.; Kosareva, O.; Makarov, V.; Panov, N.; Shipilo, D.; Shkurinov, A.; Solyankin, P. Spectrum and polarization of THz radiation from two-color femtosecond laser breakdown: Theory and experiment. In Proceedings of the 2015 40th International Conference on Infrared, Millimeter, and Terahertz Waves (IRMMW-THz), Hong Kong, China, 23–28 August 2015; pp. 1–2. [Google Scholar] [CrossRef]
  4. Gollner, C.; Vogel, T.; Shalaby, M.; Wulf, F.; Saraceno, C.J. Efficient Broadband Terahertz Generation in BNA Organic Crystals at Ytterbium Laser Wavelength. In Proceedings of the 2020 45th International Conference on Infrared, Millimeter, and Terahertz Waves (IRMMW-THz), Buffalo, NY, USA, 8–13 November 2020; pp. 1–2. [Google Scholar] [CrossRef]
  5. Zhang, J.; Tuo, M.; Gehl, M.; Gibson, R.; Liang, M.; Khitrova, G.; Xin, H. Terahertz emission from photoconductive antenna fabricated on GaAs/Sapphire substrate. In Proceedings of the 2015 9th European Conference on Antennas and Propagation (EuCAP), Lisbon, Portugal, 13–17 April 2015; pp. 1–2. [Google Scholar]
  6. Tian, J.-S.; Dong, T.-L.; Shi, J.; Chen, J.-W.; Guo, W. The study of some key technologies for a compact Terahertz Source Based on Free Electron Lasers. In Proceedings of the 2007 Joint 32nd International Conference on Infrared and Millimeter Waves and the 15th International Conference on Terahertz Electronics, Cardiff, UK, 3–7 September 2007; pp. 251–252. [Google Scholar] [CrossRef]
  7. Trontelj, J.; Sešek, A.; Švigelj, A. THz technology for vision systems. Facta Univ. Ser. Electron. Energ. 2014, 27, 129–136. [Google Scholar] [CrossRef] [Green Version]
  8. Brinkmann, S.; Vieweg, N.; Gärtner, G.; Plew, P.; Deninger, A. Towards quality control in pharmaceutical packaging: Screening folded boxes for package inserts. In Proceedings of the 2016 41st International Conference on Infrared, Millimeter, and Terahertz Waves (IRMMW-THz), Copenhagen, Denmark, 25–30 September 2016; pp. 1–2. [Google Scholar]
  9. Trontelj, J.; Maček, M.; Sešek, A.; Švigelj, A. Uncooled THz System for Hidden Object Detection. In Proceedings of the International Terahertz Conference 2011, Villach, Austria, 24–25 November 2011; pp. 41–47. [Google Scholar]
  10. Švigelj, A.; Sešek, A.; Kašalynas, I.; Valušis, G.; Trontelj, J. Portable solid state CW THz radar system for industrial applications. In Proceedings of the 2014 39th International Conference on Infrared, Millimeter, and Terahertz Waves (IRMMW-THz), Tucson, AZ, USA, 14–19 September 2014; pp. 1–2. [Google Scholar]
  11. Komarov, I.V.; Smolskiy, S.M. Fundamentals of Short-Range FM Radar; Artech House: New York, NY, USA, 2003. [Google Scholar]
  12. IWR1443 Single-Chip 76-GHz to 81-GHz mm Wave Sensor Evaluation Module. Available online: https://www.ti.com/tool/IWR1443BOOST (accessed on 17 November 2021).
  13. Dobroiu, A.; Wakasugi, R.; Shirakawa, Y.; Suzuki, S.; Asada, M. Absolute and Precise Terahertz-Wave Radar Based on an Amplitude-Modulated Resonant-Tunneling-Diode Oscillator. Photonics 2018, 5, 52. [Google Scholar] [CrossRef] [Green Version]
  14. Kumar, S.; Tiwari, P.K.; Chaudhury, S.B. An optical triangulation method for non-contact profile measurement. In Proceedings of the 2006 IEEE International Conference on Industrial Technology, Mumbai, India, 15–17 December 2006; pp. 2878–2883. [Google Scholar] [CrossRef]
  15. Kasaynas, I.; Švigelj, A.; Adamonis, J.; Kornijcuk, V.; Adomavičius, R.; Krotkus, A.; Valušis, G.; Sešek, A.; Pavlovič, L.; Trontelj, J. Performance of the Antenna Coupled Microbolometers Characterized by the Quasi-Optical Measurements at Frequencies 0.1–1.0 THz. In Proceedings of the 38th International Conference on Infrared, Millimeter and Terahertz Waves IRMMW-THz 2013, Mainz on the Rhine, Germany, 1–6 September 2013; pp. 1–2. [Google Scholar]
  16. Thorlabs. 50 mm Stepper Motor Drive. Available online: https://www.thorlabs.com/thorproduct.cfm?partnumber=DRV250 (accessed on 17 November 2021).
  17. 16-Bit, 8-Channel, Simultaneous-Sampling, Bipolar-Input, SAR Analog-to-Digital Converter (ADC). Available online: https://www.ti.com/product/ADS8568 (accessed on 17 November 2021).
  18. SAM D21/DA1 Family Low-Power, 32-Bit Cortex-M0+ MCU with Advanced Analog and PWM. Available online: https://ww1.microchip.com/downloads/en/DeviceDoc/SAM_D21_DA1_Family_DataSheet_DS40001882F.pdf (accessed on 17 November 2021).
  19. Lo, Y.H.; Leonhardt, R. Aspheric lenses for Terahertz imaging. In Proceedings of the 2008 Conference on Lasers and Electro-Optics and 2008 Conference on Quantum Electronics and Laser Science, San Jose, CA, USA, 4–9 May 2008; pp. 1–2. [Google Scholar]
  20. Sešek, A.; Berčan, D.; Gradišek, M.; Švigelj, A.; Trontelj, J. A THz Receiver with Novel Features and Functionality. Sensors 2018, 18, 3793. [Google Scholar] [CrossRef] [PubMed] [Green Version]
  21. Yang, X.; Shao, C.; Zhang, C.; Fang, Z.; Yang, G.; Xiao, J. Tilted optics in 3D vision inspection systems—Case study. In Proceedings of the 2018 13th IEEE Conference on Industrial Electronics and Applications (ICIEA), Wuhan, China, 31 May–2 June 2018; pp. 1128–1133. [Google Scholar] [CrossRef]
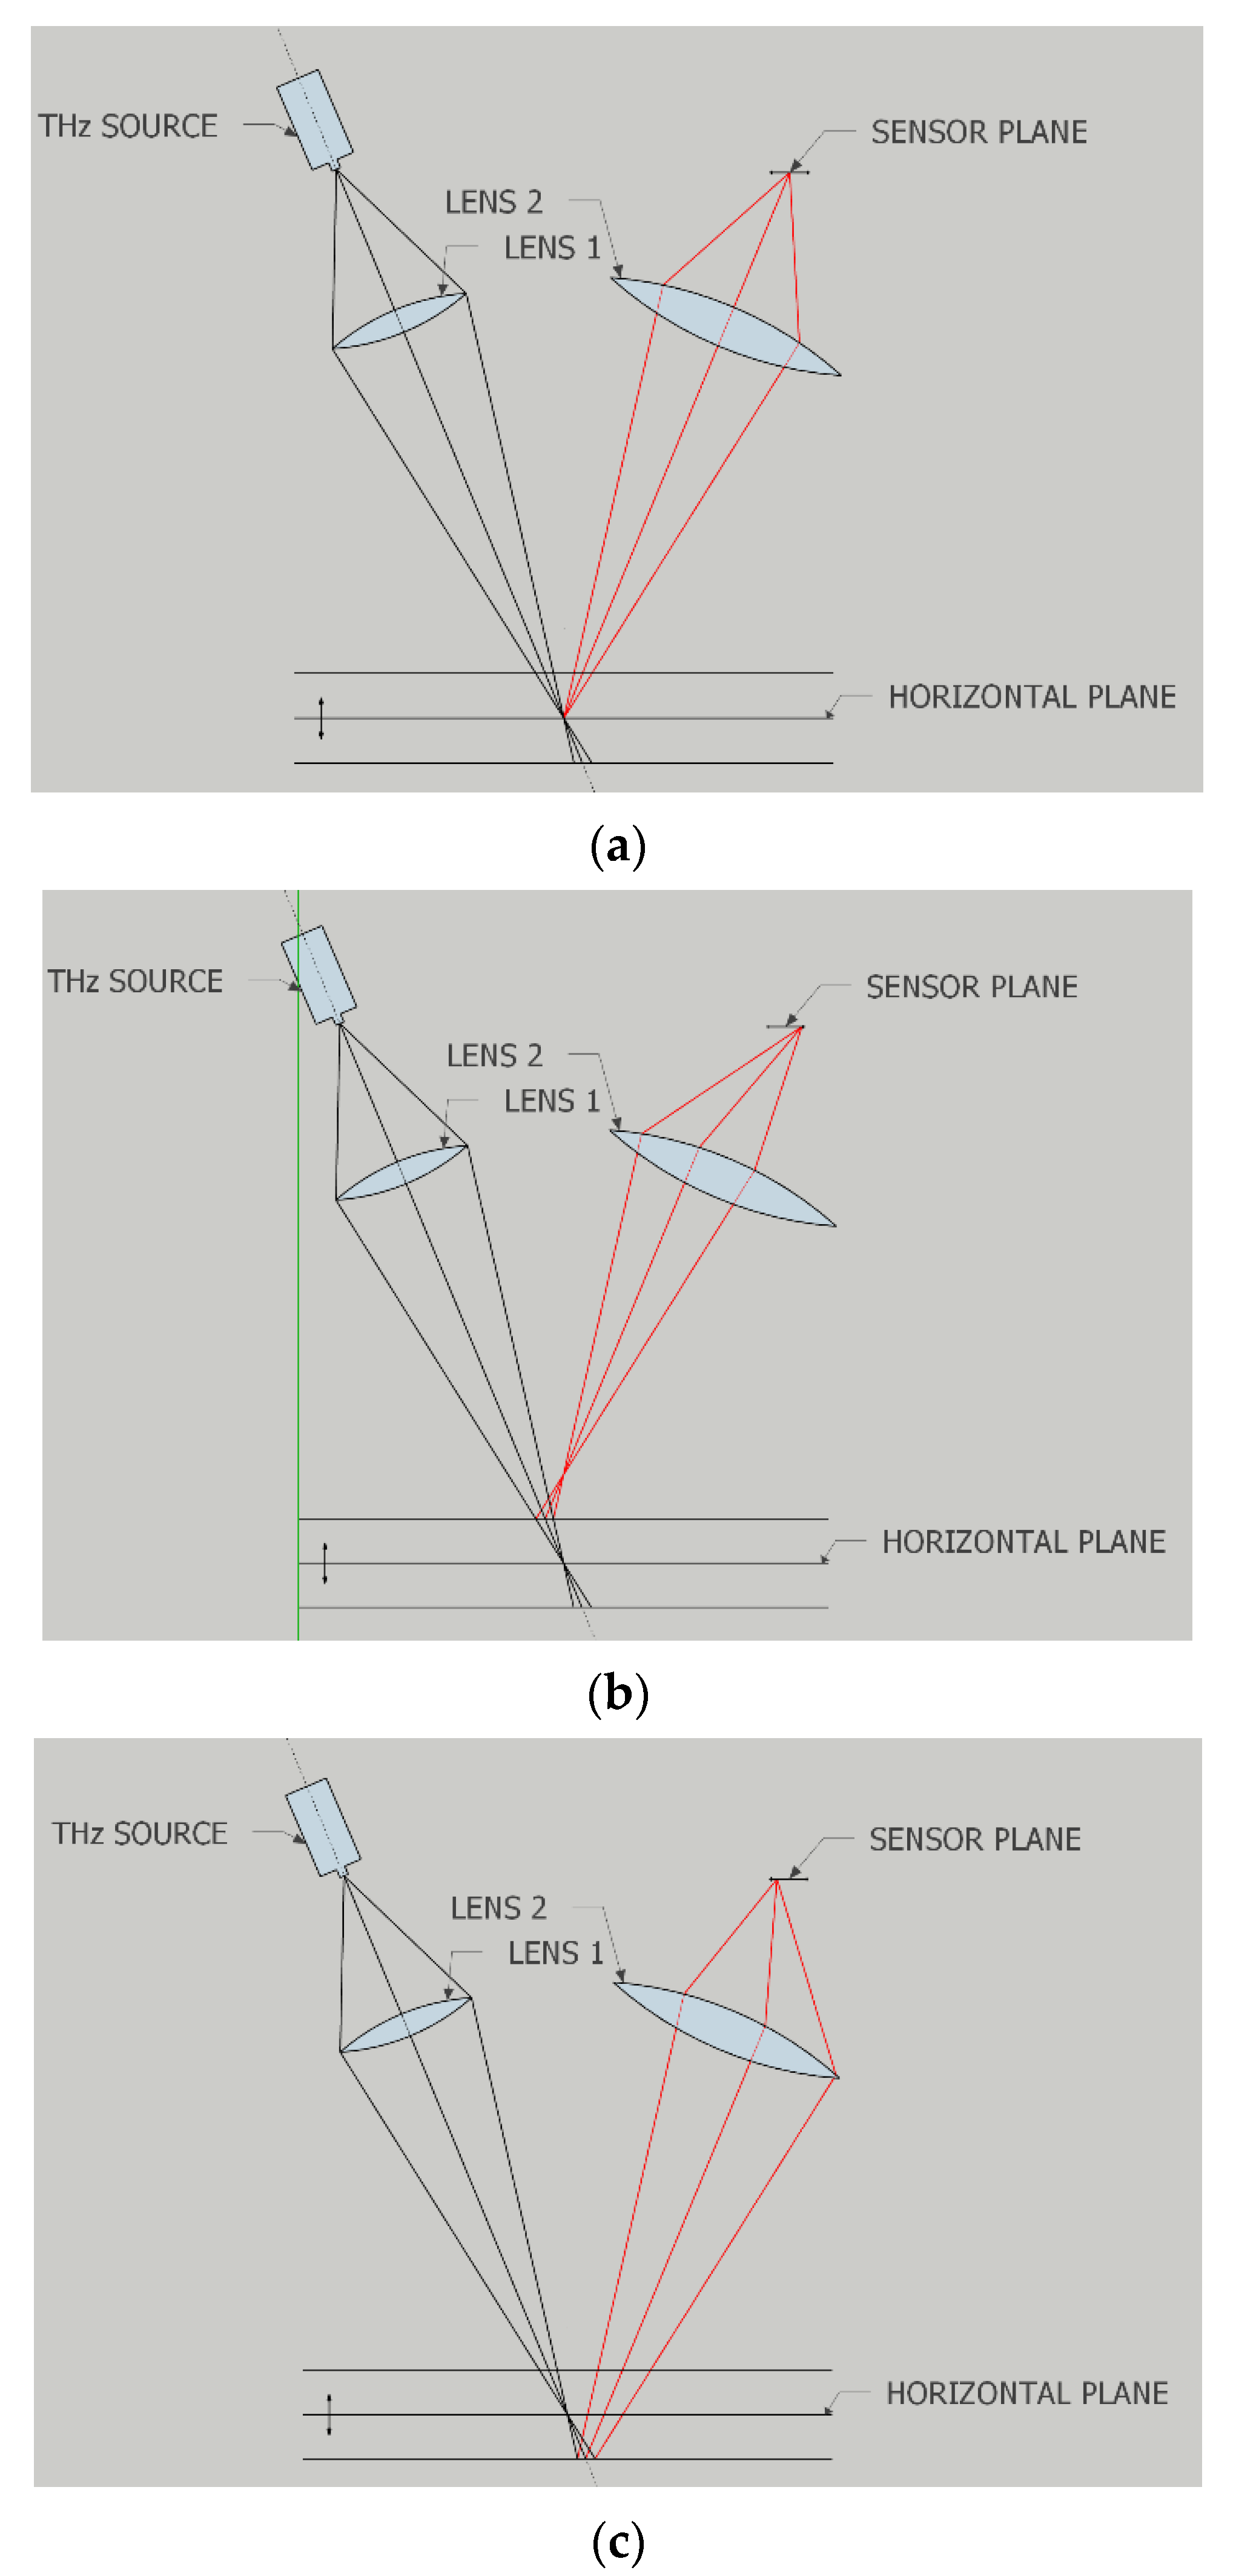
Figure 1. The proposed layout of the measurement setup: (a) THz signal propagation when the horizontal plane is in the middle position; (b) THz signal propagation when the horizontal plane is raised vertically; (c) THz signal propagation when the horizontal plane is lowered vertically.
Applsci 12 01439 g001
Figure 2. Zoom of the proposed measurement layout. Propagation of the THz signal when the horizontal plane is in the: (a) middle position, (b) raised vertically, and (c) lowered vertically.
Applsci 12 01439 g002aApplsci 12 01439 g002b
Figure 3. Schematic diagram of the experimental setup.
Applsci 12 01439 g003
Figure 4. Instruments used: (a) AM-THz source with Gunn diode and attached horn antenna, (b) AM-THz source and lens holder, (c) Sensor PCB, and (d) Sensor PCB holder with linear motor.
Applsci 12 01439 g004aApplsci 12 01439 g004b
Figure 5. Demonstration of the Scheimpflug principle.
Applsci 12 01439 g005
Figure 6. Results of the vertical level detection of the aluminium plate with or without Styrofoam covering.
Applsci 12 01439 g006
Publisher’s Note: MDPI stays neutral with regard to jurisdictional claims in published maps and institutional affiliations.