Article

A Comparative Analysis of Novel Biomarkers in Sepsis and Cardiovascular Disease

1
Department of Internal Medicine II, Division of Cardiology, Paracelsus Medical University of Salzburg, 5020 Salzburg, Austria
2
Department of Internal Medicine I, Division of Cardiology, Angiology, Pneumology and Intensive Medical Care, University Hospital Jena, Friedrich Schiller University Jena, 07743 Jena, Germany
3
Department of Internal Medicine II, Elisabeth Hospital Schmalkalden, 98574 Schmalkalden, Germany
4
Department of Internal Medicine III, University Hospital Halle (Saale), 06120 Halle (Saale), Germany
5
Department of Cardiology I—Coronary and Peripheral Vascular Disease, Heart Failure, University Hospital Muenster, 48149 Münster, Germany
6
Department for Medicine II, Catholic Hospital, St. Johann Nepomuk, 99097 Erfurt, Germany
*
Author to whom correspondence should be addressed.
These authors contributed equally to this work.
Appl. Sci. 2022, 12(3), 1419; https://doi.org/10.3390/app12031419
Submission received: 22 September 2021 / Revised: 9 January 2022 / Accepted: 19 January 2022 / Published: 28 January 2022

Abstract

:
(1) Background: Sepsis still represents a major health care challenge, with mortality rates exceeding 25% in the western world. To further improve outcomes in this patient collective, new cardiovascular biomarkers present a promising opportunity as they target the paramount prognostic processes in sepsis: inflammation and ischemia. However, in contrast to cardiovascular diseases, a detailed analysis of novel biomarkers in sepsis is still lacking. (2) Objective: In this project, we aimed to perform a comparative analysis of biomarker levels in ischemic cardiovascular disease and sepsis. Analyzed markers comprised soluble suppression of tumorigenicity 2 (sST2; hemodynamics and inflammation), growth-differentiation factor 15 (GDF-15; injury, remodelling), soluble urokinase-type plasminogen activator receptor (suPAR; inflammation and remodeling) and heart-type fatty acid binding protein (H-FABP; myocardial ischemia). (3) Methods: In total, 311 patients were included in the study: 123 heart-failure (HF) patients, 60 patients with ST-segment elevation myocardial infarction (STEMI) and 53 sepsis patients. A total of 75 patients without coronary artery disease or signs of heart failure served as a control group. Plasma samples were analyzed by use of ELISA after informed consent. (4) Results: Patients with sepsis showed significantly increased plasma levels in all tested biomarkers compared to cardiovascular disease entities (sST2, suPAR, GDF-15: p < 0.001; H-FABP: compared to HF p < 0.001) and controls (sST2: 7.4-fold, suPAR: 3.4-fold, GDF-15: 6.5-fold and H-FABP: 15.3-fold increased plasma levels, p < 0.001). Moreover, in patients with sepsis, serum concentrations of sST2 and suPAR were significantly elevated in patients with HF and patients with STEMI (sST2: HF: 1.6-fold increase and STEMI: 2.5-fold increase, p < 0.001; suPAR: HF: 1.4-fold increase, p < 0.001 and STEMI: 1.4-fold increase, p < 0.01), whereas plasma levels of GDF-15 and H-FABP were markedly elevated in patients with STEMI only (GDF-15: 1.6-fold increase, H-FABP: 6.4-fold increase, p < 0.001). (5) Conclusions: All tested novel cardiac biomarkers showed significantly elevated levels in sepsis patients. Interestingly, a secretion pattern similar to STEMI was observed with regards to sST2 and HFABP. Thus, by providing an assessment tool especially covering the cardiovascular component of the disease, novel biomarkers offer a promising tool in sepsis patients.

1. Introduction

Sepsis still represents a major health care challenge, with mortality rates exceeding 25% in Europe [1]. It is defined as a “life-threatening organ dysfunction caused by a dysregulated host response to infection”. Septic shock is described as a “subset of sepsis in which underlying circulatory and cellular/metabolic abnormalities are profound enough to substantially increase mortality”, according to the current consensus statement (Sepsis-3) [2]. Due to the high prevalence and death rate, as well as the cost-intensive treatment (which involves ventilation, hemofiltration, extracorporal membrane oxygenation (ECMO) and circulatory support, among others), sepsis also constitutes a major economic factor [3,4]. Early diagnosis and therapy, as well as continuous therapy monitoring, remain paramount factors in the treatment of sepsis patients to improve outcomes and prognosis. From a laboratory point of view, procalcitonin (PCT) and C-reactive protein (CRP) represent the standard of care in biomarker-guided diagnosis and therapy monitoring, in addition to the culture-based pathogen evaluation [2]. However, with the need to further improve outcomes in sepsis, new diagnostic and treatment strategies are under investigation. Since myocardial involvement is assumed to play a major role in sepsis, novel cardiovascular biomarkers represent a promising new approach for diagnosis, as well as for risk stratification in these patients. To further improve outcomes in this patient collective, new cardiovascular biomarkers present a promising opportunity as they target the paramount prognostic processes in sepsis: inflammation and ischemia. A broad spectrum of novel cardiovascular biomarkers is currently under investigation. Among them heart-type fatty acid binding protein (H-FABP), soluble suppression of tumorigenicity 2 (sST2), growth differentiation factor 15 (GDF-15) and soluble urokinase-type plasminogen activator receptor (suPAR) represent some of the most established new markers in the field. However, in contrast to extensive analyses of the mentioned biomarkers in cardiovascular disease, a detailed analysis in sepsis is still lacking. With that in mind, we aimed to perform an analysis and comparison of biomarker levels in sepsis and different acute and chronic manifestations of cardiovascular disease by means of STEMI and heart failure.

2. Materials and Methods

In total 311 patients were included in this (prospective multicentre) analysis and divided into four subgroups: sepsis, STEMI, heart failure and controls. Informed consent was obtained from all patients included in the study. The study protocol was approved by the local ethics committee and was conducted in accordance with the “Declaration of Helsinki” (1964). Sepsis patients were recruited at University Clinic Halle (Saale) from the ICU. Sepsis was defined as “life-threatening organ dysfunction caused by a deregulated host response to infection” according to Sepsis-3 criteria [2]. Contraindication for the use beta-blockers was defined as shock and dependency on inotropes in this patient collective. The recruitment of 62 STEMI patients was conducted at the cardiac catheterization lab at University Hospital Jena, Germany. STEMI was defined as the presence of ST-segment elevations (at least 0.2 mV in two or more contiguous precordial leads or at least 0.1 mV in the limbs lead) in the initial ECG and elevated serum creatine kinase and troponin, according to the ESC guidelines [5]. A total of 123 patients with heart failure (idiopathic dilative or ischemic cardiomyopathy) were included in the outpatient ward at University Hospital Jena, Germany. Diagnosis was made according to the ESC guidelines after clinical evaluation, laboratory parameter analysis, coronary angiography and echocardiographic evaluation [6]. In all heart-failure patients, a reduction in the left ventricular ejection fraction was present. Recruitment and examination of the patients was conducted in a non-decompensated state. Patients showing clinical signs of acute heart failure were not enrolled in this study. A total of 75 patients, that underwent elective coronary angiography because of a suspected CAD at University Hospital Jena, Germany, served as control group. All these patients evidenced an exclusion of a coronary artery disease in the course of the examination. Exclusion criteria were chosen with regards to potential interference with our analyses and were as follows: (i) chronic infections, (ii) malignancies, (iii) autoimmune diseases, (iv) hyperthyroidism and (v) medication with immunosuppressive agents.

2.1. Laboratory Analysis

Blood samples were first drawn 24 h after hospital admission. Blood sampling in heart-failure patients and the control group was conducted without defined time windows. Standard clinical laboratory parameters were measured in the respective Department of Clinical Chemistry of University Hospital Jena and University Clinic Halle (Saale). Analysis of serum concentrations of novel cardiovascular biomarkers was conducted at the Department for Cardiology of University Hospital Salzburg. The respective biomarkers sST2, GDF-15, suPAR and H-FABP were quantified using commercially available ELISA kits (DuoSet ELISA, DY523B, DY957, DY807 and DY1678, R&D Systems, Minneapolis, MN, USA). All ELISA tests were performed according to the instructions provided by the manufacturer. Serum samples and standard proteins were applied to multiwell plates (Nunc Maxisorp plates, VWR International, Vienna, Austria). Respective plates were coated with the correspondent capture antibody and subsequently incubated for two hours. In the next step, the multiwell plates were washed with washing buffer (Tween 20, Sigma Aldrich, St. Louis, MO, USA) and phosphate-buffered saline solution. After washing, a biotin-labeled antibody was added to each well, and the plate was incubated for another two hours. Following incubation, the ELISA plates were washed again. Then, a streptavidin-labeled horseradish peroxidase solution was added. After adding tetramethylbenzidine (TMB; Sigma Aldrich, USA) a color reaction was achieved. The optical density was measured at 450 nm using an ELISA plate reader (iMark Microplate Absorbance Reader, Bio-Rad Laboratories, Vienna, Austria). Intra-assay precision and inter-assay precision were recorded as follows: ST2: 4.4–5.6%, 5.4–7.1%; GDF-15: 1.8–2.8%, 5.1–5.9%; suPAR: 2.1–7.5%, 4.7–6%; and H-FABP: 0.3–4.7%, 1.3–17.4%, respectively.

2.2. Statistical Analysis

Statistical analyses were conducted using the GraphPad-Prism software (GraphPad Software, La Jolla, CA, USA) and SPSS (23.0, SPSS Inc., Chicago, IL, USA). The data distribution was assessed by applying a Kolmogorov–Smirnov test prior to all subsequent analyses. Normally distributed data were expressed as mean ± standard error of the mean (SEM) and not normally distributed data were depicted as median ± interquartile range (IQR). Medians between the investigated groups were analyzed by applying a Kruskal–Wallis test with Dunn’s post hoc test. A χ²-test was used to assess differences between expected and observed frequencies in the investigated groups. Spearman’s rank correlation coefficient was used for correlation analysis, whereas binary logistic regression analysis was used to investigate the predictive ability of biomarkers for detecting sepsis. ROC analysis and AUC measurement were calculated for all investigated biomarkers. Using Youden‘s index (Youden‘s J statistic), cut-off values for sST2, GDF-15, suPAR and H-FABP were calculated based on coordinates obtained from the ROC-curves. In order to combine AUC measurements of biomarkers, binary logistic regression analysis was calculated, followed by further ROC analyses of biomarker combinations. A p-value < 0.05 was considered statistically significant.

3. Results

In total, 311 patients were enrolled in this study. Of these, 39.5% (n = 123) were in the heart failure (HF) group, 19.3% (n = 60) in the STEMI group, 17.0% (n = 53) in the sepsis group and 24.1% (n = 75) constituted the control group. The median age of all patients was 61 years (IQR 53–71) and the majority of patients were male (65.2%, n = 193). Concerning cardiovascular risk-factors, 68.6% of all patients (n = 199) suffered from arterial hypertension, 63.9% (n = 129) had dyslipidaemia, 44.9% (n = 102) had a history of smoking and 44.1% (n = 104) were overweight, with a median body mass index (BMI) of 27.6 kg/m2 (IQR 24.2–31.0) of all patients enrolled. Notably, patients in the HF and the STEMI group had a significantly higher BMI than controls (HF: median 28.2 kg/m2, STEMI: median 28.0 kg/m2 vs. 27.4 kg/m2, p = 0.030) and chronic kidney disease (CKD) was more prevalent amongst patients in the HF group than patients in the control group (20.0% vs. 5.7%, p = 0.008). Compared to the controls, patients in the HF, the STEMI and the sepsis group were significantly more often male (HF: 80.7%, STEMI: 71.2%, sepsis: 69.8% vs. control: 34.7%, p < 0.0001) and diabetes mellitus was more prevalent in these groups than in the control group (HF: 37.0%, STEMI: 29.1%, sepsis: 29.2% vs. control: 17.6%, p = 0.045) (see Table 1). C-reactive protein (CRP), serum creatinine and serum urea were significantly increased in patients with sepsis when compared to the other groups (CRP: median 235.9 mg/l (IQR 93.0–336.6), creatinine: 148.0 µmol/l (IQR 107.3–208.3), see Table 1).

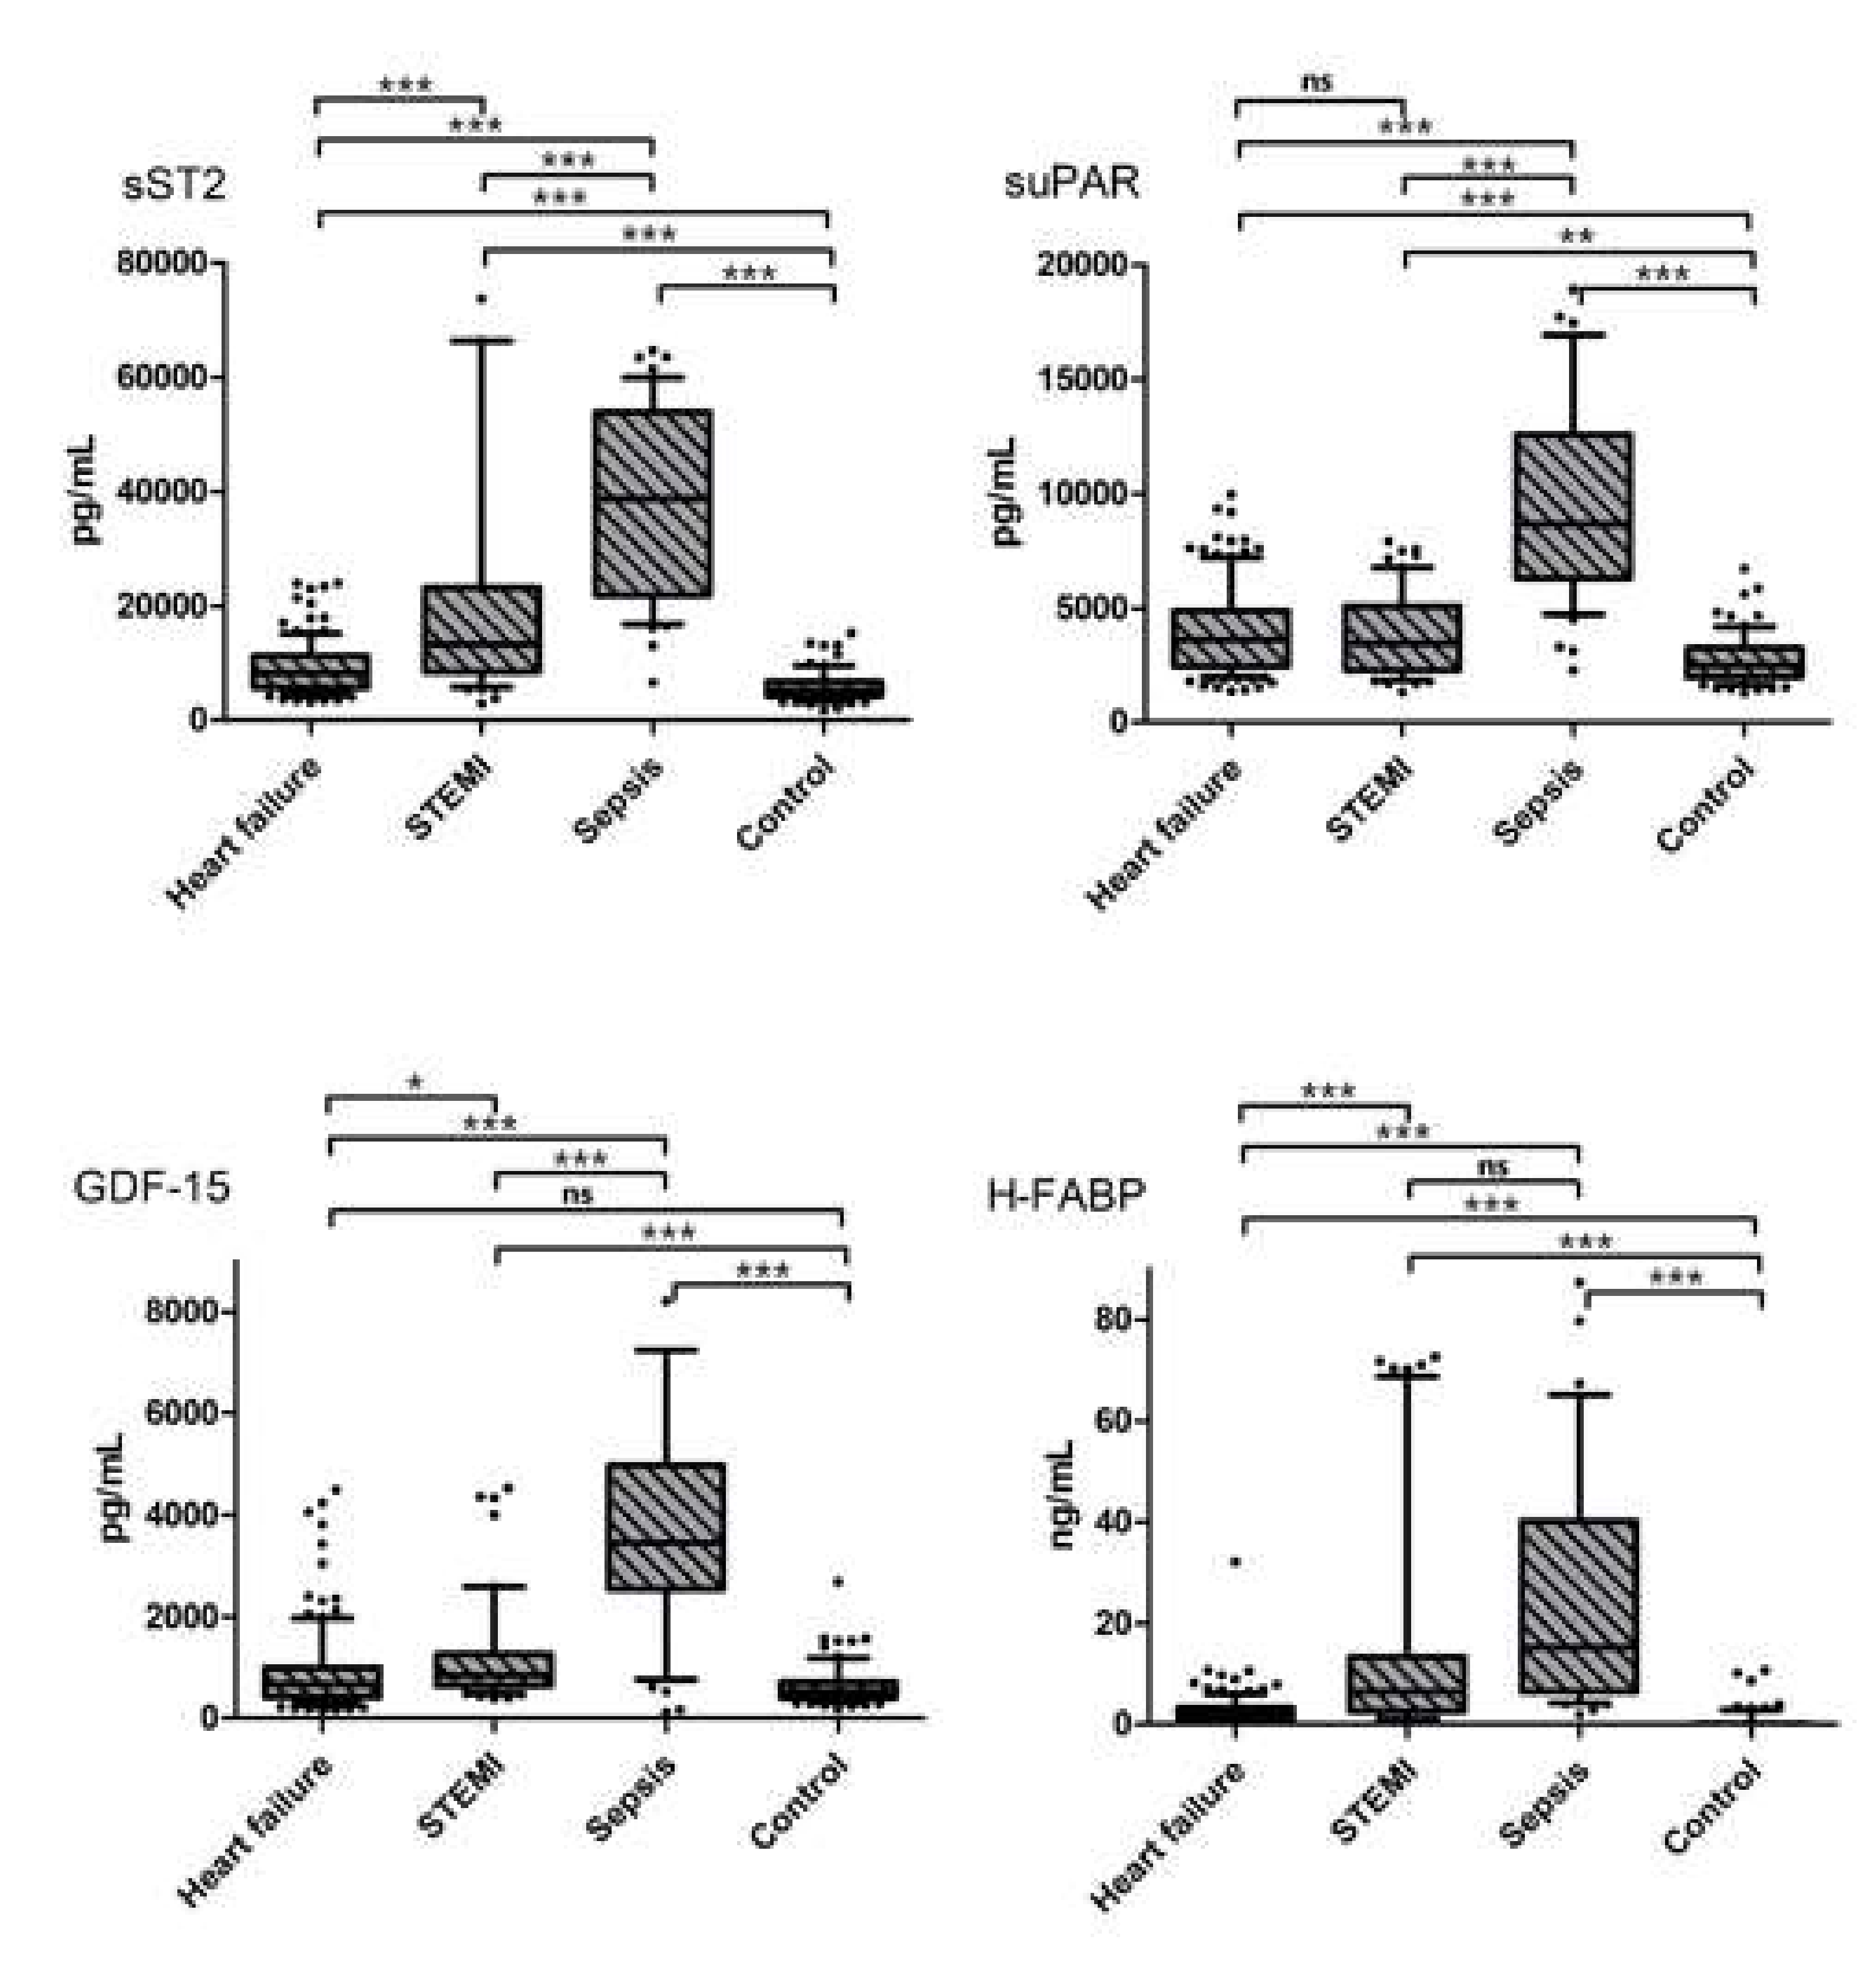
3.1. Biomarker Concentrations and Correlation Analysis

Except for GDF-15 in patients with HF, all investigated biomarkers were significantly elevated in patients with HF, STEMI and sepsis, when compared to the respective values of the controls (see Figure 1 and Table 2). Of the three investigated disease entities, patients with sepsis had the highest plasma concentrations regarding all investigated biomarkers (sST2: 7.4-fold, suPAR: 3.4-fold, GDF-15: 6.5-fold and H-FABP: 15.3-fold increased plasma levels, p < 0.001), which were distinctively higher than in patients with cardiovascular disease entities (sST2, suPAR, GDF-15: p < 0.001; H-FABP: compared to HF p < 0.001, see Figure 1 and Table 2).
Moreover, in patients with sepsis, serum concentrations of sST2 and suPAR were significantly elevated in patients with HF and STEMI when compared to controls (sST2: HF: 1.6-fold increase and STEMI: 2.5-fold increase, p < 0.001; suPAR: HF: 1.4-fold increase, p < 0.001 and STEMI: 1.4-fold increase, p < 0.01). Additionally, plasma levels of GDF-15 and H-FABP were significantly elevated in patients with STEMI (GDF-15: 1.6-fold increase, H-FABP: 6.4-fold increase, p < 0.001). Biomarker concentrations of all investigated parameters correlated with CRP and serum creatinine (CRP: sST2: rs = 0.438, p < 0.0001, suPAR: rs = 0.461, p < 0.0001, GDF-15: rs = 0.443, p < 0.0001, H-FABP: rs = 0.256, p < 0.0001; creatinine: sST2: rs = 0.336, p < 0.0001, suPAR: rs = 0.395, p < 0.0001, GDF-15: rs = 0.378, p < 0.0001, H-FABP: rs = 0.308, p < 0.0001), whereas only GDF-15 correlated with age (rs = 0.194, p = 0.001) (see Table 3).

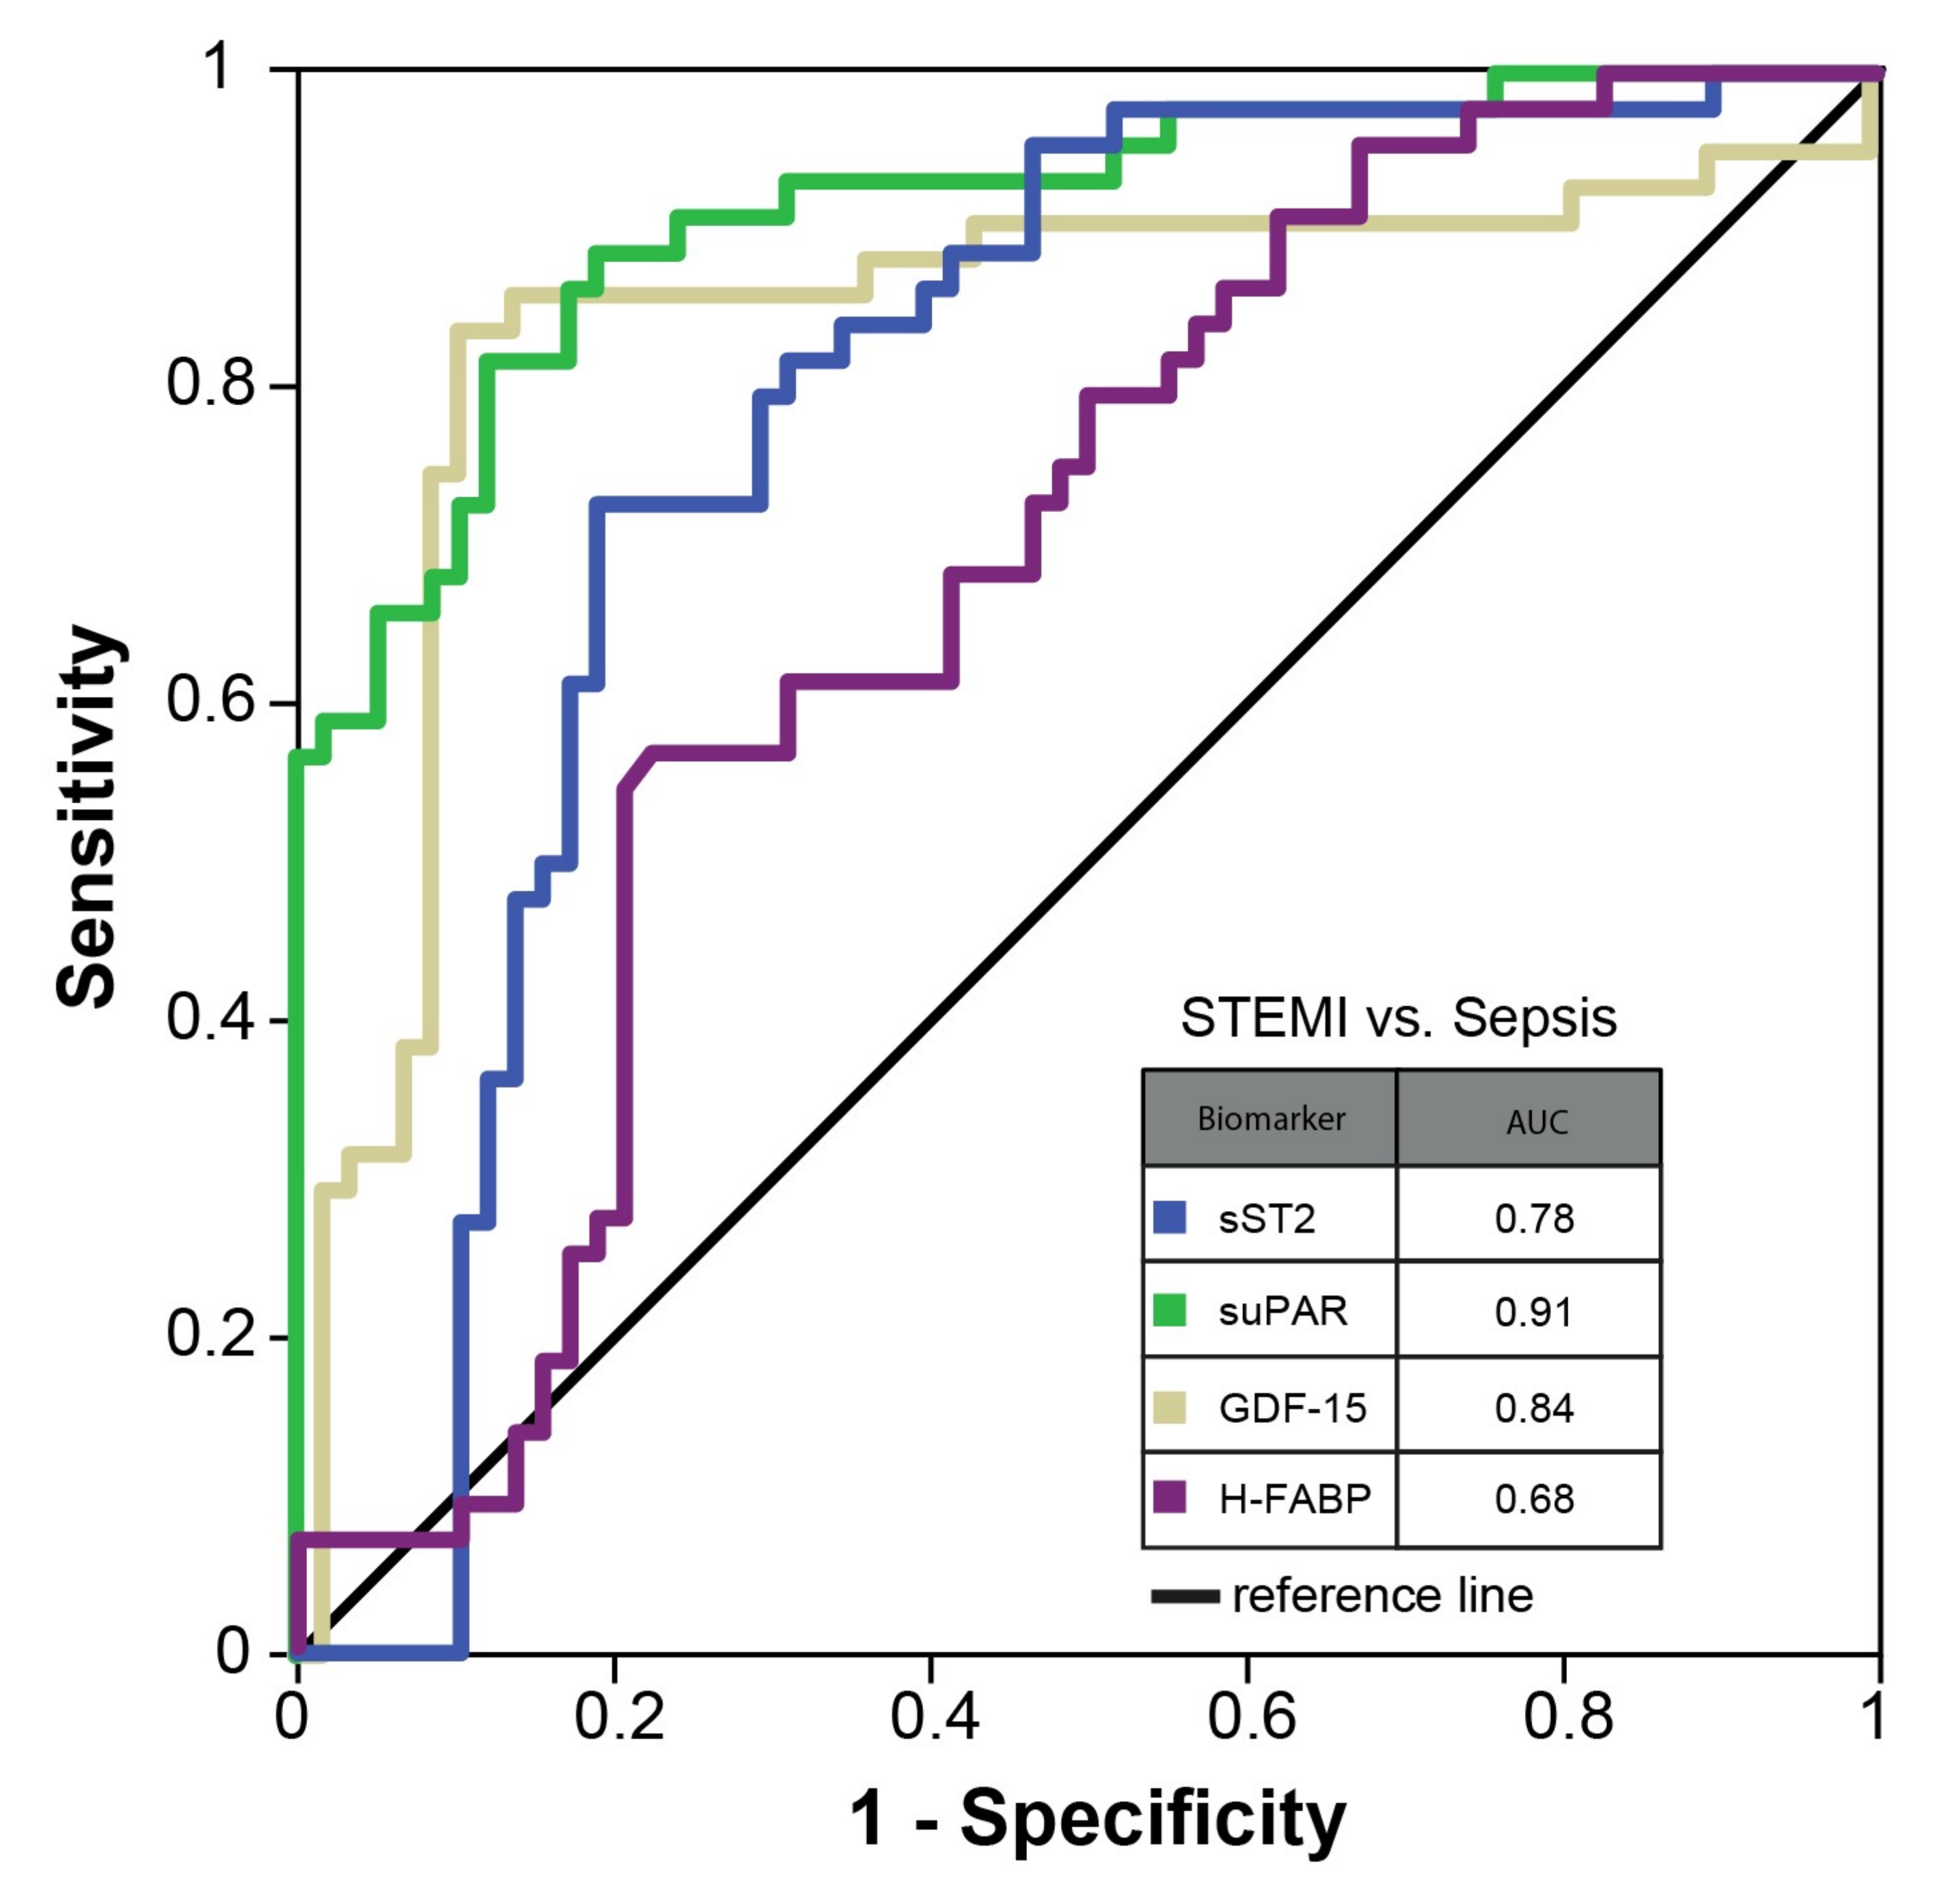
3.2. Binary Logistic Regression and ROC Analyses

To elucidate the predictive role of the investigated biomarkers in sepsis, binary logistic regression analysis was performed. After correction for possible confounders (CRP, serum creatinine and age), all investigated biomarkers remained predictive for the presence of sepsis in the total study cohort (see Table 4).
ROC analyses were conducted, and AUC were calculated in the total study cohort (sST2: 0.93 (95%CI 0.90–0.97), suPAR: 0.92 (95%CI 0.88–0.97), GDF-15: 0.89 (95%CI 0.82–0.96), H-FABP: 0.89 (95%CI 0.86–0.93) (see Figure 2). Similarly, optimal cut-off values for sepsis were calculated (see Table 5).
Further analysis revealed that a combination of sST2 and GDF-15 yielded the best predictive ability for the presence of sepsis in the total study cohort amongst all possible biomarker concentrations (AUC 0.96 (95%CI 0.94–0.98; see Supplementary Figure S2). Additionally, ROC analyses were performed in a reduced cohort of STEMI vs. sepsis patients. Here, AUC values for the investigated biomarkers were considerably lower than in the total cohort (sST2: 0.78 (95%CI 0.69–0.88), suPAR: 0.91 (95%CI 0.86–0.97), GDF-15: 0.84 (95%CI 0.75–0.93), H-FABP: 0.68 (95%CI 0.57–0.78), see Figure 3).

4. Discussion

Despite plenty of research and novel therapeutic options in intensive care medicine, such as extracorporeal membrane oxygenation (ECMO) or different new antimicrobial agents, mortality rates in sepsis remain high. Early diagnosis and therapy, as well as source control, remain to be cornerstones in the treatment of sepsis patients [7]. However, hardly any diagnostic milestones in sepsis care were set over the last years, especially considering the progress in other (acute) disease entities, such as cardiovascular disease. Numerous analyses on novel cardiac biomarkers targeting the cardiovascular field emerged over the last decade, with new markers entering guidelines as well as clinical applications. As these markers are well studied in numerous cardiovascular pathologies (especially myocardial infarction and heart failure) and since a considerable cardiovascular involvement in sepsis patients is assumed, we aimed for a head-to-head analysis of biomarker levels in cardiovascular disease and sepsis. Baseline characteristics showed typical findings and associated risk profiles for heart failure and STEMI patients. With regards to sepsis patients, a significant increase in kidney parameters and CRP was observed, indicating renal damage and considerable inflammatory activity at the time of blood sampling. This finding is of major importance, as many cardiovascular biomarkers, including troponin and natriuretic peptides, are elevated in the context of renal failure [8]. To date, data on tested biomarkers in CKD patients remain scarce. Still, a prognostic impact for cardiovascular disease in the context of CKD has been shown for H-FABP, especially sST2 [8]. Similar, a prognostic value of GDF-15 in addition to BNP was shown in the context of CKD [8]. In contrast, elevated suPAR levels are linked to acute kidney injury (AKI) as well as CKD, due to its interaction with renal podocytes [9]. Accordingly, the interaction of tested biomarkers and renal function has to be considered when interpreting the present study.
With regards to H-FABP, a highly sensitive marker for myocardial ischemia, patients with sepsis evidenced significantly higher serum concentrations than individuals with STEMI, HF or patients in the control group [10]. H-FABP constitutes a protein, which is involved in the fatty acid metabolism of cardiomyocytes and is thus highly sensitive for myocardial ischemia [11]. Similarly, recent studies also reported a correlation of H-FABP levels and disease severity in COVID-19 [12]. As no relevant involvement in inflammatory processes is reported for H-FABP, the predominant part of the observed elevation must be attributed to myocardial ischemia and damage, based on our findings [13]. This is emphasized by the fact, that H-FABP levels in sepsis by far exceeded the levels observed for STEMI. Moreover, in our analyses, H-FABP remained predictive for sepsis even after correction for possible confounders. Accordingly, myocardial ischemia and damage in the course of sepsis might be of even higher relevance than currently accepted. Thus, based on our results and its pathophysiological role in myocardial ischemia, H-FABP represents a promising new target with regards to sepsis patients. GDF-15, representing a marker of inflammation and oxidative stress, was also significantly elevated in the sepsis group. GDF-15 was also reported to act as an immune regulator, emphasizing its potential role as a marker in inflammatory diseases [14]. GDF-15 is elevated in response to tissue damage of various kinds [14]. Thus, in the context of sepsis, reflection of disease severity by GDF-15 seems plausible [14]. Similar to H-FABP, GDF-15 remained predictive for sepsis after correction for potential confounders. Buendgens et al. observed similar findings when they compared GDF-15 levels of ICU patients with and without sepsis. They were able to show a strong association of high GDF-15 values with multi-organ dysfunction and mortality [15]. Of note is the significant elevation of GDF-15 observed in STEMI patients, compared to HF and controls, which indicated a proinflammatory state of the vascular system in acute coronary events. An elevation in cytokines IL-6/-10/-12 and TNF-α, as well as a lowered concentration of dendritic cells in peripheral blood due to recruitment and cell migration in infarcted myocardium, was already proposed as a potential explanation by former studies [16].
Levels of sST2 were significantly elevated in both sepsis- and STEMI-patients compared to controls and heart-failure patients, while a trend towards higher levels in sepsis patients was observed compared to STEMI-patients. There are two isoforms of ST2, a soluble (sST2) and a membrane-bound (ST2L) form. IL-33 acts as a ligand to both isoforms, inducing cardioprotective effects through the ST2L pathway [17]. sST2, acting as a decoy receptor for IL-33, counteracts these cardioprotective effects and consequently leads to myocardial hypertrophy and cardiac remodeling [18]. Therefore, elevated levels of sST2 can be found in states of hemodynamic stress and cardiomyocyte strain. ST2L also activates the MyD88/NF-κB-pathway and enhances functions of T-cells, mast cells and cells of the innate lymphoid type, emphasizing the involvement of sST2 in inflammatory processes [19]. Given the combination of a systemic inflammatory state as well as a significant increase in cardiac stress as part of the multi-organ involvement and systemic hypoperfusion in the context of sepsis, an additive effect of ischemia and inflammation has to be considered as the most probable explanation for the high levels of sST2 observed in sepsis [16]. Similar to our findings, Parenica et al. also were able to show significantly elevated sST2-levels in patients with septic shock, compared to individuals with cardiogenic shock or STEMI. Additionally, a significant difference between cardiogenic shock and STEMI could be observed, underlining the generalized immunologic state of emergency in shock [20].
The greater systemic immunological escalation in a shock event compared to other disease entities is also reflected by suPAR counts in our study. suPAR is a proinflammatory marker, indicative of an activation of the immune system, and plays an important role in chemotaxis, cell adhesion and cell migration [21]. Studies reported a correlation of suPAR and outcomes in critically ill and sepsis patients [22]. Another study on the application of suPAR in intensive care medicine showed a correlation with disease severity, readmission and mortality [23]. suPAR probably also reflects the role of the immune system in cardiac remodeling in heart failure or incipient scarring in acute ischemia [24]. Again, the high suPAR levels observed for sepsis patients might be based on a combination of myocardial and inflammatory processes.
Our results emphasize the myocardial involvement in sepsis patients. While inflammatory processes account for a great part of the myocardial involvement, according to our results ischemic processes also seem to be of utmost importance in this regard. Interestingly, H-FABP and GDF-15 remained predictive for sepsis even after correction for potential confounders, including CRP. Thus, it can be assumed, that H-FABP and GDF-15 are less influenced by inflammatory activity compared to sST2 and suPAR, which seemed more suited to reflect the inflammatory burden in sepsis. The usefulness of a given test in the clinical application depends on the availability of reliable references or cut-off values, and our data show that for patients with sepsis the proposed cut-off values could be applied in future sepsis studies for external validation. It would be of interest to validate whether the prognostic predictive power of such biomarkers together with the calculated cut-off values could improve early sepsis identification. This could then be verified in larger studies using multivariate logistic regression and subsequent ROC curve analysis of composite prognostically relevant parameters.

5. Conclusions

In patients with sepsis, novel cardiovascular biomarkers indicated a cardiac involvement with regards to a high inflammatory burden along with considerable myocardial ischemia. They represent new pieces in the puzzle and hopefully will help us to move forward in understanding the overall picture of inflammation, sepsis and shock. To which extend their use could improve current risk-stratification scores or guide earlier, more invasive treatment regimens, needs to be clarified in future investigations.

6. Limitations

The biggest limitation of our study is represented by its small sample size and its hypothesis-generating design. Similarly, variables such as NT-proBNP were not available for the all cohorts, thus limiting the comparability of tested novel biomarkers with established markers in the field. Moreover, echocardiographic data remained limited to LVEF. Moreover, the reader should recognize the limitations of ROC plots when interpreting the findings of our study. As such, ROC plots and AUC measurements can be influenced by several confounders and are also dependent on the sample size of the investigated cohort [25,26]. Furthermore, we did not offer follow-up data or outcome data with regards to mortality. Despite these limitations we are convinced that the current study points out the great potential and possible benefits of novel biomarkers in sepsis patients.

Supplementary Materials

The following supporting information can be downloaded at: https://www.mdpi.com/article/10.3390/app12031419/s1, Figure S1: Scatter plots of biomarker concentrations in the four investigated groups. Abbreviations: STEMI = ST-segment elevation myocardial infarction; Figures S2 and S3: ROC-plots and AUC measurements of all biomarker combinations. Abbreviations: AUC = area under the curve.

Author Contributions

Conceptualization, P.J., F.H., M.L., L.J.M., P.C.S., S.N., D.K., R.P. and H.E.; data curation, F.H., M.M., R.R., V.P., A.T., A.Y., S.N. and K.W.; formal analysis, P.J., F.H., M.M. and V.P.; investigation, P.J., R.R., M.L., A.Y., P.C.S., S.N., D.K., R.P. and H.E.; methodology, P.J., F.H., M.L., L.J.M., A.Y., K.W., D.K., R.P. and H.E.; project administration, P.J., F.H., M.L., S.N., K.W., D.K., R.P. and H.E.; resources, R.R., L.J.M., U.C.H., P.C.S., K.W. and H.E.; software, P.J., M.M., V.P. and A.T.; supervision, M.L., A.T., A.Y., U.C.H., P.C.S., K.W. and D.K.; validation, F.H., A.T., S.N. and H.E.; visualization, M.M. and R.R.; writing—original draft, P.J., F.H., D.K., R.P. and H.E.; writing—review and editing, P.J., F.H., A.Y., U.C.H., S.N., D.K., R.P. and H.E. All authors have read and agreed to the published version of the manuscript.

Funding

This research received no external funding.

Institutional Review Board Statement

Data acquisition and analysis was performed in compliance with protocols approved by the Ethical Committee of the Martin Luther University Halle-Wittenberg as well as by the Ethical Committee of the University Clinic Jena.

Informed Consent Statement

Written informed consent was obtained from all participants of the study.

Data Availability Statement

Presented data are available upon reasonable request to the corresponding author. Reuse is only permitted after agreement of all authors of this study.

Conflicts of Interest

The authors declare that there is no conflict of interests regarding the publication of this paper.

References

  1. Vincent, J.-L.; Sakr, Y.; Sprung, C.L.; Ranieri, V.M.; Reinhart, K.; Gerlach, H.; Moreno, R.; Carlet, J.; Le Gall, J.-R.; Payen, D. Sepsis in European intensive care units: Results of the SOAP study. Crit. Care Med. 2006, 34, 344–353. [Google Scholar] [CrossRef] [PubMed]
  2. Singer, M.; Deutschman, C.S.; Seymour, C.W.; Shankar-Hari, M.; Annane, D.; Bauer, M.; Bellomo, R.; Bernard, G.R.; Chiche, J.-D.; Coopersmith, C.M.; et al. The Third International Consensus Definitions for Sepsis and Septic Shock (Sepsis-3). JAMA 2016, 315, 801–810. [Google Scholar] [CrossRef] [PubMed]
  3. Lagu, T.; Rothberg, M.B.; Shieh, M.-S.; Pekow, P.S.; Steingrub, J.S.; Lindenauer, P.K. Hospitalizations, costs, and outcomes of severe sepsis in the United States 2003 to 2007. Crit. Care Med. 2012, 40, 754–761. [Google Scholar] [CrossRef]
  4. Arefian, H.; Heublein, S.; Scherag, A.; Brunkhorst, F.M.; Younis, M.Z.; Moerer, O.; Fischer, D.; Hartmann, M. Hospital-related cost of sepsis: A systematic review. J. Infect. 2016, 74, 107–117. [Google Scholar] [CrossRef]
  5. Ibanez, B.; James, S.; Agewall, S.; Antunes, M.J.; Bucciarelli-Ducci, C.; Bueno, H.; Caforio, A.L.P.; Crea, F.; Goudevenos, J.A.; Halvorsen, S.; et al. 2017 ESC Guidelines for the management of acute myocardial infarction in patients presenting with ST-segment elevation: The Task Force for the management of acute myocardial infarction in patients presenting with ST-segment elevation of the European Society of Cardiology (ESC). Eur. Heart J. 2018, 39, 119–177. [Google Scholar]
  6. Ponikowski, P.; Voors, A.A.; Anker, S.D.; Bueno, H.; Cleland, J.G.; Coats, A.J.; Falk, V.; González-Juanatey, J.R.; Harjola, V.P.; Jankowska, E.A.; et al. 2016 ESC Guidelines for the diagnosis and treatment of acute and chronic heart failure: The Task Force for the diagnosis and treatment of acute and chronic heart failure of the European Society of Cardiology (ESC). Developed with the special contribution of the Heart Failure Association (HFA) of the ESC. Eur. J. Heart Fail. 2016, 18, 891–975. [Google Scholar]
  7. Rhodes, A.; Evans, L.E.; Alhazzani, W.; Levy, M.M.; Antonelli, M.; Ferrer, R.; Kumar, A.; Sevransky, J.E.; Sprung, C.L.; Nunnally, M.E.; et al. Surviving Sepsis Campaign: International Guidelines for Management of Sepsis and Septic Shock: 2016. Crit. Care Med. 2017, 45, 486–552. [Google Scholar] [CrossRef]
  8. Han, X.; Zhang, S.; Chen, Z.; Adhikari, B.K.; Zhang, Y.; Zhang, J.; Sun, J.; Wang, Y. Cardiac biomarkers of heart failure in chronic kidney disease. Clin. Chim. Acta 2020, 510, 298–310. [Google Scholar] [CrossRef]
  9. Zeier, M.; Reiser, J. suPAR and chronic kidney disease—A podocyte story. Pflügers Arch. Eur. J. Physiol. 2017, 469, 1017–1020. [Google Scholar] [CrossRef]
  10. Rezar, R.; Jirak, P.; Gschwandtner, M.; Derler, R.; Felder, T.K.; Haslinger, M.; Kopp, K.; Seelmaier, C.; Granitz, C.; Hoppe, U.C.; et al. Heart-Type Fatty Acid-Binding Protein (H-FABP) and its Role as a Biomarker in Heart Failure: What Do We Know So Far? J. Clin. Med. 2020, 9, 164. [Google Scholar] [CrossRef] [Green Version]
  11. Ye, X.-D.; He, Y.; Wang, S.; Wong, G.T.; Irwin, M.; Xia, Z. Heart-type fatty acid binding protein (H-FABP) as a biomarker for acute myocardial injury and long-term post-ischemic prognosis. Acta Pharmacol. Sin. 2018, 39, 1155–1163. [Google Scholar] [CrossRef] [PubMed]
  12. Yin, L.; Mou, H.; Shao, J.; Zhu, Y.; Pang, X.; Yang, J.; Zhang, J.; Shi, W.; Yu, S.; Wang, H. Correlation between Heart fatty acid binding protein and severe COVID-19: A case-control study. PLoS ONE 2020, 15, e0231687. [Google Scholar] [CrossRef] [PubMed]
  13. Otaki, Y.; Watanabe, T.; Kubota, I. Heart-type fatty acid-binding protein in cardiovascular disease: A systemic review. Clin. Chim. Acta 2017, 474, 44–53. [Google Scholar] [CrossRef] [PubMed]
  14. Wischhusen, J.; Melero, I.; Fridman, W.H. Growth/Differentiation Factor-15 (GDF-15): From Biomarker to Novel Targetable Immune Checkpoint. Front. Immunol. 2020, 11, 951. [Google Scholar] [CrossRef]
  15. Buendgens, L.; Yagmur, E.; Bruensing, J.; Herbers, U.; Baeck, C.; Trautwein, C.; Koch, A.; Tacke, F. Growth Differentiation Factor-15 Is a Predictor of Mortality in Critically Ill Patients with Sepsis. Dis. Markers 2017, 18, 5271203. [Google Scholar] [CrossRef] [Green Version]
  16. Kretzschmar, D.; Betge, S.; Windisch, A.; Pistulli, R.; Rohm, I.; Fritzenwanger, M.; Jung, C.; Schubert, K.; Theis, B.; Petersen, I.; et al. Recruitment of circulating dendritic cell precursors into the infarcted myocardium and pro-inflammatory response in acute myocardial infarction. Clin. Sci. 2012, 123, 387–398. [Google Scholar] [CrossRef] [Green Version]
  17. Schmitz, J.; Owyang, A.; Oldham, E.; Song, Y.; Murphy, E.; McClanahan, T.K.; Zurawski, G.; Moshrefi, M.; Qin, J.; Li, X.; et al. IL-33, an Interleukin-1-like Cytokine that Signals via the IL-1 Receptor-Related Protein ST2 and Induces T Helper Type 2-Associated Cytokines. Immunity 2005, 23, 479–490. [Google Scholar] [CrossRef] [Green Version]
  18. Sanada, S.; Hakuno, D.; Higgins, L.J.; Schreiter, E.; McKenzie, A.N.; Lee, R.T. IL-33 and ST2 comprise a critical biomechanically induced and cardioprotective signaling system. J. Clin. Investig. 2007, 117, 1538–1549. [Google Scholar] [CrossRef] [Green Version]
  19. Griesenauer, B.; Paczesny, S. The ST2/IL-33 Axis in Immune Cells during Inflammatory Diseases. Front. Immunol. 2017, 8, 475. [Google Scholar] [CrossRef]
  20. Parenica, J.; Malaska, J.; Jarkovsky, J.; Lipkova, J.; Dastych, M.; Helanova, K.; Litzman, J.; Tomandl, J.; Littnerova, S.; Sevcikova, J.; et al. Soluble ST2 levels in patients with cardiogenic and septic shock are not predictors of mortality. Exp. Clin. Cardiol. 2012, 17, 205–209. [Google Scholar]
  21. Thuno, M.; Macho, B.; Eugen-Olsen, J. suPAR: The molecular crystal ball. Dis. Markers 2009, 27, 157–172. [Google Scholar] [CrossRef] [PubMed]
  22. Koch, A.; Voigt, S.; Kruschinski, C.; Sanson, E.; Dückers, H.; Horn, A.; Yagmur, E.; Zimmermann, H.; Trautwein, C.; Tacke, F. Circulating soluble urokinase plasminogen activator receptor is stably elevated during the first week of treatment in the intensive care unit and predicts mortality in critically ill patients. Crit. Care 2011, 15, 16. [Google Scholar] [CrossRef] [PubMed] [Green Version]
  23. Rasmussen, L.J.H.; Ladelund, S.; Haupt, T.H.; Ellekilde, G.; Poulsen, J.H.; Iversen, K.; Eugen-Olsen, J.; Andersen, O. Soluble urokinase plasminogen activator receptor (suPAR) in acute care: A strong marker of disease presence and severity, readmission and mortality. A retrospective cohort study. Emerg. Med. J. 2016, 33, 769–775. [Google Scholar] [CrossRef] [Green Version]
  24. Hodges, G.W.; Bang, C.N.; Wachtell, K.; Eugen-Olsen, J.; Jeppesen, J.L. suPAR: A New Biomarker for Cardiovascular Disease? Can. J. Cardiol. 2015, 31, 1293–1302. [Google Scholar] [CrossRef] [PubMed]
  25. Berrar, D.; Flach, P. Caveats and pitfalls of ROC analysis in clinical microarray research (and how to avoid them). Brief. Bioinform. 2011, 13, 83–97. [Google Scholar] [CrossRef] [PubMed]
  26. Janssens, A.; Martens, F.K. Reflection on modern methods: Revisiting the area under the ROC Curve. Int. J. Epidemiol. 2020, 49, 1397–1403. [Google Scholar] [CrossRef] [PubMed]
Figure 1. Biomarker concentrations in the three investigated disease entities vs. controls. * indicates a p of <0.05, ** a p of <0.01 and *** a p of <0.001, ns = not significant.
Applsci 12 01419 g001
Figure 2. ROC curve—total study cohort.
Applsci 12 01419 g002
Figure 3. ROC curve—sepsis vs. STEMI.
Applsci 12 01419 g003
Table 1. Baseline characteristics of the respective study cohorts. Abbreviations: BMI = body mass index, EF = ejection fraction, CRP = C-reactive protein, IQR = interquartile range.
Total Cohort (n= 311)Heart Failure (n= 123)STEMI (n= 60)Sepsis (n= 53)Control (n= 75)p-Value
Age (years; median (IQR))61 (53–71) *60 (51–69) 60 (54–71) *62 (50–75) *65 (54–71) *0.372
Height (m; median (IQR))1.73 (1.64–1.80) *1.75 (1.68–1.80) 1.73 (1.64–1.78) *1.74 (1.67–1.80) *1.68 (1.61–1.77) *0.001
Weight (kg; median (IQR))80.5 (70.0–94.0) *83.0 (74.5–98.5) 80.0 (74.0–94.5) *80.0 (63.5–90.0) *76.5 (66.5–90.0) *0.009
BMI (kg/m2; median (IQR))27.6 (24.3–31.0) *28.2 (24.8–31.6) 28.0 (24.7–31.2) *26.2 (21.8–29.4) *27.4 (23.8–30.7) *0.030
EF (%; median (IQR))47 (33–63) 36 (28–45) *55 (46–68) ||n.a.67 (63–74) <0.0001
CRP (mg/L; median (IQR))61.1 (26.0–150.0) 3.1 (0.0–7.6) 7.9 (2.5–11.6) *235.9 (93.0–336.6) *3.9 (3.2–5.4) §<0.0001
Creatinine (µmol/L; median (IQR))82.0 (67.0–113.5) 90.0 (79.0–125.0) 68.5 (61.8–81.8) *148.0 (107.3–208.3) *70.5 (64.0–83.5) *<0.0001
Urea (mmol/L; median (IQR))6.4 (4.9–9.8) §6.8 (5.3–9.8) 5.1 (4.1–6.4) 14.5 (9.0–22.0) 5.4 (4.5–6.7) <0.0001
Gender (% male, (n))65.2 (193) *80.7 (88) 71.2 (42) *69.8 (37) *34.7 (26) *<0.0001
Diabetes (%, (n))29.1 (83) *37.0 (40) 29.1 (16) *29.2 (14) *17.6 (13) *0.045
Hypertension (%, (n))68.6 (199) *59.3 (64) 92.7 (51) *39.6 (21) *85.1 (63) *<0.0001
Chronic kidney disease (%, (n))11.3 (31) 20.0 (19) 5.3 (3) *9.4 (5) *5.7 (4) *0.008
Smoking (%, (n))44.9 (102) 45.4 (49) 63.5 (33) n.a.29.9 (20) 0.001
Dyslipidemia (%, (n))63.9 (129) 71.3 (77) 62.5 (25) n.a.50.0 (27) 0.029
Overweight (%, (n))44.1 (104) 38.0 (41) 54.5 (30) *n.a.45.2 (33) *0.127
* n = ≥90% of total n of this group; n = ≥80% and <90% than total n of this group; n = ≥50% and <80% than total n of this group; § n = <50% than total n of this group; || n = <30% than total n of this group.
Table 2. Biomarker concentrations of the total cohort, divided by disease entity. Abbreviations: IQR = interquartile range.
Total CohortHeart FailureSTEMISepsisControlp-Value
sST2 (pg/mL; median (IQR))8637.5 (5553.5–17141.0)8181.3 (5683.1–11217.4)13,210.9 (8496.9–23,113.5)38,701.9 (21,834.5–53,879.3)5209.9 (4242.9–6850.2)<0.0001
suPAR (pg/mL; median IQR))3459.6 (2349.4–5363.7)3596.6 (2454.3–4897.3)3461.2 (2282.2–5091.0)8653.4 (6297.6–12,597.0)2513.0 (1975.2–3254.6)<0.0001
GDF-15 (pg/mL; median (IQR))711.2 (489.2–1495.5)667.8 (420.5–1002.4)841.3 (644.1–1264.7)3455.9 (2545.3–4976.6)531.9 (397.8–706.2)<0.0001
H-FABP (ng/mL; median (IQR))2.25 (0.00–6.84)1.90 (0.99–3.26)6.44 (2.69–13.39)15.28 (6.40–40.13)0.00 (0.00–0.00)<0.0001
Table 3. Correlation analysis of investigated biomarkers and numeric variables of the baseline characteristics. Abbreviations: BMI= body mass index, EF= ejection fraction, CRP= C-reactive protein.
Age (Years)BMI (kg/m²)EF
(%)
CRP (mg/L)Creatinine (µmol/L)Urea (mmol/L)
sST2 (pg/mL)rs0.038−0.019−0.3060.4380.3360.329
p-value0.5250.748<0.0001<0.0001<0.0001<0.0001
suPAR (pg/mL)rs0.104−0.090−0.2410.4610.3950.399
p-value0.0810.1340.001<0.0001<0.0001<0.0001
GDF-15 (pg/mL)rs0.194−0.059−0.1370.4430.3780.362
p-value0.0010.3280,066<0.0001<0.0001<0.0001
HFABP (ng/mL)rs0.064−0.027−0.3650.2560.3080.310
p-value0.2810.647<0.00010.000<0.0001<0.0001
Table 4. Binary logistic regression analysis (variance inflation factors (VIF): VIF: CRP 1.075, creatinine 1.075, age: 1.000). Abbreviations: CRP= C-reactive protein.
BiomarkersDependent Variable: Sepsis
Adjustment for: Age, CRP, Creatinine
B95%CIp-Value
sST2 (ng/mL)1.0341.011–1.0570.004
suPAR (ng/mL)1.6301.291–2.057<0.0001
GDF-15 (ng/mL)1.7771.308–2.415<0.0001
H-FABP (ng/mL)1.0311.009–1.0530.006
Table 5. Optimal biomarker cut-off values for sepsis.
Optimal Cut-Off Values for Sepsis
BiomarkerCut-Off
sST215,909 pg/mL
GDF-152090 pg/mL
suPAR5414 pg/mL
H-FABP4 ng/mL
Publisher’s Note: MDPI stays neutral with regard to jurisdictional claims in published maps and institutional affiliations.

