Commentary

Updates and Original Case Studies Focused on the NMR-Linked Metabolomics Analysis of Human Oral Fluids Part I: Emerging Platforms and Perspectives

Leicester School of Pharmacy, De Montfort University, The Gateway, Leicester LE1 9BH, UK
*
Author to whom correspondence should be addressed.
Appl. Sci. 2022, 12(3), 1235; https://doi.org/10.3390/app12031235
Submission received: 14 September 2021 / Revised: 28 December 2021 / Accepted: 1 January 2022 / Published: 25 January 2022
(This article belongs to the Special Issue Materials and Technologies in Oral Research)

Abstract

:
1H NMR-based metabolomics analysis of human saliva, other oral fluids, and/or tissue biopsies serves as a valuable technique for the exploration of metabolic processes, and when associated with ’state-of-the-art’ multivariate (MV) statistical analysis strategies, provides a powerful means of examining the identification of characteristic metabolite patterns, which may serve to differentiate between patients with oral health conditions (e.g., periodontitis, dental caries, and oral cancers) and age-matched heathy controls. This approach may also be employed to explore such discriminatory signatures in the salivary 1H NMR profiles of patients with systemic diseases, and to date, these have included diabetes, Sjörgen’s syndrome, cancers, neurological conditions such as Alzheimer’s disease, and viral infections. However, such investigations are complicated in view of quite a large number of serious inconsistencies between the different studies performed by independent research groups globally; these include differing protocols and routes for saliva sample collection (e.g., stimulated versus unstimulated samples), their timings (particularly the oral activity abstention period involved, which may range from one to 12 h or more), and methods for sample transport, storage, and preparation for NMR analysis, not to mention a very wide variety of demographic variables that may influence salivary metabolite concentrations, notably the age, gender, ethnic origin, salivary flow-rate, lifestyles, diets, and smoking status of participant donors, together with their exposure to any other possible convoluting environmental factors. In view of the explosive increase in reported salivary metabolomics investigations, in this update, we critically review a wide range of critical considerations for the successful performance of such experiments. These include the nature, composite sources, and biomolecular status of human saliva samples; the merits of these samples as media for the screening of disease biomarkers, notably their facile, unsupervised collection; and the different classes of such metabolomics investigations possible. Also encompassed is an account of the history of NMR-based salivary metabolomics; our recommended regimens for the collection, transport, and storage of saliva samples, along with their preparation for NMR analysis; frequently employed pulse sequences for the NMR analysis of these samples; the supreme resonance assignment benefits offered by homo- and heteronuclear two-dimensional NMR techniques; deliberations regarding salivary biomolecule quantification approaches employed for such studies, including the preprocessing and bucketing of multianalyte salivary NMR spectra, and the normalization, transformation, and scaling of datasets therefrom; salivary phenotype analysis, featuring the segregation of a range of different metabolites into ‘pools’ grouped according to their potential physiological sources; and lastly, future prospects afforded by the applications of LF benchtop NMR spectrometers for direct evaluations of the oral or systemic health status of patients at clinical ‘point-of-contact’ sites, e.g., dental surgeries. This commentary is then concluded with appropriate recommendations for the conduct of future salivary metabolomics studies. Also included are two original case studies featuring investigations of (1) the 1H NMR resonance line-widths of selected biomolecules and their possible dependence on biomacromolecular binding equilibria, and (2) the combined univariate (UV) and MV analysis of saliva specimens collected from a large group of healthy control participants in order to potentially delineate the possible origins of biomolecules therein, particularly host- versus oral microbiome-derived sources. In a follow-up publication, Part II of this series, we conduct censorious reviews of reported observations acquired from a diversity of salivary metabolomics investigations performed to evaluate both localized oral and non-oral diseases. Perplexing problems encountered with these again include those arising from sample collection and preparation protocols, along with 1H NMR spectral misassignments.

Graphical Abstract

1. Introduction to NMR-Based Salivary/Oral Fluid Metabolomics

The multicomponent 1H nuclear magnetic resonance (NMR) or liquid chromatographic–mass spectrometric (LC-MS) analyses of biofluids and/or tissues offers a high level of potential with regard to the investigation of metabolic processes, and when coupled with contemporary and/or newly developed multivariate (MV) data analysis techniques, serves as an extremely powerful means of probing, for example, the biochemical basis of human disease etiology, along with therapeutic benefits or toxicological effects induced by administered drugs or further xenobiotics [1]. Indeed, this bioanalytical approach is generally classified as metabolomics and has been extensively employed in a very wide range of biomedical investigations, diagnostic, prognostic, or otherwise. The MV statistical analysis of such MV analytical data is generally based on either (1) supervised pattern recognition or (2) unsupervised exploratory data analysis techniques. The first of these classes of analyses commonly incorporates models for MV discriminant function analysis, which is employed in order to test the significance of any key ‘biomarker’ variables (i.e., metabolite concentrations, spectral ‘bucket’ intensities, or further measures related to biomolecule levels) with regard to their assignment to differential classification groups (e.g., control vs. disease groups or control (untreated) vs. treatment-receiving disease groups); these techniques are supervised, i.e., they require prior knowledge of their group membership in a ‘training’ modeling dataset. The second technique, however, primarily involves principal component analysis (PCA), a strategy that is unsupervised, and permits the employment of inter-related descriptors to detect dataset classification clusterings—it is also valuable for the preliminary identification and removal of statistical ‘outlier’ samples.
Combinations of multianalyte biofluid 1H NMR analysis with the above MV metabolomics approaches clearly offers major advantages (diagnostic or otherwise), especially in view of the relatively limited amount of molecular information derivable from the direct computer-visual examination of spectral profiles acquired, which often contain information relating to 100 or more biomolecules therein (including the individual determination of many metabolite levels) by trained, expert staff, which is costly, labor-intensive, and time-consuming.
Intriguingly, saliva represents an ideal biofluid medium for such metabonomics investigations, particularly since, when excreted from the salivary and mucous glands, it contains no invading bacteria and only very low concentrations of metabolic agents, which may represent ‘markers’ of selected oral diseases. Indeed, in the oral environment, micro-organisms located in tooth plaque, gingival crevices, or soft tissues such as gums conduct a range of metabolic functions linked to their growth and prevalence, and hence human saliva contains many excreted catabolites (e.g., acetate, formate, lactate, propionate, n- and iso-butyrates, n- and iso-valerates, etc.) that are unique and dependent on the infiltration, activity, and preponderance of bacterial flora therein. Furthermore, elevated salivary concentrations of markers of inflammatory processes occurring within soft tissue would also be anticipated, for example, ground substance glycosaminoglycans and low-molecular-mass saccharides derived therefrom, plus malodorous amines, etc.
To date, we have presented results concerning the applications of high-field proton (1H) NMR spectroscopy to the detection and quantification of biomolecules present in a variety of complex biological fluids, and some examples from our work in the dental/oral health research area are available in [2,3,4,5]. This technique offers many advantages over alternative onerous analytical methods since (1) it permits the rapid, non-invasive, and simultaneous study of a multitude of components present in biological samples (e.g., biofluids such as human saliva), and (2) generally requires little or no knowledge of sample composition prior to analysis. Moreover, chemical shift values, coupling patterns, and coupling constants of resonances present in 1H NMR spectra of such complex, multicomponent systems provide much valuable information regarding the molecular nature of both endogenous and exogenous chemical species detectable. Any broad overlapping resonances that arise from macromolecules present are routinely suppressed by recommended spin-echo pulse sequences, giving rise to spectra that contain many sharp, well-resolved signals attributable to a wide variety of low-molecular-mass (non-protein-bound) metabolites, along with the mobile portions of macromolecules, which are detectable at a sensitivity of ≤5 × 10⁻⁶ mol. dm−3 (at an operating frequency of 600 MHz) for samples not subjected to any form of pre-concentration methodologies.
Our group has previously examined the capacity of both one- and two-dimensional (1D and 2D, respectively) high-resolution NMR techniques to (1) index salivary biomolecules and (2) supply valuable metabolic data regarding intra- and inter-subject variability in the salivary concentrations of a range of biomolecules readily detectable by this technique, specifically organic acid anions and malodorous amines [3]. This study has been described as the very first ‘true’ untargeted metabolomics study performed on human saliva [6], and in this investigation, we employed high-resolution NMR analysis at an operating frequency of 600 MHz. Moreover, it was also described as ‘…the earliest 1H-NMR study of saliva with comprehensive assignments…’ by Gardner et al. in 2020 [7]. Results acquired from that investigation revealed the ability of these NMR techniques to simultaneously detect >60 endogenous biomolecules, together with a series of xenobiotic agents arising from dietary, oral health care product, and pharmaceutical sources. Moreover, highly significant ‘between-participant’ differences in the a.m. waking salivary biomolecule concentrations were found for 9 out of 11 biomolecules monitored in this manner, and these data provided evidence that different human participants had at least some distinctive metabolite pools and hence phenotypical metabolite patterns. Indeed, for these nine metabolites, these ‘between-participant’ components of variance were much greater than those observed ‘within-participants’, and therefore this provided strong evidence for the independent phenotypic nature of human salivary metabolic profiles, i.e., it is possible to reproducibly distinguish between those of differing healthy individuals.
Our part in the early history of NMR-linked salivary metabolomics research, and on the applications of high-resolution NMR analysis on the dental/oral health research area in general, is outlined in Section 5 below. To the best of our knowledge, we were also the first group to successfully acquire and assign the two-dimensional (2D) profiles such as 1H-1H homonuclear and 1H-13C heteronuclear correlation, and J-resolved spectra, of human salivary supernatants [3], techniques reviewed in Section 8. Further subsequent developments by our group in the salivary metabolomics area have included the very first applications of self-organizing maps (SOMs), both supervised and unsupervised [8,9], and also an analysis-of-variance (ANOVA)-based simultaneous component analysis (ASCA) approach, the latter model including several first-order interaction terms [10], to the MV analysis of 1H NMR datasets acquired from participants before and after treatment with an oral rinse formulation. Moreover, in 2014, we applied a computational intelligence technique, specifically a fuzzy genetic programming base for sub-group discovery, to a large cohort of human recruits, for the distinction of those with acute sore-throat conditions from age-matched healthy controls [11].
However, a very large expansion of such salivary metabolomics studies has been recently observed, with an exponential growth in the number of publications available since the early 2000s. Indeed, in 2019, approximately 300 studies focused on the human salivary metabolome were listed [7]. Those involving salivary proteomics are also steadily increasing, with a rise from virtually zero in 2005 to ca. 25 in 2019 [7].
In 2020, Gardner et al. [7] also reported that there were 72 or so original research papers that featured the application of metabolomics techniques to human saliva, and the majority of these involved the use of metabolic profiling as a route to the identification of suitable biomarkers for selected diseases, both oral and systemic. At that time, these studies mostly explored oral cancer, periodontal diseases (PDs), and Alzheimer’s disease, although updated summaries of these and more recent reports can be found in Section 2 and Section 3 of Part II of this report, which are focused mainly on the diagnostic and less so on prognostic monitoring outcomes of oral and extra-oral diseases, respectively. The clinical benefits potentially offered by the early, metabolomics-mediated diagnosis of oral cancers has largely driven the relatively large numbers of reports available in this field [12].
Notwithstanding, many further research investigations are required for the successful transition of NMR-based salivary metabolomics to actual clinical use as a diagnostic aid for the benefit of clinicians, researchers, and patient stakeholders. Not only do the very large sizes of superconducting magnets and console facilities prohibitively restrict such screening processes, but the high costs of requirements for associated cryogenic magnet coolant systems, and also specialist technical staff for their operation, unfortunately provide major barriers to the routine use of NMR analysis for this purpose [2]. However, the future potential employment of newly developed low-field (60 MHz), non-stationary benchtop spectrometers, which are much less costly, simple to operate, and are readily installable and operatable at ‘point-of-contact’ sites such as hospital clinics and dental surgeries, etc., may serve to overcome this issue. Therefore, this paper also includes a section devoted to the potential use of these near-portable spectrometers in dental and oral health clinical practice, as well as research studies focused on these fields (Section 11).
Unfortunately, to date, one clear message from the metabolomics research area is that any MV NMR-, liquid chromatographic/mass–spectrometric (LC/MS)- or matrix-assisted laser desorption/ionization-time of flight (MALDI-TOF) MS-developed screens of patient biofluid samples for the presence or evolution of hopefully fully validated and tested biomarkers rarely translate to their acceptance as routine analytical screening systems available at clinical monitoring sites, the major reason for this being the unwieldly sizes and high costs of such bioanalytical instruments with the ability to simultaneously determine large numbers of analytes, as noted above. However, one promising feature is the selection of a MV combination of, say, four or more biofluid biomarkers with a characteristic and distinctive concentration ‘pattern’ in a selected disease, which can then be determined, concomitantly or otherwise, by simpler ELISA or biosensor techniques triggered for the rapid and direct quantification of such agents, for example, in human saliva. Alternatively, if this cohort of salivary biomarkers are detectable and quantifiable at the operating frequencies of low-field (LF) benchtop spectrometers, then this approach may also serve as a cost-effective and user-friendly technique for these purposes.
However, such developments are currently further hindered by the differential methods of and protocols for saliva sample collection, the timings of these collections, and the often highly variable regimens instigated for sample transport (where required), storage, and their preparation for analysis, NMR or otherwise. Moreover, further important considerations are facets of salivary physiology that are known to or may influence this biofluid’s metabolite profile, particularly age, gender, ethnic origin, and other demographic variables considered to be of importance for the study in question, salivary flow-rate, any salivary stimuli employed for collection, participant demeanors, diets and smoking status, oral activity abstention period (including time of the last meal, drink or cigarette, etc.), drug intake and doses, and exposure to any other environmental factors that may confound the observations made: this list is thoroughly inexhaustive! Indeed, before attempting to explore any disease-induced modifications to the salivary metabolome, it is critical that any secular alterations to the salivary metabolic profile that are encountered during the daily lives of healthy control participants, including the diurnal variation of selected biomolecules present in this biofluid, are fully considered. Fortunately, some important developments have been already made in relation to these important ruminations [3,7].
Therefore, in this update, we continue in Section 2 by delineating the sources and composition of human saliva samples, with a particular emphasis on whole mouth saliva (WMS) and the relative contributions of the host system and the oral microbiome towards its molecular composition. Section 3 provides an outline of the many advantages offered by the use of saliva as a biofluid for the screening of potential biomarkers, not least because of its ease of collection with only minimal supervision required; possible disadvantages of its use as an analytical matrix are also relayed. Section 4 explores the different types of salivary metabolomics investigations possible, whilst Section 5 provides a brief outline of the history of NMR-based salivary metabolomics and our group’s role in these early developments. Section 6 then describes our own recommended protocols for the collection, transport, and storage of WMS specimens, and their preparation for NMR analysis, with details regarding precautions that should be taken against the adverse generation of bioanalytical artefacts during these episodes—we also compare these regimens with those instigated by other researchers. Section 7 reviews pulse sequences commonly employed for the 1H NMR spectroscopic analysis of WMS supernatants and considers some perspectives for the future application of these techniques and also provides valuable information on the first of two case studies, which involve an investigation of salivary metabolite resonance line-widths and the plausibility of their possible dependence on salivary protein concentrations and WMS protein-metabolite equilibria. Section 8 features a review of the bioanalytical assignment advantages offered by two-dimensional NMR strategies, both homo- and heteronuclear. In Section 9, we discuss the quantification of WMS metabolites using NMR techniques for MV metabolomics data analysis, including spectral bucketing, preprocessing, data normalization, and scaling options available, together with dimensionality reductions of large or very large 1H NMR-linked WMS supernatant datasets. Section 10 offers a full outline of salivary phenotype analysis and for the first time reports a second case study involving a large number of WMS samples (n = 5 each for no fewer than 48 healthy control human participants); UV considerations of and the between- and within-participant components of variance for each of 31 individual 1H NMR-determined metabolites were made, followed by the application of MV models to distinguish between the magnitudes of differential pools of these analytes for each participant. We then applied factor analysis to determine component loadings of metabolites in an attempt to segregate a total of four orthogonally distinct pools of within-component-correlated salivary biomolecules on the basis of their physiological sources (e.g., host- or oral microbiome-derived), and/or metabolic pathway involvements. Section 11 is then primarily concerned with the future applications and prospects offered by the employment of LF non-stationary benchtop NMR spectrometers for direct assessments of the oral health status of dental patients at clinical ‘point-of-contact’ sites, including dental surgeries—the advantages and limitations of this novel approach are discussed in detail. Finally, Section 12 concludes this update and review, and provides relevant recommendations for the future performance of NMR-based metabolomics investigations of human saliva.
In a follow-up publication, Part II of this series critically reviews reported observations acquired from metabolomics studies focused on chemopathological evaluations of both oral and non-oral (systemic) diseases, respectively, the former (Section 2) focused on localized oral disorders featuring periodontal, dental caries, and oral cancer conditions, the latter (Section 3) drawing on salivary metabolomics analysis reports on types 1 and 2 diabetes, cardiovascular diseases, Sjörgen’s syndrome, and a series of cancers and neurological conditions, along with virus infections. The latter viral disorders heading includes a consideration of saliva as a possible biofluid medium for the metabolomics testing of SARS-CoV-2 infection and its related pathophysiological effects, together with HIV and acute sore-throat conditions.
Although the authors also regularly employ high-resolution NMR analysis for the ‘speciation’ of metal ions in human saliva, i.e., determinations of the precise molecular nature of their complexes or chelates in this biofluid [5,13], information that plays an important role in relation to their cellular uptakes and potential toxicities (where relevant), such interesting developments are beyond the scope of this paper and will not be discussed further here.
Likewise, although the wide range of advanced statistical analysis techniques available for the UV and MV statistical analysis and computational intelligence strategies available for the provision of essential biomarker and metabolic pathway perturbance information in metabolomics investigations are not reviewed in detail here, the two case studies featured do outline relevant examples of their applications in our laboratories.

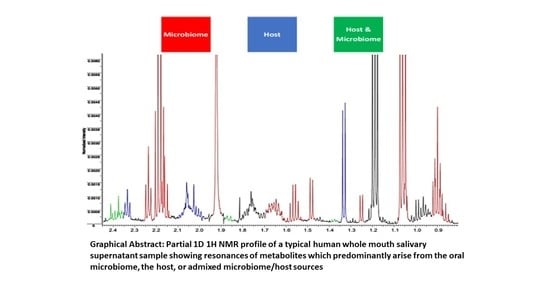
2. Sources and Composition of Human Saliva: Host and Microbial Contributions

Saliva is best described by an ‘umbrella’ term, as noted by Gardner et al. in [7], since it encompasses biofluids generated within the oral cavity via a series of glands, three major and up to 1000 minor ones. The fluid formed during drooling or spitting is often referred to as whole-mouth saliva (WMS) [14] and is generated by a composite of these major and minor glands, gingival–crevicular fluid (GCF), a filtrate arising from blood serum that penetrates the mouth from tooth gingival margins and epithelial and leukocytic cells, together with bacterial loads [15]. Major glandular contributions towards human WMS are fluids secreted by the parotid (parotid saliva (PS)), and the submandibular and sublingual (SM/SL) glands. Since the latter sources both utilize the same route of entry into the mouth, their separate collection for experimental purposes is extremely complicated and practically not possible. Fluids yielded by the minor glands are known as minor gland saliva, but their specific, differential sites of generation may be anatomically described, for example fluids from the palatal or labial sites [16]. Although the non-glandular components of WMS only contribute marginally towards its total fluid volume, such small proportions are nevertheless significant regarding its overall biomolecular composition and hence are of major interest to those exploring NMR-based metabolomics as a research tool. Typically, the salivary microbiome contributes quite substantially towards the nature and levels of a range of biomolecules present in WMS, some of which may potentially serve as selective biomarkers for bacterial preponderance in selected oral diseases, e.g., particular patterns of organic acid anion catabolites derived from P gingivalis in dental caries [2,3]. Hence, saliva represents a conglomerate hypertonic ‘solution’ containing salivary acini, oral mucosal exudates, and GCF.
Since salivary glands are strongly vascularly infiltrated, non-bacterial-derived biomolecules present in saliva filtered and processed therefrom may arise exclusively from these glands or may originate from blood-borne sources via passive diffusion and/or active transport mechanisms. Hence, many biomarkers detectable in blood serum or plasma for systemic (non-oral) diseases may also be detected in human saliva, although it should be noted that the salivary concentrations of these species are often present at much lower concentrations, which may present problems with bioanalytical sensitivity issues, especially for studies featuring 1H NMR analysis, as outlined in Section 3.1 below.
The normal pH value of healthy human saliva usually lies within the 6.2–7.6 range, and the ‘resting’ pH of the mouth rarely drops below 6.3 [17]. The pH is maintained close to neutrality (6.7–7.3) in the oral cavity by the quite powerful buffering capacity of this biofluid. Indeed, human saliva effectively removes carbohydrates that may be catabolized by microbes to generate cariogenic organic acids, which themselves are eliminated by salivary actions. Moreover, the buffering capacity of human saliva serves to exert neutralization actions towards H+ ions provided by the dietary consumption of acidic foods and drinks, in addition to those arising from bacterial actions. Although human saliva has a significant protein content of 1.40–6.40 g/L [18], these levels are lower or much lower than 10% of that present in human blood plasma (65–83 g/L) [19].
In principle, correlations observed between WMS metabolite concentrations and saccharolytic and/or proteolytic bacterial loadings may provide valuable biomarkers for monitoring differential levels and activities of the human oral microbiome. Such indices may reflect the induction, establishment, and progress of selected oral diseases (typically PDs and dental caries); however, they may also indicate a deterioration in oral hygiene status, for example. According to Gardner et al. [20], WMS citrate, lactate, and urea act as metabolites arising from the salivary host, although it should be noted that salivary lactate levels are often much greater than those of human plasma (reported mean, within-participant WMS supernatant levels of up to 20 mmol./L have been observed [3], although one lactate concentration was actually >60 mmol./L), whereas those of blood plasma are ca. 1.5 mmol./L [21], and hence it appears very unlikely that it may all be derived exclusively from a host source alone. Also of importance, we only very rarely detect citrate in the 1H NMR profiles of human WMS supernatants, and, therefore, if it is present therein at levels beyond the lower limit of detection (LLOD) value, which is ca. ≤5 μmol./L at an operating frequency of 600 MHz, then its value as a salivary 1H NMR biomarker for host source-derived biomolecules is extremely limited. However, WMS urea, which is readily detectable and quantifiable by 1H NMR analysis, appears to represent a valuable marker for such a host origin. Indeed, consistent with the observations of Gardner et al. [20], we find only very limited correlations between WMS urea concentrations and those of all other metabolites monitored (r values predominantly ≤0.25, as detailed in Section 10), including organic acid anions, amino acids, and amines, along with a range of further biomolecules. Furthermore, [20] also reported quite strong negative correlations between both the saccharolytic and proteolytic fractions of WMS bacterial counts. A typical high-field (600 MHz) 1H NMR spectral profile of a WMS supernatant sample is shown in Figure 1, and a corresponding listing of the identities of all salivary metabolite resonance assignments made, along with their respective chemical shift values and coupling patterns, is available in Table 1. For the spectrum shown, there is a grand total of 131 resonances, to which 98 metabolites were assigned (albeit 19 signals tentatively so), with four remaining unassigned. An estimated ≥90% of all signals found, including those affected by superimpositions with other biomolecule resonances, are included in Table 1.
As previously reported [2,3,4], these typical spectral profiles provide a wealth of valuable metabolic information concerning the nature and salivary concentrations of an extensive range of biomolecules, both host- and oral microbiome-derived, including many organic acid anions, amino acids (both aliphatic and aromatic), carbohydrates, malodorous amines such as trimethylamine and putrescine, choline and its derivatives, N-acetyl sugars, and N-acetyl amino acids, etc. Also detectable are a number of broad resonances that presumably arise from salivary proteins, most notably those centered at ö = 6.85 and 7.55 ppm. These signals are therefore likely to be assignable to protein tyrosine, phenylalanine, tryptophan, and/or histidine residues, and in [20], Garner et al. also found these resonances in both WMS supernatant and parotid saliva samples. In view of this observation, it appears very likely that such macromolecules arise from a host and not a microbial source. Therefore, the intensities of these signals, and hence the concentrations of their assigned biomolecule(s), may potentially be valuable for determining host contributions towards the salivary metabolome. Further experiments to explore this are currently in progress in our laboratories.
Although previous 1H NMR-based metabolomics investigations of PS and SM/SL saliva samples have been very restricted in the context of poor spectral resolution, limited numbers of participant donors, and gland inflammation complications for the latter [22,23], Gardner et al. [7] compared the 1H NMR profiles of PS and SM/SL saliva samples collected from the same donors and concluded that there were no major differences between them. However, although understandable because of collection problems, unlike those experienced with WMS, the relatively limited sample size involved (n = 10) may be insufficient to draw robust conclusions from this, and therefore the authors recommend that a full 1H NMR-based metabolomics investigation should be performed in order to seek, and possibly confirm and verify, any metabolic differences detectable, if indeed justified.
Particularly noteworthy is the phenomenon that, as noted by Gardner et al. [7], the overall physiological significance of salivary metabolites such as short-chain organic acid anions is predominantly unknown. However, in the human colon, such bacterial catabolites, e.g., n-butyrate, propionate, lactate, and succinate have been ascribed principal actions in relation to human health. Indeed, these catabolites exert important roles in the maintenance of gut epithelial integrity, especially for n-butyrate, which is known to stimulate the tight junction expression and synchronizes colonic epithelial cell proliferation; these processes occur through the inhibition of histone deacetylase inhibition, an upregulation of the expression of apoptosis-supporting-genes [24,25], and the ability to exert actions regarding metabolic and immune regulation functions [24,26]. Interestingly, they also play roles in the regulating the satiety and appetite of the host [27].
In 2017, Louis and Flint [28] provided an overview of the generation of propionate and n-butyrate by human colonic mucosa, and they note that both these microbial catabolites exert or promote a series of favorable health-friendly actions. Such organic acid anions may arise from the bacterial degradation of dietary carbohydrates, and from amino acids liberated from the actions of proteolytic bacteria on proteins. The critical role of cross-feeding of intermediary metabolites such as lactate, succinate, and 1,2-propanediol between different species of gut bacteria was outlined, as was the influence of environmental elements such as host dietary changes, on the growth and preponderance of propionate- and n-butyrate-generating bacteria; all these metabolites are routinely detectable in the 1H NMR profiles of human saliva [3]. Approaches for the optimization of organic acid anion furnishments to the host do, therefore, require a comprehensive understanding of the metabolism of such species by gut microflora populations.
Moreover, although modern developments and advances in molecular biology have furthered our understanding of the human oral microbiome, to date, knowledge regarding its metabolic actions and activities remains limited [29]. Saccharolytic bacteria, such as Actinomyces, Streptococcus, and Lactobacillus, serve to degrade saccharides and polysaccharides to organic acid anions, which are commonly found in human saliva, e.g., pyruvate, lactate, acetate, and formate, through the Embden–Meyerhof–Parnas glycolytic pathway and its branches, processes that may lead to dental caries. Hence, such organic acid anions all prospectively offer biomarker applications.

Nutrient Availability for the Oral Microbiome

In the oral environment, the availability of exogenous nutrient substrates for the oral microbiome is restricted, largely because of the relatively rapid salivary clearance of ingested carbohydrates through enzymatic and physical actions (usually within a several hour period, as notable from Figure 2), and therefore it is temporal for most humans. In contrast, the colon has a much more retentive, undigested source of such agents, and this accounts for a significant key difference between them. However, in the absence of ingested carbohydrate sources, microbially derived salivary catabolites are still produced, since, in general, their morning awakening levels remain higher than those monitored at all subsequent diurnal time-points. Moreover, with the exception of selected N-acetyl sugars, we find that ‘resting’ morning awakening human saliva samples always contains little or no carbohydrate nutrients such as glucose and sucrose and no other dietary carbohydrates potentially available to the oral microbiome [30]. However, in this report, salivary flow-rate was not monitored, and elevated salivary metabolite concentrations may arise from its diminished morning ‘awakening’ rate when expressed relative to those experienced at later diurnal time-point settings. Interestingly, as reported by Gardner et al. [31], enhancements in salivary metabolite concentrations observed in awakening participants in the study documented in [30] were not found to be homogenous, as indeed we might expect if only significant reductions in salivary flow-rate as a determinant were observed. These awakening-mediated fold-change increases in mean salivary levels for choline, n-butyrate and valine were 3.1, 3.6, and 15.7, respectively; those for methyl- and trimethylamine were 3.5 and 6.0, respectively. The early a.m. upregulation in choline, which represents a catabolic precursor of salivary methyl- and trimethylamines [32], is actually very similar to that of the former, and not dissimilar to that of the latter amine, so perhaps they are inter-related anyway. Perhaps there are significant correlations, positive or negative, between these levels in such samples.
From our factor analysis applied for the first time in Section 10 (Case Study 2), we find that, although choline is strongly loaded on putatively host-derived Component 1, it also significantly loaded on oral microbiome-sourced Component 2, which also strongly loaded trimethylamine (TMA); these components are orthogonal (uncorrelated). Component 3, however, which putatively contains correlated biomolecules arising from a separate bacterial source, loads methylamine (MA) and dimethylamine (DMA), in addition to TMA. Although probably unrelated in view of its generation from enzymes present in many saccharolytic bacteria, acetate, a further product of choline metabolism (along with acetaldehyde and ethanol) [33], was found to load strongly on Component 2, as expected. Nevertheless, a further dietary source of TMA is carnitine [34], and both phosphatidylcholine and betaine also serve as precursors for it.
Salivary proteins also provide a source of nutrients for oral bacteria, and the substantial rises in valine observed in [30] indicated proteolysis. Furthermore, the n-butyrate upregulation observed may be explicable by its generation as a terminal catabolic product from selected amino acids, notably lysine and glutamate [29,35,36]; however, both lactate and succinate are involved in n-butyrate biosynthesis. Intriguingly, microbial biofilms in saliva have the ability to catabolize proteins therein [37], processes that generate high concentrations of organic acid anions, proline and 5-aminovalerate, together with the biogenic amine putrescine [38]. As displayed in Figure 1, these three catabolites are all detectable in the 600 MHz 1H NMR profiles of human saliva. Succinate and lactate, which are known to be featured in the generation of n-butyrate, were also found to be metabolically consumed in the baseline-sterilized saliva used in the studies reported in [38].

3. Advantages and Disadvantages of Saliva as a Bioanalytical Medium for the Seeking, Identification, and Determination of Biomarkers

3.1. Ease of Collection and Metabolite Concentration Considerations

As with blood plasma and urine, saliva is a highly complex biofluid containing a multitude of biomolecules that are receptive to 1H NMR analysis, along with other analytical strategies for this spectroscopic technique such as homo- and heteronuclear 2D techniques. However, like plasma, but unlike urine, saliva has significant levels of proteins present [18, but, as noted above, this is only approximately ≤10% or so of that of blood plasma, and we find that this offers little or no interference with the 1H NMR determination of salivary metabolites [2,3,4]; even healthy human urine contains trace levels of proteins, which in the majority of cases do not obstruct the quantitative analysis of biomolecules present in this biofluid. Similarly, all these biofluids also contain a broad ‘spectrum’ of non-NMR-detectable or -visible biomolecules; the latter analytes are below pre-specified LLOD and hence lower limits of quantification (LLOQ) limits for these agents.
Although the conventional and traditional analyses of blood or blood plasma/serum samples is considered integral for the majority of clinical diagnostic and prognostic monitoring work-tasks, methods or protocols available for their collection are hampered by its high expense (most especially in health services), its invasive physical intrusion, the requirement for a trained healthcare specialist (e.g., phlebotomist or trained nurse) for this purpose, and the possibility of adverse reactions to the collection technique experienced by a very small but nevertheless significant proportion of study participants (on Research Ethics Committee-approved participant information sheets, it is usual to warn participants about these possible adverse side-effect associated with blood sample collection, e.g., experiencing dizziness or feeling faint, etc.). However, the collection of saliva is virtually non-invasive and non-intrusive, and can be achieved by patients/participants themselves, often in their own homes, without any clinical supervision required. This non-invasive collection strategy for the detection and/or monitoring of clinical conditions clearly circumvents the discomfort often associated with blood sample collection.
In addition to the simple straightforward, non-invasive, and painless method of saliva sample aspiration (albeit subject to a number of important requirements), further major advantages associated with the use of saliva as a sample matrix in NMR-linked metabolomics studies are that (1) samples are more readily shipped and stored—saliva requires much less laboratory handling and processing than whole blood, and it obviously does not clot; (2) its collection is economical, which reduces costs for healthcare providers and/or researchers; and (3) samples are safer to handle—notably, saliva naturally contains agents that suppress HIV infectivity, and therefore its handling and laboratory processing presents risks of only extremely restricted or negligible rates of oral HIV transmission [39].
Notwithstanding, one already established major disadvantage of the use of saliva in a metabolomics and general biomarker analysis context for extra-oral diseases is the knowledge that levels of such monitorable analytes are always lower or substantially lower in this biofluid than they are in blood samples, as whole, or its plasma/serum isolates [40]. For example, the high-molecular-mass marker IgG has a blood serum concentration lying between 5–30 g/L but is 1000-fold lower in corresponding saliva specimens [41]. Furthermore, for IgA, serum levels are 2.5–5.0 g/L, whereas they are only 0.25–0.50 g/L for saliva [41], i.e., a 10-fold lower mean difference.
Reassuring, however, are the known correlations between blood and saliva sample metabolites, although the authors of this paper stress that it is indeed critical to pre-establish non-fluctuating, strong correlations or relationships between biomarker concentrations prior to the use of saliva for such biomarker monitoring studies, most notably for those involving extra-oral diseases. However, unfortunately many blood plasma metabolites that may potentially act as disease biomarkers and that are transferable to human saliva are usually present at levels that are perhaps <100 μmol./L in the former biofluid, or even at much lower concentrations. If this is the case, and if these plasma concentrations are, say, 100-fold greater than those of corresponding saliva specimens, then they will probably not be 1H NMR-detectable nor serve to be disease-specific in the latter biofluid, despite the favorable advantages associated with its ease of collection.
Since some key biomarkers in human saliva that are or may arise from a blood-borne source are typically approximately 100-fold lower in concentration than those in blood plasma, and more sensitive techniques other than 1H NMR analysis are required for their identification and determination. Reviews of the advantages and possible complications associated with the use of saliva for biomarker monitoring purposes are available in [42,43,44], whereas its employment as a medium for the detection and analysis of drugs is documented in [45,46].

3.2. Value of NMR Analysis Techniques for the Metabolomics Analysis of Human Saliva

On comparison with other metabolomics techniques, such as LC-MS/GC-MS approaches, the NMR-based salivary bioanalysis strategy provides the valuable advantages of having only minimal requirements for sample preparation and hence associated rapid throughput rates; it also has the ability to detect and quantify a complete multitude of predominantly water-soluble metabolites simultaneously [6]. Moreover, the direct 1H NMR analysis of human biofluids, including WMS supernatants, can now finally be regarded as a high-sensitivity technique, with it now being possible to detect, and in some cases also quantify, concentrations of ≤5 µmol./L, and this without the prior application of any pre-concentration or extraction methodologies. A further advantage is that it is a virtually non-destructive bioanalytical technique, so, after allowing for the addition of usually ca. 10% (v/v) 2H2O as a field frequency lock, the same samples may then be analyzed by an alternative, perhaps more sensitive, albeit destructive methodologies, such as those employed in LC-MS metabolomics experiments. Supporting databases have also been established to aid with the identification of biomolecules from their resonance patterns visible in salivary spectra (e.g., [47]).

4. Types of Salivary Metabolomics Experiments

Overall, two major classes of metabolomics strategies may be considered: targeted and untargeted. The untargeted approach screens large or very large numbers of metabolites simultaneously in order to seek metabolic ‘fingerprints’, the constituents of which may serve as reliable biomarkers for health disorders of interest. However, in these untargeted approaches, large datasets of NMR resonances are produced, and these may give rise to some inaccuracies and high rates of false positives. Moreover, in virtually all studies of this nature, often there are at least some or even many signals that researchers have not been able to identify and assign correctly, and this complicates issues further; in such situations, it is recommended that one or more two-dimensional (2D) NMR techniques are employed to facilitate such assignments, for example, the acquisition of mononuclear 1H- 1H COSY or TOCSY, or binuclear 1H-13C HSQC spectra (Section 8). Hence, these approaches may be problematical for the reliable detection of biomarkers and their validation [48].
Primarily, the validation and cross-validation of biomarkers is usually performed via the random removal of a ‘test’ set of sampling group observations (usually one-third or so of them), and the remaining two-thirds of them are then employed to develop the model; this process is repeated many times, and the overall classification success is then determined, for example via the Q2 statistic, which measures the extent of correct ‘test’ set classification (on a ‘hold-out’ group of samples, usually of size one-third or so of all those available) and also permutation testing in partial least squares-discriminatory analysis (PLS-DA). Nevertheless, the only correct and acceptable method for the validation of selected biomarkers for both oral and extra-oral diseases is to administer a known therapy for the condition explored and to monitor returns of their salivary levels to a ‘normal’, healthy control range of values, which may be either up- or downregulations with respect to the disease group. Indeed, it should also be noted that these technologies are also readily applicable to studies focused on probing the hopefully favorable responses arising from the therapeutic actions of administered oral health care or other products. Ideally, such changes should be proportional or related to the condition’s severity. As an example, patients with the early stages of clinically established stage 1 PD (otherwise known as gingivitis), may receive an oral healthcare product, e.g., a mouth-rinse formulation containing a known therapeutic agent such as the bactericide chlorhexidine, or a peroxide or chlorite oxidant, according to a strict, carefully designed therapeutic application regimen. Then, in such a case, any salivary biomarkers putatively identified via such primary untargeted metabolomics approaches would be expected to return to their ‘normal’ range values if the treatment was known to be successful. That is the most successful and established method for establishing the validity of such biomarker molecules. However, it is of much importance to note that, despite this major requirement, many human salivary metabolomics investigations certainly do not progress onto this critical final phase of biomarker establishment and validation.
Targeted metabolomics, however, involves the ‘targeted’ quantification of a series of salivary metabolites that are already known on the basis of their established and characterized 1H NMR profiles, e.g., perhaps bacterial organic acid anion catabolites such as acetate, lactate, propionate, n- and iso-butyrates, succinate, formate, and 5-aminovalerate, etc. In this context, it aims to recognize unusual patterns or signatures of metabolites and their concentrations as an aid to diagnosing diseases and prognostically monitoring their severities, or for saliva samples, perhaps the excessive infiltration and preponderance of pathogenic bacteria may be monitored by the quantification of upregulated levels of such catabolites, which may serve as significant biomarkers of associated oral diseases and possibly also their severities. It may also be employed for screening modifications in metabolic responses to therapeutic interventions and active healthcare product ingredient doses, etc. [49].

5. Brief Early History of Salivary NMR Analysis and Associated Metabolomics Technology Investigations

Very early NMR studies of human saliva were somewhat limited since they were conducted at lower operating frequencies than those employed currently, and only a small number of assignments were made in view of unsatisfactory presaturation of the intense water signal, along with some significant overlap with a small number of interfering broad protein and other macromolecule resonances. As noted above, although our group’s publication of 600 MHz spectra acquired of HSS samples in 2003 [3] is often cited as the first fully comprehensive high-field NMR study [7], with assignments available for no fewer than 63 metabolites, and the first ‘true’ metabolomics study of this biofluid [6], the reality is that we first started acquiring such spectra on these samples at the Royal London Hospital Medical College as early as 1990–1991 on a then quite ageing 400 MHz Bruker NMR facility located at our sister Institution, Queen Mary College (QMC), University of London, plus occasionally on a more up-to-date 500 MHz Jeol JNM-GSX 500 spectrometer based at Birkbeck College, also at the University of London (University of London Intercollegiate Research Services (ULIRS) facility). However, publications involving assessments of the metabolic profiles of carious dentin biopsies and saliva, and evaluations of the oxidizing abilities of chlorite/chlorine dioxide- and peroxide-containing oral healthcare products towards biomolecules present in intact human salivary supernatants, only arose from this work in 1997–1999 [2,50,51] in view of our group’s specializations in a range of other non-dental and non-salivary pathological disciplines. This work was bolstered by the acquisition and our use of a new ULIRS’s 600 MHz Bruker instrument at QMC to replace the ageing 400 spectrometer based there in 1991, then the first of its kind in the UK, to the best of the authors’ knowledge, and assignments on these spectra were also fully comprehensive.

6. Recommended Protocols for the Collection, Storage, and Preparation of Human Saliva Specimens for NMR Analysis: Precautions against Artefacts, and Artefactual Metabolite Generation or Consumption

The integrity of saliva specimens and assurances on the maintenance of salivary metabolite concentrations so that they remain identical to those present at the point-of-collection, are a consideration that is of critical importance to NMR-based metabolomics investigations, and therefore adequate precautions should be taken to limit artefactual chemical modifications to selected metabolites from this point until ready for spectral acquisition, most especially during sample preparation and subsequent storage episodes.
Therefore, in order to provide optimized support for future salivary ‘omics’ studies, it is essential that recommended protocols have been established and provided in order to maintain analytical validity and permit viable comparisons between distinct studies performed by separate research laboratories. Such protocols aim to address problems encountered with differential sample collection, sample preparation, storage, and spectral acquisitional parameters for NMR analysis. For the 1H NMR [52,53] and LC-MS [54,55] analyses of blood plasma and urine, such protocols are already available, but quite recently, strategies for sample preparation of human saliva for 1H NMR analysis have been reported in 2020 [31], and these serve as corollaries to those already established for the LC-MS technique [56]. Following an extensive investigation of participant collection regimens, sample preparation techniques, and spectral acquisition criteria, the evidence-mediated protocol for salivary metabolomics studies proposed in [31] concluded that previously employed investigation protocols for the 1H NMR quantification of salivary biomolecules, and the utilization of unbuffered internal TSP as a quantitative reference standard, were found to be acceptable for most metabolite determinations, although inexplicably not so for methanol and acetate. Moreover, results acquired were found not to be significantly influenced by the nature and length of centrifugation and freeze–thaw regimens.

6.1. Saliva Sample Collection

Containers utilized for the collection of saliva specimens should be previously unused, clean, sterile, free of surface contaminants, of sufficient volume capacity, and with a collection mouth diameter sufficiently wide to permit the drooling of samples by recruited participants without any major complications or unnecessary spillage. Indeed, our group typically use sterile Universal plastic containers of 20 mL total volume. Collection of saliva specimens for metabolomics studies may be conducted using stimulated or unstimulated (passive drooling) approaches. Unstimulated or ‘resting’ WMS is simply collected via the passive drooling of this fluid into the above recommended sterile containers.
However, for the collection of stimulated saliva samples, participants are usually requested to chew on a softened paraffin wax or alternative solid chewing matrix. However, the authors of the current study certainly do not recommend this for 1H NMR-based metabolomics-style investigations, since such materials, commercially available or otherwise, usually release quite large numbers of interfering, 1H NMR-detectable product agents into the WMS medium during such chewing episodes; these may include some endogenous agents already present in this biofluid, including acetate and formate, along with glycerol and propanediols, etc. Importantly, sometimes salivary collection swabs may be employed for WMS collections, but again their abilities to markedly contaminate this biofluid with interferants should be considered in detail. An alternative stimulus for the collection of human saliva involves the application of a 2% (w/v) citric acid solution onto the dorsal surface of the tongue, but this chemical approach is not to be recommended since (1) it will be expected to substantially modify the pH value of the oral environment and that of saliva itself, which will serve to alter the metabolic status of this biofluid immediately prior to its collection; (2) application of such a solution-state acidic stimulus may act to dilute salivary metabolite levels; and (3) although not often 1H NMR-detectable in whole human saliva, measurements of salivary citrate concentrations are obviously precluded when using this approach. Clearly, the selection of saliva collection sample type and its quality may serve to hamper many metabolomics investigations, and as noted above, without the establishment of a homogeneous system for this process in all interested or collaborating laboratories globally, comparisons of metabolic datasets via meta-analysis and other research strategies are rendered severely limited, if not impossible. Furthermore, errors in saliva sample collection techniques may exert significant effects on results acquired and their physiological or clinical interpretations, and therefore every possible measure to circumvent these should be made.
In our laboratories, we request that participants are fasted for a minimum of 8 h, but preferably a 12 h duration prior to donating saliva specimens. With the assistance of a researcher, potential participants then complete a prior pre-screening questionnaire regarding the provision of essential demographic information, along with details concerning their medical and dental treatment histories, both recent and long-term. All successful participants are then requested to refrain from all oral activities, including eating, drinking, smoking, tooth-brushing, and oral rinse use, etc., throughout this period, including the short, ca. 5 min period between awakening and sample donation. They are also all requested not to consume any alcoholic beverages for at least 24, but preferably for 48 h, prior to the sample collection time-point. Despite this precaution, ethanol is often still detectable in the 1H NMR profiles of human saliva collected, even after a 48 h abstention duration; however, ethanol is, of course, an established microbial fermentation catabolite, i.e., it may also arise from the actions of selected bacteria, for example, Streptococcus mutans [57]. Moreover, 1H NMR-detectable methanol can be derived from the passive or direct inhalation of tobacco cigarette smoke, which contains quite high levels of this alcohol [58]. Following collection as directed above, samples are then transferred to the laboratory site on ice. We recommend that for each collection session, each participant should provide an absolute minimum volume of about 5–6 mL in order to permit the performance of replicate 1H NMR analyses, their use for other forms of analysis (e.g., LC-MS analysis, or F determinations via ion-selective electrode or 19F NMR spectroscopy), and also to ensure that there is sufficient clear human WMS supernatant sample remaining following the removal of cells, bacteria, and debris during the centrifugation step described below.

6.2. Abstention from Oral Activities Prior to Saliva Sample Donation: How Long Is Really Necessary?

Our protocol involving a minimum period of 8 but preferably 12 h appears to be acceptable since no 1H NMR resonances arising from contaminating agents derived from food or other sources are found in the spectral profiles acquired, although it appears that ethanol ingested in the form of alcoholic beverages can persist for 24 h or more. Conversely, that proposed in [31] for only a 1.0 h abstention period is clearly unacceptable (Figure 2), and this is likely to lead to erroneous representations of the source and longevities of selected metabolites, notably low-molecular-mass organic acid anions such as citrate, lactate, acetate, and formate, an expansive range of amino acids, carbohydrates, and lipids, along with any long-chain ‘free’ fatty acids derived from the hydrolysis of dietary acylglycerol species.
Figure 2 shows selected regions of the 600 MHz 1H spectra of supernatants of WMS samples collected from a healthy human participant immediately before, and at 0.50, 1.00, 2.00, and 4.00 h after, the consumption of a vegetarian sandwich meal, and from these profiles, it is very clear that citrate resonances, which were completely absent from the spectrum prior to eating, are prominent at a time-point of 30 min thereafter and persist for a duration of 4 h or more following the meal. Therefore, any future speculations or debates reading the sources of salivary citrate may be resolved, especially in studies that have only requested that their salivary participant donors only fast or refrain from all oral activities for periods as short as 1.0 h or so. Clearly, from current studies available [7,20], this key, metal ion-complexing metabolite appears to be predominantly, although not exclusively, derived from dietary sources.
Likewise, 1H NMR resonances arising from glucose and sucrose, which again were absent from the salivary spectra, were readily detectable in these profiles at post-mealtime-points of 30 and 60 min. Since these signals are still visible at the 60 min time-point, we therefore recommended that an absolute minimum fasting period of 2 h should be deployed to ensure exogenous carbohydrates reach levels at which they are no longer 1H NMR-detectable. As for exogenously introduced citrate, a much longer fasting period is required, since its salivary level remains detectable by this technique even at 4 h following meal consumption.
Intriguingly, it is of paramount importance to note that there are major post-eating upregulations in the salivary levels of lactate, pyruvate, succinate, and trimethylamine-N-oxide, and these results are fully consistent with those made by Gardner et al. in [31], which involved a study of participant responses to a sucrose rinse challenge. Since it appears that these concentrations firstly rise with time up to the 30–60 min time-points and then decrease slowly up to 4 h thereafter, again a restriction on oral activities for more than this period is certainly warranted. Again, a meal consumption limit restriction of only 1.0, or even 2.0 h, is clearly insufficient.
Additional major post-meal consumption changes to the 1H NMR profiles found included clear downregulations in alanine, ethanol, 3-aminoisobutyrate, and propionate, although decreases in salivary level for the latter metabolite at a 30 min time-point are compensated by a re-upregulation in its salivary level up until the 240 min time-point. Moreover, a small, apparent triplet centered at δ = 1.832 ppm develops from the 60 min post-eating time-point and increases in intensity thereafter (since this signal is tentatively assigned to the β-CH2 multiplets of either glutarate or propane-1,3-diol, possibly the assigned agent was dietary-derived). Further modifications to the spectral profiles observed comprised rapid (i.e., within 30 min) decreases in 5-aminovalerate followed by rises in its salivary level, and also decreases in those of all methylamines detectable, and taurine. Moreover, decreases in the α-CH multiplet proton resonances of histidine and phenylalanine (δ = 3.16 ppm) were also observed, and this observation is fully consistent with changes found in the aromatic region of spectra acquired (Figure 2d). Also visible in this low-field region were small decreases at the 30 and 60 min post-meal consumption time-points for formate, followed by a subsequent 120 and 240 min time-point approximate return to its pre-eating salivary concentration. Also notable is the slow and low-level development of the potentially host-sourced broad aromatic amino acid residue signals (δ = 6.85 and 7.55 ppm) from the 60 to the 240 min post-eating time-points. Similarly, an α-fucose resonance also becomes visible from the 120 min post-meal consumption time-point (Figure 2c).
A systematic review of a total of 39 independent studies focused on salivary metabolomics conducted herein (Table 2), demonstrated that only 34 of these specified a sampling abstention time limit for the collection of WMS samples, i.e., with the exception of water intake, complete refrainment from participating in all oral activities, usually eating, non-water drinking, smoking, use of oral healthcare products, and toothbrushing, etc. This specified parameter ranged from 0 to 12 h for all human investigations considered, with a mean ± SD value of only 1.90 ± 2.19 h. Worryingly, 24 out of the above 34 studies had abstention times of ≤1.5 h, and, therefore, it appears that many, if not all metabolites determined therein may be erroneously represented as those with salivary concentrations unaffected by the influence of external stimuli or exogenous agents, which most obviously include molecules derived from dietary sources. Only two investigations had an abstention period of ≥8 h, including one with a 12 h duration.

6.3. Post-Collection Maintenance of Salivary Biomolecular Profiles: Preparation, Transport, and Storage of Saliva Samples for NMR Analysis

On their arrival at the laboratory, collected saliva specimens should be immediately centrifuged at a minimum rpm of 3500 and 4 °C for a period of 15 min, and following sample preparation as outlined below, the clear WMS supernatants arising therefrom are then stored at −80 °C for a maximum duration of 72 h prior to NMR analysis. According to [31], the centrifugation rate and other centrifugal factors exert little or no effect on the quality and validity of the 1H NMR profiles acquired.
Aliquoted volumes (0.50 mL) of the resulting WMS supernatant samples are then treated with 60 µL of pH 7.00 phosphate buffer (0.10 mol./L) containing 0.04% (w/v) sodium azide (Na+/N3), and 50 µL of 2H2O containing 0.05% (w/v) 3-(trimethylsilyl)propionate-2,2,3,3-d4 (TSP), yielding a final TSP concentration of ca. 250 µmol./L. TSP acts as an efficient internal chemical shift reference and quantitative calibration standard; sodium azide serves as a microbicidal preservative in order to protect against the adverse artefactual generation and/or consumption of microbial catabolites during sample transport, storage, and preparation stages; phosphate buffer is used to control sample pH values and hence the maintenance of constant chemical shift values for selected, pH-sensitive metabolite resonances; and 2H2O acts as a field frequency lock. These mixtures are then thoroughly homogenized and transferred to 5 mm diameter NMR tubes ready for NMR analysis. However, the phosphate buffer addition step is not considered essential, since saliva itself has a strong buffering capacity with contributions from a combination of carbonate/bicarbonate, phosphate/hydrogen phosphate, and protein-based systems [97,98]. Moreover, the mean ± SD pH value of healthy human saliva, i.e., that collected from subjects with clinically healthy gingiva, is 7.06 ± 0.04 [17].
In order to achieve an optimal protocol for the post-collection transport (if required) and storage of WMS supernatants, a series of potential interfering and metabolite level-modifying factors should be considered in detail. Firstly, it should be noted that selected biomolecules are susceptible to oxidation on exposure to O2, some substantially so. Thus, free (non-protein-incorporated) salivary thiols (estimated mean concentrations of free cysteine, cysteinylglycine and glutathione (GSH) are ≤2, ≤0.4, and ≤3 µmol./L in human saliva [99]) readily oxidize to their corresponding disulfides, the overall process depicted in Equation (1) involving the generation of thiyl radical (RS) and superoxide anion (O2●−) intermediates, as does any tissue-derived GSH. However, NMR-based metabolomics researchers need not be too concerned about these processes, since these levels are at or beyond lower limits of quantification (LLOQ) thresholds, and cysteine resonances appear as a resonance height-diminishing complex ABX coupling pattern; such low intensity signals are generally strongly overlapped by those of higher concentration metabolites in the spectral regions involved in any case. However, the generation of any reactive oxygen species (ROS) from such autoxidation reactions, e.g., O2●−, hydrogen peroxide (H2O2) and ultimately hydroxyl radical (OH), may cause some oxidative damage to other, albeit ROS-scavenging biomolecules. Moreover, salivary pyruvate, and other 2-oxo-carboxylate species such as α-ketoglutarate can be oxidatively decarboxylated by H2O2 directly, with pyruvate being transformed to acetate and CO2 (Equation (2)) [100], and this directly relates to observations of relatively small but nevertheless significant increases in acetate level that we commonly observe following prolonged storage regimens, as have other researchers when samples are stored at 22 °C for 48 h [60]; however, acetate, along with formate, appear to also be terminal products arising from the radical-mediated decomposition or photodegradation of a wide range of organic biomolecules [101].
2RSH + O2 → RSSR + H2O2
CH3COCO2 + H2O2 → CH3CO2 + CO2 + H2O
Secondly, failure to satisfactorily eradicate the salivary microbe population as soon as possible following sample collection by added microbicidal agents such as azide or fluoride will lead to significant metabolite changes through the actions of microbial enzymes, and, to date, bacterial saccharolytic and protease pathways have been proposed to account for losses of salivary galactose, pyruvate, alanine, and choline, and increases in acetate, during storage of samples at 22 °C [60]. Decreases in choline and coupled rises in acetate and ethanol levels may be ascribable to the actions of oral bacteria, e.g., Streptococcus sanguinis [102]. Notwithstanding, time-dependent diminishing concentrations of lactate, pyruvate, and galactose observed at 22 °C may be associated with glycolytic pathway activities, along with the further involvement of other catabolic actions exerted by oral bacteria, for example consumption of lactate and n-butyrate by lactate dehydrogenase present in Streptococcus, Lactobacillus, and Actinomyces spp. [103] and conversion of lactate to acetate by Veillonella species [104]. Reductions observed in concentration, also at this temperature, appear to involve their use by selected bacterial species as a source of nitrogen [105].
Such artefactual effects exerted by the salivary microbiome during the collection, transport, storage, and preparation of saliva specimens for 1H NMR analysis can, at least in principle, be circumvented by the pre-treatment of samples with bacteriostatic agents such as sodium azide or fluoride. Sodium azide serves as a potent bacteriostatic agent that acts by blocking respiration via its inhibition of cytochrome c oxidase activity in gram-negative bacteria [106]; this is achieved through its ability to complex between a haem 3 iron ion and a copper ion B center located within the O2 reduction site [107,108]. However, azide also inhibits ATP hydrolase activity, although not its biosynthetic actions—similar actions are wielded on F-ATPases present in eubacteria and chloroplasts [109]. Potentially, a series of other bacterial haem, and iron–sulfur (Fe–S) proteins, and other metalloenzymes, are inhibitable by azide exerting its complexation properties at their metal ion centers.
Although the anti-caries activities of fluoride anion are largely associated with its influence on the mineral phases of teeth and remineralization, this agent also exerts significant microbicidal effects towards dental plaque bacteria, which yield organic acid catabolites and hence localized acidotic environments that, in turn, give rise to demineralization processes. Indeed, previous investigations have revealed that fluoride can attenuate bacterial metabolism through a series of processes involving differential mechanisms [110]. For example, it may act directly as an enzyme inhibitor, notably on the glycolytic enzyme enolase in a quasi-irreversible fashion. Additionally, inhibition of haem-based peroxidases with the complexation of fluoride by haem iron ions acts as a direct mechanism of action; Fe(III) ion has a very strong affinity for hard-donor fluoride anion (stability constant for the mono-fluoro-substituted Fe(III) complex (FeF2−) = 1.62 × 10⁵ M−1 [111]).
Thirdly, the actions of salivary enzymes may persist during and immediately after collection. As noted above, very recently, Duarte et al. [60] employed NMR spectroscopic analysis to monitor changes in any salivary metabolite levels occurring throughout short-term storage periods, at ambient temperature, as well as +4 and −20 °C, and following sample preparation methods at ambient temperature and +4 °C, and simulating conditions experienced within clinical and laboratory settings. Notably, significant inter-participant and inter-sampling day variabilities were observed, and these results concur with those reported by us, both previously [3] and in this report (Section 10). Following sample collection, no modifications were observed by these researchers during storage at −20 °C for a period of at least 28 days, whereas, as expected, ambient temperature storage gave rise to decreases in the concentrations of selected metabolites.
Therefore, the above study concluded that following collection, saliva samples may be stored at ambient temperature, or in the refrigerator at +4 °C, for periods of up to 6 h, and at −20 °C for at least 28 days. When prepared for NMR analysis, samples were found to remain stable at 25 °C for up to 8 h, and at +4 °C for up to 48 h Sodium azide addition averted potential early concentration changes in fucose, proline (6–8 h), and xylose (24 h). However, it should also be noted that a number of Gram-positive bacteria, for example Streptococci and Lactobacilli, have been reported to be somewhat resistant to the bactericidal actions of sodium azide [106,112]; these genera are prevalent in cariogenic and saccharolytic dental biofilms.
Of critical importance, in 2008, Esser et al. [113] investigated the stability and longevity of the protein content of human WMS in samples provided from the time-point of collection both with and without added inhibitors of bacterial metabolism and proteases. Results acquired showed that protein degradation took place within 30 min of specimen collection and commenced during the actual sample donation process. Although protease inhibitors such as phenylmethylsulphonyl fluoride (PMSF) were found to partially suppress this process, blockers of bacterial metabolism did not. Stable protein deterioration products, which were peptides with molecular masses of 2937, 3370, and 4132 Da, were discovered, and the authors suggested that these may be employed as markers of saliva sample quality. In view of these observations, we should perhaps expect some increases in the salivary concentrations of free amino acids from the point of collection until the analysis of samples; however, with the exception of small increases in salivary proline in samples untreated with sodium azide at ambient temperature or at +4 °C, the study documented in [60] did not find such storage- and laboratory processing-dependent upregulations. Moreover, we still find evidence for the retention of selected salivary protein species in samples following our standard collection, sample preparation, and storage phases, the latter involving prolonged biobank depository episodes at a temperature of −80 °C (Figure 1). Although we may expect species of molecular mass up to 4000 Da to have 1H NMR resonances with slightly or only negligibly higher Δv1/2 values than those of low-molecular-mass metabolites (ca. 1.5–2.5 Hz), they would certainly not be as large as those of the broad aromatic signals noted in Figure 1 (ca. 55 Hz). In any case, the authors of [113] recommended the freezing of saliva samples immediately following collection, for example, in liquid N2, in order to minimize protein deterioration. However, the processing of specimens at only +4 °C, together with the use of protease inhibitors, can also facilitate protein retention therein. Nevertheless, exposure of salivary protein to freeze–thaw episodes may give rise to significant levels of their denaturation, and hence appropriate caution should be applied where this phenomenon is observed.
Interestingly, fluoride has the ability to inhibit human salivary amylase activity when present at added levels of ≥50 mmol./L [114], and this process has been speculated to occur via a mechanism involving its complexation of the critical Ca2+ ion required for this enzyme’s activity. Indeed, this metal ion may form intramolecular cross-links with the protein. Since a range of enzymes that require Ca2+ as a co-factor for their activities are inhibited by F, the mechanism featured in this process may involve the F-mediated transference of Ca2+ [115]. Of further note, the observed inhibition of human salivary amylase by the metal ion complexant azide [116] may involve a similar mechanism involving the perturbation of this critical Ca2+ ion linkage, and therefore it may conceivably block such Ca2+-dependent amylase activity.

7. NMR Pulse Sequences: Recent Advances and Future Prospects

The great majority of all NMR-based metabolomic investigations hinge on use of the metnoesy 1D NOESY experiment or a related version of this sequence. However, pulse sequences used in metabolomics experiments are always determined by the exact nature and molecular composition of study samples, for example, urine, saliva, or blood plasma, as three major classes for consideration. Since the majority of biofluids are aqueous solution-based (although blood plasma and serum can be considered as special cases of ‘mixed solvent systems’ in view of their significant lipoprotein-associated lipid and cholesterol contents), an absolutely essential water suppression activity in the pulse sequence is a pre-requisite, and water (and HOD) signal presaturation [117] generally represents the optimal selection for quantitative analysis purposes. Moreover, an augmenting NOESY mixing block is generally also incorporated into NMR analysis protocols in order to ameliorate the baseline and vanquishing of the water signal [118]. In general, this approach is routinely employed for the simultaneous multimolecular analysis of urine and saliva samples, in view of their very low and low protein contents, respectively. However, samples that contain high-molecular-mass agents such as proteins and polysaccharides, etc., are analyzed utilizing NMR acquisitions that involve relaxation time filtering systems to improve the visualization of much sharper, low-molecular-mass biomolecule resonances [119]. Indeed, without the application of such filters, 1D single-pulse 1H NMR spectra of protein-rich blood plasma contains a broad protein resonance envelope that severely overlaps with or obscures many of the much sharper low-molecular-mass signals arising from free amino acids, sugars, and organic acid anions, etc.
The favorable acquisition of NMR spectra is also critically dependent on a range of different parameters, for example, the relaxation delay, spectral width, and number of scans utilized, that exert a powerful effect on the signal-to-noise (STN) ratio and spectral quality. Currently, software packages are mainly restricted to those provided by NMR facility manufacturers (TopSpin (Bruker) and Delta (Jeol, USA)), but this is certainly not the case with the multitude of differing software options usable for additional data-handling stages involved.
Of course, moving forward from 1D NMR experiments to 2D NMR strategies offers major spectral interpretational advantages, and in metabolomics, these technologies regularly serve as highly valuable facilitators for verifying assignments made in 1D spectral profiles. Indeed, it is recommended that such 2D approaches are conducted before the acquisition of 1D spectra for the bulk dataset, so that researchers are very clear on the identities of resonances present in highly complex, metabolically rich biofluid samples such as human saliva, in which >60 metabolites can be detected, and many of these quantified, at an operating frequency of 600 MHz; yet more biomolecules will, of course, be detectable at operating frequencies of ≥700 MHz in view of greater spectral resolution and enhanced sensitivity. Unfortunately, a small number of salivary metabolomics publications appear to contain a number of biofluid spectral misassignments. However, the seeking, detection and clarification of any superimposing resonances in the 1D profiles also serves as a major bioanalytical bonus, and this permits researchers to seek alternative 1H NMR signals or even analytical methods for quantification purposes in such metabolomics investigations, most especially if the analyte is a potential key, albeit targeted, biomarker molecule.

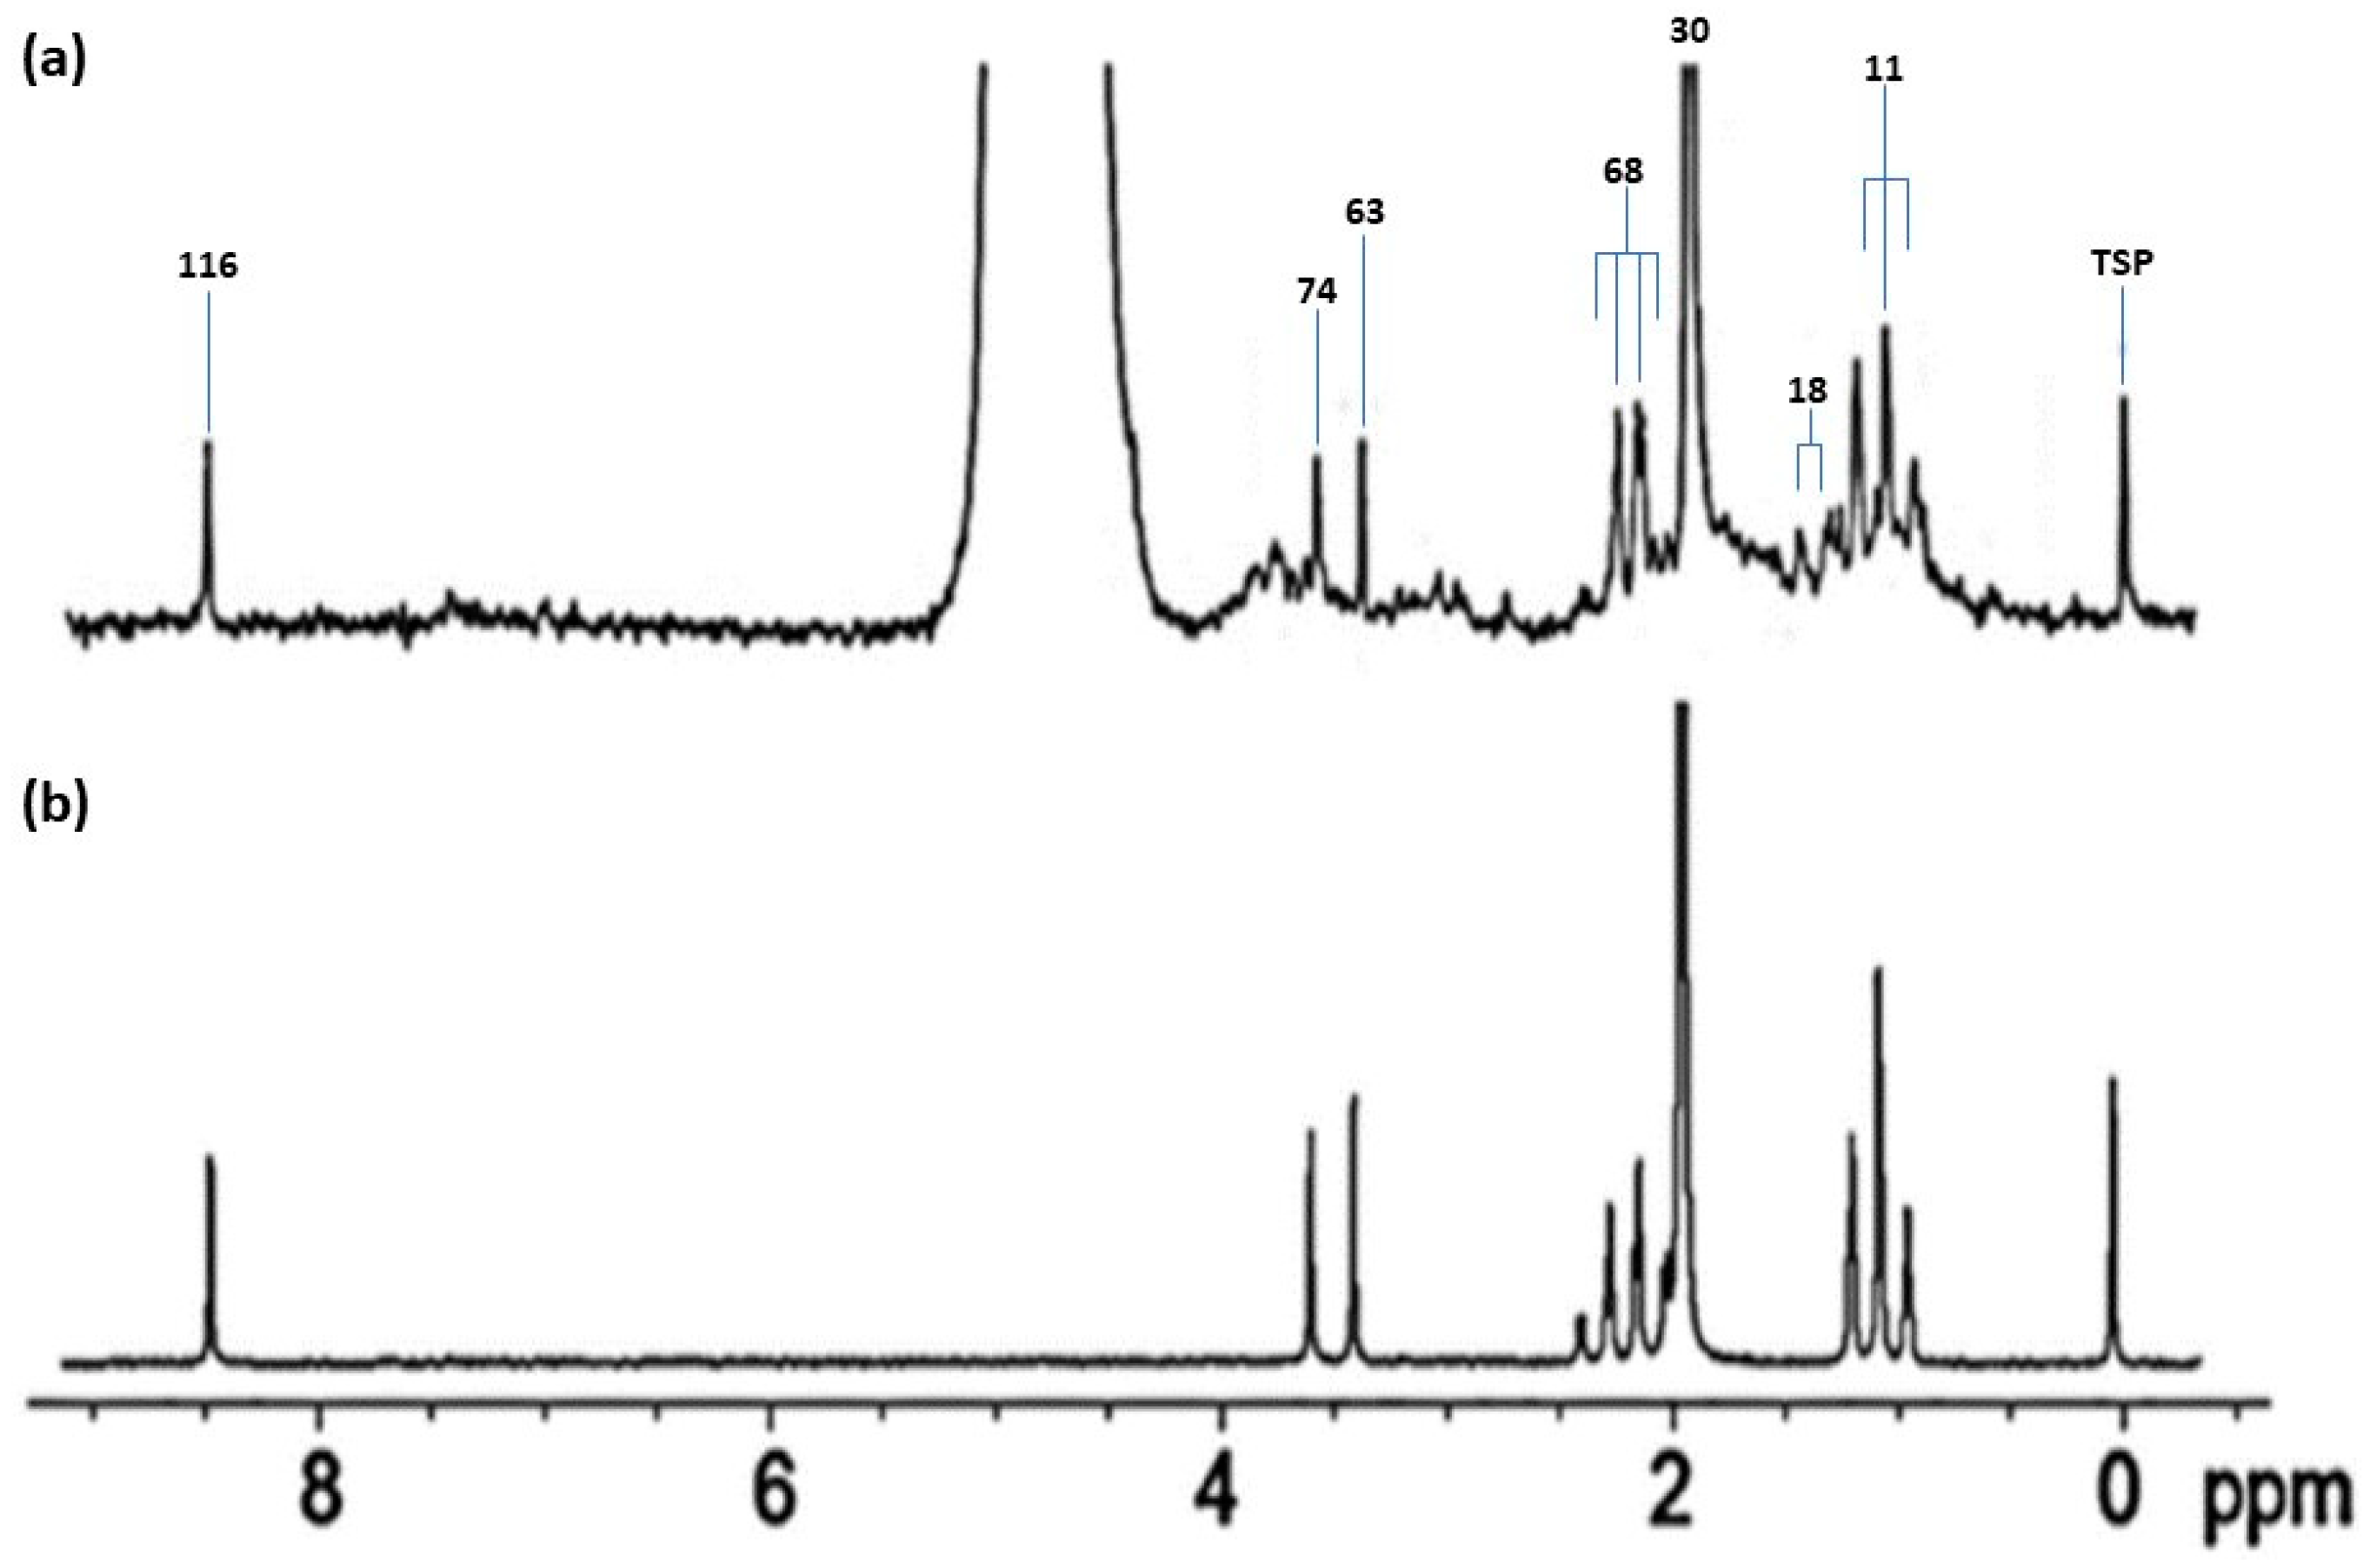
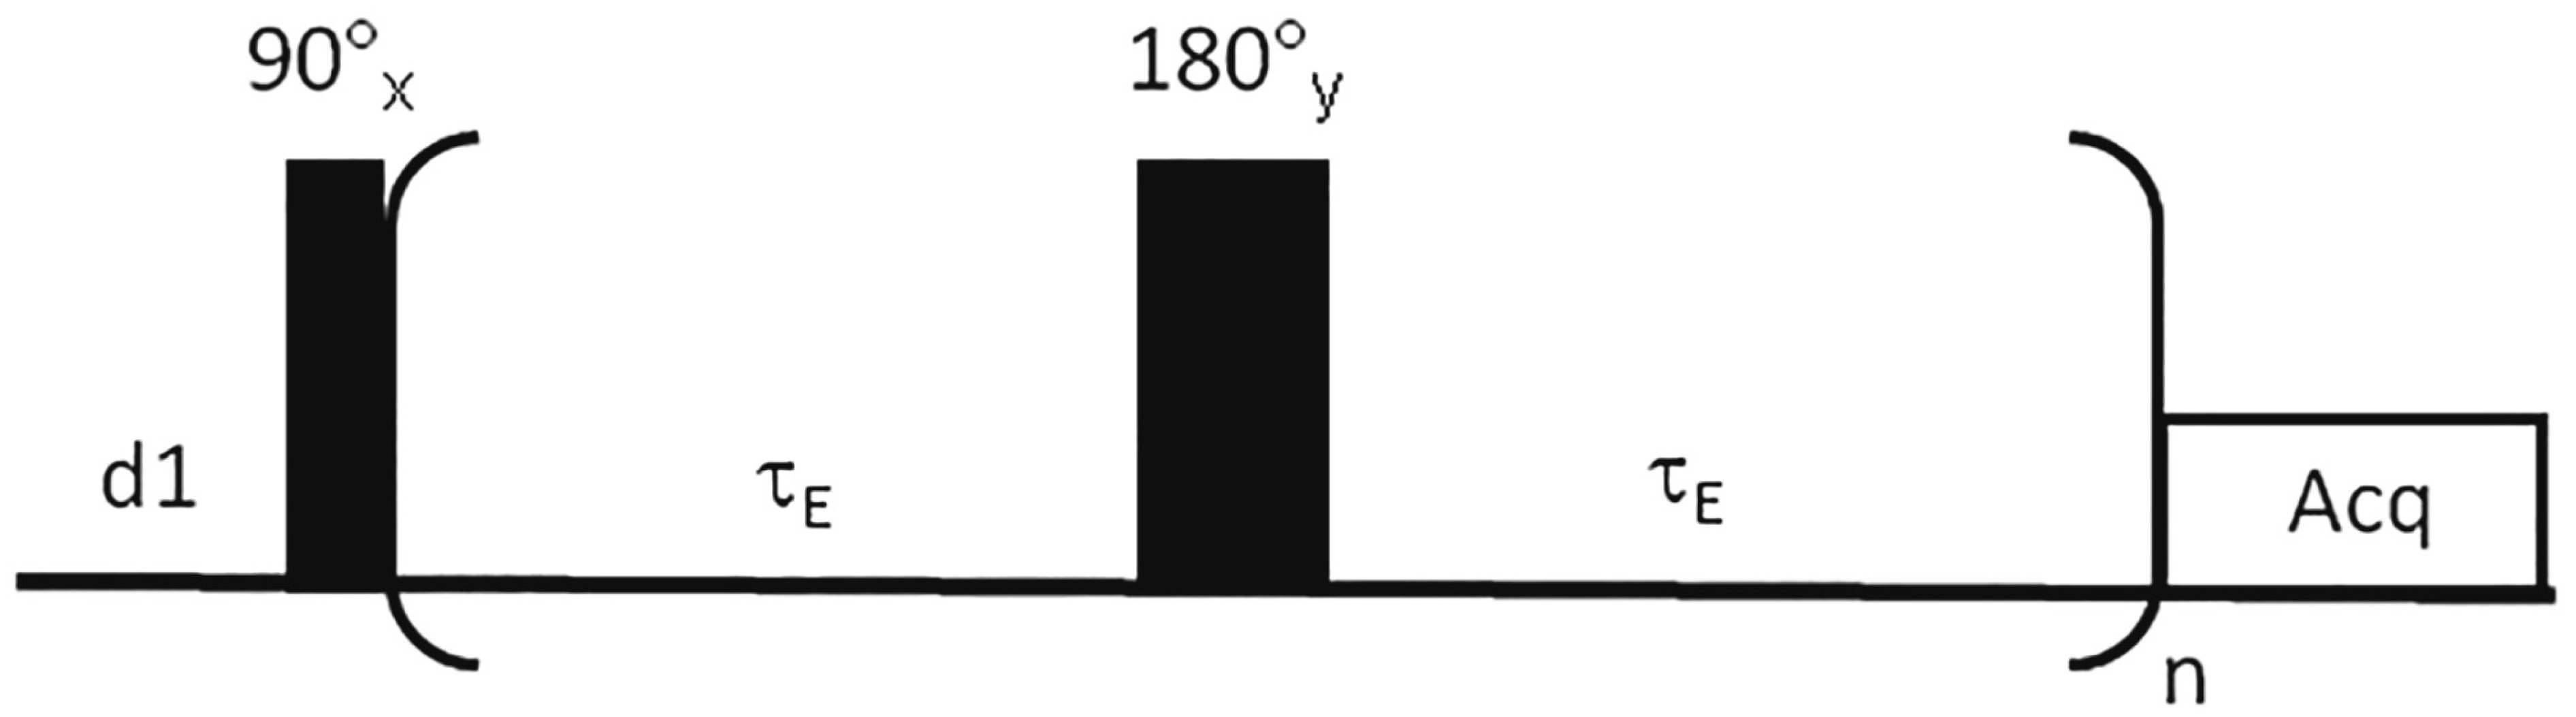
7.1. Value Offered by the Application of Spin-Echo (CPMG) Pulse Sequences to Human Saliva Sample Analysis

The Carr–Purcell–Meiboom–Gill (CPMG) multi spin-echo pulse sequence serves as a valuable spin–spin (transverse) T2 relaxation time filtering system that has been widely exploited in metabolomics studies of biofluids containing relatively high protein contents such as blood plasma or serum. The applications of this pulse sequence are built on the differential T2 values of low- (e.g., free amino acid and organic acid anion, etc.) and high-molecular-mass (e.g., proteins and polysaccharides, etc.) biomolecules, which are of course shorter or much shorter for the latter class of molecular species (Figure 3). By careful selection of the 2τE (2 × echo time) and n echo parameters, broad biological macromolecule signals with short T2 indices may be significantly attenuated or completely removed from 1H NMR spectral profiles, whereas, in view of their longer relaxation times, sharp resonances arising from low-molecular-mass metabolites remain readily detectable and, dependent on methods adopted or adapted for such purposes, are also quantifiable, assuming that there is no or only very limited superimposition of resonances selected for electronic integration with those of other biomolecules. However, resonances with intermediate T2 values yield intermediate attenuations [120], and this is most commonly observed for the relatively molecularly mobile portions of macromolecules in CPMG spin-echo spectra acquired on blood plasma or serum specimens, for example, those of the triacylglycerol moieties of lipoproteins in general, the phosphatidylcholine head-groups of polar high-density-lipoprotein phospholipids, and the N-acetyl-sugar-containing carbohydrate side-chains of ‘acute-phase’ glycoproteins, the latter of which are markedly upregulated in many human conditions such as inflammatory diseases and surgical trauma, for example [121].
Although saliva has a much lower total protein content than plasma [18,19], we are still able to observe a small number of relatively minor broad signals arising from macromolecules, for example, those tentatively assigned to protein aromatic amino acids visible at δ = 6.85 and 7.55 ppm in Figure 1. However, predominantly these resonances do not interfere with the electronic integration of those derived from low-molecular-mass aromatic catabolites.
One of the original investigations involved in the development of the CPMG pulse sequence [123] explored the influence of its pulse sequence acquisition criteria on the 1H NMR detection of low-molecular-mass agents and found that increasing the total echo time span through modifications of the numbers of cycles applied regulates broad protein resonance loss, although signals from low-molecular-mass metabolites are also influenced somewhat, as monitored by overall decreases in their intensities; as we might expect, such small molecule resonance effects were less pronounced than those involving macromolecules. In experiments involving retention of the total echo time at a constant value, elevations of this parameter (τE) were found to give rise to distortions in scalar couplings. As expected from facile thermodynamic considerations, the researchers involved confirmed that the higher the added protein concentration, the greater the affinity of such macromolecules for binding low-molecular-mass metabolites. As confirmed by Bell et al. [124], resonances arising from these small molecules have shorter T2 values than those present in non-protein-containing solutions and hence are more influenced by the CPMG relaxation filter system. Further pioneering studies concerning development of the CPMG pulse sequence, and that of the alternative, albeit earlier, Hahn spin-echo Fourier-transform (SEFT) option, are reported in [125,126], respectively.
As long ago as 1988, Bell et al. [124] reported the detection of a highly significant fraction of blood plasma lactate that was bound to plasma proteins (predominantly but not exclusively albumin present at a level of ca. 0.50 mmol./L) in both single-pulse and Hahn spin-echo 1H NMR spectra acquired on this biofluid. This so-called ‘NMR-invisible’ lactate may to mobilized from the protein bound to the Hahn spin-echo spectrum-detectable ‘free’ form via the addition of charged reagents such as ammonium chloride (NH4Cl), with a maximal release extent observed at 0.50 mol./L of this reagent added, so presumably negatively charged lactate was tightly electrostatically bound to positively charged protein amino acid side-chains, such as lysine residues, in these plasma proteins, and displaceable by added Cl anion. In corresponding spin-echo spectra of ultrafiltrates (<10 kDa cut-off) obtained before and after NH4Cl addition to whole plasma, large increases in the lactate-CH3 and -CH resonance intensities of up to three-fold were observed when they were expressed relative to those of the endogenous amino acids alanine or valine. Following NH4Cl addition at a level of 0.50 mol./L, the Δv1/2 values of the lactate-CH3 signal decreased from 3.5 to 2.2 Hz; those of alanine remained unmodified (2.3 Hz). The authors concluded that total plasma lactate concentrations were only reliably estimated following excess NH4Cl addition. Without this prior sample preparation step, 1H NMR-determined lactate concentrations were approximately only one-third of those measured by an established enzyme assay system.
However, we find that, for both metabolites, these added NH4Cl-liberated Δv1/2 values found for plasma in Hahn spin-echo spectra were actually rather higher than those measured in single-pulse spectra acquired on WMS supernatant samples, so this indicated that there is little or no ‘masking’ of fractions of these metabolites (and hence also their 1H NMR resonances), via their equilibria with protein binding-sites available in this relatively protein-deplete biofluid. The dependencies of these Δv1/2 values on biomolecule structure, participant donors, and doublet resonance line position (frequency) are investigated in Case Study 1 described in Section 7.3 below.
In a related study, Aiello et al. [122] explored the NMR detection and quantification of low-molecular-mass species in deuterochloroform (C2HCl3) solutions containing synthetic polymers (polyethylene glycol and polystyrene), and experiments were conducted both with and without use of the T2 CPMG spin-echo pulse sequence filter. The effects exerted by differing acquisitional parameters (echo time, relaxation delay, and the number of cycles), along with sample compositional indices, i.e., molecular mass of polymer and concentrations, on analytical responses, were investigated with a highly recommendable analysis-of-variance (ANOVA)-based design of experiments model, which considered a first-order interaction and squared variable terms, in addition to a range of potential response parameter variance-contributing input factors. This design was employed in order to optimize the reliability of quantitative analysis performed. Mixtures containing variable concentrations of both low-molecular-mass and macromolecular molecules were analyzed both with and without application of the CPMG filter. Results acquired demonstrated that increases in polymer levels attenuate its own resonances in CPMG 1H NMR spectra anyway, since this gives rise to corresponding increases in sample solution viscosities, and hence corresponding decreases in its resonance’s T2 values. However, the STN ratios of small molecules only experience a minimal reduction when specific acquisitional parameters are selected according to the macromolecule’s molecular mass. Moreover, it should be noted that the results acquired were dependent on differences between ‘mobile’ and ‘stiff’ polymers, as may be expected, and also between the dynamics of aliphatic and aromatic 1H nuclei. These phenomena gave rise to differential extents of macromolecule resonance suppression, which, according to the authors, may be employed for making deductions regarding the molecular structure of polymers evaluated. Therefore, in principle, this technique may be employed in metabolomics experiments in order to obtain valuable information on the structural nature of proteins or other macromolecular biomolecules such as proteins or polysaccharides, salivary or otherwise, which bind low-molecular-mass metabolites, in addition to their molecular masses.

7.2. ‘State-of-the Art’ Advances beyond the CPMG Pulse Sequence

Generally, 2D filters such as the CPMG pulse sequence is combined with a water/HOD presaturation one, and this combination, known as the presat-CPMG pulse sequence, has now been employed in biofluid NMR analysis for a considerable period of time, and remains a stalwart of NMR-based metabolomics techniques. Although this composite pulse sequence has a logical historical basis, it often does not achieve perfect water suppression, requiring a high radiofrequency power, and consequently it endures a diminishing level of performance with enhancements in magnetic field strength.
However, in view of these problems experienced, a new combinatorial pulse sequence known as ‘WASTED’ (WAter Suppression with a Transverse relaxation filter that Eliminates Distortions) has been developed [127], and this represents a composite of the CPMG-superior PROJECT sequence with the Robust-5 water presaturation one. The PROJECT sequence is particularly valuable, since it has the ability to recover resonances suppressed by that which vitiates the intense water signal, notably, but not exclusively, those localized close to its presaturation frequency. Moreover, PROJECT’s performance is predominantly independent of magnetic field strength. Hence, WASTED pulse sequences circumvent some of the hurdles associated with the presat-CPMG strategy, and hence offers benefits regarding the multicomponent analysis of biofluids, for which the suppression of the ca. 50 mol./L water signal and a broad ‘spectrum’ of biomacromolecules simultaneously during spectral acquisition is an essential requirement.
Therefore, the carefully planned application of WASTED pulse sequences, including the sequential order of application of the PROJECT and Robust-5 components, can successfully attenuate water resonance intensities from ca. 50 mol./L down to as little as 0.90 mmol./L [127]. Additionally, the T2 filters of WASTED permits inter-pulse delays (γ) that are an order of magnitude greater than those countenanced by the CPMG sequence, a process yielding a lower power input for successful operation. In view of these lowered power depositions, pulse sequences such as WASTED provide opportunities for the employment of T2 encoding methods to distinguish between differential metabolite ‘pools’ or the structures of macromolecules.
An example of our laboratories’ use of the WASTED pulse sequence is available in the pilot study spectra shown in Figure 2.

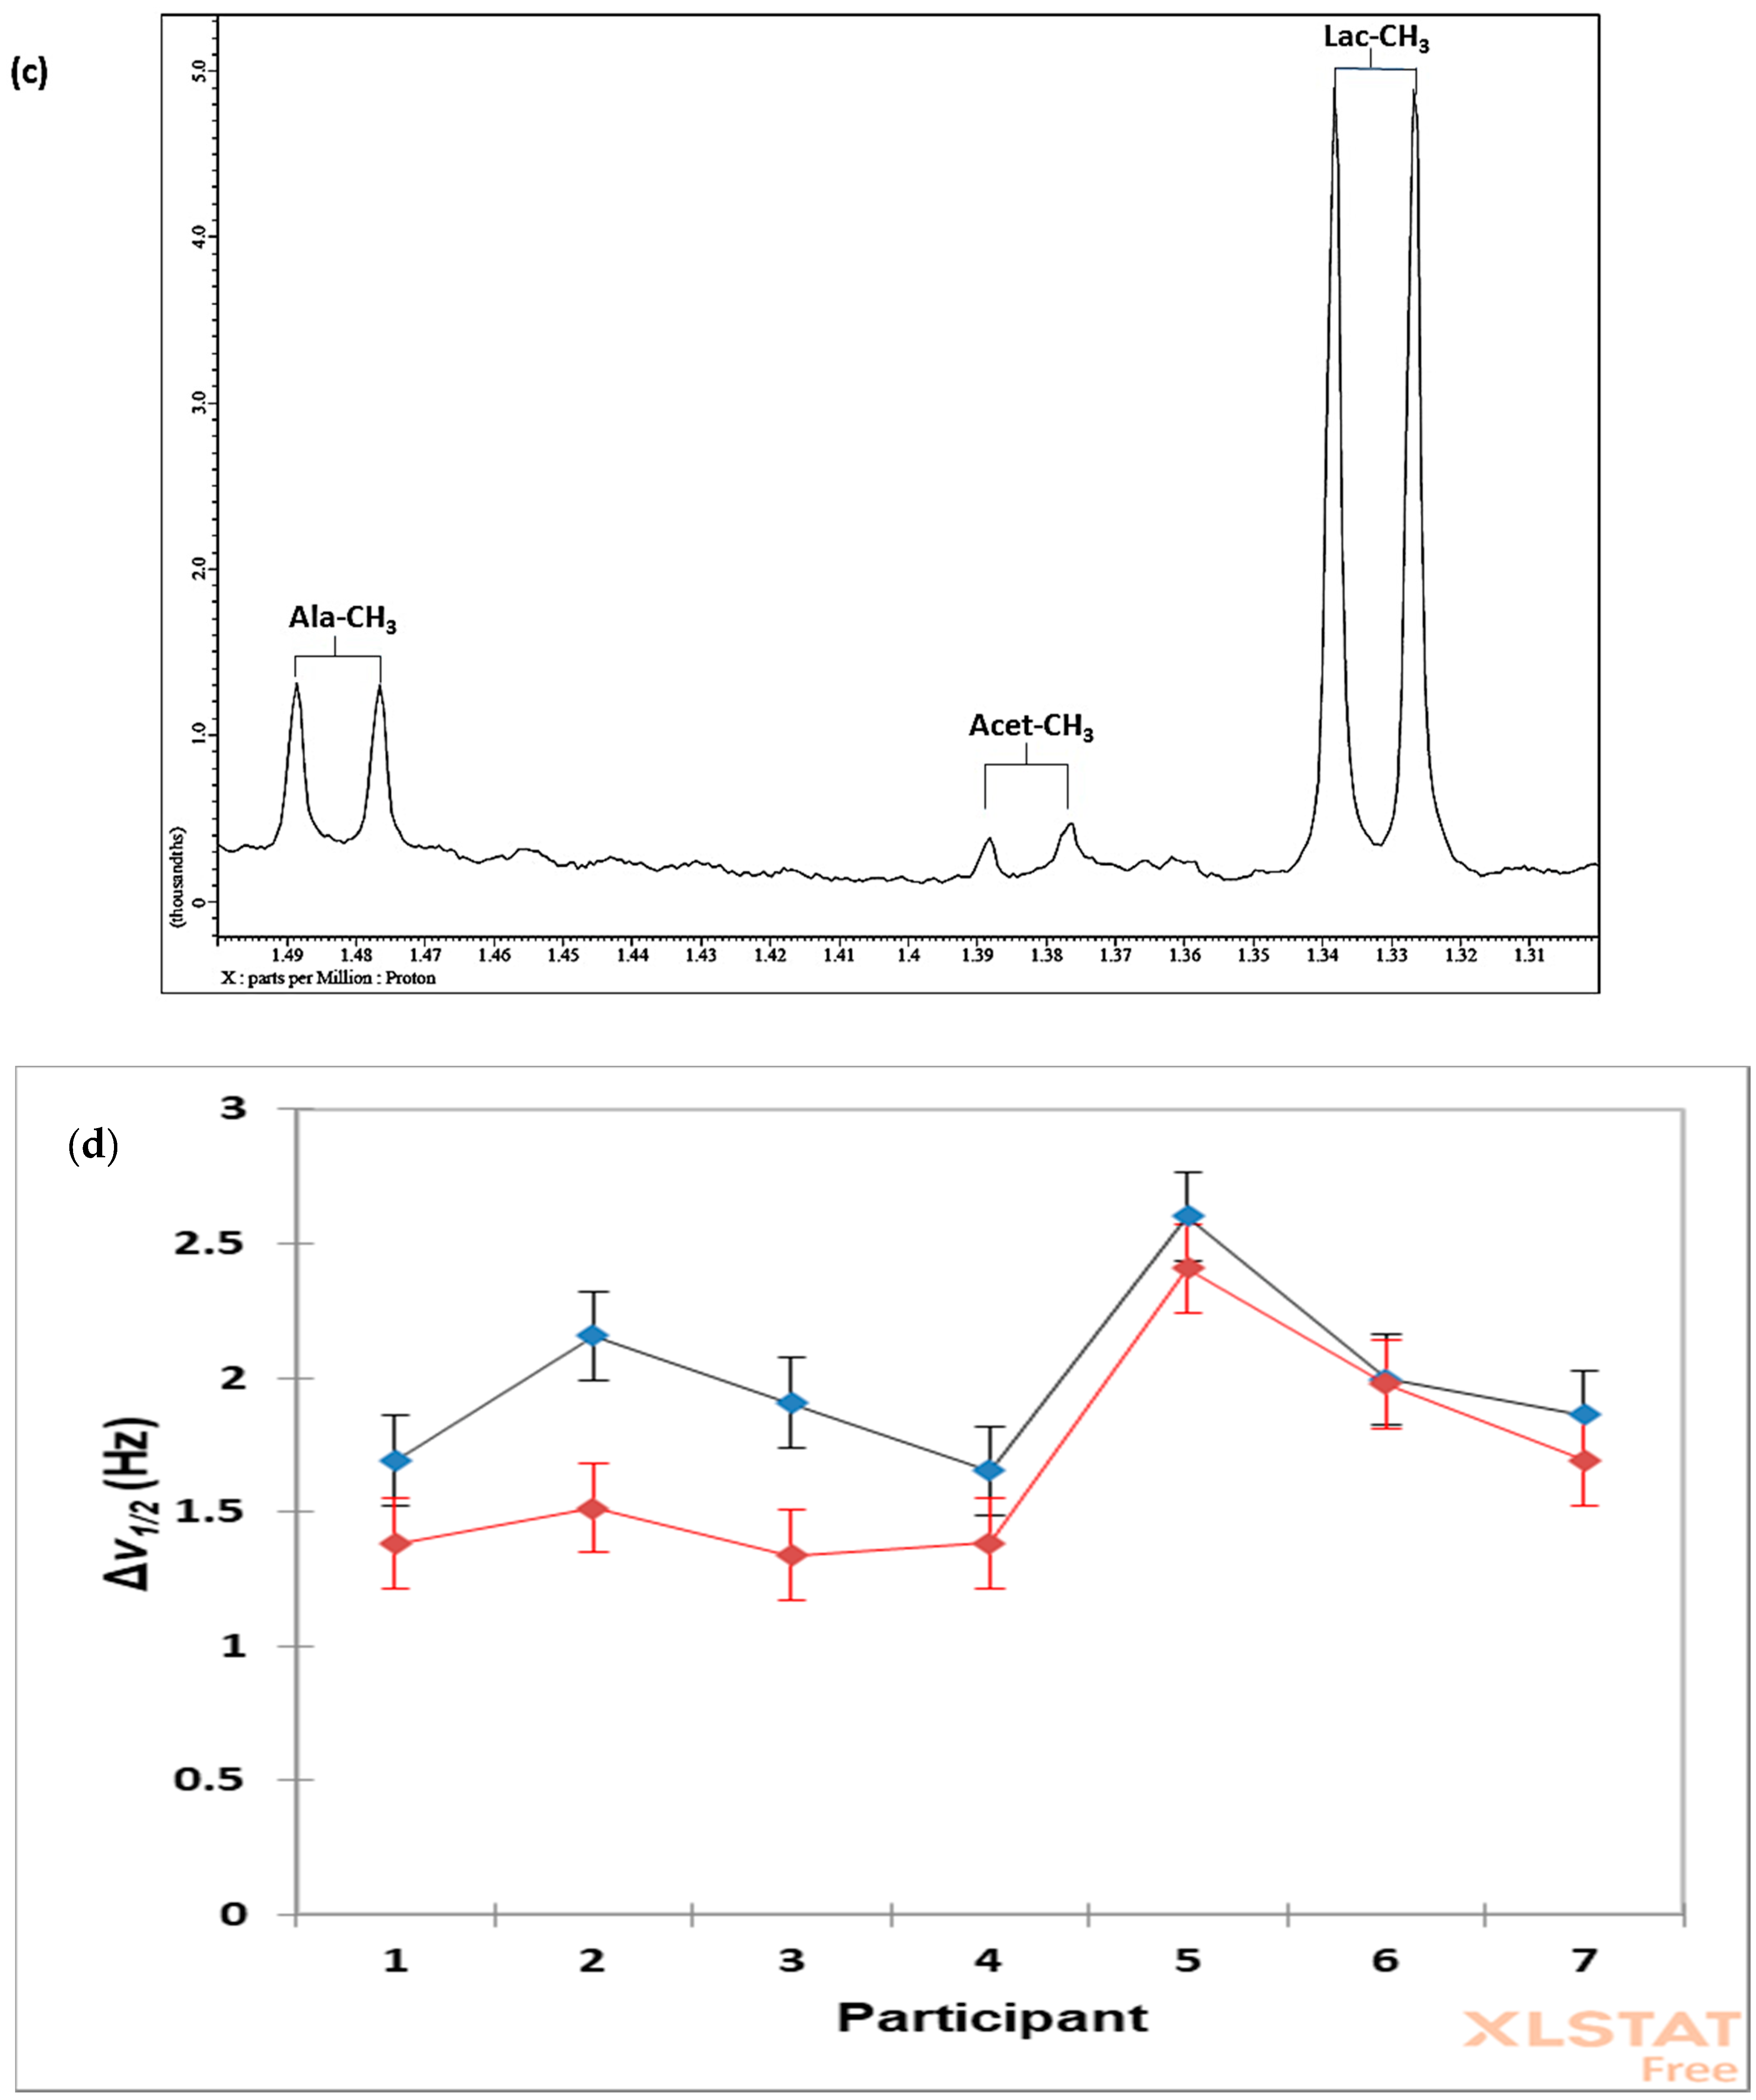
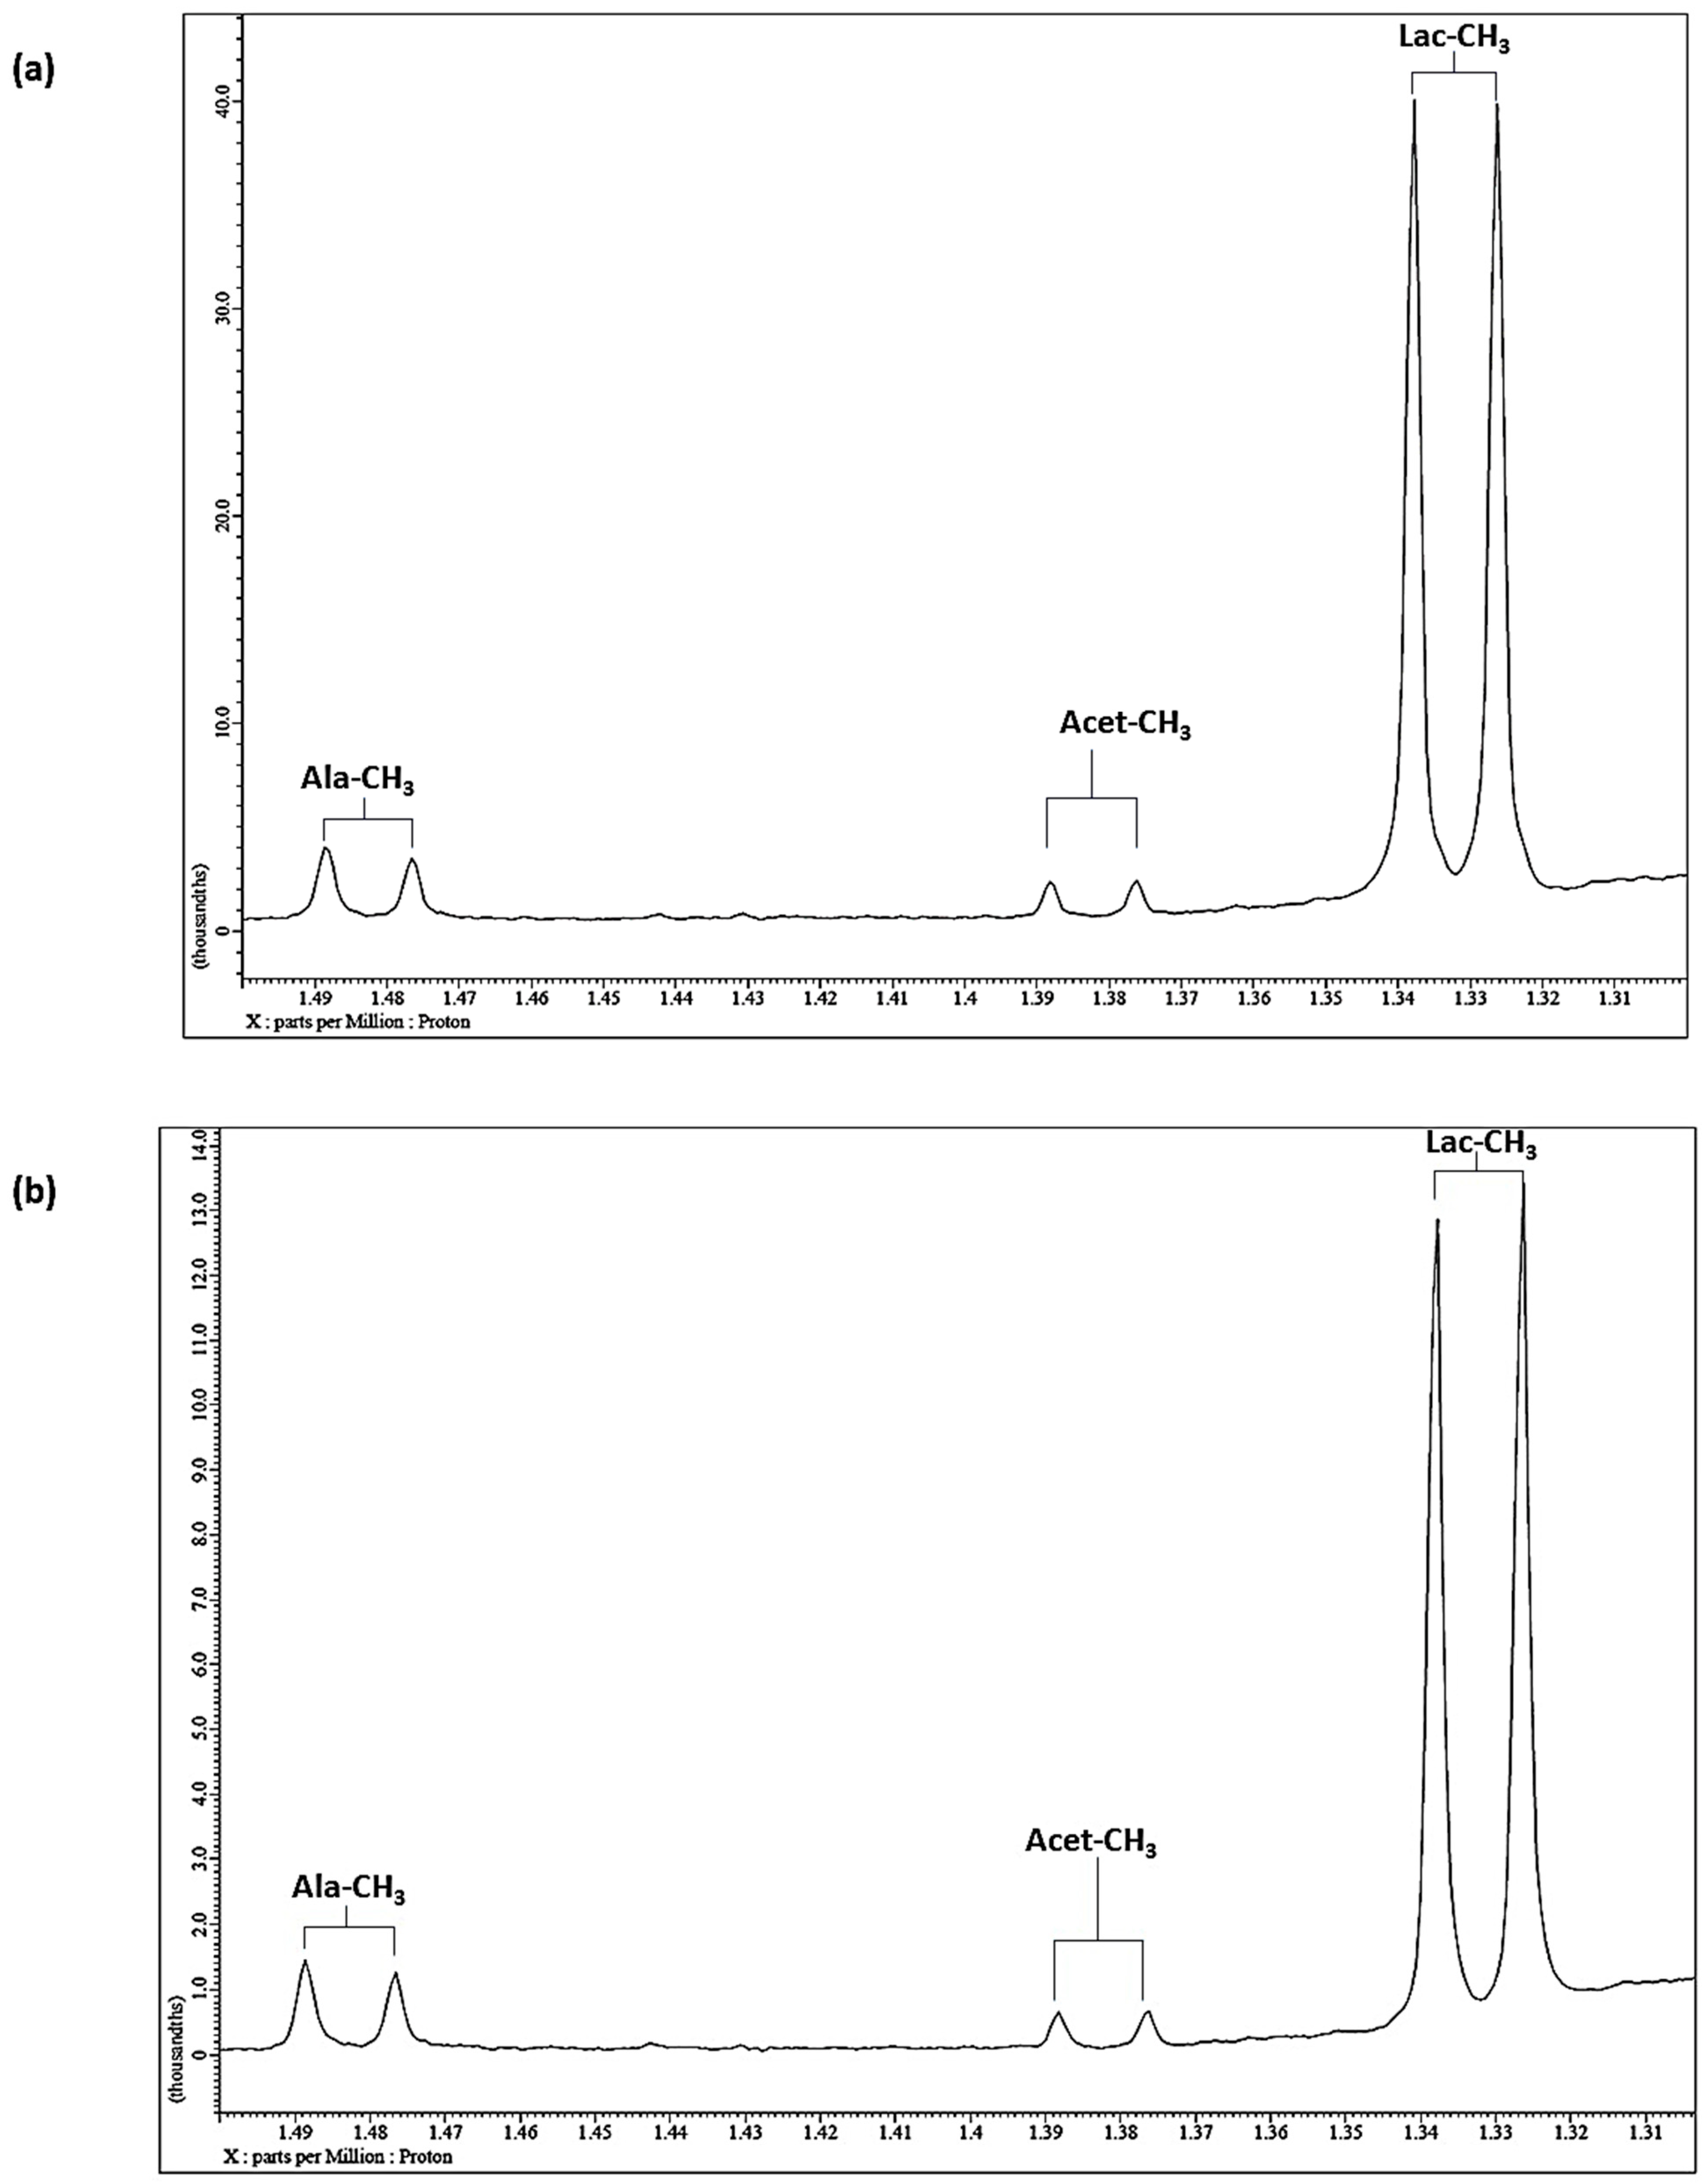
7.3. Case Study 1: Investigation of the Influences of Sample Donor, Metabolite Identity, and Doublet Resonance Line δ Value on the Δv1/2 Values of Lactate and Alanine in Single-Pulse 1H NMR Spectra Acquired on WMS Supernatants—A Design of Experiments Approach

From our single-pulse metnoesy 1D 1H NMR spectra acquired on WMS supernatants (Figure 4a–c), we found that the mean ± SEM Δv1/2 value for the lactate-CH3 signal was 1.67 ± 0.03 Hz (range 1.33–2.64 Hz; n = 7 samples, each with 2 × Δv1/2 values per doublet resonance), although these values appeared to be both sample donor- and metabolite-dependent. Indeed, that for alanine was significantly higher (mean ± SEM 1.98 ± 0.03 Hz, range 1.63–2.65 Hz). In order to explore this further, we elected to perform an analysis-of-variance (ANOVA)-based experimental design model incorporating the ‘between-participants (samples)’, ‘between-metabolites’ (i.e., lactate vs. alanine), and ‘between-lines-nested-within-resonances’ fixed sources of variation, and also a metabolite x participant first-order interaction effect. This UV analysis revealed that the ‘between-participants’ and ‘between-metabolites’ effects were found to be statistically significant (p < 10−6 and <10−5 respectively), whereas that ‘between-lines-nested-within-resonances’ was not. However, the above interaction effect was also marginally significant (p = 0.014), and the nature of this can be observed in Figure 4d, which shows that although there were quite strong correlations between the Δv1/2 indices for these metabolites for Participants 1 and 4–7, this was certainly not the case for Participants 2 and 3, for which the alanine values were approximately 50% greater than that of lactate; therefore, perhaps, for these two samples, there was a small but significant increase in the amount of alanine, but not lactate, bound to particular salivary macromolecules.
Corresponding mean ± SEM Δv1/2 values for the TSP internal standard in the seven spectra acquired were 1.36 ± 0.04 Hz. Therefore, it appears that any binding interactions of salivary lactate and alanine with proteins in this biofluid are similar to those of TSP for the former for all samples, and possibly for most samples regarding the latter biomolecule. Interestingly, for [124], the Δv1/2 parameter for alanine in blood plasma was actually significantly lower than that for lactate, prior to release of the latter from protein binding sites via 0.50 mol./L NH4Cl addition, but these values were virtually equivalent thereafter (ca. 2.2 Hz). However, for our saliva samples in the current study, the lactate value was lower than that of alanine, but only significantly so in 2/7 samples (Figure 4).
Therefore, it certainly appears that the T2 value of these metabolite protons is not significantly influenced (i.e., decreased) by any salivary protein binding or exchange processes, presumably because of the limited protein concentrations of this biofluid. However, experiments involving the acquisition of spectra prior and subsequent to the addition of macromolecule-releasing NH4Cl to a series of biofluids up to a final level of 0.50 mol./L will be required to confirm this. These NH4Cl addition experiments are currently in progress in our laboratories. The mean Δv1/2 index for salivary lactate was also similar or very similar to those determined for salivary propionate and n- and iso-butyrates (data not shown).

8. Homo- and Heteronuclear Two-Dimensional (2D) NMR Analysis of Human Saliva

In metabolomics studies, such 2D experiments frequently involve homonuclear techniques such as 2D 1H-1H correlation spectroscopy (COSY), 2D total correlation spectroscopy (1H-1H TOCSY), 2D 1H-1H INADEQUATE, or 2D J-resolved approaches. However, heteronuclear 2D experiments include 2D 1H-15N heteronuclear single quantum coherence (HSQC) and 1H–13C HSQC technologies, which may often additionally augment the identification of salivary biomolecules in view of their ability to provide multinuclear and generally more specific chemical shift data secured within the second dimension, together with further atomic connectivity details available within the 2D profiles as a whole. Despite this, one major disadvantage of these increasingly employed 2D NMR techniques is that they generally require lengthy periods of time to acquire and fully process, most especially with the heteronuclear strategies applied, i.e., many hours rather than 10–15 min for a typical 1D 1H NMR profile. Moreover, spectral interpretation is certainly not facile, and may take considerably longer than the time required for 1D spectral assignments. This is largely a consequence of the relatively poorer sensitivity of 2D NMR analysis when compared on a unit time basis with 1D NMR experiments, the LLOD value being approximately 10-fold less. Furthermore, often it is unable to furnish acceptably uniform resonances for the accurate quantification of metabolites. However, once these essential primary, assignment-focused 2D NMR experiments are completed, researchers may then optimize acquisitional, interpretational, and assignment requirements for their corresponding 1D experiments, which may sometimes involve the analysis of many hundreds of biofluids, or even more. The applications of a number of these 2D techniques to the analysis of WMS supernatants are discussed in detail below.
Notably, the development and execution of more rapid and more sensitive 2D NMR strategies, along with a greater emphasis on quantitative aspects of these analyses, are currently major priorities for all those engaged or to be engaged in future metabolomics research experiments.

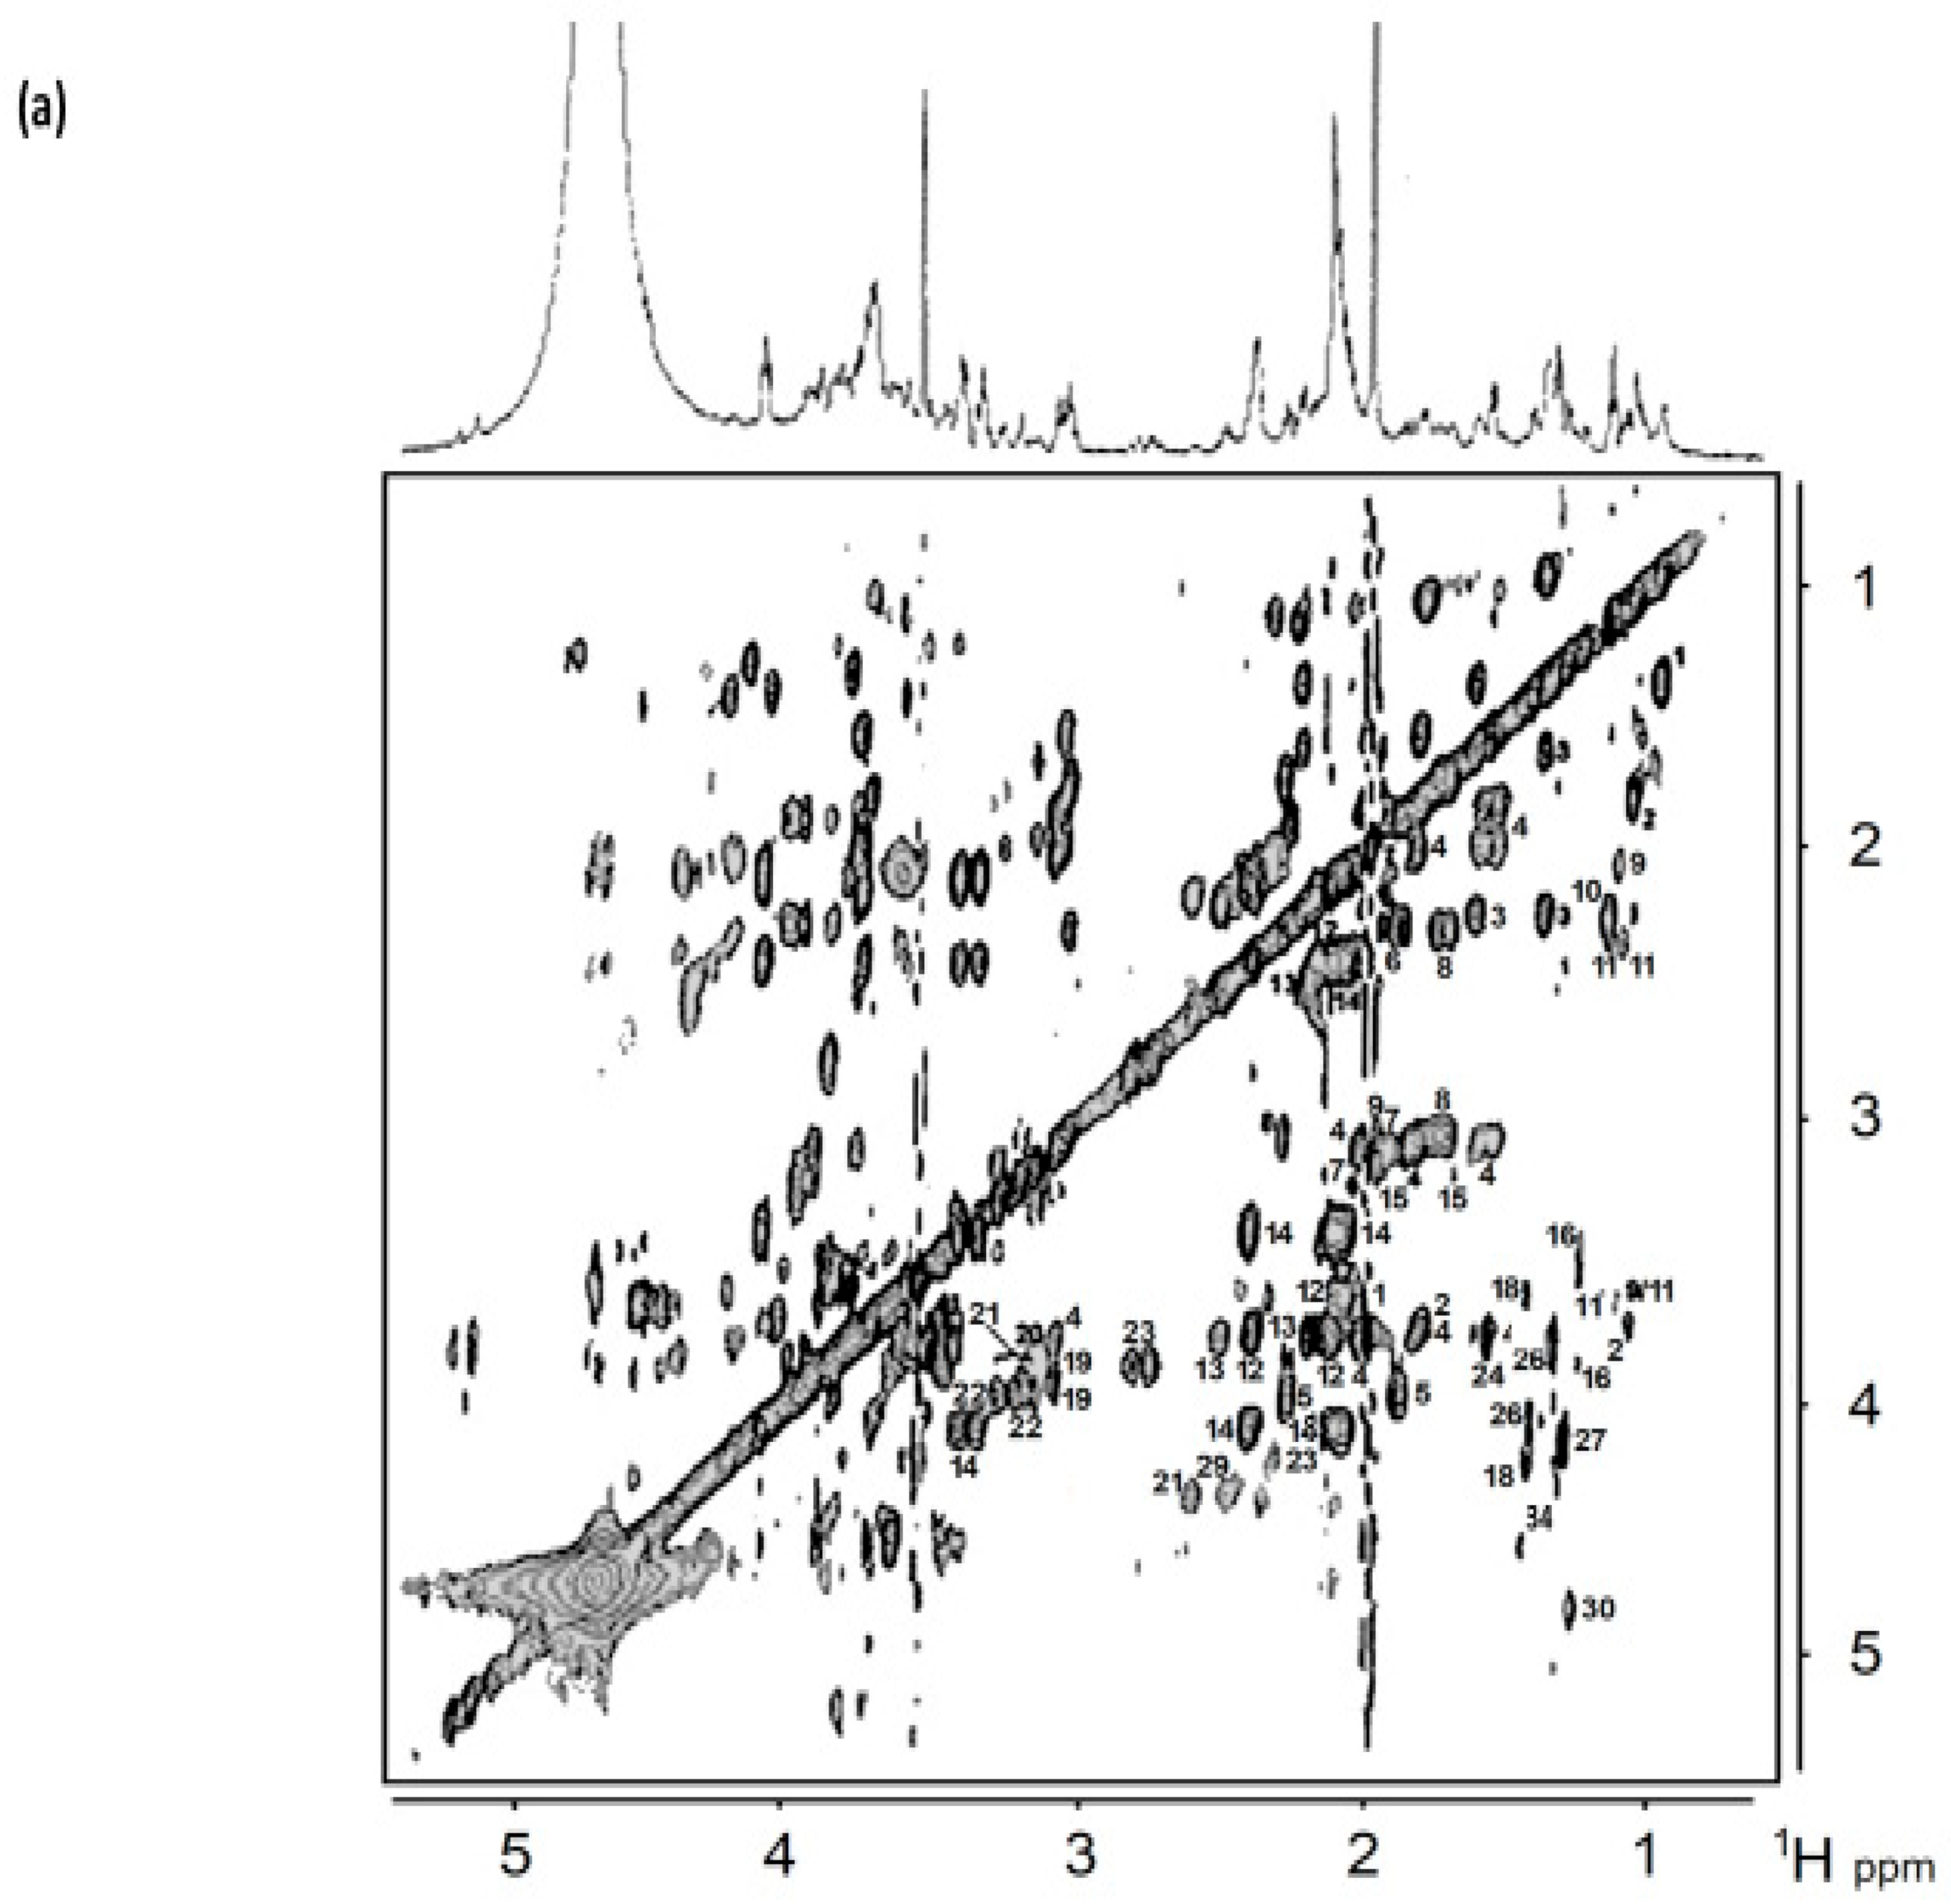
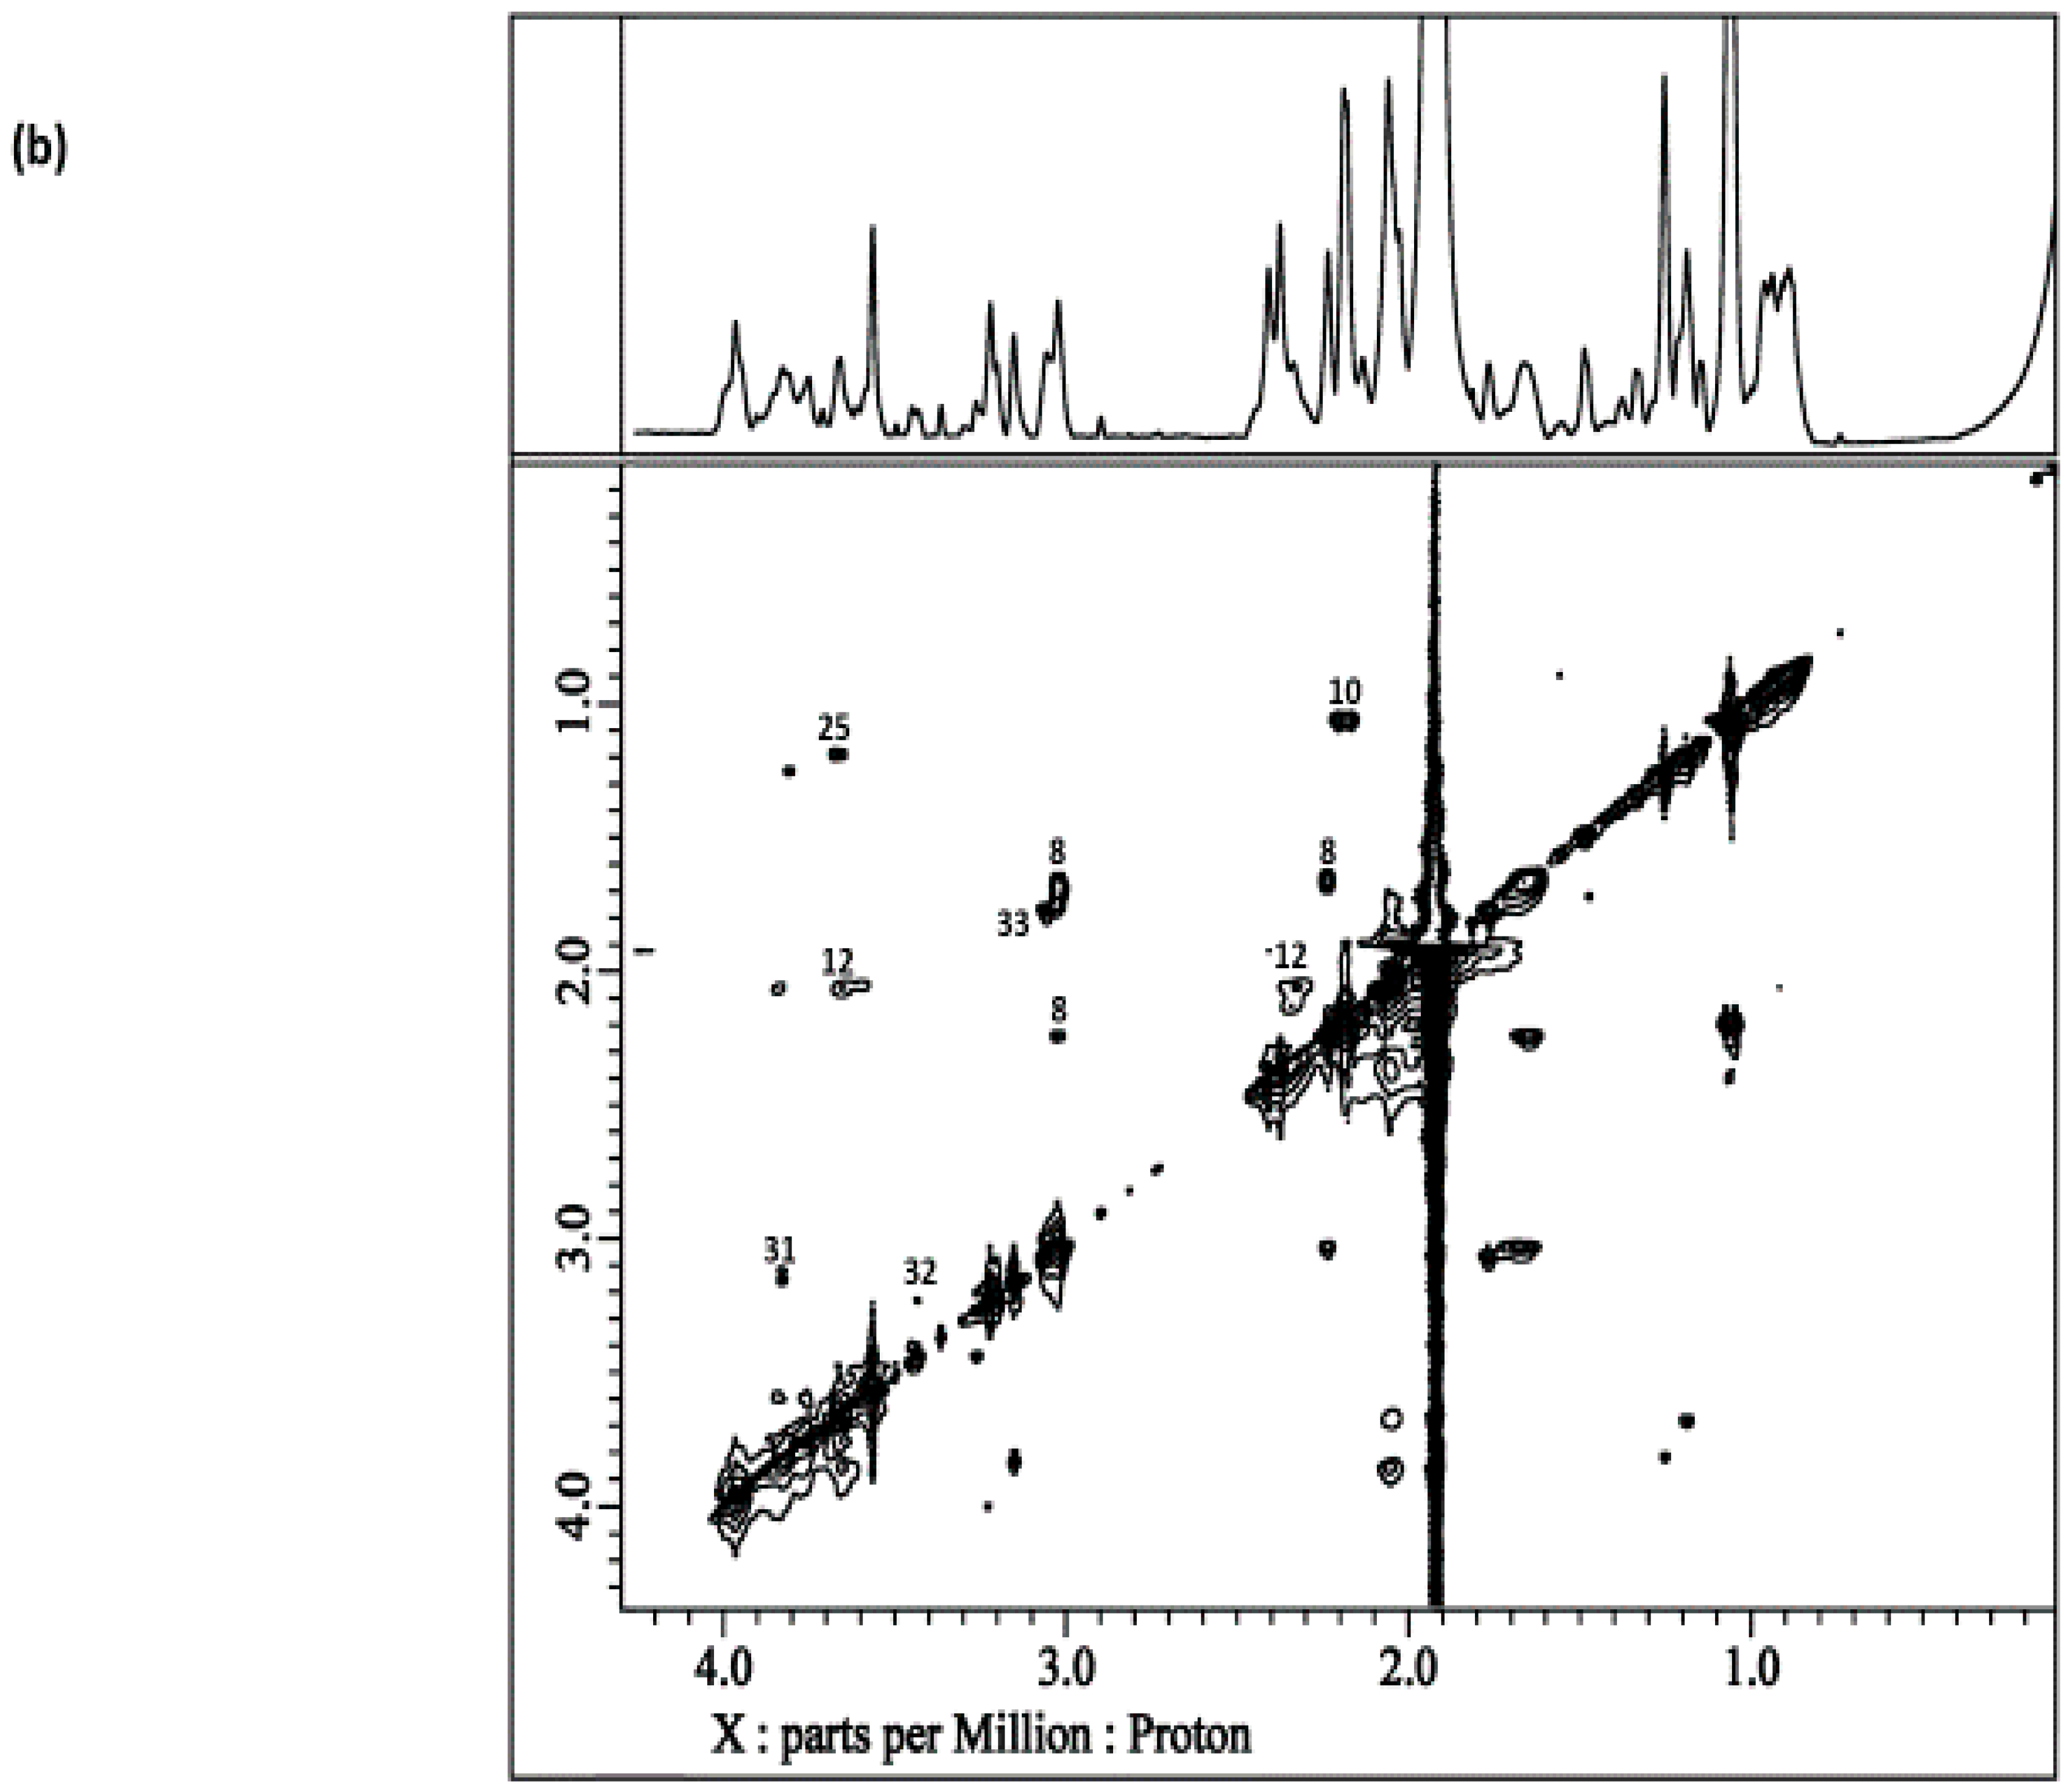
8.1. Homonuclear 1H-1H Correlation and Total Correlation Spectroscopies

Two-dimensional (2D) 1H-1H correlation spectroscopy (COSY) is a rapid and convenient confirmatory strategy to employ for the relatively simple confirmation of directly coupled C1-H and C2-H nuclei in a range of salivary metabolites, and most especially if one or both of the resonances involved are located within crowded or overcrowded spectral regions such as the 0.80–1.50, 1.80–2.50, or 2.90–4.20 ppm sectors. For example, the technique is valuable for verifications of the identities of the amino acids glutamate and glutamine in human saliva, together with the bacterial catabolites n- and iso-butyrates. However, the 1H-1H TOCSY spectroscopic technique permits the transfer of magnetization from a single or magnetically equivalent group (2 or 3) of 1H nuclei covalently bonded to one specific carbon atom (C1), to one or more magnetically distinct 1H nuclei within regions of two or more carbon positions further along a molecular chain, and remote from the C1 location (i.e., those at the C3, C4, C5 positions, in addition to the C2 one, etc.), most notably for the long side-chains of selected amino acid residues such as branched-chain ones (valine, isoleucine, etc.), the lengthy ‘backbones’ of salivary bacterial-derived organic acid anions such as n-butyrate and 5-aminovalerate, or the malodorous amine putrescine. A brief guide to these C1, C2, C3, etc., labels is provided in Figure 5. Hence, for such TOCSY spectra, much additional molecular structural information over that deduced from the facile direct 3-bond coupling of C2 1H proton(s) to the C1-borne 1H nucleus, as observed with the 1H-1H COSY pulse sequence, is derivable. Indeed, our previous studies have reported on applications of the TOCSY technique as a means of aiding preliminary assignments made from the 1D 1H NMR profiles of HSS samples and for overcoming spectral resonance overlap issues therein [3]. From such investigations, it was confirmed that this technique was of much value for the seeking and verification of the identities of complete molecular chains of relevant salivary biomolecules, and the unambiguous assignment of their 1H signals. The advent of quantitative 2D NMR spectroscopy as applied to recent metabolomics studies [128,129] may serve to facilitate the determination of salivary concentrations of metabolites with resonances that are not readily electronically integratable in the 1D profiles acquired in view of spectral signal superimposition or crowding phenomena. Typical 1H-1H TOCSY profiles of typical WMS supernatant samples are shown in Figure 6, and these display strong connectivities between the 1H signals of a wide range of salivary biomolecules.

8.2. J-Resolved NMR Analysis

The 1H-1H J-resolved (JRES) technique is ideal for resolving many complex overlapping multiplet signals by a dispersion of chemical shift and coupling constant data into two orthogonal frequency domains, an advantage that readily facilitates spectral assignment. If properly optimized through the acquisition of a sufficient, albeit experimental time-restrictive, number of F2 projections, it may be employed for confirming determinations of the linewidth at half-height (Δv1/2) values of many resonances in complex biofluid samples. As noted above in Section 7, this parameter is, of course, of critical importance for exploring equilibria between the ‘free’ and ‘macromolecule-bound’ forms of salivary biomolecules, although, as specified, this consideration is of much less importance for human saliva than it is for protein-rich blood plasma, or inflammatory knee-joint synovial fluid, for example, in view of its much lower total protein content [130]. Indeed, the binding of low-molecular-mass metabolites to protein, either electrostatically, or via H-bonding or van der Walls forces, substantially increases the line-widths of such signals, so much so that they are often viewed and termed as being ‘NMR-invisible’ in CPMG or Hahn spin-echo spectra acquired on protein-rich biofluids [124]. Such a parameter, which is determined by 1H nuclei T2 values, is also markedly influenced by differential biofluid viscosities, with greater viscosities leading to higher Δv1/2 values in view of reduced resonance T2 values from the overall lowered molecular mobilities of analytes.
Of further value, the 1H-1H JRES technique allows the accurate determination of exact chemical shift values of superimposed 1H signals present in crowded regions of the 1D profiles obtained on HSS samples. Indeed, this is readily achievable through visualization of the F2 ‘skyline’ projection, which generates information that has been found to complement that acquired from the corresponding 1H-1H TOCSY profiles. For example, spectroscopic analysis using the 1H-1H JRES approach was found to be highly valuable for the resolution of a large number of WMS supernatant sample resonances present in the crowded 3.00–4.30 ppm sectors of 1D spectra, particularly the α-CH function protons of a range of amino acids (leucine, isoleucine, valine, methionine, valine, histidine, phenylalanine, tyrosine, and aspartate), the α-CH2 group of glycine, the -CH2- functions of taurine, tyrosine, phenylalanine, and histidine, the carbohydrate ring protons of sucrose, galactose, glucose, and N-acetyl sugars, the alditol ring protons of inositol, and the N-CH3 and -CH2- groups of creatinine and creatine, along with the -CHOH- lactate proton.

8.3. 1H-13C Heteronuclear Multiple Quantum Coherence and Heteronuclear Multiple Bond Coherence Spectroscopies

For ‘state-of-the-art’ metabolomics analysis of biofluid samples, 13C NMR analysis is rarely adopted for biomolecular quantification purposes because of its poor sensitivity, which predominantly arises from its low natural abundance (1.11%), with special reference to biomolecules that are present at low concentrations (e.g., <200 μmol./L) and that are more readily determined by the 1H NMR technique. Indeed, the applications of this technique in such metabolomic profiling experiments is largely restricted to qualitative confirmations of the identities of analytes, including selected biomarkers when detectable at concentrations above their limits of detection. However, the development of inverse geometry probes and supporting pulse sequences has now largely circumvented this limitation, and 1H-13C heteronuclear multiple quantum coherence (HMQC) and heteronuclear multiple bond coherence (HMBC) spectroscopies, and related analytical strategies, provide a substantial enhancement in sensitivity over that of the conventional 1D spectroscopic technique. These inverse 1H-13C correlational spectroscopies feature the detection of 13C to 1H connectivities (although heteronuclei other than 13C may also be employed). The HMQC technique is selective for direct 1H-13C couplings only, whereas HMBC spectroscopies provide valuable molecular information through longer, 2–4 bond range couplings. Hence, the HMQC and HMBC techniques represent the 1H-13C equivalents of the homonuclear 1H-1H COSY and TOCSY approaches, respectively. Most modern high-resolution NMR facilities implement gradient-selected forms of HMQC and HMBC, which serve to remove unwanted resonance artefacts and hence improve the quality of the 2D spectra acquired.
A total of 600 MHz 1H-13C inverse-detected HMQC spectra of HSS samples have been found to contain a series of projecting cross-resonances for many 1H NMR-detectable biomolecules, including organic acid anion bacterial catabolites and amino acids. Spectra acquired confirmed the advantages offered by the 2D HMQC technique, notably its ability to resolve overlapping 1H NMR resonances in corresponding 1D spectra. Moreover, employment of an 8 mm 13C NMR probe in these experiments facilitated the detection of a range of biomolecules present at only low salivary levels. Access to available databases aided verifications of the correspondences of metabolite 1H and 13C NMR assignments, and therefore this process assisted with analyte identification and clarification. Furthermore, 13C assignments and related connected HMQC signals may be confirmed via reference to established reference chemical shift values for authentic model compounds (e.g., Lindon et al., 1999 [131]).

9. Preprocessing, Bucketing, Normalization, Transformation, and Scaling of 1H NMR Profiles of HSS Specimens: Bioanalytical Considerations for Metabolite Quantification and Metabolomics Analysis

In general, the intensities of salivary biomolecule resonances are determined by electronic integration of the appropriate spectral regions through application of spectrometer proprietary software (e.g., XWIN-NMR), and maintenance of the exact integral regions is ensured for all spectra included in studies. Concentrations of all possible 1H NMR-detectable metabolites, and, where appropriate, also those of xenobiotics such as drugs ingested, are computed by comparisons of their resonance areas with that of internal TSP, which in our studies is usually added at a final level of ca. 250 µmol./L. Since the protein content of human saliva [130] is substantially lower than that of human blood plasma or serum [19,132], the ‘envelopes’ generated by any broad macromolecule resonances do not significantly superimpose upon the great majority of sharper low-molecular-mass biomolecule signals. Therefore, any potential obscurement of these sharper resonances is predominantly negligible and has been found not to significantly interfere with their electronic integration and metabolite quantification [3], an observation confirmed in [31].
Of course, the concentrations of salivary biomolecules determined represent only the non-macromolecule-bound fraction of these and therefore are expected to be somewhat lower than their total salivary concentrations. Unfortunately, this certainly appears to be a little known or appreciated fact within the salivary NMR-based metabolomics community. However, for saliva, the extent of such macromolecule binding is expected to be limited and markedly less so than that observed in blood plasma in view of its much lower mean protein concentration [18,19,130,132].
Since it is generally accepted that salivary metabolite concentrations are inversely proportional to salivary flow-rate (SFR), then, unless the purpose of the metabolomics study in question is to compare the absolute concentrations of metabolites, as indeed it sometimes is, then the authors recommend constant sum normalization (CSN) prior to the performance of MV statistical analysis regimens. Following the removal of unwanted resonances (e.g., the residual H2O/HOD signal following presaturation, or perhaps those arising from ethanol ingestion, etc.) or spurious (noise only, or those below the lower limit of quantification) resonance regions, in this manner, the total spectral profile intensities for each sample are, usually row-wise, summed and expressed as a ‘normalized’ sum total value of say 100 or 1000, and the relative intensities of each metabolite resonance are then expressed as a proportion of this total. Therefore, proportionate CSN values may be considered for both UV and MV analyses, and this approach is discussed further in Section 9.2 below.
However, the rather simple method of measuring SFR, which usually involves the expectoration of as much saliva as possible from human participants within a 5.0 min period, and then calculation of this parameter as mL/min, is, of course, afflicted by complications, such as how sure can we be that all possible saliva available is transferred to sampling tubes, etc.

9.1. Spectral Bucketing

Autoprocessing of the 1H NMR spectra of biofluids such as human saliva with phasing and baseline correction software now represent standard, albeit still developing strategies for metabolomics protocols featuring up to several hundreds of bioanalyte predictor variables. Indeed, these analytical tools have been extensively assessed and tested by a wide range of biomedical NMR research laboratories and have, to date, proven to generate highly accurate results for their employment in optimized statistical models for the MV analysis of such datasets. However, a valuable spectral preprocessing strategy for metabolomics studies, including those performed on WMS supernatants, and known as ‘intelligent bucketing’, has been engendered in order to further enhance benefits to the selective bucketing of resonances in metabolic profiling technologies. Indeed, intelligent bucketing [133] was developed to effectively achieve ‘smartly selected’ bucket divisions (i.e., smart bucketing decisions) for highly complex, multianalyte resonance-populated 1H NMR spectra of biofluids acquired.
Hence, this approach offers major advantages regarding the accuracy of salivary 1H NMR data modeling through the avoidance of inherent complications arising from the application of ‘classical’ bucketing techniques, i.e., those with fixed bucket widths of say 0.04 or 0.05 ppm. Such complications derive from the inherent, now high sensitivity of high-resolution 1H NMR analysis to the molecular and physicochemical environments of biofluids explored, particularly those arising from small changes in pH, temperature, and the ubiquitous occurrence of metal ion-biomolecule complexation reactions such as those involving the ligation or chelation of Ca2+, Mg2+, or other available metal ions by salivary organic acid anions such as succinate, citrate, or lactate [5], or amino acids such as glycine, alanine, or histidine.
Intelligent bucketing involves an algorithm designed to drive critical chemical shift bucket divisional selections, specifically those that decide where exactly chemical shift bucket (or bin) divisions should be. When selecting the fixed bucket approach, unfortunately the edges of buckets arising therefrom may be positioned at the center of selected NMR signals, and therefore its net contribution may be spread over two, or sometimes more, resonance-dependent regions for electronic integration. Although the nature of principal component analysis (PCA) or factor analysis (FA) may self-correct errors of this nature through the combination of two such spectral regions together into a single PC, in view of each PC’s correlated bucket variables, inaccurate or only limited results may arise when the resonance in question is susceptible to the above pH-, temperature-, metal ion-, ionic strength-, and, where appropriate, viscoelastic-controlled small inequalities in chemical shift value(s) between samples donated for comparative analytical purposes, as we might expect. In such situations, the contribution of such resonances are asymmetrically divided between two or more bucket integration segments. Furthermore, the remainder of the signal(s) in such buckets may emerge from another biomolecule that represents a portion of a separate predictor variable; contributions of this nature will stray from the statistical model, and if the exact chemical shift location of a resonance is highly physicochemical property-dependent, its relative contributions to each of the bucket intensities featured will vary, perhaps significantly so; this phenomenon will disturb the accuracy of MV analysis conducted, and therefore may confound the interpretation of results arising from the analysis. Fortunately, intelligent bucketing has the computational ability to ‘decide’ on bucketing divisions that are constructed from local spectral minima, and hence this algorithm circumvents the above preprocessing errors. Such ‘bucketing’ may be performed on a whole realm of overlaid 1H NMR profiles, and therefore resonances that shift with small modifications in physicochemical solution properties can be simultaneously reviewed and overcome, if indeed required [133].

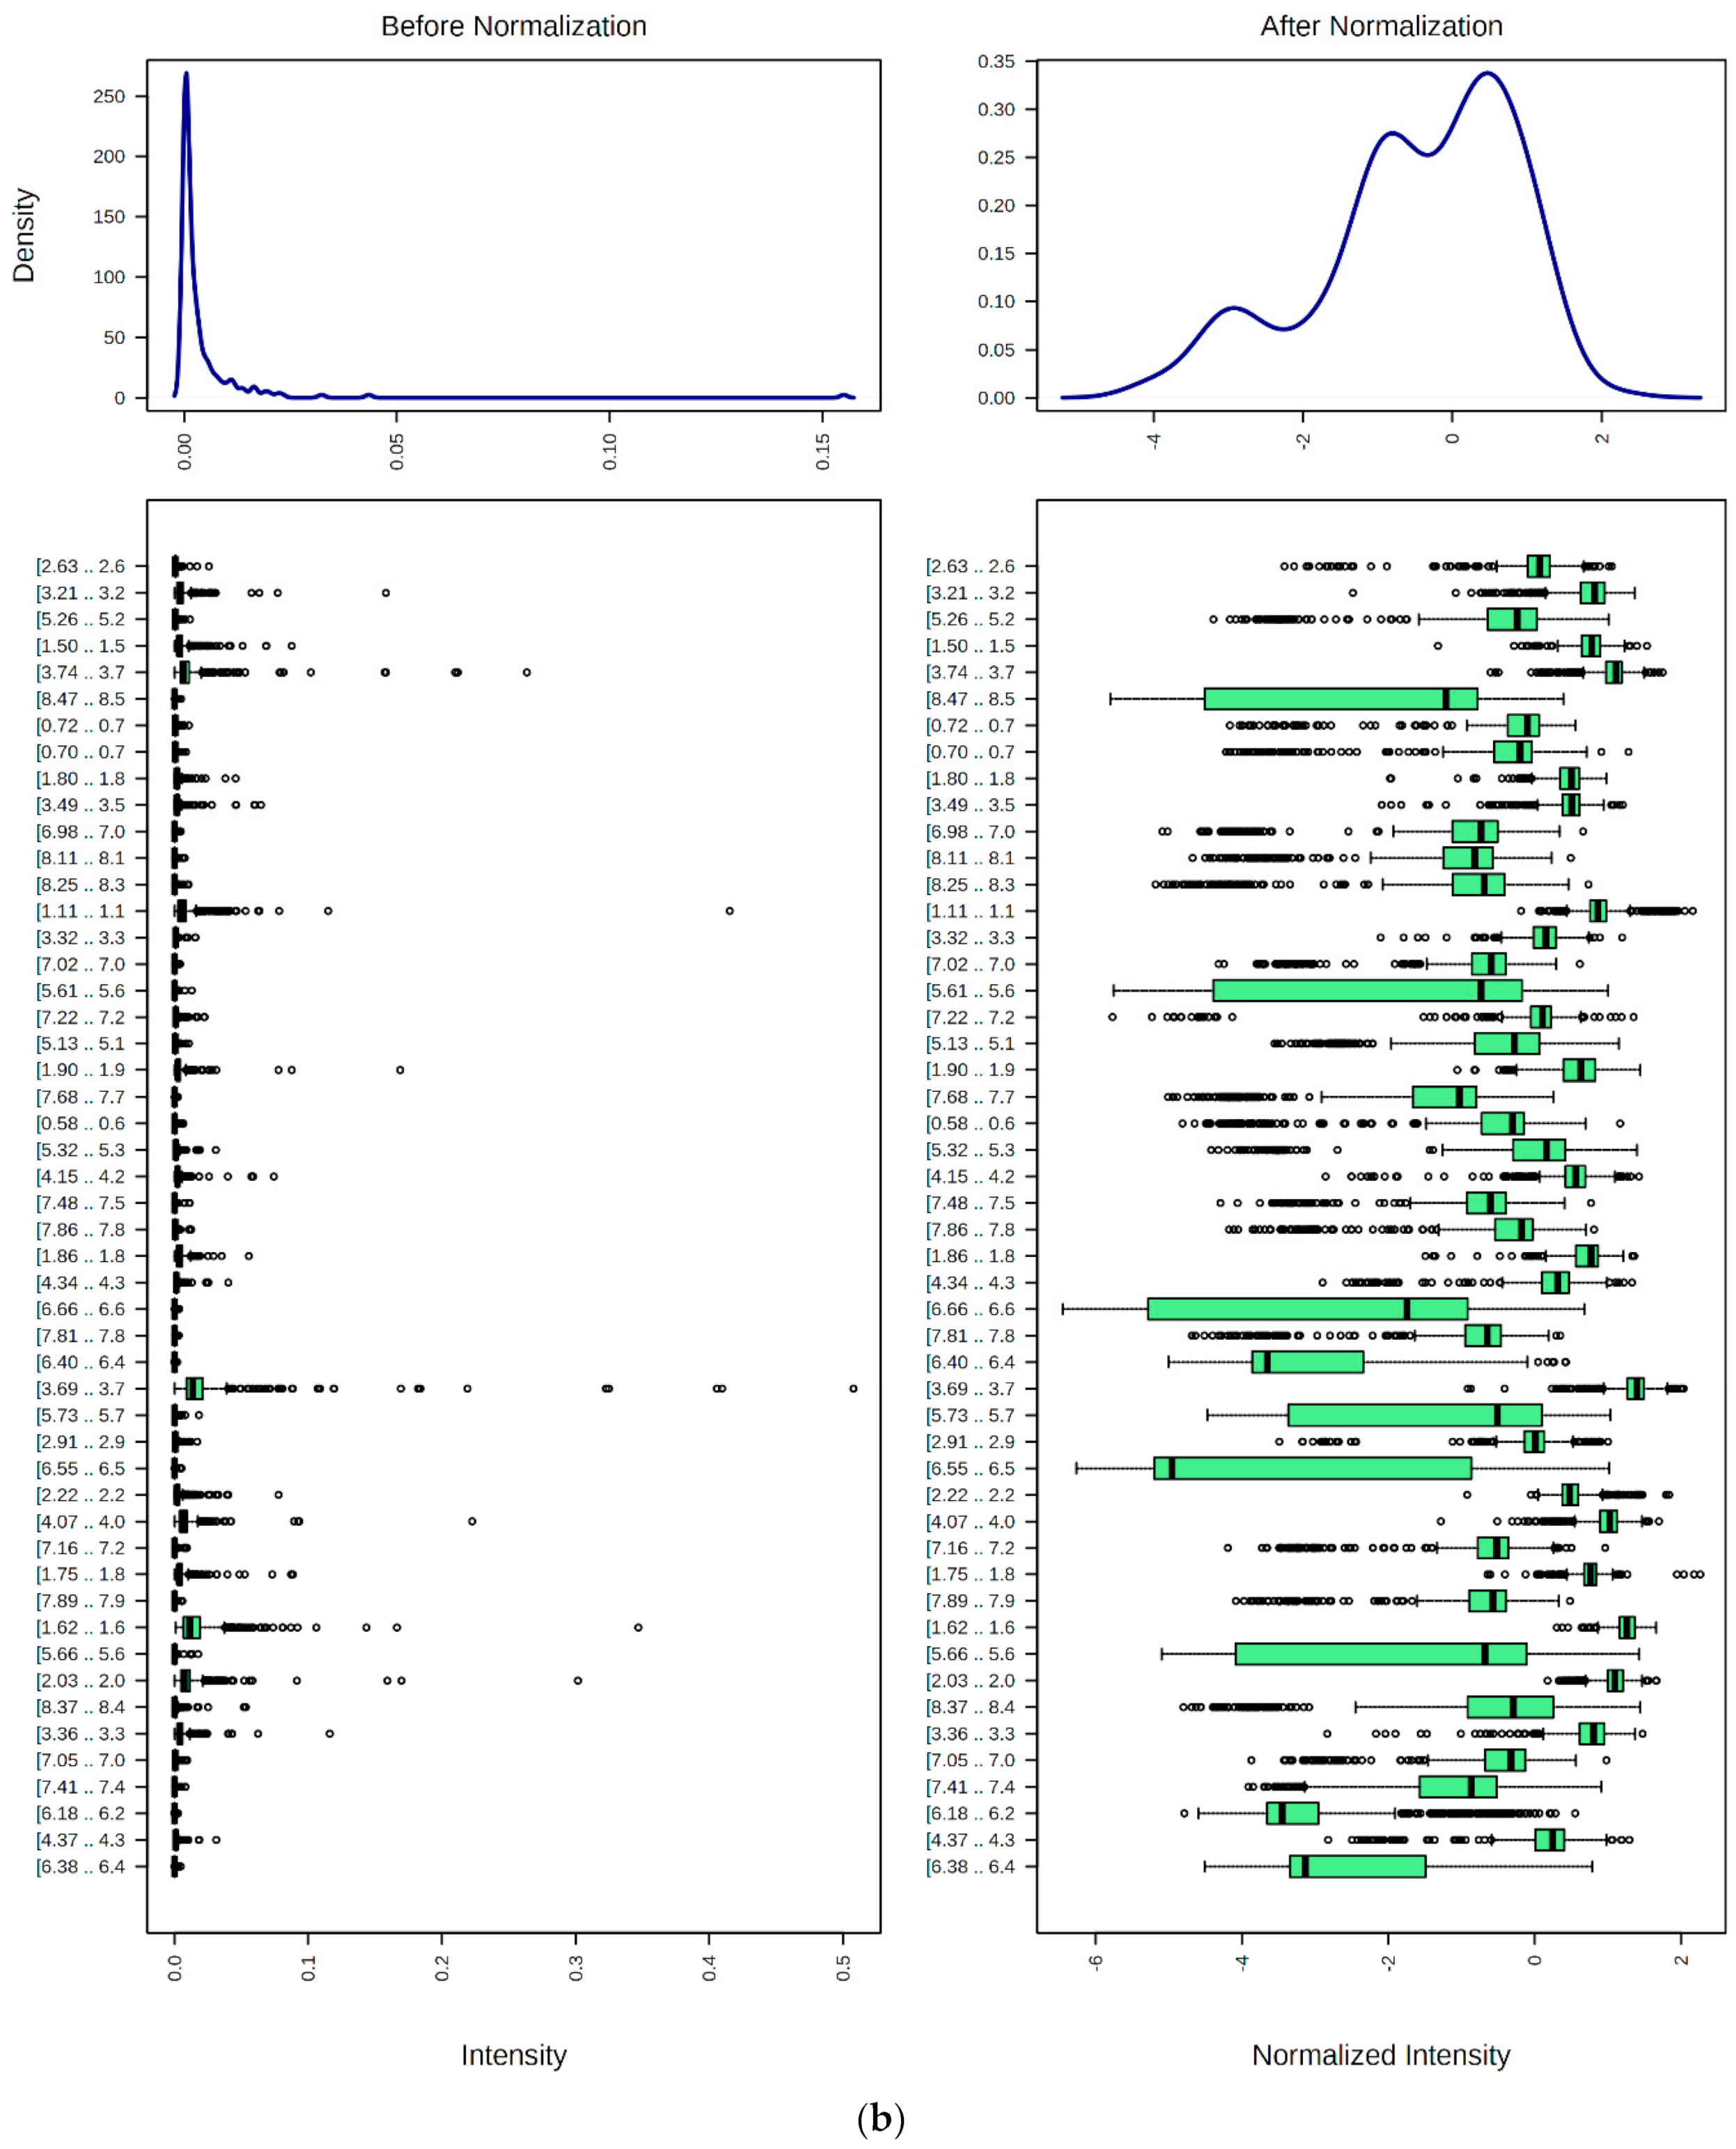
9.2. Data Normalization, Transformation, Scaling, and Dimensionality Reduction

Usually, an essential measure to be taken prior to the performance of MV metabolomics data analysis is that metabolite resonance intensities should be ‘normalized’ according to a recommended procedure. In general, the first stage involves expression of these intensities relative to those of a pre-added internal standard of known concentration, usually but not exclusively TSP (which also serves as chemical shift reference), which has a nine-proton intense δ = 0.00 ppm signal. Following allowance for the number of 1H nuclei giving rise to each resonance integrated, this approach offers the benefit of providing salivary concentrations, or at least ‘apparent’ 1H NMR-detectable contents of metabolites, in view of possible equilibria with and low levels of binding to salivary proteins as noted above in Section 7, i.e., the non-protein-bound ‘free’ biomolecules. However, for HSS samples, such effects appear to be negligible for the majority of metabolites. Such a normalization strategy will account for any systematic error variations in NMR instrument performance, and this process may be conducted with either single or multiple internal standards that have been ‘spiked’ into the WMS supernatant sampling matrix prior to analysis, or through the employment of pre-selected normalization factors [134].
However, a now very commonly employed normalization process is to express bucketed resonance intensities as proportions or percentages relative to that of the entire spectral profile, i.e., the apportioning of each signal as a proportion or percentage of that of the total intensity of all spectral features considered, allowing for the exclusion of spectral regions that represent noise only, plus those that should be removed because of their potential interfering and confounding nature, for example, the residual H2O/HOD signals in salivary 1H NMR profiles, along with those of any drugs and their metabolites, and additional, perhaps unexpected exogenous agents such as ethanol arising from unadvised alcoholic beverage consumption during the specified research ethics participant information sheet instructions to participants. This sample row-wise CSN approach may be performed either with or without the above TSP-normalization approach, but it is particularly valuable for NMR-based metabolomics datasets where the addition of internal standard(s) have been neglected, or in situations where it was not possible to add one because of major protein- or other biomacromolecule-binding phenomena, such as that observed in high protein content blood plasma and serum; however, this is clearly not the case for WMS supernatant samples in view of their very low protein content [130]. Nevertheless, CSN may generate complications if quite a large number of 1H NMR-detectable biomolecule concentrations are simultaneously and significantly up- or downregulated as an impact from the chemopathological processes involved in selected disease processes or as an outcome from the administration or intake of a specific drug or toxin. In such cases, expression of the resonance intensities of metabolites involved to that of a total spectral profile may be problematical, i.e., if it transpires that their concentrations are all elevated n-fold, or of similar magnitudes relative to that of the added internal standard, the CSN procedure will not recognize this unless there are at least some resonances that have not been up- or downregulated in response to a disease process or stimulus. For example, in cases of dehydration, or other conditions involving diminishing salivary flow-rates, such as that experienced in Sjörgen’s syndrome, all or virtually all salivary metabolites will be increased in concentration in this biofluid, and obviously CSN will not readily recognize this output. However, as surmised above, it does lend itself to facilitate distinction between biomolecules that have proportionately increased in concentration because of dehydration, or those that are inversely related to SFR, from ‘real’ biomarkers responding to the effects induced by a particular disease process. Indeed, in such cases, disease-induced changes in the salivary levels of genuine biomarkers, either up- or downregulations, would be expected to differ significantly from non-etiological modifications in salivary volume. Hence, CSN is sometimes particularly applicable to selected salivary metabolomics analysis experiments, since it at least partially circumvents the requirement to correct salivary metabolite concentration data for variable SFRs or indeed explore their relationships with this parameter, assuming that it can be accurately determined.
An additional normalization approach is product quotient normalization (PQN). PQN transforms 1H NMR profiles arising in metabolomics experiments in accordance with an overall estimate of the most likely ‘dilution’ effect [37]. This normalization approach usually involves the subtraction of a mean or median column-bucketed reference spectral profile from those of either all study samples, or a sub-set of them, usually those of the healthy control group only; this reference spectrum may represent the overall average spectrum of the control group, and all samples are normalized to this irrespective of what group they belong to, i.e., disease or control. It may also be a pre-established spectrum obtained from a reputable reference database, a single study one, or a reference model spectrum of all biomolecules detectable and present at relevant, recommended concentrations in aqueous solution at the known average biofluid pH, ionic strength (I), and viscosity parameters. Selection of the mean or median values of predictor (metabolite) variables in the reference spectrum is generally perfunctory, although use of a median spectrum appears to provide the most robust reference profile for experiments involving only small numbers of participants. It is also recommended that a CSN is performed before PQN in order to primarily scale column metabolite variables to the same absolute magnitude. Reportedly, the PQN algorithm is significantly more accurate and robust than both the CSN and vector length normalization strategies [37].
It is also highly recommended to use the now well-known autoscaling procedure to appropriately scale data. This involves the mean-centering of each metabolite column predictor variable’s data-point followed by division by its estimated sample standard deviation so that the mean and variance of each one become 0 and 1, respectively (and also unit standard deviation for the latter value). This process permits each metabolite determination to be considered to be on equivalent scales, irrespective of their pre-autoscaling magnitudes; indeed, the 1H NMR spectra of healthy human saliva contain some biomolecule resonances that, between-participants, are reproducibly of a much greater intensity than those of others (for example, propionate has a much higher salivary concentration than those of all methylamine species). Furthermore, in this context, any ‘between-metabolite’ heteroscedasticity (variance heterogeneity) problems with the complete datasets of all included metabolite variables are overcome. Although this scaling process does not prove to protect against ‘between-classification-within-metabolite variable’ heteroscedasticities, which remains a critical assumption for all parametric statistical tests for comparing mean values [135], we therefore further recommend that all MV datasets are further transformed using logarithmic or generalized logarithmic (glog), square root or cubed root, or even inverse transformations. It should also be noted that proportional data such as that obtained in CSN datasets remain non-normally distributed, and in such cases, it is highly recommended that fractions are transformed using logarithmic- or glog-, logit- (i.e., log of the odds ratio, which is the log value of a proportion p divided by 1-p), or arcsine transformations [133].
Moreover, the autoscaling procedure is unable to protect against outlying metabolite, potential predictor variable data-points. Hence, subsequent to scaling to mean zero and unit variance, such outliers remain for the performance of MV analysis thereafter, which leads to complications with the assumption that individual concentration data-points for metabolites are sampled from symmetrical normal distributions of such levels, or those of directly proportional spectroscopic measures. An additional problem with autoscaling is the highly adverse inflation of measurement errors.
Fortunately, Pareto-scaling appears to provide a solution to problems associated with autoscaling; this strategy, which involves mean-centering followed by division by the square root of the metabolite variable sample standard deviation, yields scaled variables that are in a format of somewhere between no scaling applied and autoscaling, and these provide a variance; although somewhat variable for different metabolite columns, such values are all very similar and are a little greater than unity, unlike the unit variance scaling arising from the autoscaling process. The objectives of this scaling technique are again avoidance of the relative weighting importance of higher metabolite concentration indices that are associated with a partial retention of the structural characteristics of the original dataset. However, one major disadvantage of this form of scaling is that it is highly sensitive to large sampling classification fold-changes.
Alternative scaling processes quite commonly used by researchers include range scaling (mean-centering followed by division by the range of the metabolite variable dataset), although, as we might expect, this method is highly sensitive to outlying data-points, and therefore it is essential to remove them prior to its instigation; VAST scaling, which involves calculation of the product of the autoscaled data-point and that of the metabolite variable’s mean value divided by its standard deviation, an approach targeted at small metabolic variable fluctuations (although it remains inappropriate in cases featuring markedly induced metabolite concentration variation, which appear to lack an overall group structure); and level scaling, which aims to have a focal point based on relative variable responses, and which can be particularly valuable for specific biomarker authentication (although there are again complications regarding the deleterious inflation of measurement errors).
Finally, sometimes it may be considered desirable to reduce the total number of available metabolite variables from datasets in order to optimize the achievement of uncorrelated metabolite variables. This may be performed through the preliminary selection of variables through evaluations of the UV statistical significance of all those available using parametric t-tests, ANOVA, ANCOVA, or even MV analysis-of-variance (MANOVA) model systems, etc., this in addition to the isolation of linear combinations of such variables as separate PCs in PCA protocols. The bottom line is that most fully established metabolomics researchers prefer to perform a combination of both UV and MV analyses on datasets acquired, largely because selected metabolite variables may be univariately significant but not multivariately so (a common observation that may arise from it acting as a singular, orthogonal biomarker that remains unrelated to other possible ones), or vice-versa, which may occur in situations where, although a metabolite may not prove to serve as a statistically significant biomarker in a UV context, it remains strongly correlated to other biomolecules that together form a strong MV pattern or orthogonal component that is of value for distinguishing between disease and healthy control patient cohorts, for example. Although of much interest, these arguments lie beyond the scope of this paper, and therefore readers are referred to [135,136] for further information.
Furthermore, the use of evolutionary algorithms, for example genetic algorithms/genetic programming, is also a valuable approach. Indeed, such evolutionary algorithms are generally performed in combination with a second MV analysis algorithmic technique (e.g., PLS-DA) that seeks and explores composites of metabolite variables that reveal the highest level of efficacy achieved with the secondary algorithm and that are arbitrated by the principles of evolution and species selection exercises [137].
With regard to the above approaches for the preliminary processing of complex datasets prior to the application of MV statistical analysis techniques, Figure 7 shows the effects of the sequential row-wise normalization, glog-transformation, and column-wise Pareto scaling processes on the means, variances, and kernel densities of a two-classification human WMS supernatant 1H NMR dataset; also shown are variable box-plots for 50 of the most important ISB variables. The WMS samples for this analysis were donated by n = 48 participants with an acute sore-throat condition, and an equivalent number of those without this disorder as healthy controls. Moreover, five daily samples were sequentially collected from each subject over a period of five consecutive days. Full details and examples of corresponding 600 MHz WMS supernatant 1H NMR profiles for this investigation are presented as a case study in Part II of this report.
From these processing experiments, it can be observed that glog-transformation serves to homogenize variable variances somewhat, although the overall kernel density plot revealed a trimodal distribution of variables remaining. Moreover, subsequent application of the Pareto-scaling approach not only further markedly homogenizes previously heteroscedastic variances but also renders the kernel density plot virtually unimodal and symmetrical. Therefore, we thoroughly recommend that all these preprocessing methods are applied prior to the performance of MV statistical analysis, although it should be noted that alternative normalization (e.g., PQN, median-, or range-normalization, etc.), transformation (e.g., cubed root, inverse, or arcsine transformations, the latter being suitable for proportion or percentage data, etc.) or scaling (e.g., autoscaling, etc.) methods may also be employed where considered relevant or where fully justified.
The influence of different of row-wise normalization approaches was also explored as part of a preliminary investigation for this study. Table 3 shows the results arising from UV t tests performed on datasets analyzed without and with PQN and with CSN normalization methods applied to the full dataset, both with and without FDR correction, which is obviously approved for the performance of such parametric UV tests on complex MV datasets such as that here with a total of 209 separate 1H NMR ISB variables. Clearly, application of the glog transformation and Pareto-scaling served to ‘sharpen’ the significance test applied via a homogenization of ISB variances, the improved consistencies of these with their selection from normal sampling distributions, and also the assurance of additive responses. Furthermore, application of either the PQN or CSN row-wise normalization methods served to improve the number of statistically significant variables. Indeed, without the application of any row-wise normalization methods, the variances (scatter) of these 1H NMR ISB variables remained highly variable, i.e., heteroscedastic, and the overall distribution of these values appeared to be bimodal, even with glog-transformation and Pareto-scaling.

9.3. Sample Size Considerations and MV Power Calculations

In this section, a brief summary of power analysis methods available for estimating experimental sample sizes for MV NMR-based metabolomics experiments is provided. Power analysis strategies for UV statistical analysis have been long established, with many possible applications now available [135]. However, methods available for the experimental design of large or very large MV analysis-based models largely comprise quite recent developments [138]. Those now available include Data-driven Sample Size Determination (DSD) [139], which features an algorithm for estimating the minimum sample size (n) required to detect a minimum of one statistically significant ‘predictor’ variable, or alternatively, a maximum number of these in order to optimize a model system. Indeed, the algorithm applied, known as the statistical recoupling of variables (SRV) algorithm, primarily permits data reduction before analysis and is then centered on metabolically significant analytes, and this is followed up via the computation of inverse cumulative density probabilities (ICDP). Subsequently, kernel density estimate functions or log-normal distribution fittings are instigated for all ICDPs, and expanded datasets are then simulated at differing sample sizes. For this purpose, random numbers are drawn within the [0, 1] interval, and input quantiles of the ICDPs are determined. An analysis of variance (ANOVA) approach, coupled with FDR corrections applied via the Benjamini–Yekutieli method, is then utilized to determine statistical significance. This DSD method then generates a table with mean and SD values of statistically significant variables for each dataset size considered.
An alternative approach is the MetSizeR model [140], which is based on PCA. This strategy, however, does not require the applications of a data reduction strategy, although DSD employs an OPLS-DA model, and therefore SRV values are tested via this route. Notwithstanding, MetSizeR is essentially a targeted approach, since the maximum number of variables that it can accommodate is 375, but fortunately this is usually more than sufficient for many bucketed 1H NMR datasets, unlike the DSD approach that accommodates larger datasets. Standard parameters for this method are specified in [140], and an example featured in this report explored an 1H NMR-based rat urinary dataset (n = 36) split into two with samples longitudinally collected throughout a 15-day duration. Application of the above two power analysis methods successfully confirmed that ≤30 samples were required as optimal sample sizes in future datasets acquired on this experimental system. SSPA from the Bioconducter R package also serves as a valuable methodology [141,142].
Readers are referred to [135] for an outline summary of data processing, modeling and power calculations using both UV and MV analysis strategies available for the evaluation and interpretation of ‘state-of-the-art’ metabolomics datasets, 1H NMR-based or otherwise.

10. Significance of between-Participant Sources of Metabolite Level Variance in Healthy Humans: Salivary Phenotype Analysis

In 2016, Wallner-Liebmann et al. [30] reported on the abilities of different saliva sample donors to generate characteristic, participant-dependent salivary metabolic signatures. For this purpose, they employed 1H NMR-based metabolomics analysis to investigate saliva specimens collected from a total of 23 healthy volunteers, with ca. 6 samples donated daily from each of these for a 10 consecutive day duration (seven days under what was described as ‘real-life’ circumstances and three whilst undergoing a standardized diet regimen, together with a physical exercise program at Day 10). Although the authors claim that this was the very first demonstration of nascent individual salivary metabolic phenotypes in humans, the roots of this study can be found in [3], since, in that investigation, our group demonstrated that there was indeed a significant ‘between-participant’ component of variance (which was tested against a ‘within-participant’ one) in 9 out of 11 salivary metabolites quantified and monitored. Notwithstanding, in [30], the researchers involved found that this individual salivary phenotype was not quite as strong as that found for urine but was affected less by diet. Hence, a further concern of ours is that we are fully aware that if saliva specimens are collected within an insufficient time following meal consumption (from Figure 2, we recommend an absolute minimum of at least 4 h, but a period of 8 or even 12 h is certainly preferable), the 1H NMR profiles of human saliva are contaminated with large numbers of exogenous resonances from food-borne agents, particularly carbohydrates, organic acid anions, and lipids, etc. Indeed, if samples are collected shortly after meals, including those donated only 1.0 h thereafter, then it is often impossible or virtually impossible to view many of the expected endogenous metabolite signals in such spectra.
Moreover, dietary carbohydrates such as glucose or sucrose immediately trigger the salivary generation of a series of lower molecular mass catabolites, and in the current study we found substantial changes in the levels of endogenous, non-food nutrient-sourced metabolites, notably lactate, pyruvate, and succinate, amongst those of others (Figure 2), which arise from the fermentation of dietary carbohydrates. As expected, oral microbiome responses to fermentable carbohydrate exposure are reflected through modifications of the salivary metabolome, including saccharolytic bacterial-mediated rises in acetate, propionate and n-butyrate levels, for example. Although known for some time [143], this phenomenon has been monitored via metabolomics techniques in dental plaque [144,145], and sucrose-induced challenges observed therein were associated with those occurring in saliva. Moreover, the salivary biomolecules acetoin, alanine, lactate, pyruvate, and succinate are also upregulated following sucrose exposure [20], and results obtained from the carbohydrate-rich food ingestion experiment reported in Section 6.2 are indeed fully consistent with this observation (Figure 2). Moreover. acetoin acts as an external energy store by selected fermentative bacteria, and therefore its determination in saliva may yield some valuable information on the activities of such species. However, this agent is commonly employed as a food flavoring agent and a fragrance, and is also present in a variety of foods, e.g., blackberries, peppers, butter, and cocoa products, along with beer and wine.
The relative contributions of the oral microbiome towards the makeup of the human salivary metabolome and the biomolecular composition of WMS have been a subject of conjecture for many years [146]. However, recently some light has been shed on this subject through comparative evaluations of the biomolecular status of this biofluid to that of sterile parotid gland (SPG) saliva [20,23,147]. Indeed, these studies have revealed that the SPG fluid lacks a wide range of metabolites present in WMS before entering the oral cavity, and these included bacterially derived organic acid anions, e.g., acetate, propionate, succinate and n- and iso-butyrates, and methylamines. Bacterial catabolites such as propionate and n- and iso-butyrates, are predominantly non-NMR-detectable in human plasma, although these metabolites are sometimes visible to us as low-intensity 1H NMR resonances in spectra of human urine.
The investigation reported by Gardener et al. in REF. [20] simultaneously explored matched WMS, parotid saliva (PS), and blood plasma in an attempt to differentiate between patterns of metabolites arising from bacterial loads from those arising endogenously. This study found that the bacterial load of WMS was strongly positively correlated with abundant short-chain organic acid anion concentrations therein, along with malodorous amine and some amino acid levels. However, the results acquired also indicated that citrate, lactate and urea entered WMS through PS and the systemic circulation. Curiously, WMS concentrations of urea were found to be inversely correlated with both saccharolytic and proteolytic sources of bacterial load. Hence, in principle, such NMR-based salivary metabolomics datasets can be employed to determine the bacterial load of WMS samples collected from dental patients, and it is likely that a MV consideration of correlations between its organic acid anion (including lactate and citrate), amine, amino acid, and urea concentrations, may serve to provide valuable microbially relevant data, which in turn may lead to reliable diagnostic and perhaps prognostic stratification information for oral diseases and also possibly for dysbiosis-related conditions, for which such metabolomics datasets may complement those acquired on gastrointestinal fluids.

10.1. Case Study 2: Salivary Phenotype Analysis, and Identification of Differential Metabolite Pools within WMS Supernatants and Their Sources

Therefore, in this section, we have conducted a case study to further explore (1) between- and within-participant components of variance amongst the salivary 1H NMR metabolic profiles of a large number of healthy control sample donors, and (2) perform MV factor analysis on these data in order to isolate orthogonal (uncorrelated) components that arise from differential sources and/or pathways, with a particular focus on those arising from host and oral microbiome origins.

10.1.1. Univariate Experimental Design Model for Isolating between- and within-Participant Components of Variance for WMS Supernatant Metabolites in a Healthy Control Population

In order to investigate both ‘between-participants’ and ‘between-sampling days-within-participants’ contributions to the variances of 1H NMR-determined salivary metabolite concentrations, we set up a model that involved the collection of daily, early morning saliva samples from a total of n = 48 healthy control participants for a total of five separate sampling days each, an analysis model similar to that reported in [3]. This model had an experimental design described by Equation (3), in which σi2 represents the ‘between-participants’ random effects variance component, σ(i)j2 the ‘between-sampling days-within-participants’ (i.e., sampling days were ‘nested’ within participants), and σ2ijk the fundamental or unexplained (residual) error variance. The basal metabolite level in the absence of these two sources of variation is denoted by µ, and yijk is the actual level observed for each metabolite.
yijk = µ + σi2 + σ(i)j2 + σ2ijk
Results from this UV ANOVA-based analysis for all identified salivary metabolites is shown in Table 4. Of the 240 1H NMR profiles explored in this investigation, we found that the ‘between-participant’ source of variation (σi2) was very highly significant for all 31 metabolites evaluated, as might be expected, whereas that for ‘between-sampling days-within-participants’ (σ(i)j2) was only significant for nine of these, i.e., propionate, acetate, pyruvate, glutamine, succinate, and phenylalanine, together with the three N-acetylated biomolecule species signals detectable (Table 4). Therefore, these data provide valuable evidence for significant ‘between-participant’ heterogeneities between all salivary metabolites monitored, and this supports reports available on differential human salivary phenotypes. Figure 8 shows plots of the observed salivary levels of n-butyrate, propionate, and urea versus that predicted from the mathematical experimental design model shown in Equation (3). These plots show that, although there were high levels of predictability for the models involving both organic acid anion metabolites, that for urea was poor, and this indicates high values of error variance (σijk2) for this apparent host-derived metabolite, and hence poor levels of predictability for it from this model (Table 4 shows that Q2 was zero for it). This study also indicates that some metabolites display a significant salivary metabolite variation ‘between-days-within-humans’, for example n-butyrate, propionate, and acetate, an observation we might expect if these particular metabolites arise from a salivary microbiome source with differing daily levels of microbial infiltration and preponderance.

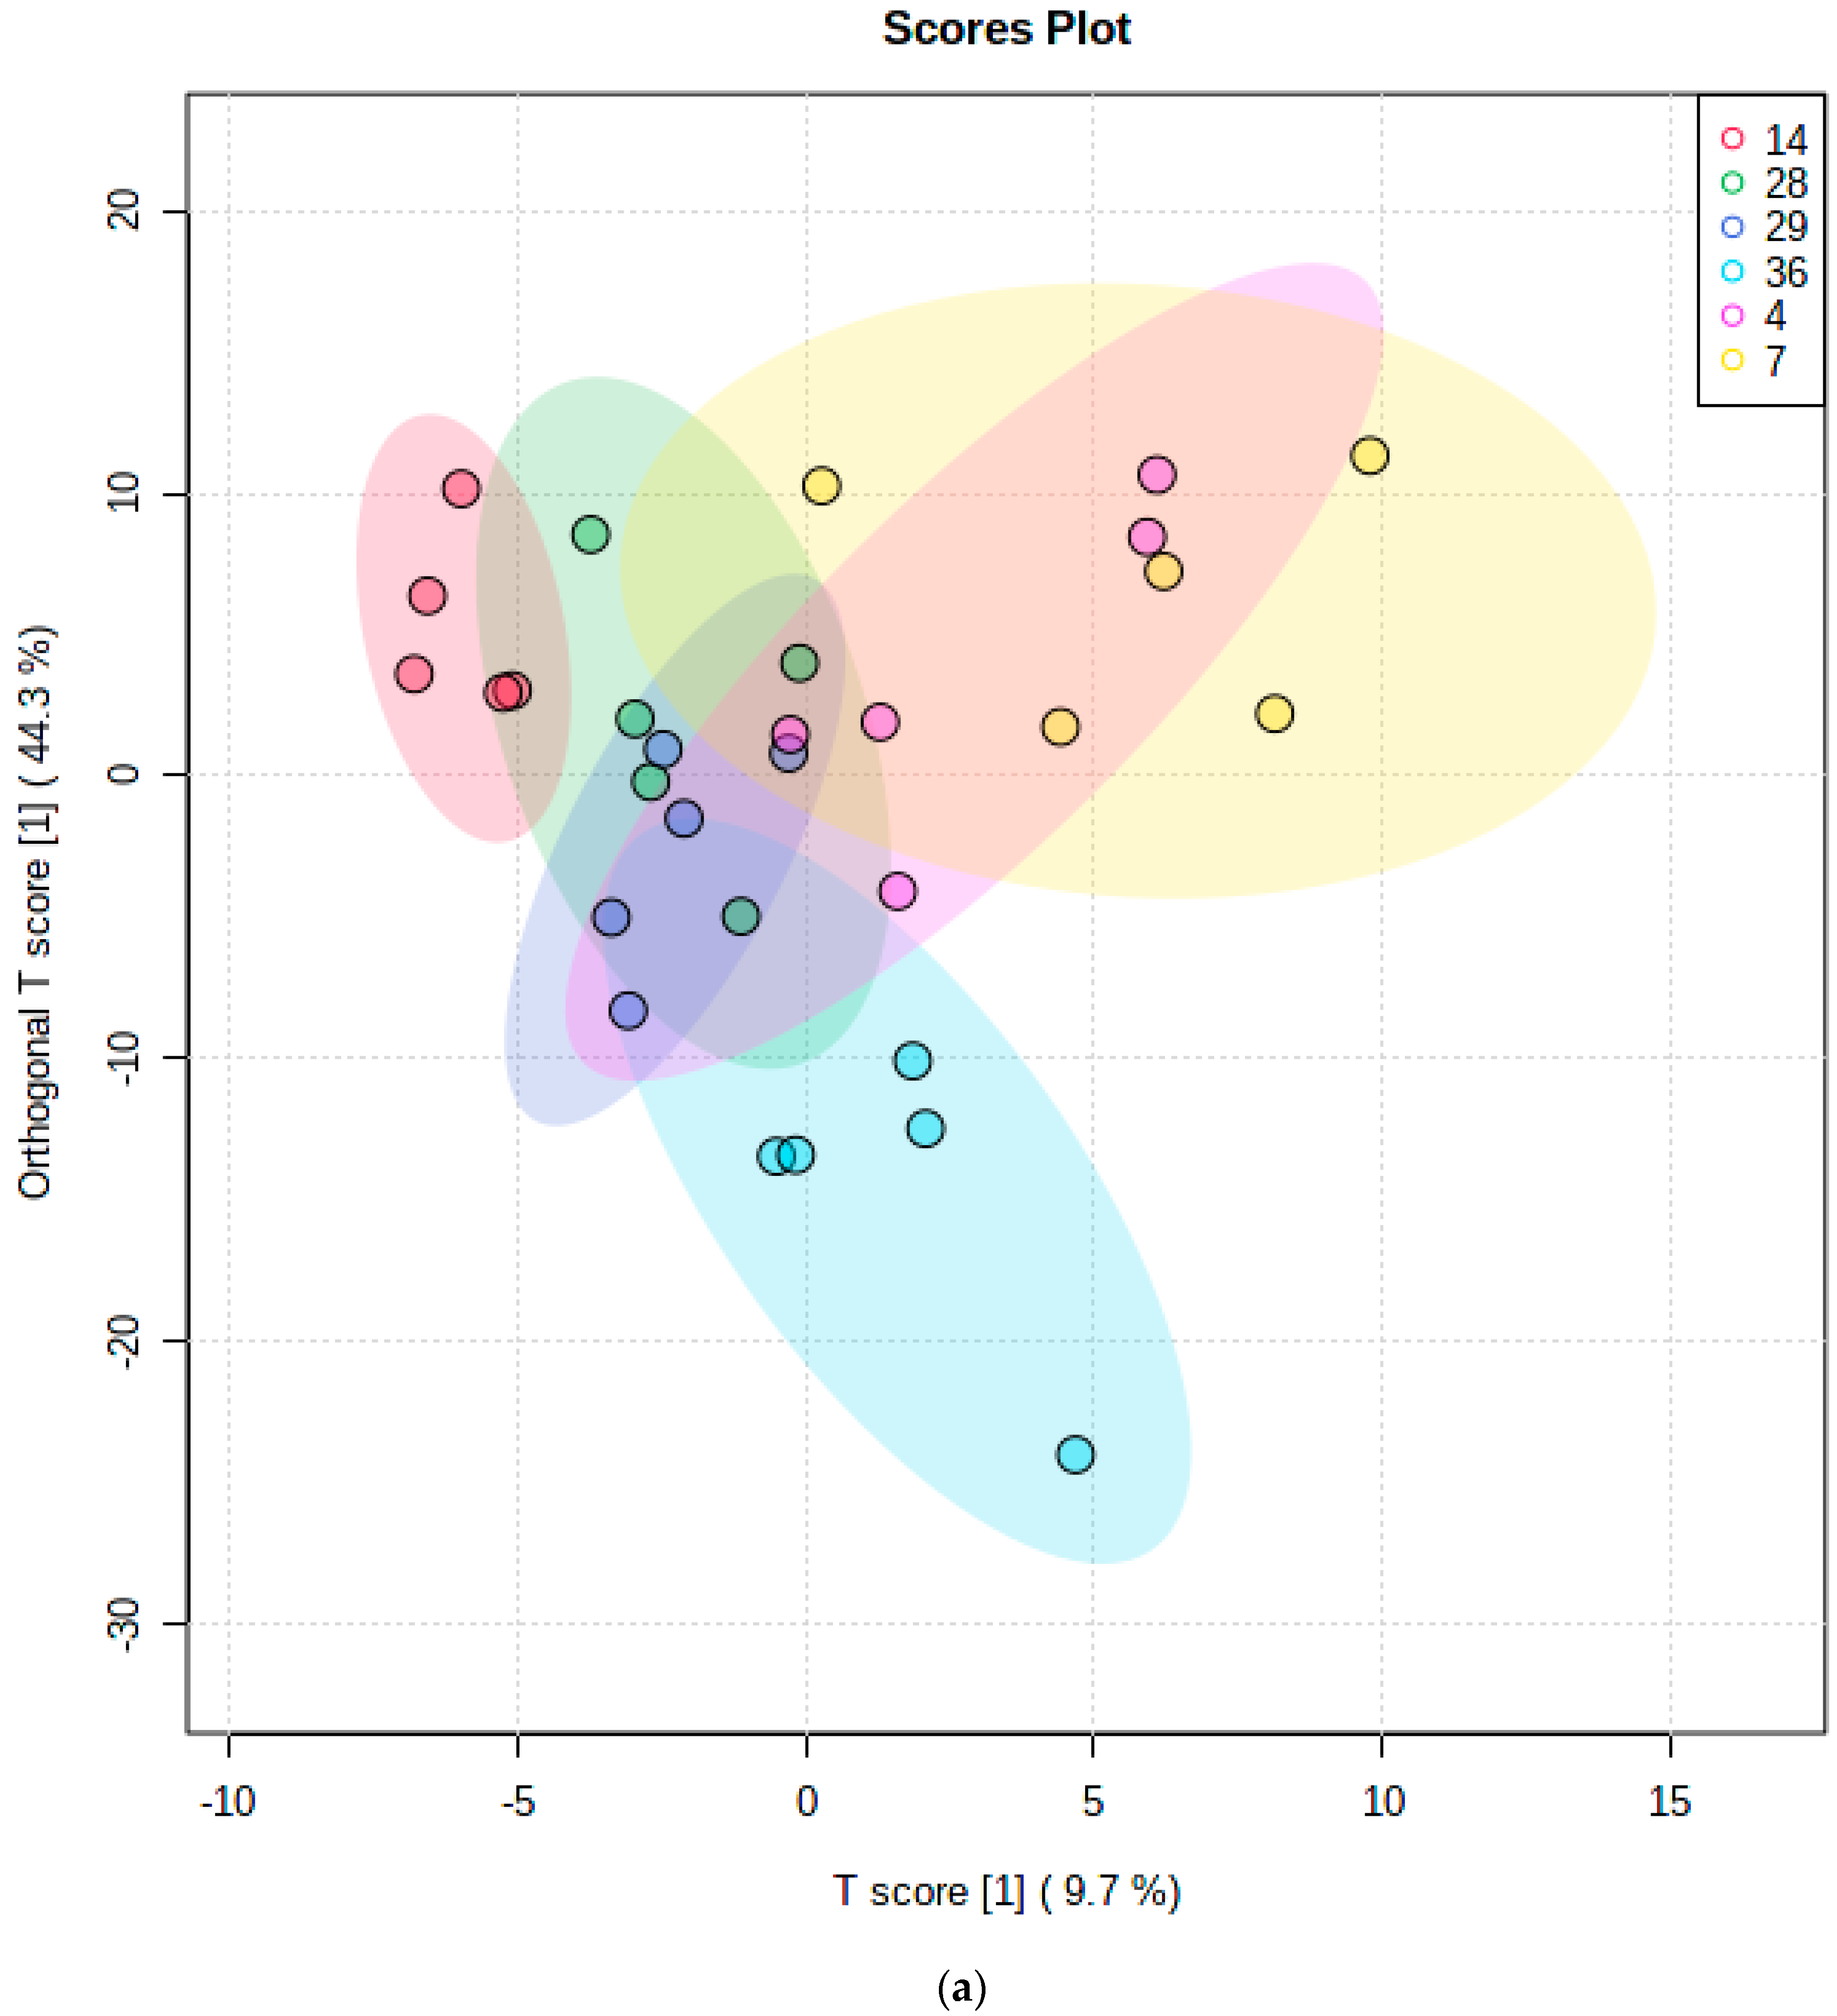
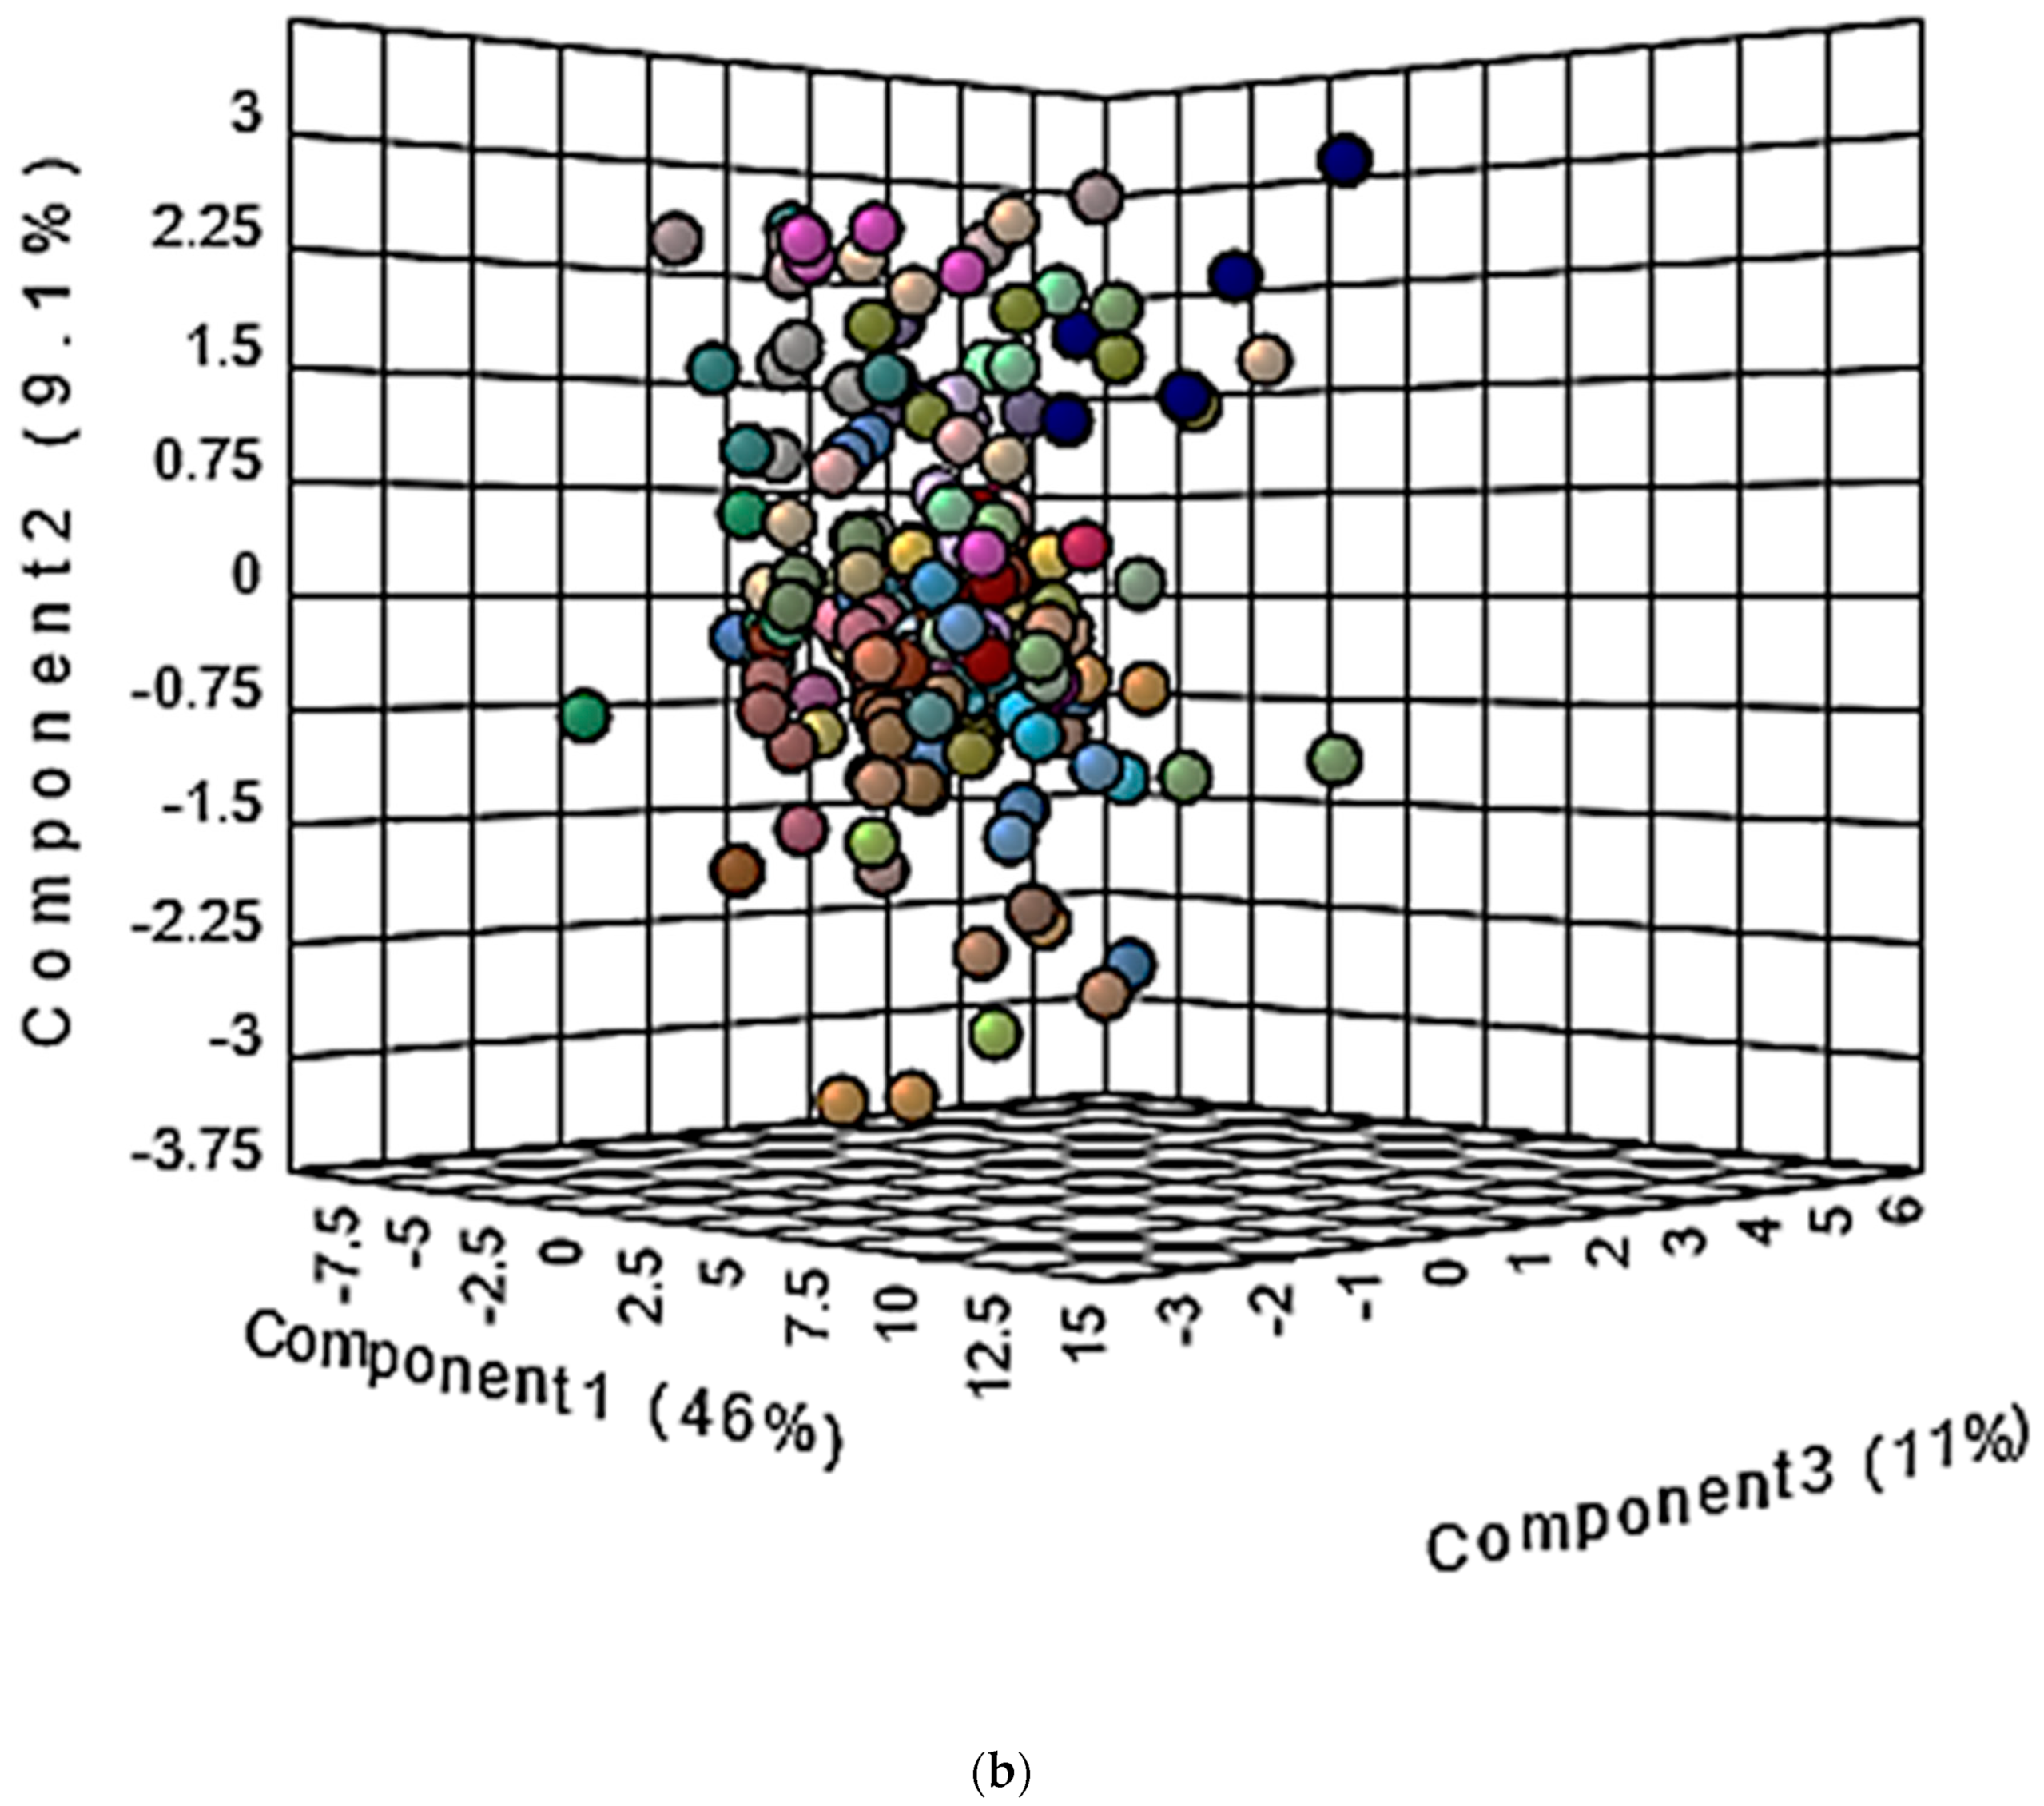
10.1.2. Multivariate Metabolomics Analysis of Distinctive Salivary Phenotypes

In view of these observations, we further extended these investigations to include MV metabolomics analysis approaches. Therefore, here for the first time, we also preliminarily report a sizeable MV salivary phenotyping study involving the above dataset with n = 48 healthy human participants donating WMS supernatant specimens on five sequential sampling days according to our early morning awakening collection regimen (Section 6). Figure 9 shows the orthogonal T score [1] versus T score [1] plot for (a) an OPLS-DA model performed on only n = 6 randomly selected participants, and (b) the 3D Component 3 vs. Component 2 vs. Component 1 scores plots results from a PLS-DA strategy, which sought to distinguish between and provide phenotypic information on the study participants. Although there remains much overlap between the 48 groups of five daily samples collected from each participant, there is clearly some evidence available that the WMS sample metabolite patterns of at least some sample donors were reproducibly distinctive from those of others, as displayed in the 2D plot shown in Figure 9a. The PLS-DA model applied to all the healthy control participants also provided at least some evidence for the distinctiveness of participant clusters (Figure 9b, for example, that for the cyan color-coded one in the center of the 3D plot, and that for the dark blue color-coded one with high Component 2 and 3 scores but low Component 1 scores.

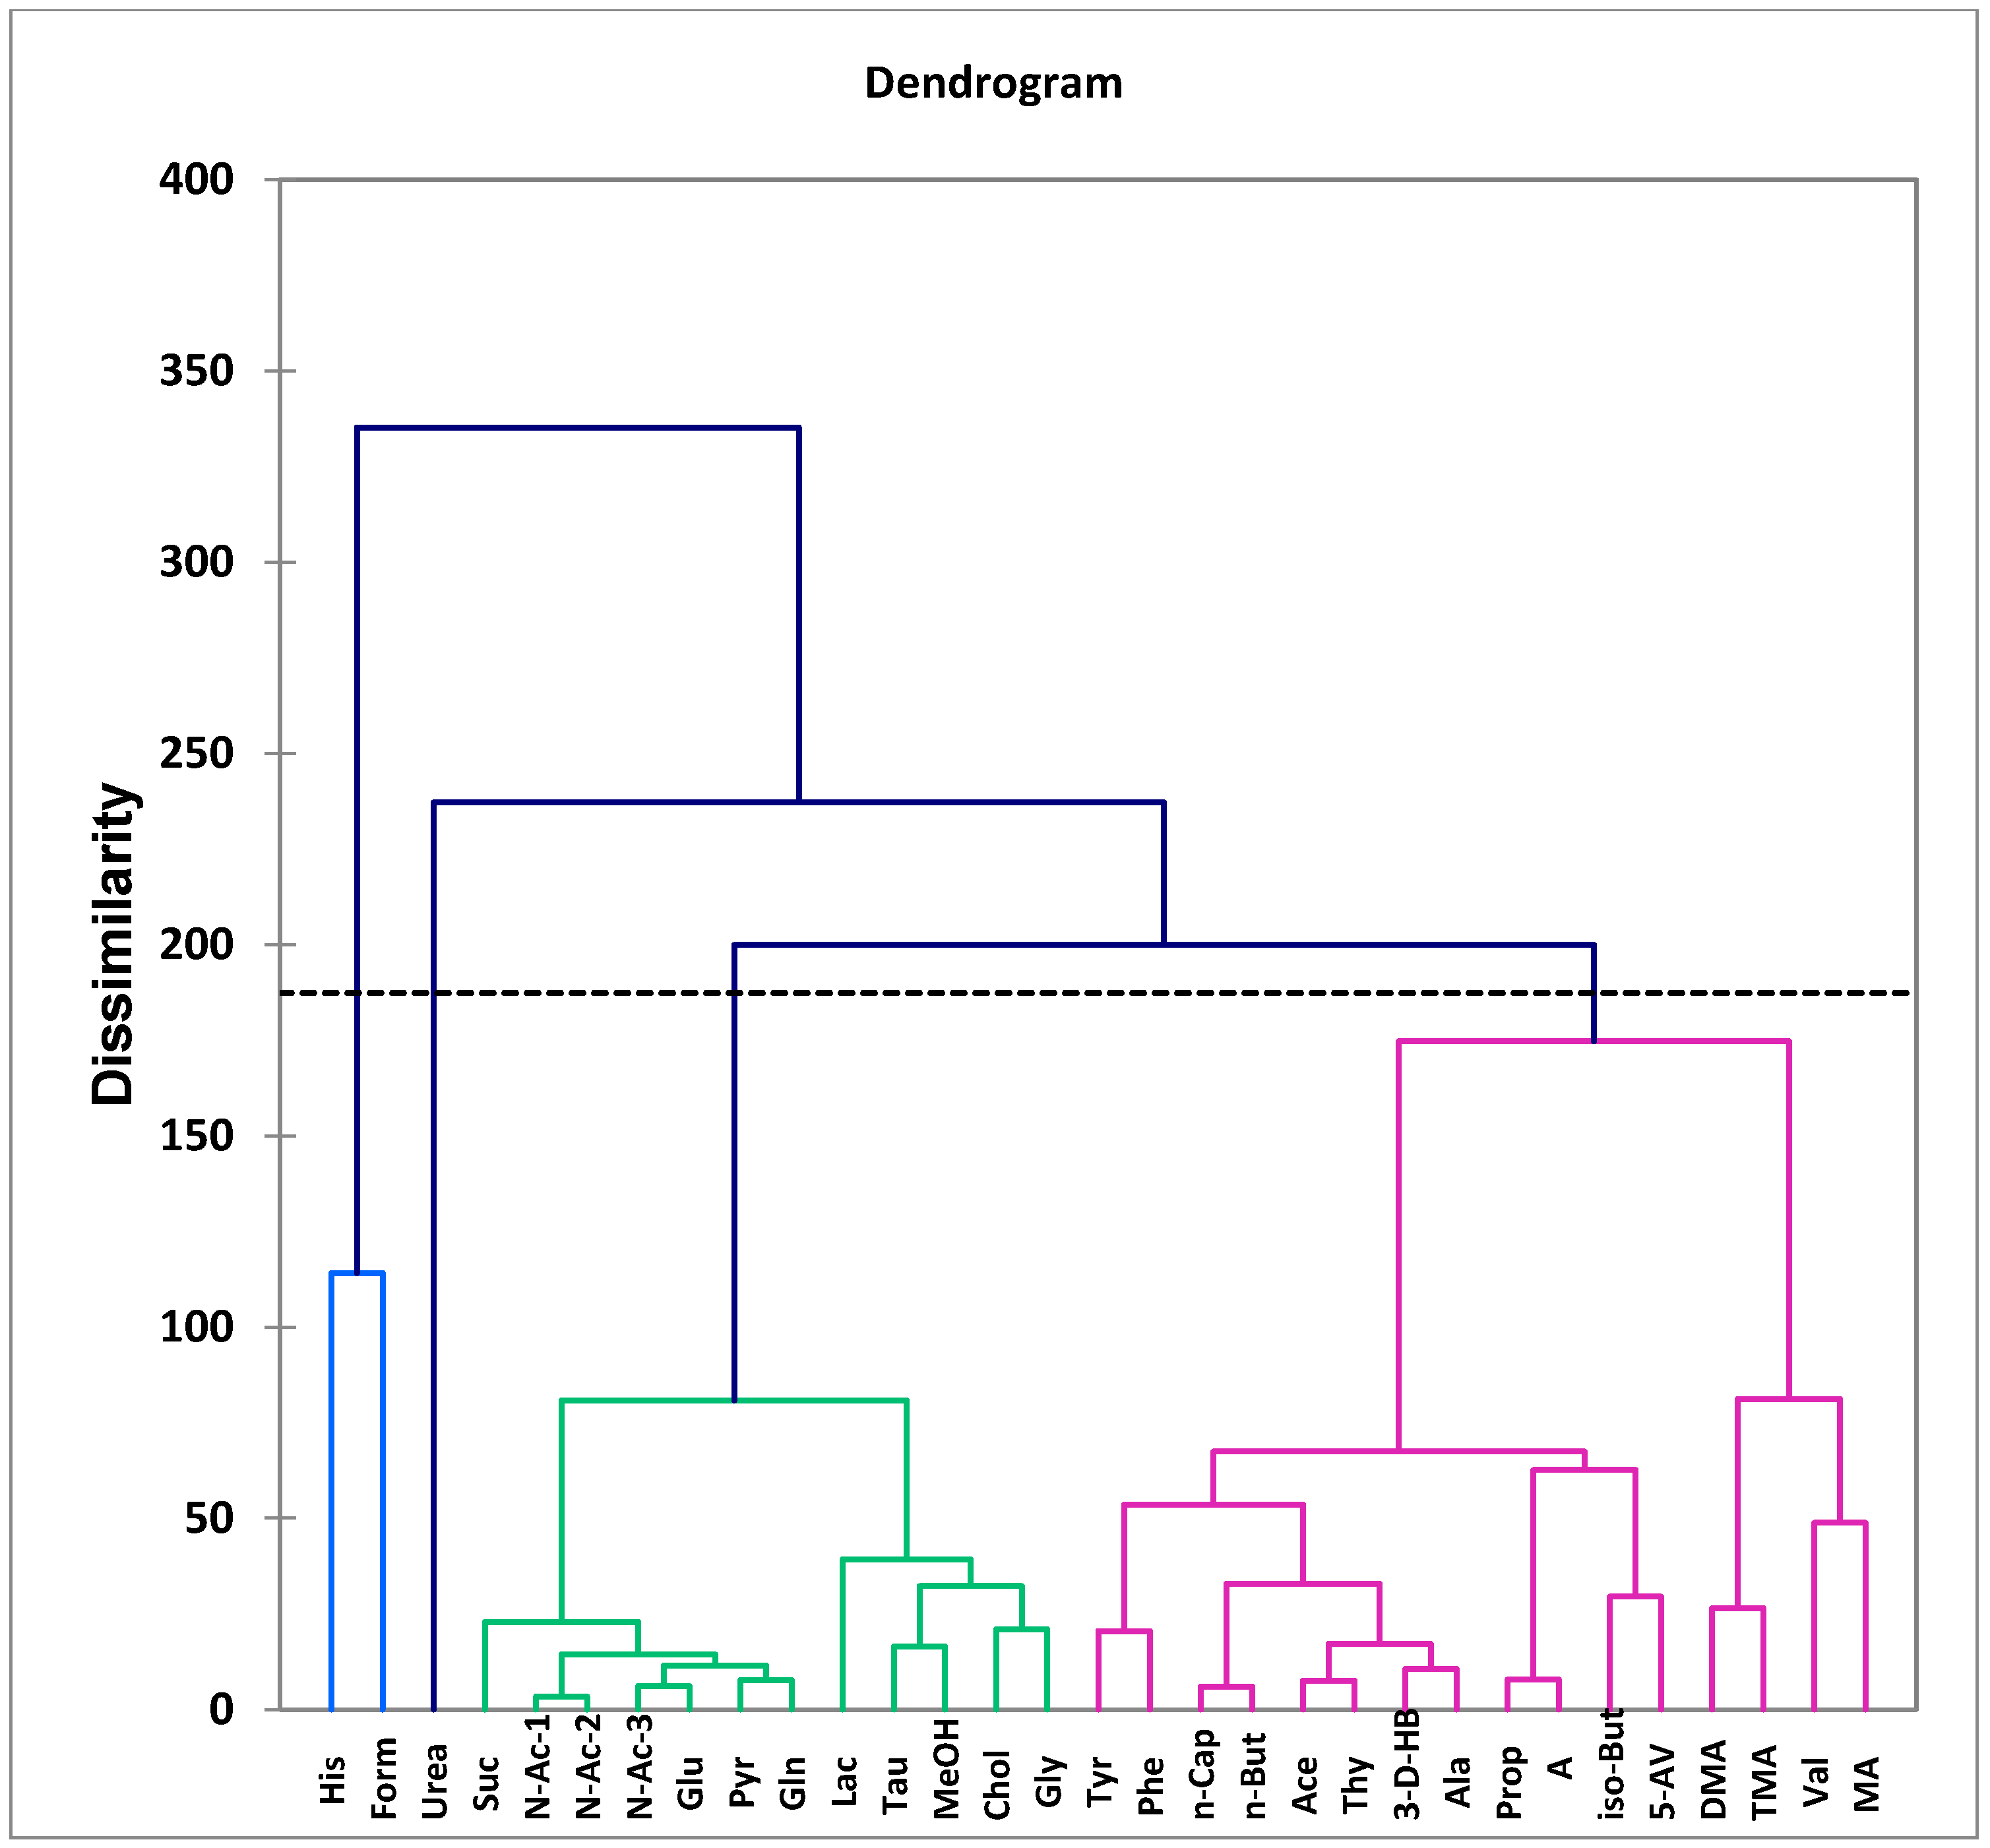
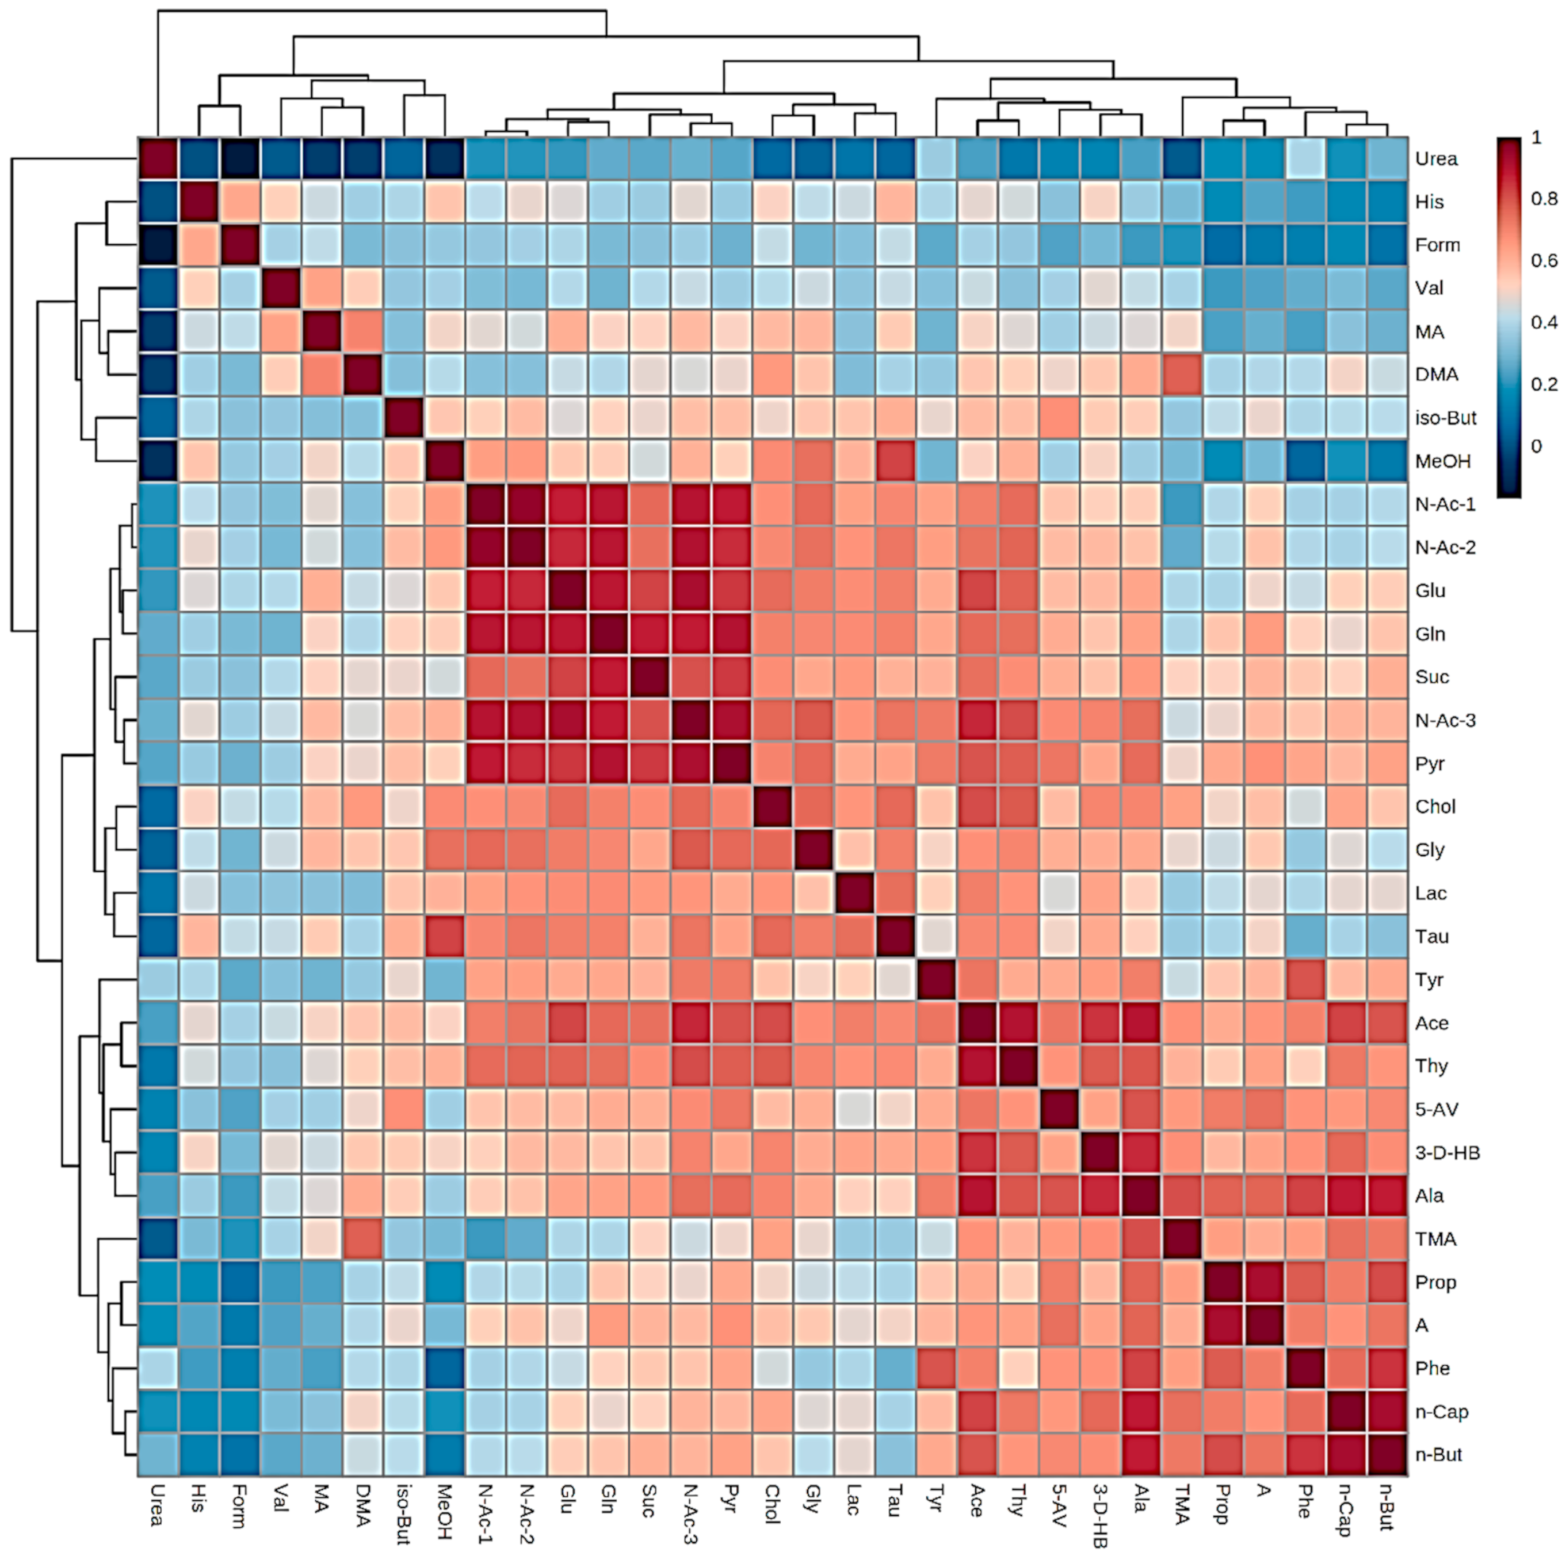
10.2. Investigation of Distinctive Metabolite Network Pools Putatively Arising from Host or Salivary Microbiome Sources: Factor Analysis of Component Loading Vectors and Patterns

For this very large healthy control-only participant dataset, we also elected to explore the loadings vectors (correlations) of individual metabolite variables on (with) each PC/factor isolated in a factor analysis technique model applied. For this purpose, we employed Varimax rotation and Kaiser normalization strategies, and the best model generated was that containing a total of 4 PCs. Table 5 lists these loadings vectors for the total of 31 1H NMR-assigned and determined biomolecule variables, along with ranges of values for their mean salivary and blood plasma concentrations referenced from the Human Metabolome Database (HMDB) [47] and further sources.
Primarily, a comparison of already established mean salivary concentrations with those of plasma demonstrates that the concentrations of n-butyrate, iso-butyrate, propionate, acetate, 5-aminovalerate, pyruvate, succinate, methylamine, and trimethylamine are much or even substantially higher in the former biofluid than they are in the latter, and this is more than sufficiently convincing to confirm that all these metabolites have a predominant oral or oral microbiome source and that any supply form the host system via plasma and parotid saliva can certainly be considered to be minimal. Since lactate and formate have higher salivary levels than those of plasma, it also appears that the presence of larger amounts of these biomolecules in the former biofluid is also at least partially ascribable to an oral or oral microbiome origin, although, as noted above, it has been previously suggested that lactate is derived from a host source [20]. However, the factor analysis model applied below indicates that this metabolite may arise from both sources.
PC1 featured strong loading contributions from lactate, acetoin, thymine, all N-acetylated metabolites 1–3, glutamate, glutamine, pyruvate, succinate, glycine, and tyrosine, along with a weaker loading contribution from urea. For PC2, however, the bacterial catabolites n-caproate, n-butyrate, propionate, acetate, 5-aminovalerate, succinate, and trimethylamine were all strong features, as were 3-D-hydroxybutyrate, acetoin, thymine, choline, alanine, and phenylalanine, along with weaker contributions from iso-butyrate, pyruvate, DMA, and one of the N-acetyl storage compounds (N-Ac-3). PC3 contains strong loadings from all salivary malodorous amines, valine, and choline, with less strong ones from glycine, histidine, and formate. Moreover, PC4 contained particularly strong loadings from taurine and methanol, with weaker contributions from iso-butyrate, 3-D-hydroxybutyrate, lactate, acetate, thymine, all N-acetylated metabolites, glutamate, glutamine, choline, glycine, histidine, and formate.
The co-loading of metabolite variables on two or even more PCs, i.e., perhaps a strong loading on one PC but a somewhat weaker one on another, is not at all uncommon in metabolomics experiments in view of probable heterogeneities in their generating sources and/or pathways involved in their production, i.e., for human WMS, either host or microbial ones, or the relative prevalence of bacteria with saccharolytic and/or proteolytic activities within the oral environment. However, from these values, it should be noted that PC1 is mainly strongly loaded with metabolite variables that certainly appear to arise from a host (parotid salivary/blood plasma) source, whereas those robustly loading on PC2 arise exclusively from the salivary microbiome. Indeed, for PC2, selected bacterially derived organic acid anions such as n-caproate, n-and iso-butyrates, propionate, and 5-aminovalerate, etc., are only detectable in the 1H NMR profiles of human saliva and not blood plasma nor parotid saliva (although trace levels of these may be detectable therein using more highly sensitive analytical techniques). Indeed, levels of propionate and n-butyrate in human saliva range from 6–69 and 0–2.9 mmol./L, respectively [3], whereas blood plasma levels of these are very much lower (mean levels in adults from reported studies were found to be only 0.9 and 1.0 μmol./L, respectively) [47]. Although host metabolic pathways also feature lactate, pyruvate, and succinate, they also load significantly upon the microbiome-sourced PC2 since they are also well-known microbial catabolites. Although acetate is certainly 1H NMR-detectable in blood plasma, its concentrations therein in healthy controls are very much lower than those found in WMS supernatants (Table 5), and therefore this metabolite appears to be predominantly derived from the oral microbiome (PC2) in this study, as might be expected. Since the amino acids alanine and phenylalanine also load strongly on PC2, it appears that such contributions from these species are derived from bacteria with proteolytic activities.
Interestingly, although TMA very strongly loaded on PC2, an observation indicating its microbial source, MA and DMA loaded less and insignificantly so. However, all these amines contributed towards PC3 very significantly, along with the amino acid valine, and therefore it appears that these PC3-loading metabolites all arise from a further, albeit orthogonal, source or pathway, which is not simply explicable. However, choline, which is required for the biosynthesis of TMA, loaded marginally but significantly on both PCs 2 and 3. Both MA and DMA are degradation products of TMA and hence may also originate from a choline source. Upregulated salivary choline possibly arises from the diminished clearance of shed buccal epithelial cells throughout the course of sleep periods [33]. Notably, PC2-loading acetate is also derived from choline metabolism [33], and TMA may also be generated from dietary carnitine [34]; additional precursors for it are phosphatidylcholine and betaine.
Notwithstanding, since urea is only relatively weakly loaded onto the host source PC1, and less and not significantly so on PCs 2, 3, and 4, its source remains a subject of conjecture. Although some were statistically significant, its Pearson correlations with all other metabolites were low or very low, and this appears to indicate a separate source or pathway for it. Gardner et al. [20] found that salivary urea concentrations strongly negatively correlated with both saccharolytic and proteolytic bacterial loads. Although statistically significant in at least some cases, simple linear Pearson correlations between WMS supernatant urea levels and those of all other metabolites identified therein were all poor or very low, i.e., values ranging from only −0.09 to 0.39 (Figure 10 and Supplementary Information Section S1), and this confirms that it may indeed arise from an independent source; nevertheless, some of its more stronger, positive correlations were those found with putatively host-sourced amino acids, including tyrosine.
The correlation heatmap shown in Figure 10 also demonstrates a series of strong agglomerative hierarchical clusterings (AHCs) of metabolites generated on the basis of Pearson correlations between them. Results from this form of AHC analysis were found to be consistent with an alternative AHC approach performed below (Figure 11) and also the factor analysis described here; these are described in Section S2 of the Supplementary Information Section. However, major observations arising from this analysis were (1) the clear distinctiveness of clusters arising from host and oral microbiome sources (the latter incorporating all organic acid anion catabolites arising from the actions of saccharolytic bacteria, along with selected amino acids from proteolytic bacterial metabolism) and (2) the separate clustering of urea alone, an observation confirming its independence of all or virtually all other metabolites. Sub-clusterings of the host- and oral microbiome-derived metabolites are also discussed in Section S2.
Previously, Kopstein and Wrong [148] investigated the origin and fate of salivary urea and ammonia in both healthy and uremic humans, and primarily they found that PDS and WMS had mean urea levels that were 86% and only 31%, respectively, of their corresponding plasma concentrations. However, although there was little or no ammonia found in parotid saliva, this concentration ranged from 0.6–26.0 mmol./kg in WMS, and these values positively correlated with plasma urea levels. However, intriguingly, these researchers found that in samples of WMS equilibrated at 37 °C, urea was completely lost within a 290 min duration; correspondingly, the bacterial hydrolysis product ammonia increased in level during the first 100 min of this episode. Although this route mainly accounted for urea loss from WMS, additional experiments suggested that at least some of the ammonia liberated or present therein prior to incubation is lost via buccal mucosal absorption or was passively reabsorbed through the oral mucosa in its unionized form.
However, the ammonia-based acid neutralization properties of the arginine deiminase and urease enzyme systems serve to counter adverse acidity at oral sites of microbial activity. Indeed, in order to overcome issues associated with recurring modifications in nutrient availabilities, pH, and oxygen tensions, bacteria have developed some unique mechanisms for sustenance purposes [149]. In view of the continuous acidification of oral biofilms, in dental caries, there are enhancements in the fractions of organisms that have marked abilities to decrease pH values via glycolytic pathways and to resume carbohydrate metabolism at acute pH values [150]. Notably, a range of species can maintain the property of generating ammonia-mediated alkaline conditions from salivary biomolecular substrates, and it appears that this process exerts a significant effect on microbial ecology and persistence, along with pH homeostasis [151]. The generation of plaque ammonia proceeds via urea hydrolysis by the enzyme urease or from arginine through arginine deiminase, systems that are viewed to act protectively against the development of dental caries. The cariogenic species Streptococcus mutans [152] has an ammonia-producing agmatine deiminase complex that degrades agmatine to putrescine, ammonia and CO2 and may represent a suitable target system for anti-caries therapeutic approaches. Moreover, as we might expect, caries-free individuals have been found to display a higher urease- and arginine-deiminase system-induced ammonia generating activity, in both saliva and plaque samples, than those with low caries vigor [153]. Therefore, caries-free individuals appear to have relatively greater levels of ammonia generation in their oral environments.
iso-Butyrate loaded strongly on PC4, and Zarling et al. [154] observed that this organic acid anion originated from the bacterial catabolism of a valine substrate in human stool, and along with iso-valerate, it may indicate fundamental protein maldigestion or malabsorption; although this amino acid was found to predominantly load on PC3 arising from the above factor analysis of our salivary metabolite dataset, it secondarily also loaded on PC4, although with a loading vector of only 0.30 (Table 5). However, this at least indicates some correlation between them.
Also loading on PC4 is a combination of histidine and formate, which would be expected to be associated in view of the former serving as a metabolic precursor of the latter [155]. However, serine, glycine, methionine, choline, and methanol can also be processed by selected endogenous mammalian metabolic systems to produce formate [156]. Formate in the oral environment remains of some significance in view of its crucial involvement in one-carbon metabolic biochemistry in vivo [156], as a potential marker of toxicity from the metabolism of salivary methanol via formaldehyde [58], and its markedly elevated salivary levels (range 0.20–61 mmol./L) [3] over those of other biofluids such as blood plasma.
Taurine most notably loads on PC4 very highly, but it also offers a small but significant contribution towards host source-derived PC1. This β-amino acid is found in many tissues at high (usually several mmol./L) levels [157]; however, its presence in human saliva is not simply explicable, although its salivary concentrations are similar to those of blood plasma (Table 5). Taurine is not detectable in glandular saliva [30] but it is found in GCF at high levels, which are likely to arise from immune cell sources since they are able to accumulate this metabolite at concentrations of up to 50 mmol./L [158].
An AHC model developed for the investigation of predictor metabolite clusterings or pools in this healthy control WMS supernatant dataset was largely very consistent with that obtained from factor analysis loadings vectors (Figure 11). Indeed, four major clusters were found, and from right-to-left. These comprise (1) oral microbiome-sourced biomolecules, specifically all organic acid anions (n-caproate, n-butyrate, iso-butyrate, propionate, acetate and 5-aminovalerate), malodorous methylamines (MA, DMA, and TMA), 3-D-hydroxybutyrate, acetoin, and thymine, along with the amino acids valine, alanine, phenylalanine, and tyrosine, which potentially arise from the actions of proteolytic bacteria (phenylalanine and tyrosine are presumably sub-clustered together since the latter arises from oxidation of the former)—all malodorous methylamine species were sub-clustered with the amino acid valine away from all other bacterially derived catabolites; (2) host-derived metabolites, i.e., the amino acids glycine, taurine, glutamine, glutamate, all N-acetylated biomolecule derivatives, plus choline, lactate, pyruvate, and succinate; (3) urea alone, in view of its poor loadings on PCs1-4 above in factor analysis, and poor correlations with virtually all other salivary biomolecules; and histidine and formate, which are independently associated in view of their common metabolic pathway. These results acquired were virtually fully consistent with the factor analysis performed and reported above.
We then sought to examine the factor analysis component (PC) scores values of participant samples collected from this healthy control group in order to determine which pools of metabolites, i.e., host- (PC1-loading) or oral microbiome-derived (PC2-loading) ones, were predominant for each study participant, specifically, which of these two pools had the highest magnitudes. We also aimed to explore the reproducibility of these prevalences between-sampling days-within participants. For this purpose, we set WMS supernatant sample PC score threshold cut-off values for PC1 and PC2, specifically so that (1) each dominant PC score value should be positive and greater than a minimum value of 0.50, and (2) that the value for the higher scoring PC should be significantly greater than that of the other, which was most often found to be of magnitudes >0.80 or so, but sometimes by as much as >2.0. In this context, 64 and 54 of the PC1 (presumably host-derived) and PC2 (presumably microbiome-derived) sample scores vectors satisfied these requirements, respectively. Particularly notable was the observation that, for each of the two PCs involved, ‘qualifying’ samples were clustered together in rows of 3, 4, or even 5, and these corresponded to samples collected from the same participants. Indeed, 13 participant sets of such samples with high scores were found for each of the two PC classifications, and only four participants out of a total of 48 had ‘mixed’ PC1-/PC2-rich responses, i.e., the above specified requirements for PC1 and PC2 scores values were found to be heterogenous for these throughout the 5-day sampling period, e.g., PC1 high/higher than PC2 for 2 days, PC2 high/higher than PC1 for the remaining 3 days, etc.
Figure 12 shows the high-field regions of typical 600 MHz 1H NMR profiles acquired on samples that, from the above factor analysis performed, were assigned to participants with PC1 (host)- and PC2 (oral microbiome)-dominant WMS supernatant profiles, and also one with a ‘mixed’ contribution from both PCs 1 and 2 (PC-contributory metabolites are color-coded).Therefore, assuming that our suggested origins of PCs 1 and 2 are correct, which judging from the loading contributions of local host- and microbial-sourced metabolites is indeed the case, then there appears to be evidence that, for this study, 13/48 participants had a salivary 1H NMR profile that was dominated by endogenous (host blood plasma) sources, whereas another 13/48 of these had those dictated by bacterial catabolites. Moreover, <10% of participants donated saliva samples that appeared to display a mixed host- and microbiome-derived distribution of metabolites.

11. Future Perspectives for Clinical Salivary NMR Bioanalysis and Monitoring with Low-Field Benchtop NMR Spectrometers

Unfortunately, high-resolution, high-field NMR spectrometer facilities for routine metabolomics screening programs are restrictive to many researchers since both university and commercial facilities containing, or with access to, such unwieldly instruments with large superconducting magnets are somewhat limited, and the expense involved also hampers such studies. However, recently some major developments with low-field (e.g., 60 MHz), non-stationary NMR spectrometers, which do not require such large cryogenic systems, have demonstrated the applicability of this novel technique to the multicomponent analysis of human urine and its value in the diagnosis and monitoring of type 2 diabetes in human participants [159]. Hence, here we also demonstrate the applications of this analytical strategy to determine the metabolic status of HSS samples, and its future potential for routinely screening for oral health and perhaps physiologically remote extra-oral conditions at patient point-of-contact sites such as dental surgeries, health centers, and pharmacies. Although LF benchtop NMR analysis is now frequently employed for determinations of the yields, extents, and rates of synthetic organic/inorganic chemistry reactions [160], along with chemical education applications [161,162], this approach may also provide useful clinical diagnostic and/or prognostic tracking information in human patients when biofluids are non-invasively screened. However, our recently conducted investigations focused on the quantitative LF NMR analysis of human saliva was found to be unfortunately limited to only five or so metabolites with the most prominent 1H NMR resonances in view of metabolite sensitivity issues and the superimposition of signals at this low operating frequency (Figure 13). These prominent resonances consisted of those of acetate, propionate, glycine, methanol, and formate, although future optimizations of this technique at perhaps higher benchtop spectrometer operating frequencies (say 80, 90, or 100 MHz) may lead to the efficient and reliable analysis of perhaps 12 or more salivary biomolecules.
We found at least reasonable consistencies and acceptable linear correlations between the salivary levels of acetate, propionate, glycine, and methanol estimated at 60 and 400 MHz operating frequencies (r = 0.97 to >0.99), but less so for formate (r = 0.93). Moreover, for propionate estimations, we also revealed some concentration limit restrictions in view of the overlap of its major δ = 1.05 ppm -CH3 function triplet signal (J = 7.67 Hz [14]) with those of a series of more minor level biomolecules. Because of this, we suggest that, for HSS specimens with propionate concentrations ≥1.2 mmol./L, samples are diluted somewhat to bring this level below this limit in order to minimize such resonance overlap complications; otherwise, the 60 MHz facility may significantly overestimate this value. Estimated LLOD and LLOQ values for such LF NMR analyses were approximately 100 and 300 μmol.//L, respectively, for major metabolites with prominent -CH3 function singlet resonances, specifically acetate. As expected, these values were somewhat higher for the propionate-CH3 group triplet, and the 2-proton glycine and 1-proton formate singlet signals.
For the readily visible propionate resonances located in the 60 MHz 1H NMR spectra, i.e., those ascribable to its coupled -CH3 and -CH2 groups (t, δ = 1.06 ppm, and q, δ = 2.18 ppm respectively), a consideration of their J value indicates that they will enclose 2 × 7.67/60 and 3 × 7.67/60 = 0.26 and 0.38 ppm, respectively, at 60 MHz (Figure 13), but only 0.026 and 0.038 ppm, respectively, in a corresponding 600 MHz spectrum (Figure 1). This illustrates the precautions that should be taken when attempting to quantify low-molecular-mass salivary metabolites or xenobiotics using this technique in view of inherent signal superimpositional limitations. However, after adopting suitable analytical calibration strategies, such problems may be overcome. Predominantly, however, these complications are not considered to be influential for 1H NMR resonances localized within relatively ‘spectroscopically clear’ regions of spectra acquired, specifically those of the methanol-CH3, glycine-CH2, and formate-H nuclei.
Readers should also appreciate that the adoption of these LF NMR technologies for the analysis of WMS supernatant or related samples is still at its very early stages, but, prospectively, future developments in this area may give rise to the installation or rapid transport of such non-stationary devices to dental surgery and primary healthcare sites, hospitals, and hospital laboratories, and perhaps also to community pharmacies for the rapid screening of oral health and perhaps other conditions at these point-of-contact sites, most especially if the number of metabolites determinable is increased to >10 and if at least some of these serve as reliable biomarkers for selected conditions. For example, lactate and acetate are useful biomarkers for dental caries [163], and propionate, along with n- and iso-butyrate, are for periodontal disease progression [164,165]. However, currently both these butyrate isomers are not readily 1H NMR-detectable at an operating frequency of only 60 MHz since their salivary concentrations remain below LLOD values.

12. Concluding Remarks and Recommendations for Future Experimental Investigations

In conclusion, high-resolution NMR analysis serves as an extremely valuable tool for probing the multicomponent metabolic status of human saliva. In this communication, the advantages of this technique for exploring the capacity of salivary 1H NMR-linked metabolomics techniques to (1) determine the nature, levels, and potential source(s) of salivary metabolites and (2) reliably predict the oral and, where possible, extra-oral health status of humans, has been considered in much detail. Also considered are the many complications and potential pitfalls associated with this strategy, most especially those regarding the careful planning and organization of saliva sample collections from study participant donors; sample transport, preparation, and storage protocols; and methods available for spectral acquisition, including pulse sequence selections available. Most notably, the distinction of ‘real’ endogenous salivary metabolites from those arising exogenously is of crucial importance, as demonstrated here for citrate and carbohydrates, which certainly appear to prolong in this biofluid for at least 4 and 2 h, respectively, after their dietary ingestion. Moreover, following meal consumption, we also have also demonstrated that selected salivary biomolecules (notably pyruvate, succinate, and lactate) rapidly increase in concentration in response to the carbohydrate challenge provided by food sources of carbohydrates such as sucrose and glucose, which were detectable in the 1H NMR profiles acquired ≥2 h following meal consumption (Figure 2). This response is ascribable to the utilization of carbohydrate species as an energy source by the salivary microbiome and their rapid catabolic conversion to these organic acid anion metabolites.
Planned developments in NMR-based salivary metabolomics have resulted in the creation of established protocols in order to achieve cross-laboratory standardized results that consider sample collection, storage, preparation, and analysis of saliva and which may serve to permit inter-laboratory comparisons, and also augment preliminary observations in this research area [3,31]. Indeed, the authors of [31] deserve much credit for developing this. Furthermore, the recommended protocol proposed for the ‘correct’ performance of salivary 1H NMR-based metabolomics experiments in [31] surmised that our current and previously used protocols for the 1H NMR determination of salivary biomolecules, and the utilization of unbuffered internal TSP as a quantitative standard and chemical shift reference, were predominantly acceptable and valid. Moreover, from this report [31], the type, temperature, rate, and duration of the critical cell- and debris-removing centrifugation step, together with freeze–thaw storage cycles, were considered not to significantly affect the quality of results obtained.
However, as noted in Section 6.2, there remain clear problems regarding the establishment of a minimum oral activity abstention period required for the collection of whole mouth and other forms of human saliva. Of particular concern is salivary citrate, the origin of which is of much importance since it is associated with upregulated rheological properties [7,84].
We have also explored the applications of pulse sequences for the 1H NMR analysis of human saliva, including the commonly employed CPMG strategy, and for the first time also present data on use of the newly developed WASTED sequence for the analysis of WMS supernatants (Figure 2). However, from comparisons of the Δv1/2 values of resonance lines in the metnoesy 1D 1H NMR spectra of a series of WMS supernatant specimens, it was found that with the exception of n = 2 participants, there were no significant differences between alanine and lactate, although that between some participants was, and this may indicate differential metabolite-binding macromolecule (including protein) levels, and/or variable metabolite-macromolecule binding equilibria between these samples. With the exception of one sample that had a near-equivalent value, overall, these values were significantly lower than those determined on the protein-unbound, ‘free’ form of lactate determined in spectra of human blood plasma acquired using the Hahn SEFT pulse sequence [124]. Hence, it appears that, although certainly present, any such macromolecule binding equilibria present in human saliva does not significantly alter the quantification of low-molecular-mass biomolecules in this analytical medium, simply because its availability is insufficient to achieve this. Indeed, we await results from additional experiments conducted to evaluate this further.
Additional information is also provided regarding ways and means for circumventing the misassignment of NMR resonances, most particularly those in commonly analyzed 1H spectral profiles, and these have included the benefits offered by the acquisition of 2D NMR techniques, both homo- and heteronuclear. Such misassignments may commonly arise in situations where researchers do not or are unable to acquire confirmatory 2D NMR profiles, although the duration of expensive spectrometer time required for their recommended acquisition can often present experimental restrictions. Notwithstanding, such 2D NMR techniques are also valuable for overcoming 1H NMR resonance congestion in selected regions of their 1D spectral profiles.
Further precautions regarding the applications of this novel technique are optimizations of the quantitative determination of salivary biomolecules, and preprocessing methods for advancing both the UV and MV statistical analyses of salivary metabolomic datasets, including the correct choice of strategies for the bucketing, normalization, transformation, and scaling of metabolite resonances. Although not the main focus of this report, we have also supplied profitable information concerning the techniques available for the MV and computational intelligence analysis (CIA) of such salivary 1H NMR profile data, although these approaches will be contemplated and scrutinized more so in Part II of this two-paper series.
We also demonstrate, for the first time, the ‘pooling’ of groups of salivary metabolites according to their physiological or other sources using a consideration of the component loadings of ‘predictor’ variables in a factor analysis experimental model involving quite a large number of healthy control human participants (n = 48), with five replicate WMS samples provided for each one. Particularly notable from this case study is the observation that all organic acid anion metabolites known to be predominantly or exclusively derived from bacterial catabolism, i.e., n-caproate, n-butyrate, propionate, acetate, and 5-aminovalerate, load the most strongly on PC2 (loadings vectors 0.85, 0.91, 0.84, 0.77, and 0.68 respectively), and certainly not significantly on the other PCs isolated. Therefore, the assignment of its source to the salivary microbiome certainly appears justified. This is further supported by considerable PC2 loading contributions arising from the bacterial catabolites DMA and TMA, along with selected amino acids such as alanine and phenylalanine, which presumably arise from a proteolytic bacterial source. Metabolites such as glutamate, glutamine, pyruvate, succinate, three N-acetylated species, and, to a lesser extent, urea, all loaded strongly on PC1, which was attributed to a host origin. Nonetheless, it was not at all surprising that quite a high proportion of the metabolites included in this study loaded significantly on more than just one PC. Indeed, metabolites such as the amino acid tyrosine appear to have a dual ‘residency’ on both the oral microbiome- and host-associated PCs, since amino acids such as this may be derived from both origins, the microbial one involving proteolytic bacteria. Likewise, it appears that both choline and acetoin are generated by both sources, as indeed are lactate, acetate, and succinate. For the host source, lactate is featured in the glycolytic pathway via reduction of pyruvate, acetate, and acetyl-CoA in many cellular metabolic processes operating with energy generation, lipid biosynthesis and protein acetylation functions, and succinate in the citric acid cycle. Additionally, it appears that a de novo pathway exists for acetate formation from a pyruvate precursor [166], which is, of course, the terminal product of both glycolysis and fatty acid metabolism. However, both these metabolites load significantly on the salivary metabolome-sourced PC (PC2). Moreover, acetate also readily arises from the autoxidation of pyruvate in aqueous solution (Equation (2)). Enzymes present in protein and amino acid–degrading (proteolytic) bacteria, including Prevotella and Porphyromonas species, readily degrade proteins and amino acids and transform them into organic acid anions, volatile sulfur compounds (VSCs), indole and skatole, and ammonia, for example, and these catabolites are known to play important chemopathological roles in the development of PDs and oral malodor. Although the oral environment may exert some major effects on the metabolic actions of bacteria, localized modifications arising therefrom can, at least in principle, give rise to a more active microbiome with an amplified pathogenicity. Therefore, a full analysis of the oral microbiome and catabolites arising therefrom through metabolomics strategies will serve to enhance our understanding of the mechanisms of oral diseases, together with potential means and/or regimens for their challenge with appropriate therapeutic strategies.
Of the broad ‘spectrum’ of 1H NMR-detectable short-chain organic acid anions (acetate, n- and iso-butyrates, formate, lactate, propionate, succinate, pyruvate, 5-aminovalerate and fumarate, amongst others), some may effectively serve as PD markers that reflect the growth, preponderance, and metabolism of micro-organisms. Indeed, for those that are not commonly also observed in or derived from host sources, it is highly conceivable that selected groups and/or patterns of these metabolites represent chemotaxonomic markers of different classes of bacterial infiltration. For example, the anaerobic pathogenic bacterium Porphyromonas gingivalis generates high levels of n-butyrate. Moreover, in addition to the roles of propionate, along with n- and iso-butyrates in PD [164,165], both acetate and lactate may act as surrogate biomarkers of the susceptibility of patients to dental caries [163]. Indeed, excessive levels of the corresponding acids of these metabolites are viewed as primary end-point biomarkers featured in dental caries etiology. However, formic and pyruvic acids, which may be present at millimolar or near-millimolar concentrations in human saliva [3], are stronger acids than lactic acid (i.e., they have clinically significant lower pKa values [2]), and hence may also trigger pro-cariogenic actions. N-acetyl sugars such as N-acetylglucosamine and N-acetylneuraminate (sialate) are derived from the actions of the bacterial enzymes hyaluronidase and neuraminidase, respectively, and may also play significant roles in the pathogenesis of oral diseases such as PDs [167,168]. The malodorous amines determined such as TMA may represent one or more potentially toxic agents generated by bacteria implicated in the etiology of PDs [169]. Moreover, volatile sulfur compounds (VSCs) also adversely contribute towards PDs [170].
We also conclude that low-field benchtop 1H NMR spectrometers may be successfully employed to reliably detect and quantify salivary metabolites, although, at present, this novel technology is restricted to molecules with the most prominent resonances, particularly those with clear singlets and/or simple first-order coupling patterns (specifically doublets or triplets only at this stage) or those present in spectroscopically clear spectral regions, for quantitative analysis purposes. From our current studies, only five or so of the most concentrated or 1H NMR-visible salivary biomolecules, i.e., acetate, propionate, methanol, glycine, and formate, could be determined in WMS supernatant samples, although it should be noted that these may all potentially serve as key, potentially diagnostic biomarkers for the monitoring of oral diseases. Therefore, this information is of potential value to the detection and prognostic screening of common oral health conditions such as PDs and dental caries, although much further research work will be required to plausibly evaluate these applications. Outlooks for the future of this cost-effective technique, such as the on-the-spot, point-of-care, and near-multicomponent analysis of WMS samples at patient point-of-contact sites appear to be highly promising. Once non-stationary benchtop NMR facilities at higher operating frequencies become available and validated for such applications, e.g., those operating at 80 or 100 MHz, or even higher field strengths, these devices may have the ability to acceptably screen up to 15 or more salivary biomolecules. Hence, further developments in these novel directions offer much promise.
In principle, when detectable at sufficient salivary concentrations, and when resolved from any potential superimposing endogenous metabolite resonances, such analyses may be directly conveyed to the detection and quantification of a range of exogenous agents in this biofluid, notably ingested drugs. Additionally, this development in NMR technology may also be transferable to a number of forensic applications, perhaps those featuring the rapid identification of illicit drugs in WMS supernatant samples obtained at crime scenes, again provided that such analytes have at least one prominent resonance that remains free from endogenous salivary interferants, and that samples are collected within acceptable time-zones following drug ingestion.
The benefits offered by human saliva and other oral fluids as diagnostic biofluids are that it is relatively easy for participants to non-invasively self-collect without any form of clinical supervision, and is conveniently stored, once all recommended laboratory processing treatments are applied. Nonetheless, research investigations performed on saliva for the diagnosis of both oral and systemic diseases remain in their early stages. Moreover, the scientific and clinical progression of these studies is curtailed somewhat by a lack of control, and hence homogeneity of sample collection, preparation, and analysis methods, and hence calls for the establishment of recommended and apparently validated protocols for such investigations noted in [31] should be responded to and implemented as soon as it is feasibly possible to do so. The availability of systemic knowledge networks for these technologies, with data available on validated disease biomarkers, will serve to enhance our understanding of correlations between oral and extra-oral health conditions, and this, in turn, may fully encourage the development of precision medicine strategies through the provision of support for pinpointed, innocuous, and perhaps even personally targeted therapies.
Finally, many further investigations, both at high-field and LF, are required to further explore the value of salivary 1H NMR analysis to the provision of potentially valuable salivary ‘biomarker’ data in a series of patients with clinically proven oral diseases, e.g., dental caries, periodontal diseases, oral malodor, etc. This essential requirement also applies to the application of these techniques to the salivary diagnosis and prognostic monitoring of extra-oral diseases such as a variety of remote cancers and inflammatory conditions, etc. However, since the salivary concentrations of biomarkers for such systemic conditions are often much lower than corresponding levels found in more localized biofluids such blood plasma or serum, for example, approximately 100-fold, such applications are limited somewhat in view of the analyte sensitivity level of 1H NMR analysis. Also required are meaningful evaluations of the reliability and reproducibility of multicomponent 1H NMR metabolic datasets acquired on WMS supernatant and other oral fluid specimens such as GCF, since these appear to be lacking in scientific literature available on salivary metabolomics. These approaches should not only include the analysis of replicate samples from the same participant donors (as conducted in the case study documented in Section 10.1 here) but also evaluations of the stability of biomarkers throughout the post-collection laboratory and NMR analysis processing periods, together with assurances that all possible precautions have been taken to circumvent their artefactual generation or the adverse artefactual introduction of assay interferants. The prognostic stratification of study participants may also be required in some investigations.
Optimization of ‘hands-on’ assignments of all or virtually all resonances present in the 1H NMR profiles of WMS supernatant samples and the mean, variances, and ranges of their concentrations should, in at least in principle, permit the performance of automated NMR-linked metabolomics strategies [171,172].

Supplementary Materials

The following supporting information can be downloaded at: https://www.mdpi.com/article/10.3390/app12031235/s1, Section S1: Correlation matrix showing simple linear Pearson correlation coefficients between 31 1H NMR-assigned early-morning WMS supernatant metabolite concentrations for a total of 240 samples collected from a total of n = 48 healthy control participants on five separate consecutive sampling days each; Section S2: Agglomerative Hierarchical Clustering (AHC) Analysis (corresponding to Figure 8, Section 10.2 of the main manuscript).

Author Contributions

Conceptualization, M.G.; methodology, M.G., G.P., M.B. and M.E.; software, M.G., G.P. and M.E.; validation, M.G. and M.E.; formal analysis, M.G., G.P., M.B. and M.E.; investigation, M.G., G.P., M.B. and M.E.; resources, M.G. and M.E.; data curation, M.G., G.P. and M.B.; writing—original draft preparation, M.G.; writing-review and editing, M.G., G.P., M.B. and M.E.; visualization, M.G., G.P., M.B. and M.E.; supervision, M.G.; project administration, M.G. All authors have read and agreed to the published version of the manuscript.

Funding

The research investigations featured in this manuscript were not funded. Nevertheless, we would like to express our sincerest thanks to the Faculty of Health and Life Sciences, De Montfort University, Leicester, UK for the provision of laboratory space and analytical facilities.

Institutional Review Board Statement

All studies were conducted according to the guidelines of the Declaration of Helsinki. The investigations outlined in Section 2, Section 6, Section 7 and Section 11 were approved by the Research Ethics Committee of The Faculty of Health and Life Sciences, De Montfort University (DMU), Leicester (reference no. 1082). The studies described in Section 8, Section 9 and Section 10 were approved by the University of Bolton Research Ethics Committee (reference no. CDD 9081).

Informed Consent Statement

Informed consent was obtained from all subjects involved in the studies outlined.

Data Availability Statement

Data supporting reported results can be obtained from the correspondence author ([email protected]).

Acknowledgments

The authors are eternally grateful to all project participants for the kind donation of their saliva samples for 1H NMR analysis. We are also very grateful to Magritek GmbH, Aachen, Germany for the academic loan of a 60 MHz Magritek Spinsolve Ultra Benchtop NMR Spectrometer for research purposes. We are also very grateful to Adolfo Botana of Jeol (UK) Ltd., Herts, UK for specialized assistance with pulse sequences.

Conflicts of Interest

All authors declare no conflict of interest.

References

  1. Wilson, P.B.; Grootveld, M. (Eds.) Computational Techniques for Analytical Chemistry and Bioanalysis; RSC the Chem Series; Royal Society of Chemistry: Cambridge, UK, 2020. [Google Scholar]
  2. Silwood, C.J.L.; Lynch, E.J.; Seddon, S.; Sheerin, A.; Claxson, A.W.D.; Grootveld, M.C. 1H NMR analysis of microbial-derived organic acids in primary root carious lesions and saliva. NMR Biomed. 1999, 12, 345–356. [Google Scholar] [CrossRef]
  3. Silwood, C.J.L.; Lynch, E.; Claxson, A.W.D.; Grootveld, M.C. 1H and 13C NMR spectroscopic analysis of human saliva. J. Dent. Res. 2002, 81, 422–427. [Google Scholar] [CrossRef] [PubMed]
  4. Grootveld, M.; Silwood, C.J.L. 1H NMR analysis as an analytical probe for human saliva. Biochem. Biophys. Res. Commun. 2005, 329, 1–5. [Google Scholar] [CrossRef] [PubMed]
  5. Silwood, C.J.L.; Grootveld, M.; Lynch, E. 1H NMR Investigations of the molecular nature of low-molecular-mass calcium ions in biofluids. J. Biol. Inorg. Chem. 2002, 7, 46–57. [Google Scholar] [CrossRef]
  6. Dame, Z.T.; Aziat, F.; Mandal, R.; Dame, Z.; Krishnamurthy, R.; Bouatra, S.; Borzouie, S.; Guo, A.; Sajed, T.; Deng, L.; et al. The human saliva metabolome. Metabolomics 2015, 11, 1864–1883. [Google Scholar] [CrossRef]
  7. Gardner, A.; Carpenter, G.; So, P.W. Salivary metabolomics: From diagnostic biomarker discovery to investigating biological function. Metabolites 2020, 10, 47. [Google Scholar] [CrossRef] [Green Version]
  8. Lloyd, G.R.; Wongravee, K.; Silwood, C.J.L.; Grootveld, M.; Brereton, R.G. Self organising maps for variable selection: Application to human saliva analysed by nuclear magnetic resonance spectroscopy to investigate the effect of an oral healthcare product. Chemomet. Intell. Lab. Systems 2009, 98, 149–161. [Google Scholar] [CrossRef]
  9. Wongravee, K.; Lloyd, G.R.; Silwood, C.J.; Grootveld, M.; Brereton, R.G. Supervised Self Organizing Maps (SOMs) for classification and variable selection: Illustrated by application to NMR metabolomic profiling. Anal. Chem. 2010, 82, 628–638. [Google Scholar] [CrossRef]
  10. Lemanska, A.; Grootveld, M.C.; Silwood, C.J.L.; Brereton, R.G. Chemometric variance analysis of 1H NMR metabolomics data on the effects of oral rinse on saliva. Metabolomics 2011, 8, 64–80. [Google Scholar] [CrossRef]
  11. Carmona, C.J.; Ruiz-Rodado, V.; del Jesus, M.J.; Weber, A.; Grootveld, M.; González, P.; Elizondo, D. FuGePSD: Fuzzy genetic programming-base for subgroup discovery. A case study: Pathogenesis of acute sore throat conditions in humans. Informat. Sci. 2015, 298, 180–197. [Google Scholar] [CrossRef]
  12. Zhang, A.; Sun, H.; Wang, X. Saliva metabolomics opens door to biomarker discovery, disease diagnosis, and treatment. Appl. Biochem. Biotechnol. 2012, 168, 1718–1727. [Google Scholar] [CrossRef]
  13. Chang, H.; Tomoda, S.; Silwood, C.J.L.; Lynch, E.; Grootveld, M. 1H NMR investigations of the molecular nature of cobalt(II) ions in human saliva. Arch. Biochem. Biophys. 2012, 520, 51–65. [Google Scholar] [CrossRef]
  14. Dodds, M.; Roland, S.; Edgar, M.; Thornhill, M. Saliva A review of its role in maintaining oral health and preventing dental disease. BDJ Team 2015, 2, 15123. [Google Scholar] [CrossRef]
  15. Proctor, G.B. The physiology of salivary secretion. Periodontology 2016, 70, 11–25. [Google Scholar] [CrossRef] [Green Version]
  16. Navazesh, M. Methods for collecting saliva. Ann. N. Y. Acad. Sci. 1993, 694, 72–77. [Google Scholar] [CrossRef]
  17. Baliga, S.; Muglikar, S.; Kale, R. Salivary pH: A diagnostic biomarker. J. Indian Soc. Periodontol. 2013, 17, 461–465. [Google Scholar] [CrossRef]
  18. Jenkins, G.N. The Physiology and Biochemistry of the Mouth, 4th ed.; Blackwell Scientific: Oxford, UK, 1978; p. 295. [Google Scholar]
  19. Lentner, C. (Ed.) Serum. In Geigy Scientific Tables, 8th ed.; Ciba-Geigy Ltd.: Basle, Switzerland, 1981; Volume 3, p. 141. [Google Scholar]
  20. Gardner, A.; Parkes, H.G.; So, P.-W.; Carpenter, G.H. Determining bacterial and host contributions to the human salivary metabolome. J. Oral Microbiol. 2019, 11, 1–1617014. [Google Scholar] [CrossRef] [Green Version]
  21. Yilmaz, A.; Geddes, T.; Han, B.; Bahado-Singh, R.O.; Wilson, G.D.; Imam, K.; Maddens, M.; Graham, S.F. Diagnostic biomarkers of Alzheimer’s disease as identified in saliva using 1H NMR-based metabolomics. J. Alzheimers Dis. 2017, 58, 355–359. [Google Scholar] [CrossRef] [PubMed]
  22. Yamada-Nosaka, A.; Fukutomi, S.; Uemura, S.; Hashida, T.; Fujishita, M.; Kobayashi, Y.; Kyogoku, Y. Preliminary nuclear magnetic resonance studies on human saliva. Arch. Oral Biol. 1991, 36, 697–701. [Google Scholar] [CrossRef]
  23. Figueira, J.; Gouveia-Figueira, S.; Öhman, C.; Lif Holgerson, P.; Nording, M.L.; Öhman, A. Metabolite quantification by nmr and lc-ms/ms reveals differences between unstimulated, stimulated, and pure parotid saliva. J. Pharm. Biomed. Anal. 2017, 140, 295–300. [Google Scholar] [CrossRef]
  24. Morrison, D.J.; Preston, T. Formation of short chain fatty acids by the gut microbiota and their impact on human metabolism. Gut Microbes. 2016, 7, 189–200. [Google Scholar] [CrossRef] [Green Version]
  25. Fernández, J.; Redondo-Blanco, S.; Gutierrez-del-Rio, I.; Miguelez, E.M.; Villar, C.J.; Lombo, F. Colon microbiota fermentation of dietary prebiotics towards short-chain fatty acids and their roles as anti-inflammatory and antitumour agents: A review. J. Funct. Foods. 2016, 25, 511–522. [Google Scholar] [CrossRef]
  26. Koh, A.; De Vadder, F.; Kovatcheva-Datchary, P.; Bäckhed, F. From dietary fiber to host physiology: Short-chain fatty acids as key bacterial metabolites. Cell 2016, 165, 1332–1345. [Google Scholar] [CrossRef] [Green Version]
  27. van de Wouw, M.; Schellekens, H.; Dinan, T.G.; Cryan, J.F. Microbiota-gut-brain axis: Modulator of host metabolism and appetite. J. Nutri. 2017, 147, 727–745. [Google Scholar] [CrossRef] [Green Version]
  28. Louis, P.; Flint, H.J. Formation of propionate and butyrate by the human colonic microbiota. Environ. Microbiol. 2017, 19, 29–41. [Google Scholar] [CrossRef] [Green Version]
  29. Takahashi, N. Oral microbiome metabolism: From “who are they?” to “what are they doing?”. J. Dent. Res. 2015, 94, 1628–1637. [Google Scholar] [CrossRef]
  30. Wallner-Liebmann, S.; Tenori, L.; Mazzoleni, A.; Dieber-Rotheneder, M.; Konrad, M.; Hofmann, P.; Luchinat, C.; Turano, P.; Zatlouka, I.K. Individual human metabolic phenotype analyzed by 1H NMR of saliva samples. J. Proteome Res. 2016, 15, 1787–1793. [Google Scholar] [CrossRef]
  31. Gardner, A.; Parkes, H.G.; Carpenter, G.H.; So, P.-W. Developing and standardizing a protocol for quantitative proton nuclear magnetic resonance (1h nmr) spectroscopy of saliva. J. Proteome Res. 2018, 17, 1521–1531. [Google Scholar] [CrossRef] [Green Version]
  32. Zeisel, S.H.; Wishnok, J.S.; Blusztajn, J.K. Formation of methylamines from ingested choline and lecithin. J. Pharmacol. Exp. Ther. 1983, 225, 320–324. [Google Scholar]
  33. Romano, K.A.; Martinez-Del Campo, A.; Kasahara, K.; Chittim, C.L.; Vivas, E.I.; Amador-Noguez, D.; Balskus, E.P.; Rey, F.E. Metabolic, epigenetic, and transgenerational effects of gut bacterial choline consumption. Cell Host Microbe 2017, 22, 279–290.e7. [Google Scholar] [CrossRef] [Green Version]
  34. Zhu, Y.; Jameson, E.; Crosatti, M.; Schafer, H.; Rajakumar, K.; Bugg, T.D.H.; Chen, Y. Carnitine metabolism to trimethylamine by an unusual Rieske-type oxygenase from human microbiota. Proc. Natl. Acad. Sci. USA 2014, 111, 4268–4273. [Google Scholar] [CrossRef] [PubMed] [Green Version]
  35. Bui, T.P.N.; Ritari, J.; Boeren, S.; de Waard, P.; Plugge, C.M.; de Vos, W.M. Production of butyrate from lysine and the Amadori product fructoselysine by a human gut commensal. Nat. Commun. 2019, 6, 10062. [Google Scholar] [CrossRef] [PubMed] [Green Version]
  36. Vital, M.; Howe, A.C.; Tiedje, J.M. Revealing the bacterial butyrate synthesis pathways by analyzing (meta)genomic data. MBio 2014, 5, e00889-14. [Google Scholar] [CrossRef] [PubMed] [Green Version]
  37. Ruhl, S. The scientific exploration of saliva in the post-proteomic era: From database back to basic function. Expert Rev. Proteom. 2012, 9, 85–96. [Google Scholar] [CrossRef] [PubMed] [Green Version]
  38. Cleaver, L.M.; Moazzez, R.; Carpenter, G.H. Mixed aerobic-anaerobic incubation conditions induce proteolytic activity from in vitro salivary biofilms. J. Oral Microbiol. 2019, 11, 1643206. [Google Scholar] [CrossRef] [Green Version]
  39. Campo, J.; Perea, M.A.; Del Romero, J.; Cano, J.; Hernando, V.; Bascones, A. Oral transmission of HIV, reality or fiction? An update. Oral Dis. 2006, 12, 219–228. [Google Scholar] [CrossRef]
  40. Miller, S. Saliva testing—A non traditional diagnostic tool. Clin. Lab. Sci. 1994, 7, 39–44. [Google Scholar]
  41. Challacombe, S.J.; Percival, R.S.; Marsh, P.D. Age-related changes in immunoglobulin isotypes in whole and parotid saliva and serum in healthy individuals. Oral Microbiol. Immunol. 1995, 10, 202–207. [Google Scholar] [CrossRef]
  42. Lee, Y.H.; Wong, D.T. Saliva: An emerging biofluid for early detection of diseases. Am. J. Dent. 2009, 22, 241–248. [Google Scholar]
  43. Haeckel, R.; Hanecke, P. The application of saliva, sweat, and tear fluid for diagnostic purposes. Ann. Biol. Clin. 1993, 51, 903–910. [Google Scholar]
  44. Yoshizawa, J.M.; Schafer, C.A.; Schafer, J.J.; Farrell, J.J.; Paster, B.J.; Wong, D.T. Salivary biomarkers: Toward future clinical and diagnostic utilities. Clin. Microbiol. Rev. 2013, 2013 26, 781–791. [Google Scholar] [CrossRef] [Green Version]
  45. Drobitch, R.K.; Svensson, C.K. Therapeutic drug monitoring in saliva: An update. Clin. Pharmacokinet. 1992, 23, 365–379. [Google Scholar] [CrossRef]
  46. Jusko, W.J.; Milsap, R.L. Pharmacokinetic principles of drug distribution in saliva. Ann. N. Y. Acad. Sci. 1993, 694, 36–47. [Google Scholar] [CrossRef]
  47. Wishart, D.S.; Feunang, Y.D.; Marcu, A.; Guo, A.C.; Liang, K.; Vázquez-Fresno, R.; Sajed, T.; Johnson, D.; Li, C.; Karu, N.; et al. HMDB 4.0—The Human Metabolome Database for 2018. Nucleic Acids Res. 2018, 46, D608–D6117. [Google Scholar] [CrossRef]
  48. Schrimpe-Rutledge, A.C.; Codreanu, S.G.; Sherrod, S.D.; McLean, J.A. Untargeted metabolomics strategies-challenges and emerging directions. J. Am. Soc. Mass Spectrom. 2016, 27, 1897–1905. [Google Scholar] [CrossRef] [Green Version]
  49. Dunn, W.B.; Ellis, D.I. Metabolomics: Current analytical platforms and methodologies. Trac-Trend Anal. Chem. 2005, 24, 285–294. [Google Scholar]
  50. Lynch, E.; Sheerin, A.; Claxson, A.W.D.; Atherton, M.D.; Rhodes, C.J.; Silwood, C.J.L.; Naughton, D.P.; Grootveld, M. Multicomponent spectroscopic investigations of salivary antioxidant consumption by an oral rinse preparation containing the stable free radical species chlorine dioxide (ClO2). Free Rad. Res. 1997, 26, 209–237. [Google Scholar] [CrossRef]
  51. Lynch, E.; Sheerin, A.; Silwood, C.J.; Grootveld, M. Multicomponent evaluations of the oxidising actions and status of a peroxoborate-containing tooth-whitening system in whole human saliva using high resolution proton NMR spectroscopy. J. Inorg. Biochem. 1999, 73, 65–84. [Google Scholar] [CrossRef]
  52. Dona, A.C.; Jiménez, B.; Schäfer, H.; Humpfer, E.; Spraul, M.; Lewis, M.R.; Pearce, J.T.; Holmes, E.; Lindon, J.C.; Nicholson, J.K. Precision high-throughput proton nmr spectroscopy of human urine, serum, and plasma for large-scale metabolic phenotyping. Anal. Chem. 2014, 86, 9887–9894. [Google Scholar] [CrossRef]
  53. Beckonert, O.; Keun, H.C.; Ebbels, T.M.; Bundy, J.; Holmes, E.; Lindon, J.C.; Nicholson, J.K. Metabolic profiling, metabolomic and metabonomic procedures for NMR spectroscopy of urine, plasma, serum and tissue extracts. Nat. Protoc. 2007, 2, 2692–2703. [Google Scholar] [CrossRef]
  54. Dunn, W.B.; Broadhurst, D.; Begley, P.; Zelena, E.; Francis-McIntyre, S.; Anderson, N.; Brown, M.; Knowles, J.D.; Halsall, A.; Haselden, J.N. Procedures for large-scale metabolic profiling of serum and plasma using gas chromatography and liquid chromatography coupled to mass spectrometry. Nat. Protoc. 2011, 6, 1060. [Google Scholar] [CrossRef] [PubMed]
  55. Chan, E.C.Y.; Pasikanti, K.K.; Nicholson, J.K. Global urinary metabolic profiling procedures using gas chromatography–mass spectrometry. Nat. Protoc. 2011, 6, 1483. [Google Scholar] [CrossRef] [PubMed]
  56. Álvarez-Sánchez, B.; Priego-Capote, F.; Luque de Castro, M.D. Study of sample preparation for metabolomic profiling of human saliva by liquid chromatography–time of flight/mass spectrometry. J. Chromatogr. A 2012, 1248, 178–181. [Google Scholar] [CrossRef] [PubMed]
  57. Williams, R.A.D.; Elliottt, J.C. Basic and Applied Dental Biochemistry; Churchill Livingstone: Edinburgh, UK, 1979. [Google Scholar]
  58. Percival, B.C.; Wann, A.; Masania, J.; Sinclair, J.; Sullo, N.; Grootveld, M. Detection and determination of methanol and further potential toxins in human saliva collected from cigarette smokers: A 1H NMR investigation. JSM Biotechnol. Biomed. Eng. 2018, 5, 1081–1088. [Google Scholar]
  59. Ishikawa, S.; Sugimoto, M.; Kitabatake, K.; Sugano, A.; Nakamura, M.; Kaneko, M.; Ota, S.; Hiwatari, K.; Enomoto, A.; Soga, T.; et al. Identification of salivary metabolomic biomarkers for oral cancer screening. Sci. Rep. 2016, 6, 2–8. [Google Scholar] [CrossRef] [Green Version]
  60. Duarte, D.; Castro, B.; Pereira, J.L.; Marques, J.F.; Costa, A.L.; Gil, A.M. Evaluation of saliva stability for nmr metabolomics: Collection and handling protocols. Metabolites 2020, 10, 515. [Google Scholar] [CrossRef]
  61. De Oliveira, L.R.P.; Martins, C.; Fidalgo, T.K.S.; Freitas-Fernandes, L.B.; De Oliveira Torres, R.; Soares, A.L.; Almeida, F.C.L.; Valente, A.P.; De Souza, I.P.R. Salivary metabolite fingerprint of type 1 diabetes in young children. J. Proteome Res. 2016, 15, 2491–2499. [Google Scholar] [CrossRef]
  62. Gawron, K.; Wojtowicz, W.; Łazarz-Bartyzel, K.; Łamasz, A.; Qasem, B.; Mydel, P.; Chomyszyn-Gajewska, M.; Potempa, J.; Mlynarz, P. Metabolomic status of the oral cavity in chronic periodontitis. In Vivo 2019, 33, 1165–1174. [Google Scholar] [CrossRef] [Green Version]
  63. Freitas-Fernandes, L.B.; Fidalgo, T.K.S.; de Almeida, P.A.; Souza, I.P.R.; Valente, A.P. Salivary metabolome of children and adolescents under peritoneal dialysis. Clin. Oral Investig. 2021, 25, 2345–2351. [Google Scholar] [CrossRef]
  64. Morgana, I.; Gonçalves, F.; Pessoa, M.B.; Leitão, A.D.S.; Godoy, P.; Francisco, C.; Nonaka, W.; Alves, P.M. Salivary and Serum Biochemical Analysis from Patients with Chronic Renal Failure in Hemodialysis: A Cross-Sectional Study. Pesqui. Bras. Em Odontopediatria E Clínica Integr. 2021, 21, 1–8.e0036. [Google Scholar]
  65. Gilany, K.; Mohamadkhani, A.; Chashmniam, S.; Shahnazari, P.; Amini, M.; Arjmand, B.; Malekzadeh, R.; Ghoochani, B.F.N.M. Metabolomics analysis of the saliva in patients with chronic hepatitis by using nuclear magnetic resonance: A pilot study. Iran. J. Basic Med. Sci. 2019, 22, 1044–1049. [Google Scholar]
  66. Schulz, A.; Lang, R.; Behr, J.; Hertel, S.; Reich, M.; Kümmerer, K.; Hannig, M.; Hannig, C.; Hofmann, T. Targeted metabolomics of pellicle and saliva in children with different caries activity. Sci. Rep. 2020, 10, 1–11. [Google Scholar] [CrossRef] [Green Version]
  67. Liebsch, C.; Pitchika, V.; Pink, C.; Samietz, S.; Kastenmüller, G.; Artati, A.; Suhre, K.; Adamski, J.; Nauck, M.; Völzke, H.; et al. The saliva metabolome in association to oral health status. J. Dent. Res. 2019, 98, 642–651. [Google Scholar] [CrossRef]
  68. Liang, Q.; Liu, H.; Zhang, T.; Jiang, Y.; Xing, H.; Zhang, A.H. Metabolomics-based screening of salivary biomarkers for early diagnosis of Alzheimer’s disease. RSC Adv. 2015, 5, 96074–96079. [Google Scholar] [CrossRef]
  69. Song, X.; Yang, X.; Narayanan, R.; Shankar, V.; Ethiraj, S.; Wang, X.; Duan, N.; Ni, Y.H.; Hu, Q.; Zare, R.N. Oral squamous cell carcinoma diagnosed from saliva metabolic profiling. Proc. Natl. Acad. Sci. USA 2020, 117, 16167–16173. [Google Scholar] [CrossRef]
  70. Murata, T.; Yanagisawa, T.; Kurihara, T.; Kaneko, M.; Ota, S.; Enomoto, A.; Tomita, M.; Sugimoto, M.; Sunamura, M.; Hayashida, T.; et al. Salivary metabolomics with alternative decision tree-based machine learning methods for breast cancer discrimination. Breast Cancer Res. Treat. 2019, 177, 591–601. [Google Scholar] [CrossRef]
  71. Romano, F.; Meoni, G.; Manavella, V.; Baima, G.; Tenori, L.; Cacciatore, S.; Aimetti, M. Analysis of salivary phenotypes of generalized aggressive and chronic periodontitis through nuclear magnetic resonance-based metabolomics. J. Periodontol. 2018, 89, 1452–1460. [Google Scholar] [CrossRef] [Green Version]
  72. Sapkota, S.; Huan, T.; Tran, T.; Zheng, J.; Camicioli, R.; Li, L.; Dixon, R.A. Alzheimer’s biomarkers from multiple modalities selectively discriminate clinical status: Relative importance of salivary metabolomics panels, genetic, lifestyle, cognitive, functional health and demographic risk markers. Front. Aging Neurosci. 2018, 10, 296. [Google Scholar] [CrossRef] [Green Version]
  73. Schulte, F.; King, O.D.; Paster, B.J.; Moscicki, A.B.; Yao, T.J.; Van Dyke, R.B.; Shiboski, C.; Ryder, M.; Seage, G.; Hardt, M. Salivary metabolite levels in perinatally HIV-infected youth with periodontal disease. Metabolomics 2020, 16, 98. [Google Scholar] [CrossRef]
  74. Kageyama, G.; Saegusa, J.; Irino, Y.; Tanaka, S.; Tsuda, K.; Takahashi, S.; Sendo, S.; Morinobu, A. Metabolomics analysis of saliva from patients with primary Sjögren’s syndrome. Clin. Exp. Immunol. 2015, 182, 149–153. [Google Scholar] [CrossRef] [Green Version]
  75. Wei, J.; Xie, G.; Zhou, Z.; Shi, P.; Qiu, Y.; Zheng, X.; Chen, T.; Su, M.; Zhao, A.; Jia, W. Salivary metabolite signatures of oral cancer and leukoplakia. Int. J. Cancer 2011, 129, 2207–2217. [Google Scholar] [CrossRef]
  76. Assad, D.X.; Acevedo, A.C.; Mascarenhas, E.C.P.; Normando, A.G.C.; Pichon, V.; Chardin, H.; Guerra, E.N.S.; Combes, A. Using an untargeted metabolomics approach to identify salivary metabolites in women with breast cancer. Metabolites 2020, 10, 506. [Google Scholar] [CrossRef]
  77. Singh, M.P.; Saxena, M.; Saimbi, C.S.; Siddiqui, M.H.; Roy, R. Post-periodontal surgery propounds early repair salivary biomarkers by 1H NMR based metabolomics. Metabolomics 2019, 15, 141. [Google Scholar] [CrossRef]
  78. Sugimoto, M.; Wong, D.T.; Hirayama, A.; Soga, T.; Tomita, M. Capillary electrophoresis mass spectrometry-based saliva metabolomics identified oral, breast and pancreatic cancer-specific profiles. Metabolomics 2010, 6, 78–95. [Google Scholar] [CrossRef] [Green Version]
  79. Kawanishi, N.; Hoshi, N.; Masahiro, S.; Enomoto, A.; Ota, S.; Kaneko, M.; Soga, T.; Tomita, M.; Kimoto, K. Effects of inter-day and intra-day variation on salivary metabolomic profiles. Clin. Chim. Acta 2019, 489, 41–48. [Google Scholar] [CrossRef]
  80. Turunen, S.; Puurunen, J.; Auriola, S.; Kullaa, A.M.; Kärkkäinen, O.; Lohi, H.; Hanhineva, K. Metabolome of canine and human saliva: A non-targeted metabolomics study. Metabolomics 2020, 16, 90. [Google Scholar] [CrossRef]
  81. Almeida, P.A.; Fidalgo, T.K.S.; Freitas-Fernandes, L.B.; Almeida, F.C.L.; Souza, I.P.R.; Valente, A.P. Salivary metabolic profile of children and adolescents after hemodialysis. Metabolomics 2017, 13, 141. [Google Scholar] [CrossRef]
  82. Ishikawa, S.; Sugimoto, M.; Edamatsu, K.; Sugano, A.; Kitabatake, K.; Iino, M. Discrimination of oral squamous cell carcinoma from oral lichen planus by salivary metabolomics. Oral Dis. 2020, 26, 35–42. [Google Scholar] [CrossRef]
  83. Jo, J.; Seo, S.-H.; Park, S.-E.; Kim, H.-W.; Kim, E.-J.; Na, C.-S.; Cho, K.-M.; Kwon, S.-J.; Moon, Y.-H.; Son, H.-S. Identification of Salivary Microorganisms and Metabolites Associated with Halitosis. Metabolites 2021, 11, 362. [Google Scholar] [CrossRef] [PubMed]
  84. Ishikawa, S.; Sugimoto, M.; Kitabatake, K.; Tu, M.; Sugano, A.; Yamamori, I.; Iba, A.; Yusa, K.; Kaneko, M.; Ota, S.; et al. Effect of timing of collection of salivary metabolomic biomarkers on oral cancer detection. Amino Acids 2017, 49, 761–770. [Google Scholar] [CrossRef] [PubMed]
  85. Fidalgo, T.K.S.; Freitas-Fernandes, L.B.; Almeida, F.C.L.; Valente, A.P.; Souza, I.P.R. Longitudinal evaluation of salivary profile from children with dental caries before and after treatment. Metabolomics 2015, 11, 583–593. [Google Scholar] [CrossRef]
  86. Gardner, A.; So, P.W.; Carpenter, G. Endogenous salivary citrate is associated with enhanced rheological properties following oral capsaicin stimulation. Exp. Physiol. 2020, 105, 96–107. [Google Scholar] [CrossRef] [PubMed] [Green Version]
  87. Takeda, I.; Stretch, C.; Barnaby, P.; Bhatnager, K.; Rankin, K.; Fu, H.; Weljie, A.; Jha, N.; Slupsky, C. Understanding the human salivary metabolome. NMR Biomed. 2009, 22, 577–584. [Google Scholar] [CrossRef]
  88. Lalue Sanches, M.; Sforça, M.L.; Guimarães Lo Turco, E.; Faber, J.; Smith, R.L.; de Moraes, L.O.C. 1H-NMR-Based salivary metabolomics from females with temporomandibular disorders—A pilot study. Clin. Chim. Acta 2020, 510, 625–632. [Google Scholar] [CrossRef]
  89. Kumari, S.; Goyal, V.; Kumaran, S.S.; Dwivedi, S.N.; Srivastava, A.; Jagannathan, N.R. Quantitative metabolomics of saliva using proton NMR spectroscopy in patients with Parkinson’s disease and healthy controls. Neurol. Sci. 2020, 41, 1201–1210. [Google Scholar] [CrossRef]
  90. Wijnant, K.; Van Meulebroek, L.; Pomian, B.; De Windt, K.; De Henauw, S.; Michels, N.; Vanhaecke, L. Validated ultra-high-performance liquid chromatography hybrid high-resolution mass spectrometry and laser-assisted rapid evaporative ionization mass spectrometry for salivary metabolomics. Anal. Chem. 2020, 92, 5116–5124. [Google Scholar] [CrossRef] [Green Version]
  91. Prodan, A.; Imangaliyev, S.; Brand, H.S.; Rosema, M.N.A.; Levin, E.; Crielaard, W.; Keijser, B.J.F.; Veerman, E.C.I. Effect of experimental gingivitis induction and erythritol on the salivary metabolome and functional biochemistry of systemically healthy young adults. Metabolomics 2016, 12, 147. [Google Scholar] [CrossRef]
  92. Herrala, M.; Mikkonen, J.J.W.; Pesonen, P.; Lappalainen, R.; Tjäderhane, L.; Niemelä, R.K.; Seitsalo, H.; Salo, T.; Myllymaa, S.; Kullaa, A.M. Variability of salivary metabolite levels in patients with Sjögren’s syndrome. J. Oral Sci. 2021, 63, 22–26. [Google Scholar] [CrossRef]
  93. Santone, C.; Dinallod, V.; Paci, M.; D’Ottavio, S.; Barbato, G.; Bernardini, S. Saliva metabolomics by NMR for the evaluation of sport performance. J. Pharm. Biomed. Anal. 2014, 88, 441–446. [Google Scholar] [CrossRef]
  94. Mikkonen, J.J.W.; Singh, S.P.; Akhi, R.; Salo, T.; Lappalainen, R.; González-Arriagada, W.A.; Lopes, M.A.; Kullaa, A.M.; Myllymaa, S. Potential role of nuclear magnetic resonance spectroscopy to identify salivary metabolite alterations in patients with head and neck cancer. Oncol. Lett. 2018, 16, 6795–6800. [Google Scholar] [CrossRef] [Green Version]
  95. Ishikawa, S.; Hiraka, T.; Kirii, K.; Sugimoto, M.; Shimamoto, H.; Sugano, A.; Kitabatake, K.; Toyoguchi, Y.; Kanoto, M.; Nemoto, K.; et al. Relationship between standard uptake values of positron emission tomography/computed tomography and salivary metabolites in oral cancer: A pilot study. J. Clin. Med. 2020, 9, 3958. [Google Scholar] [CrossRef]
  96. Troisi, J.; Belmonte, F.; Bisogno, A.; Pierri, L.; Colucci, A.; Scala, G.; Cavallo, P.; Mandato, C.; Nuzzi, A.D.; Michele, L.D.; et al. Metabolomic salivary signature of pediatric obesity related liver disease and metabolic syndrome. Nutrients 2019, 11, 274. [Google Scholar] [CrossRef] [Green Version]
  97. Bardow, A.; Moe, D.; Nyvad, B.; Nauntofte, B. The buffer capacity and buffer systems of human whole saliva measured without loss of CO2. Arch. Oral Biol. 2000, 45, 1–12. [Google Scholar] [CrossRef] [PubMed]
  98. Belardinelli, P.A.; Morelatto, R.A.; Benavidez, T.E.; Baruzzi, A.M.; Lopez de Blanc, S.A. Effect of two mouthwashes on salivary pH. Acta Odontológica Latinoam. 2014, 27, 66–71. [Google Scholar]
  99. Zappacosta, B.; Manni, A.; Persichilli, S.; Boari, A.; Scribano, D.; Minucci, A.; Raffaelli, L.; Giardina, B.; De Sole, P. Salivary thiols and enzyme markers of cell damage in periodontal disease. Clin. Biochem. 2007, 40, 661–665. [Google Scholar] [CrossRef]
  100. Perera, A.; Parkes, H.; Herz, H.; Haycock, R.; Blake, D.R.; Grootveld, M.C. High resolution 1H NMR investigations of the reactivities of a-keto acid anions with hydrogen peroxide. Free. Radic. Res. 1997, 26, 145–157. [Google Scholar] [CrossRef]
  101. Grootveld, M.; Herz, H.; Haywood, R.; Hawkes, G.E.; Naughton, D.; Perera, A.; Knappitt, J.; Blake, D.R.; Claxson, A.W.D. Multicomponent analysis of radiolytic products in human body fluids using high field proton nuclear magnetic resonance (NMR) spectroscopy. Radiat. Phys. Chem. 1993, 43, 445–453. [Google Scholar] [CrossRef]
  102. Chao, C.K.; Zeisel, S.H. Formation of trimethylamine from dietary choline by Streptococcus sanguis I, which colonizes the mouth. J. Nutr. Biochem. 1990, 1, 89–97. [Google Scholar] [CrossRef]
  103. Park, Y.D.; Jang, J.H.; Oh, Y.J.; Kwon, H.J. Analyses of organic acids and inorganic anions and their relationship in human saliva before and after glucose intake. Arch. Oral Biol. 2014, 59, 1–11. [Google Scholar] [CrossRef]
  104. Disler, W.; Kröncke, A. The lactate metabolism of the oral bacterium Veillonella from human saliva. Arch. Oral Biol. 1981, 26, 657–661. [Google Scholar] [CrossRef]
  105. Barnes, V.M.; Teles, R.; Trivedi, H.M.; Devizio, W.; Xu, T.; Mitchell, M.W.; Milburn, M.V.; Guo, L. Acceleration of purine degradation by periodontal diseases. J. Dent. Res. 2009, 88, 851–855. [Google Scholar] [CrossRef] [PubMed]
  106. Lichstein, H.C.; Soule, M.H. Studies of the effect of sodium azide on microbic growth and respiration: I. The action of sodium azide on microbic growth. J. Bacteriol. 1944, 47, 221–230. [Google Scholar] [CrossRef] [PubMed] [Green Version]
  107. Fei, M.J.; Yamashita, E.; Inoue, N.; Yao, M.; Yamaguchi, H.; Tsukihara, T.; Shinzawa-Itoh, K.; Nakashima, R.; Yoshikawa, S. X-ray structure of azide-bound fully oxidized cytochrome c oxidase from bovine heart at 2.9 Å resolution. Acta Crystallogr. D 2000, 56, 529–535. [Google Scholar] [CrossRef] [PubMed] [Green Version]
  108. Yoshikawa, S.; Shinzawa-Itoh, K.; Nakashima, R.; Yaono, R.; Yamashita, E.; Inoue, N.; Yao, M.; Fei, M.J.; Libeu, C.P.; Mizushima, T.; et al. Redox-coupled crystal structural changes in bovine heart cytochrome c oxidase. Science 1998, 280, 1723–1729. [Google Scholar] [CrossRef] [Green Version]
  109. Hyndman, D.J.; Milgrom, Y.M.; Bramhall, E.A.; Cross, R.L. Nucleotide-binding sites on Escherichia coli F1-ATPase. Specificity of noncatalytic sites and inhibition at catalytic sites by MgADP. J. Biol. Chem. 1994, 269, 28871–28877. [Google Scholar] [CrossRef]
  110. Marquis, R.E. Antimicrobial actions of fluoride for oral bacteria. Can. J. Microbiol. 1995, 41, 955–964. [Google Scholar] [CrossRef]
  111. Radić, N.; Komljenović, J. Kinetic-potentiometric determination of Fe(III) using a fluoride ion-selective electrode. Croatica Chemica Acta 1991, 64, 679–687. [Google Scholar]
  112. Kleinhofs, A.; Owais, W.M.; Nilan, R.A. Azide. Mutat. Res./Rev. Genetic Toxicol. 1978, 55, 165–195. [Google Scholar] [CrossRef]
  113. Esser, D.; Alvarez-Llamas, G.; De Vries, M.P.; Weening, D.; Vonk, R.J.; Roelofsen, H. Sample Stability and Protein Composition of Saliva: Implications for Its Use as a Diagnostic Fluid. Biomark. Insights 2008, 3, 25–37. [Google Scholar] [CrossRef]
  114. Fluoride Vol. 28 No. 2 71-74 1995 Research Report 71 Effect of Fluoride on Human Salivary Amylase Activity; Haraa, K.; Yu, M.H. (Eds.) Bellingham: Washington, DC, USA, 1995. [Google Scholar]
  115. Yu, M.; Sumway, M.; Brockbank, A. Effects of NaF on amylase in mung bean seedlings. J. Fluorine Chem. 1988, 41, 95–100. [Google Scholar] [CrossRef]
  116. Mautner, F.A.; Krischner, H. Preparation and structure determination of tetraethylammonium calcium azide, [N(C2H5)4]Ca(N3)3. Z. Krist.-Cryst. Mater. 1986, 175, 105–110. [Google Scholar] [CrossRef]
  117. Hoult, D. Solvent peak saturation with single phase and quadrature Fourier transformation. J. Magn. Reson. 1976, 21, 337. [Google Scholar] [CrossRef]
  118. McKay, R.T. How the 1D-NOESY suppresses solvent signal in metabolomics NMR spectroscopy: An examination on the pulse sequence components and evolution. Concepts Magn. Reson. 2011, 38A, 197–220. [Google Scholar] [CrossRef]
  119. Bell, J.D.; Sadler, P.J.; Macleod, A.F.; Turner, P.R.; La Ville, A. 1H NMR studies of human blood plasma. Assignment of resonances for lipoproteins. FEBS Lett. 1987, 219, 239–243. [Google Scholar] [CrossRef] [Green Version]
  120. Tang, H.; Wang, Y.; Nicholson, J.K.; Lindon, J.C. Use of relaxation edited one-dimensional and two-dimensional nuclear magnetic resonance spectroscopy to improve detection of small metabolites in blood plasma. Anal. Biochem. 2004, 325, 260–272. [Google Scholar] [CrossRef]
  121. Grootveld, M.; Claxson, A.W.D.; Chander, C.L.; Haycock, P.; Blake, D.R.; Hawkes, G.E. High resolution proton NMR investigations of rat blood plasma. Assisgnment of resonances for the molecularly mobile carbohydrate side-chains of ‘acute-phase’ glycoproteins. FEBS Lett. 1993, 322, 266–276. [Google Scholar] [CrossRef] [Green Version]
  122. Aiello, F.; Gerretzen, J.; Simons, M.G.; Davies, A.N.; Dani, P. A multivariate approach to investigate the NMR CPMG pulse sequence for analysing low MW species in polymers. Magn. Reson. Chem. 2021, 59, 172–186. [Google Scholar] [CrossRef]
  123. Meiboom, S.; Gill, D. Modified spin echo method for measuring nuclear relaxation times. Rev. Sci. Instrum. 1958, 29, 688. [Google Scholar] [CrossRef] [Green Version]
  124. Bell, J.D.; Brown, J.C.C.; Kubal, G.; Sadler, P.J. NMR-invisible lactate in blood plasma. FEBS Lett. 1988, 235, 81–86. [Google Scholar] [CrossRef] [Green Version]
  125. Carr, Y.; Purcell, E.M. Effects of diffusion on free precession in nuclear magnetic resonance experiments. Phys. Rev. 1954, 94, 630. [Google Scholar] [CrossRef]
  126. Hahn, E.L. Spin echoes. Phys. Rev. 1950, 80, 580. [Google Scholar] [CrossRef]
  127. Aguilar, J.A.; Cassani, J.; Probert, F.; Palace, J.; Claridge, T.D.W.; Botana, A.; Kenwright, A.M. Reliable, high-quality suppression of NMR signals arising from water and macromolecules: Application to bio-fluid analysis. Analyst 2019, 144, 7270. [Google Scholar] [CrossRef]
  128. Martineau, E.; Giraudeau, P. Fast quantitative 2D NMR for untargeted and targeted metabolomics. Methods Mol. Biol. 2019, 2037, 365–383. [Google Scholar] [CrossRef]
  129. Martineau, E.; Dumez, J.N.; Giraudeau, P. Fast quantitative 2D NMR for metabolomics and lipidomics: A tutorial. Magn. Reson. Chem. 2020, 58, 390–403. [Google Scholar] [CrossRef]
  130. Jenzano, J.W.; Hogan, S.L.; Noyes, C.M.; Featherstone, G.L.; Lundblad, R.L. Comparison of five techniques for the determination of protein content in mixed human saliva. Anal. Biochem. 1986, 159, 370–376. [Google Scholar] [CrossRef]
  131. Lindon, J.C.; Nicholson, J.K.; Everett, J.R. NMR spectroscopy of biofluids. Ann. Rep. NMR Spec. 1999, 38, 1–88. [Google Scholar]
  132. Available online: https://r.search.yahoo.com/_ylt=AwrIS.g0h.Bh0tgAQRV3Bwx.;_ylu=Y29sbwMEcG9zAzEEdnRpZAMEc2VjA3Ny/RV=2/RE=1642133429/RO=10/RU=https%3a%2f%2fscrippslabs.com%2fprotein-levels-in-human-plasma%2f/RK=2/RS=mwRICqA1HOncIk9beChKyDbv7X8- (accessed on 31 December 2021).
  133. De Meyer, T.; Sinnaeve, D.; Van Gasse, B.; Tsiporkova, E.; Rietzschel, E.R.; De Buyzere, M.L.; Gillebert, T.C.; Bekaert, S.; Martins, J.C.; Van Criekinge, W. NMR-based characterization of metabolic alterations in hypertension using an adaptive, intelligent binning algorithm. Anal. Chem. 2008, 80, 3783–3790. [Google Scholar] [CrossRef]
  134. Sysi-Aho, M.; Katajamaa, M.; Yetukuri, L.; Oresic, M. IDconverter and IDClight: Conversion and annotation of gene and protein IDs. BMC Bioinform. 2007, 8, 93. [Google Scholar] [CrossRef] [Green Version]
  135. Grootveld, M. Metabolic Profiling: Disease and Xenobiotics; Royal Society of Chemistry: Cambridge, UK, 2014; 395p, ISBN 1849731632. [Google Scholar]
  136. Percival, B.C.; Gibson, M.; Wilson, P.B.; Platt, F.M.; Grootveld, M. Metabolomic Studies of Lipid Storage Disorders, with Special Reference to Niemann-Pick Type C Disease: A Critical Review with Future Perspectives. Int. J. Mol. Sci. 2020, 21, 2533. [Google Scholar] [CrossRef] [Green Version]
  137. Pena-Reyes, C.A.; Sipper, M. Evolutionary computation in medicine: An overview. Artific. Intell. Med. 2000, 19, 1–23. [Google Scholar] [CrossRef]
  138. Xia, J.; Sinelnikov, I.V.; Han, B.; Wishart, D.S. MetaboAnalyst 3.0—Making metabolomics more meaningful. Nucleic Acids Res. 2015, 43, W251–W257. [Google Scholar] [CrossRef] [PubMed] [Green Version]
  139. Billoir, E.; Navratil, V.; Blaise, B.J. Sample size calculation in metabolic phenotyping studies. Brief. Bioinform. 2014, 16, 813–819. [Google Scholar] [CrossRef] [PubMed]
  140. Nyamundanda, G.; Gormley, I.C.; Fan, Y.; Gallagher, W.M.; Brennan, L. MetSizeR: Selecting the optimal sample size for metabolomic studies using an analysis based approach. BMC Bioinform. 2013, 14, 338. [Google Scholar] [CrossRef] [PubMed] [Green Version]
  141. van Iterson, M.; ’t Hoen, P.A.C.; Pedotti, P.; Hooiveld, G.J.; den Dunnen, J.T.; van Ommen, G.J.; Boer, J.M.; Menezes, R.X. Relative power and sample size analysis on gene expression profiling data. BMC Genomics. 2009, 10, 439. [Google Scholar] [CrossRef] [Green Version]
  142. Available online: http://bioconductor.org/biocLite.R (accessed on 31 December 2021).
  143. Miller, B.F.; Muntz, J.A.; Bradel, S. Decomposition of carbohydrate substrates by dental plaque material. J. Dent. Res. 1940, 19, 473–478. [Google Scholar] [CrossRef]
  144. Takahashi, N.; Washio, J.; Mayanagi, G. Metabolomics of supragingival plaque and oral bacteria. J. Dent. Res. 2010, 89, 1383–1388. [Google Scholar] [CrossRef]
  145. Takahashi, N.; Washio, J. Metabolomic effects of xylitol and fluoride on plaque biofilm in vivo. J. Dent. Res. 2011, 90, 1463–1468. [Google Scholar] [CrossRef] [Green Version]
  146. Sugimoto, M.; Saruta, J.; Matsuki, C.; To, M.; Onuma, H.; Kaneko, M.; Soga, T.; Tomita, M.; Tsukinoki, K. Physiological and environmental parameters associated with mass spectrometry-based salivary metabolomic profiles. Metabolomics 2013, 9, 454–463. [Google Scholar] [CrossRef]
  147. Humphrey, S.P.; Williamson, R.T. A review of saliva: Normal composition, flow, and function. J. Prosth. Dent. 2001, 85, 162–169. [Google Scholar] [CrossRef]
  148. Kopstein, J.; Wrong, O.M. The origin and fate of salivary urea and ammonia in man. Clin. Sci. Mol. Med. 1977, 52, 9–17. [Google Scholar] [CrossRef] [Green Version]
  149. Lemos, J.A.; Abranches, J.; Burne, R.A. Responses of cariogenic streptococci to environmental stresses. Curr. Issues Molec. Biol. 2005, 7, 95–107. [Google Scholar]
  150. Loesche, W.J. Role of Streptococcus mutans in human dental decay. Microbiol. Rev. 1986, 50, 353–380. [Google Scholar] [CrossRef]
  151. Burne, R.A.; Marquis, R.E. Alkali production by oral bacteria and protection against dental caries. FEMS Microbiol. Lett. 2000, 193, 1–6. [Google Scholar] [CrossRef]
  152. Griswold, A.R.; Jameson-Lee, M.; Burne, R.A. Regulation and physiologic significance of the agmatine deiminase system of Streptococcus mutans UA159. J. Bacteriol. 2006, 188, 834–841. [Google Scholar] [CrossRef] [Green Version]
  153. Reyes, E.; Martin, J.; Moncada, G.; Neira, M.; Palma, P.; Gordan, V.; Oyarzo, J.F.; Yevenes, I. Caries-free subjects have high levels of urease and arginine deiminase activity. J. Appl. Oral Sci. 2014, 22, 235–240. [Google Scholar] [CrossRef]
  154. Zarling, E.J.; Ruchim, M.A. Protein origin of the volatile fatty acids isobutyrate and isovalerate in human stool. J. Lab. Clin. Med. 1987, 109, 566–570. [Google Scholar]
  155. Arnstein, H. The effect of vitamin B12 on the metabolism of formate and certain formate precursors by the rat. Biochem. J. 1960, 74, 616–623. [Google Scholar] [CrossRef] [Green Version]
  156. Pietzke, M.; Meiser, J.; Vazquez, A. Formate metabolism in health and disease. Molec. Metab. 2020, 33, 23–37. [Google Scholar] [CrossRef]
  157. Ripps, H.; Shen, W. Review: Taurine: A “very essential” amino acid. Mol. Vis. 2012, 18, 2673–2686. [Google Scholar]
  158. Schuller-Levis, G.B.; Park, E. Taurine: New implications for an old amino acid. FEMS Microbiol. Lett. 2003, 226, 195–202. [Google Scholar] [CrossRef]
  159. Percival, B.C.; Grootveld, M.; Gibson, M.; Osman, Y.; Molinari, M.; Jafari, F.; Sahota, T.; Martin, M.; Casanova, F.; Mather, M.L.; et al. Low-field, benchtop NMR spectroscopy as a potential tool for point-of-care diagnostics of metabolic conditions: Validation, protocols and computational models. High-Throughput 2019, 8, 2. [Google Scholar] [CrossRef] [Green Version]
  160. Elipe, M.V.S.; Milburn, R.R. Monitoring chemical reactions by low-field benchtop NMR at 45 MHz: Pros and cons. Magn. Reson. Chem. 2016, 4, 437–443. [Google Scholar] [CrossRef]
  161. Edgar, M.; Percival, B.C.; Gibson, M.; Masania, J.; Beresford, K.; Wilson, P.B.; Grootveld, M. Benchtop NMR spectroscopy and spectral analysis of the cis- and trans-stilbene products of the Wittig reaction. J. Chem. Educ. 2019, 96, 1938–1947. [Google Scholar] [CrossRef]
  162. Isaac-Lam, M.F. Analysis of bromination of ethylbenzene using a 45 MHz NMR spectrometer: An undergraduate organic chemistry laboratory experiment. J. Chem. Educ. 2014, 91, 1264–1266. [Google Scholar] [CrossRef]
  163. Hoppenbrouwers, P.M.; Driessens, F.C. The effect of lactic and acetic acid on the formation of artificial caries lesions. J. Dent. Res. 1988, 67, 1466–1467. [Google Scholar] [CrossRef]
  164. Niederman, R.; Zhang, J.; Kashket, S. Short-chain carboxylic-acid-stimulated, PMN-mediated gingival inflammation. Crit. Rev. Oral Biol Med. 1997, 8, 269–290. [Google Scholar] [CrossRef]
  165. Niederman, R.; Buyle-Bodin, Y.; Lu, B.Y.; Naleway, C.; Robinson, P.; Kent, R. The relationship of gingival crevicular fluid short chain carboxylic acid concentration to gingival inflammation. J. Clin. Periodontol. 1996, 23, 743–749. [Google Scholar] [CrossRef]
  166. Bose, S.; Ramesh, V.; Locasale, J.W. Acetate metabolism in physiology, cancer, and beyond. Trends Cell Biol. 2019, 29, 695–703.167. [Google Scholar] [CrossRef]
  167. Tam, Y.C.; Chan, E.C. Purification and characterization of hyaluronidase from oral Peptostreptococcus species. Infect. Immun. 1985, 47, 508–513. [Google Scholar] [CrossRef] [Green Version]
  168. Last, K.S.; Embery, G. Hyaluronic acid and hyaluronidase activity in gingival exudate from sites of acute ulcerative gingivitis in man. Arch. Oral Biol. 1987, 32, 811–815. [Google Scholar] [CrossRef]
  169. Mitchell, S. Trimethylaminuria (fish-odour syndrome) and oral malodour. Oral Dis. 2005, 11 (Suppl. 1), 10–13. [Google Scholar] [CrossRef] [PubMed]
  170. Li, X.J.; Dong, L.L.; Kong, J.J. Impact of volatile sulphur compounds in periodontal pockets on initial periodontal therapy. Zhejiang Da Xue Xue Bao Yi Xue Ban. 2008, 37, 418–421. (In Chinese) [Google Scholar] [PubMed]
  171. Mercier, P.; Lewis, M.J.; Chang, D.; Baker, D.; Wishart, D.S. Towards automatic metabolomic profiling of high-resolution one-dimensional proton NMR spectra. J. Biomol. NMR. 2011, 49, 307–323. [Google Scholar] [CrossRef] [PubMed]
  172. Hao, J.; Astle, W.; De Iorio, M.; Ebbels, T.M.D. BATMAN-an R package for the automated quantification of metabolites from nuclear magnetic resonance spectra using a Bayesian model. Bioinformatics 2012, 28, 2088–2090. [Google Scholar] [CrossRef] [PubMed] [Green Version]
Figure 1. Partial 1H NMR profiles of a WMS supernatant sample collected from a healthy human participant, stored and prepared for analysis according to our protocols described in Section 6. (a) and (b,c) show the 0.80–2.50, 2.55–4.20, and 5.30–8.60 ppm regions of spectra acquired. (d) 5.30–8.60 ppm region of the spectral profile acquired on a WMS supernatant collected from a second healthy participant. Abbreviations: Assignment codes correspond to those listed in Table 1. Tentative assignments only are also indicated in Table 1. Single-pulse 1H NMR spectra were recorded on a Bruker Avance 600 spectrometer operating at frequency of 600.13 MHz, with a probe operating temperature of 20 °C. Spectra were acquired with suppression of the large H2O/HOD resonance (δ = 4.80 ppm) using radiofrequency pulse presaturation. Pulsing conditions were sweep width 8389 Hz; 5 µs pulses; 1.0 s pulse repetition rate; 32,768 (subsequently zero-filled to 65,536) datapoints; 128 transients. An exponential line-broadening function of 0.30 Hz was applied to FIDs before Fourier transformation. Typical spectra are shown.
Applsci 12 01235 g001aApplsci 12 01235 g001bApplsci 12 01235 g001c
Figure 2. (ad), Partial 1.00–2.00, 2.00–3.50, 4.90–5.65, and 6.56–9.00 ppm regions of the 600 MHz WASTED 1H NMR profiles, respectively, of WMS supernatant samples collected from a healthy human participant immediately before (0.00 h) and at 0.50, 1.00, 2.00, and 4.00 h following the consumption of a ‘real-life’ single vegetarian sandwich meal. Resonance code assignments correspond to those listed in Table 1, although α-Fuc, α-Glc, and Sucr represent α-fucose, α-glucose, and sucrose, respectively. The blue arrows in the post-eating 240 min spectrum shown in (d) indicate the evolution of broad resonances assignable to biomacromolecules, potentially aromatic amino acid residues present in salivary proteins. 1H NMR spectra were recorded on a Jeol JNM-ECZ600R/S1 600 MHz spectrometer operating at frequency of 600.17 MHz, with a probe operating temperature of 25 °C. Spectra were acquired with suppression of the very intense H2O/HOD resonance (δ = 4.80 ppm) by use of the WASTED pulse sequence. Pulsing conditions were sweep width 11,218 Hz; 57.5 µs pulses; 1.45 s pulse repetition rate; 16,384 datapoints; and 128 transients.
Applsci 12 01235 g002aApplsci 12 01235 g002b
Figure 3. Schematic representation of the Carr–Purcell–Meiboom–Gill (CPMG) pulse sequence (reproduced from [122] with permission). Abbreviations: τE, echo time interval between the 90° and adjacent 180° pulses (the time interval between the 180° and adjacent 180° pulses is 2τE); n, number of cycles; Acq, acquisition.
Applsci 12 01235 g003
Figure 4. (ac), Expanded 1.30–1.50 ppm regions of the 600 MHz metnoesy 1D 1H NMR spectra of WMS supernatant samples collected from n = 3 of the participants recruited to this case study. Samples were prepared and 1NMR spectra acquired according to the method described in [3]. (d) Plots of mean ±95% confidence interval (CI) values for the resonance line-widths at half-height (Δv1/2) for the lactate (red) and alanine (dark blue) resonances present in the 1H NMR spectra of WMS supernatant samples donated by n = 7 participants.
Applsci 12 01235 g004aApplsci 12 01235 g004b
Figure 5. Molecular structures of valine, isoleucine, and 5-aminovalerate. For the purpose of TOCSY spectral interpretations, C1-Cn labels for each structure are arbitrary, although for this diagram they should be read from left-to-right. For valine, the 2 x γ-CH3, β-CH, and α-CH protons represent the C1A and C1B, C2 and C3 ones, respectively; for isoleucine, the δ-CH3, γ-CH2, β-CH, β-CH(CH3), and α-CH protons represent the C1, C2, C3, C4A, and C4B ones, respectively; and for 5-aminovalerate, the α-, β-, γ-, and δ-CH2 groups represent the C1, C2, C3, and C4 ones, respectively. 2D 1H-1H COSY spectra reveal connectivities between a specified nucleus and its nearest neighboring ones only, for example between adjacent C1 and C2 nuclei, between C2 and C1 plus C3 nuclei in 5-aminovalerate. However, 2D 1H-1H TOCSY spectra shown coupled nuclei linkages between up to 5 or more 1H nuclei within a molecular chain, and therefore for 5-aminovalerate correlations between all these nuclei are clearly visible, as shown in Figure 6 below.
Applsci 12 01235 g005
Figure 6. (a,b) Partial 600 MHz 1H-1H TOCSY NMR spectra of WMS supernatant samples. Typical spectra are shown. The spectrum shown in (a) is adapted and updated from that available in [3] with permission. This spectrum was acquired on a Bruker AMX-600 spectrometer, and acquisition parameters for it are also provided in [3]. Connected resonance assignments: 1, fatty acids (terminal-CH3 spin system); 2, leucine; 3, fatty acids (bulk acyl chain spin system, including α-CH2 resonance); 4, lysine; 5, 2-hydroxyglutarate; 6, γ-aminobutyrate; 7, ornithine; 8, 5-aminovalerate; 9, isoleucine; 10, propionate; 11, valine; 12, glutamate; 13, glutamine; 14, proline; 15, 2-aminoadipate*; 16, propane-1,2-diol; 17, 4-hydroxybutyrate; 18, threonine; 19, ethanolamine; 20, phosphorylethanolamine; 21, tyrosine; 22, phenylalanine; 23, aspartate; 24, alanine; 25, ethanol; 26, lactate; 27, fucose; 28, 3-D-hydroxybutyrate; 29, malate; 30, unassigned; 31, ethanolamine; 32, taurine; 33, putrescine; 34, acetoin. *Tentative assignment. The 1H-1H TOCSY profile shown in (b) was acquired on a Jeol JNM-ECZ600R/S1 600 MHz spectrometer operating at frequency of 600.17 MHz, a probe temperature of 25 °C (the Watergate_W5_Robust pulse sequence was employed for its acquisition). Acquisition parameters were: 11,254 data points per increment; spectral width 11,281 Hz in x, and 6002 Hz in y dimensions; 32 transients in each case; 16 dummy scans; relaxation delay (RD) 2 s; and x and y acquisition times of 1.0 s and 50 ms, respectively. The mixing time was set at 70 ms. Hence, the acquisition of such 2D spectra has been found to readily facilitate the assignments of resonances ascribable to free amino acids, for example those of alanine, glutamate, glutamine, isoleucine, leucine, valine, lysine, ornithine, proline, and phenylalanine. Additional biomolecule signals verifiable in such TOCSY spectra have included those arising from γ-amino-n-butyrate and propane-1,2-diol, the latter being an agent found in many oral healthcare products, which is also present in cigarette smoke [58]. 1H-13C correlations for adjacent aliphatic 1H nuclei in fatty acid chains, i.e., CH3(CH2)nCH2CH2CO- for saturated classes, were also found [3].
Applsci 12 01235 g006aApplsci 12 01235 g006b
Figure 7. Box and kernel density plots shown for the 50 most important 1H NMR ISB intensity discriminatory variables before and after row-wise normalization, transformation, and column-wise scaling for the acute sore-throat study dataset. (a) With CSN only; (b) as (a), but also with glog-transformation applied; (c) as (b), but with Pareto-scaling applied. Prior to statistical analysis, all ISB intensities were normalized to TSP added as an internal standard to WMS supernatant samples analyzed at a final concentration of 238 µmol./L.
Applsci 12 01235 g007aApplsci 12 01235 g007bApplsci 12 01235 g007c
Figure 8. Plots of observed metabolite concentrations vs. that predicted from the ANOVA-based experimental design model shown in Equation (3) for (a) n-butyrate, (b) propionate, and (c) urea. Biomolecule concentrations were glog-transformed and Pareto-scaled prior to statistical analysis.
Applsci 12 01235 g008aApplsci 12 01235 g008b
Figure 9. (a) Orthogonal T score [1] vs. T score [1] plot for an OPLS-DA model applied to n = 6 randomly selected WMS sample donors only, showing some reproducible phenotypic distinctions between at least some of the study participants (coded as participants 4, 7, 14, 28, 29, and 36). A corresponding PLS-DA model yielded a Q2 value of 0.44 for a consideration of three orthogonal components, and a permutation test featuring 2000 permutations gave a highly significant p value of 0.007. (b) PC3 vs. PC2 vs. PC1 scores plot for a PLS-DA model applied to all sample participants (n = 48), again showing some discrimination between the WMS samples of donors (different colorations correspond to different study participants). Although the maximal Q2 value obtained was only 0.15 for a six-component model (which unfortunately is also extremely restricted by the very large number of participant classifications used for distinction purposes, i.e., 48), a permutation test involving 2000 permutations gave rise to a very highly significant p value of <5 × 10⁻⁴.
Applsci 12 01235 g009aApplsci 12 01235 g009b
Figure 10. Two-dimensional correlation heatmap of the 31 1H NMR-assigned metabolites employed for factor analysis of orthogonal salivary metabolite pools in a cohort of 48 healthy control participants (five daily saliva samples were collected from each subject). The top and left-hand side ordinate axes show the application of a correlation-based agglomerative hierarchical clustering analysis of the full dataset. Abbreviations: His, Histidine; Form, Formate; Val, Valine; MA, DMA and TMA, Methyl-, Dimethyl- and Trimethylamine respectively; iso-But, iso-Butyrate; MeOH, methanol; N-Ac-1, -2 and -3, N-Acetyl storage compound resonances located at δ = 2.025/2.030, 2.040 and 2.053/2.058 ppm respectively (Table 1); Glu, Glutamate; Gln, Glutamine; Suc, Succinate; Pyr, Pyruvate; Chol, Choline; Gly, glycine; Lac, Lactate; Tau, Taurine; Phe, Phenylalanine; Tyr, Tyrosine; Ace, Acetoin; Thy, Thymine; 5-AV, 5-Aminovalerate; 3-D-HB, 3-D-Hydroxybutyrate; Ala, Alanine; Prop, Propionate; A, Acetate; n-Cap, n-Caproate; n-But, n-Butyrate.
Applsci 12 01235 g010
Figure 11. Agglomerative hierarchical clustering (AHC) analysis of metabolite variables of a large healthy control WMS supernatant dataset showing the clear distinction of these into four separate clusters from the dissimilarity threshold index (dotted horizontal line), which are colored blue, black, green, and violet. The two larger green and violet clusters are further split into two sub-clusters, and one for the latter contains all bacterial-derived malodorous methylamine species with the amino acid valine (far right-hand side), whilst the other contains all oral microbiome-derived organic acid anions, specifically n-caproate, n-butyrate, iso-butyrate, propionate, 5-aminovalerate, and acetate, plus acetoin and the amino acids alanine, phenylalanine, and tyrosine. TSP-normalized metabolite levels were glog-transformed and Pareto-scaled prior to AHC analysis, which was conducted using Ward’s agglomeration method and Euclidean distance as a dissimilarity measure. Abbreviations: As Figure 10.
Applsci 12 01235 g011
Figure 12. High-field (0.80–2.45 ppm) regions of the 600 MHz 1H NMR spectra of WMS supernatant samples donated by participants that have (a) oral microbiome (PC2)-, (b) admixed host and oral microbiome (PC1/PC2)-, and (c) host (PC1)-dominant metabolite profiles. Resonances of metabolites loading strongly on PCs 1 and 2 are color-coded blue and red, respectively (e.g., lactate, N-acetyl storage compound and glutamate for PC1; and n-caproate, n-butyrate, propionate, acetate, 5-aminovalerate, alanine, etc., for PC2). Resonances of biomolecules that load significantly on both PCs 1 and 2, for example acetoin, pyruvate, and succinate, are color-coded green. Assignments: 1, n-caproate-CH3; 3, n-butyrate-CH3; 7, valine-CH3; 8, valine-CH3/isoleucine-CH3; 10, leucine-CH3; 11, propionate-CH3; 12, iso-butyrate-CH3; 15, Ethanol-CH3; 17, 3-D-hydroxybutyrate-CH3/β-Fucose-CH3; 18, lactate-CH3; 19, acetoin-CH3; 20, alanine-CH3; 21, n-butyrate-β-CH2; 22, 5-aminovalerate-β,γ-CH2′s; 27, senicioate-CH3; 28, *glutarate-β-CH2; 29, thymine-CH3; 30, acetate-CH3; 32, proline-γ-CH2/N-acetylneuraminate-C3H; 33, hyaluronate/glycoprotein carbohydrate side-chain N-acetylsugar-NHCOCH3 functions; 34, N-acetylglutamate-/N-acetylaspartate--NHCOCH3 (2 resonances); 35, N-acetylglucosamine-/N-acetylneuraminate--NHCOCH3; 36, *unassigned N-acetylated metabolite-NHCOCH3 (2 resonances); 39, n-butyrate-α-CH2; 40, propioniate-CH2; 42, 5-aminovalerate-α-CH2; 43, glutamate-γ-CH2; 44, pyruvate-CH3; 46, succinate-CH2 *Indicates tentative assignment.
Applsci 12 01235 g012aApplsci 12 01235 g012b
Figure 13. (a,b) Experimental and predictively simulated 60 MHz 1H NMR profiles of a healthy human WMS supernatant sample; the predicted spectrum in (b) was computed from metabolite concentrations determined at an operating frequency of 400 MHz. Concentrations of salivary biomolecules featured were propionate (-CH3 resonance 11, 3.25 mmol./L); acetate (-CH3 resonance 30, 19.33 mmol./L); methanol (-CH3 resonance 63, 350 µmol./L); glycine (-CH2 resonance 74, 750 µmol./L); and formate (-CH resonance 116, 560 µmol./L). The lactate-CH3 signal was excluded from this simulation in view of complications arising from overlap with other resonances (typical spectra are shown). Resonance labels correspond to those provided in Table 1 (TSP represents the 3-(trimethylsilyl)propionate-2,2,3,3-d4 chemical shift reference and quantitative internal standard). At this low operating frequency, further spin–spin splitting of propionate’s -CH3 and -CH2 group resonances (classically t and q, respectively) is clearly apparent in both experimentally acquired and simulated 60 MHz spectra. Bruker TopSpin NMR-SIM software was employed to generate simulated spectra. This NMR-SIM program is based on the solution of the quantum mechanical Liouville equation, with the spin system developing during the radiofrequency pulse and FID acquisition process, which features rotating frame magnetization transfer and the execution of T1 and T2 effects. Full details of these simulations will be reported elsewhere.
Applsci 12 01235 g013
Table 1. Assignments of resonances in the 600 MHz 1H NMR spectra of supernatants of WMS samples (chemical shift (ö) values and resonance coupling patterns are also provided). * Indicates tentative assignment. With the exception of the tentative ones indicated, assignments for the majority of these resonances were confirmed by (1) detailed considerations of chemical shift values, coupling patterns, and coupling constants; (2) comparisons with established literature and available database values (with allowances being made for the pH dependences of selected resonances, where required); (3) the application of the homonuclear two-dimensional (2D) COSY and TOCSY NMR techniques; and (4) standard addition treatments of WMSS samples with standard additions of standard solutions containing authentic, pure analytes, where considered appropriate. All chemical shift values were referenced to TSP (δ = 0.00 ppm), but a further check on these was achieved by use of the WMSS sample -CH3 group resonances of lactate (δ = 1.330 ppm) and alanine (δ = 1.486 ppm), and, hence, these served as secondary endogenous internal chemical shift references.
AssignmentAssignment CodeChemical Shift (δ/ppm)Coupling Pattern
n-Caproate-CH310.861t
iso-Valerate-CH3′s20.885d
n-Butyrate-CH330.893t
iso-Caproate-CH340.912½ d
Isoleucine-CH3n/a0.921t
* Long-chain fatty acid-/Triacylglycerol acyl chain-terminal-CH350.94broad
Hydroxy-iso-caproate-CH3s60.946d
Leucine-CH370.962t
Valine-CH3/Isoleucine-CH380.982/0.9962 × d
Methylsuccinate-CH391.014d
Valine-CH3101.035d
Propioniate-CH3111.058t
Unassignedn/a1.10d
iso-Butyrate-CH3121.125d
3-Amino-iso-butyrate-CH3131.150d
iso-Propyl alcohol-CH3s141.168d
Ethanol-CH3151.183t
Methylmalonate-CH3/α-Fucose-CH3161.211d
3-D-hydroxybutyrate-CH3/β-Fucose-CH3171.242d
Lactate-CH3181.330d
Acetoin-CH3191.371d
Unassigned19A1.454m
Alanine-CH3201.486d
n-Butyrate-β-CH2211.551q
5-Aminovalerate-β,γ-CH2′s221.641m
Leucine-CH2231.685m
Lysine-δ-CH2Lys1.71m
Arginine-γ-CH2241.72m
Putrescine-β-CH2251.76m
Ornithine-β-CH2/Propane-1,3-diol-β-CH2261.77m
Senicioate-CH3271.81s
* Glutarate-β-CH2281.832m
Thymine-CH3291.87s
Acetate-CH3301.92s
* 2-Hydroxyglutarate-γ-CH2311.954m
Proline-γ-CH2/N-Acetylneuraminate-C3H322.005m
Hyaluronate/Glycoprotein carbohydrate side-chain N-acetylsugar-NHCOCH3 functions332.02–2.080 (3 partially resolved signals)broad
N-Acetylglutamate-/N-Acetylaspartate--NHCOCH3 (2 signals)342.025/2.030s
N-Acetylglucosamine-/N-Acetylneuraminate--NHCOCH3352.040s
* Unassigned N-Acetylated metabolite-NHCOCH3 (2 signals)362.053/2.0582 × s
Dimethylsulphide-S-CH3372.098s
Methionone-S-CH3382.140s
n-Butyrate-α-CH2392.164t
Propioniate-CH2402.193q
Acetone-CO-CH3412.215s
5-Aminovalerate-α-CH2422.235t
Glutamate-γ-CH2432.334m
Pyruvate-CH3442.377s
Glutamine-γ-CH2452.393m
Succinate-CH2462.415s
Methylamine-N(CH3)472.610s
Citrate-CH2CO2Cit2.611AB coupling pattern
Dimethylamine-N(CH3)2482.745s
Trimethylamine-N(CH3)3492.900s
5-Aminovalerate-δ-CH2/Lysine-ε-CH2503.023t/t
Creatine-N(CH3)513.037s
Putrescine-α-CH2523.072t
Dimethylsulphone-SO(CH3)2533.13s
½ Histidine-/Phenylalanine-β-CH2543.148m
* 1,9-Dimethylurate-N1(CH3)553.190s
Choline-N(CH3)3+563.201s
Trimethylamine-N-oxide-N(CH3)3573.232s
Betaine-N(CH3)3+583.248s
Taurine-CH2NH3+593.263t
½ Phenylalanine-β-CH2/Tryptophan-β-CH2603.293m
* Paraxanthine-N1(CH3)613.331s
* 1,3,7-Trimethylurate-N7(CH3)623.351s
Methanol-CH3633.367s
* 1,3-Dimethyluracil-N1(CH3)643.392s
* 3,7-Dimethylurate-N7(CH3)653.402s
* Carnitine-β-CH2663.409m
Proline-α-C1H673.419dd
Taurine-CH2SO3683.423t
* 4-Hydroxyphenylacetate-CH2/β-Fucose-C2H693.453s/dd
* 1-Methylguanine-N1(CH3)69A3.464s
Unassigned703.491s
Phenylacetate-CH2713.499s
Choline-C2-CH2723.511dd
½ Glycerol-CH2OH733.536m
Glycine-CH2743.564s
Threonine-α-CH753.575d
Valine-α-CH763.597d
* Propane-1,3-diol-CH2OH/β-Fucose-C3H773.637t/dd
½ Glycerol-CH2OH78A3.649m
Ethanol-CH2783.654q
1-Methylhistidine-N1(CH3)793.677s
3-Methylhistidine-N3(CH3)79A3.709s
Lysine-α-CH803.718m
Leucine-α-CH813.733m
* Gluconate-C4/C5-CHOH823.741m
Guanidoacetate-CH2833.760s
Alanine-α-CH/Glycerol-CHOH843.771m/m
Ethanolamine-CH2OH/β-Fucose-C5H853.814t/m
* α-Fucose-C3H863.852m
Serine-α-CH873.901m
Glycolate-CH2OH883.929s
Tyrosine-α-CH893.934m
Creatine-N-CH2903.958s
Histidine/Phenylalanine-α-CH913.985m
4-Hydroxyphenylpyruvate-CH2923.996s
Tryptophan-α-CH92A4.032dd
Lactate-CH934.120q
3-D-Hydroxybutyrate-CHOH944.132m
α-Fucose-C5H954.198m
Threonine-β-CHOH95A4.234m
α-Fucose-C1Hα-Fuc5.209d
α-Glucose-C1Hα-Glc5.232d
Sucrose-C1HSucr5.414d
Allantoin-CH965.392s
Senecioate-α-CH=C<975.666s
Urea-CO-NH2985.79broad
Uracil-C2H995.800d
Fumarate-CH=CH-1006.52s
4-Hydroxyphenylacaetate aromatic ring-C3H/C5H1016.84d
* Protein aromatic amino acid residue(s)1026.85broad
Tyrosine aromatic ring-C2H/C6H1036.880d
Histidine imidazole ring-C5H1047.071s
4-hydroxyphenylacetate aromatic ring-C2H/C6H104A7.155d
Tyrosine aromatic ring-C3H/C5H1057.237d
Phenylalanine aromatic Ring-C2H/C6H1067.320m
Phenylalanine aromatic ring-C4H1077.375m
Phenylalanine aromatic ring-C3H/C5H1087.43m
Uracil-C1H1097.533d
* Protein aromatic amino acid residue(s)1107.552m
Histidine imidazole ring-C2H1117.812s
3-Methylhisitidine imidazole ring-C2H1127.913s
* Protein aromatic amino acid residue(s)1138.052 × broad signals
Hypoxanthine-C8H1148.175s
Hypoxanthine-C3H1158.219s
Formate-CH1168.456s
* trans-2-Alkenal-CHO Function1179.57d
Table 2. Systematic review of pre-abstention/fasting time limits for metabolomics experiments performed in a total of 39 independent investigations [20,59,60,61,62,63,64,65,66,67,68,69,70,71,72,73,74,75,76,77,78,79,80,81,82,83,84,85,86,87,88,89,90,91,92,93,94,95,96]. Five of these studies failed to specify an abstention time limit for WMS samplings. Abbreviations: MS, mass spectrometry; LC, liquid chromatography; GC, gas chromatography; MS, mass spectrometry; CE-TOF, capillary electrophoresis time of flight MS analysis; UPLC, ultra-performance liquid chromatography; UPLC-QTOF, ultra-performance liquid chromatography coupled with quadrupole/time of flight MS analysis; UHPLC, ultra-high performance liquid chromatography; UHPLC-HR, ultra-high performance liquid chromatography (high-resolution); LA-REI, laser-assisted rapid evaporative ionization; GC/EI, gas chromatography/electron ionization detection; FUPLC, faster ultra-performance liquid chromatography; CPSI, conductive polymer spray ionization; CE-LC, capillary electrophoresis and liquid chromatography.
CodeDisease(s) Studied/NotesBioanalytical Techique(s) EmployedSample Sizes: Diseased (n1)/Controls (n2))Protocol: Pre-Collection Abstention/Fasting Limit Specified (h)ReferenceDate Accessed
1Oral cancerCE-TOF-MS24/441.5[59]19/07/21
2Saliva stability study1H NMRna/51.5[60]19/07/21
3Salivary metabolome contributions1H NMRna/111[20]19/07/21
4Type 1 diabetes1H NMR34/341[61]19/07/21
5Chronic periodontitis1H NMR30/15Unspecified[62]19/07/21
6Peritoneal dialysis treatment1H NMR12/311[63]19/07/21
7Chronic renal failure in hemodialysisSpectrophotometry57/na1.5[64]19/07/21
8Chronic hepatitis1H NMR20/168[65]19/07/21
9Dental cariesUPLC-MSGC/EI-MS21/36Unspecified[66]19/07/21
10Oral health status (periodontitis)UHPLC-MSna/909Unspecified[67]19/07/21
11Alzheimer’s diseaseFUPLC-MS256/2182[68]19/07/21
12Oral squamous cell carcinomaCPSI-MS249/1241[69]19/07/21
13Breast cancerCE-LC-MS124/421[70]19/07/21
14Aggressive and chronic periodontitis1H NMR61/391[71]19/07/21
15Alzheimer’s diseaseLC-MS47/351[72]19/07/21
16Perinatally hiv-infected youths with periodontal diseaseGC-MS12/212[73]20/07/21
17Sjögren’s syndromeLC-MS20/201.5[74]20/07/21
18Oral cancer and leukoplakiaUPLC-QTOF-MS69/341.5[75]20/07/21
19Breast cancerLC-QTOF-MS23/351[76]20/07/21
20Post-periodontal surgery (early repair markers)1H NMR124/520 (no fasting)[77]20/07/21
21Oral, breast, and pancreatic cancerCE-TOF-MS128/871[78]20/07/21
22Effects of inter-day and intra-day variationCE-TOF-MSna/132[79]20/07/21
23Metabolome of canine and human salivaUHPLC-QTOF-MSna/14 (human); na/13 (dog)1.5 (human)/12 (dogs)[80]20/07/21
24Children and adolescents after hemodialysis1H NMR30/401[81]20/07/21
25Oral squamous cell carcinoma and oral lichen planusCE-TOF-MS60/na1.5[82]20/07/21
26HalitosisGC-MS22/30Variable[83]20/07/21
27Effect of timing of collection of salivary metabolomic biomarkers on oral cancer detection.CE-TOF-MS22/44Variable[84]20/07/21
28Children with dental caries before and after treatment.1H NMR20/102[85]20/07/21
29Endogenous salivary citrate1H NMRna/101[86]20/07/21
30Understanding the human salivary metabolome1H NMR23 (smokers)/23 (non-smokers)1[87]20/07/21
31Females with temporomandibular disorders1H NMR26/271[88]20/07/21
32Parkinson’s disease1H NMR76/3712[89]20/07/21
33Salivary metabolomicsUHPLC-HR-MSLA-REI-MSna/1403[90]20/07/21
34Effect of experimental gingivitis induction and erythritolUPLC-MSna/612[91]20/07/21
35Sjögren’s syndrome.1H NMR14/151[92]20/07/21
36Evaluation of sport performance1H NMRna/143[93]20/07/21
37Head and neck cancer1H NMR45/301.5[94]20/07/21
38Oral cancerCE-TOF-MS26/441.5[95]20/07/21
39Pediatric obesity- related liver disease and metabolic syndromeGC-MS23/181[96]20/07/21
Table 3. Numbers of significant 1H NMR ISB variables for UV two-sample t tests performed, both with and without false discovery rate (FDR) correction, on a total of 209 ISB variables from the sore-throat study dataset with different row-wise normalization, transformation, and column-wise scaling methods applied. Row-wise normalization methods used were either product quotient normalization (PQN) to an overall average healthy control group spectrum, or CSN. Where relevant, the transformation applied was a generalized logarithmic (glog) one, and the scaling strategy involved was Pareto-scaling. Up- and downregulations in ISB variables are those expressed with respect to the participants in the acute sore-throat condition group, i.e., a significant upregulation refers to a significantly higher mean ISB intensity value (and hence assigned metabolite salivary concentration) over that corresponding to the healthy control group, and vice-versa for downregulations.
Normalization, Transformation, and Scaling Methods AppliedFDR CorrectionSignificantly Upregulated ↑Not SignificantSignificantly Downregulated ↓
NoneNo681410
Yes62030
Glog-/Pareto- onlyNo6413213
Yes231797
PQN plus Glog-/Pareto-No7811417
Yes5514113
CSN plus Glog-/Pareto-No5510846
Yes3214037
Table 4. Statistical significance of the ‘between-participants’ and ‘between-sampling days-within-participants’ (σi2 and σ(i)j2, respectively) components of variance in a random effects ANOVA model to determine their contributions towards the WMS supernatant concentrations of a total of 31 1H NMR-assigned metabolite variables. All TSP-normalized datasets were glog-transformed and Pareto-scaled prior to analysis. Also shown are the R2 and Q2 values for each of these UV models, along with their σi2(i)j2 ratios. * Indicates that values were rounded to the nearest integer.
Metabolite VariableR2Q2σi2(i)j2 *Significance σi2Significance σ(i)j2
n-Caproate0.720.55184<10−6ns
n-Butyrate0.700.5261<10−60.06
Propionate0.690.50321<10−6<0.01
Valine0.38−0.01n/a (σ(i)j2 ≈ 0)<10−4ns
iso-Butyrate0.740.58n/a (σ(i)j2 ≈ 0)<10−6ns
3-D-Hydroxybutyrate0.660.44885<10−6ns
Lactate0.680.47126<10−6ns
Acetoin0.690.5063<10−6ns
Alanine0.700.5075<10−6ns
Thymine0.650.4385<10−6ns
Acetate0.630.3924<10−6<0.01
N-Ac-10.710.5533<10−6<0.01
N-Ac-20.680.4850<10−6<0.05
N-Ac-30.660.4427<10−6<0.01
5-Aminovalerate0.630.40n/a (σ(i)j2 ≈ 0)<10−6ns
Glutamate0.650.4349<10−6ns
Pyruvate0.680.4821<10−6<10−3
Glutamine0.620.3814<10−6<10−3
Succinate0.580.3227<10−60.04
Methylamine0.390.38259<10−4ns
Dimethylamine0.390.4276<10−6ns
Trimethylamine0.600.35n/a (σ(i)j2 ≈ 0)<10−6ns
Choline0.640.41118<10−6ns
Taurine0.670.47144<10−6ns
Methanol0.670.47n/a (σ(i)j2 ≈ 0)<10−6ns
Glycine0.600.3564<10−6ns
Urea0.39019<10−4ns
Tyrosine0.560.2866<10−4ns
Histidine0.530.24n/a (σ(i)j2 ≈ 0)<10−6ns
Phenylalanine0.640.2920<10−6<0.01
Formate0.530.24n/a (σ(i)j2 ≈ 0)<10−4ns
Table 5. Loading vectors of salivary metabolites on (i.e., linear correlations with) components (PCs) 1–4 for a factor analysis model performed with a total of 31 1H NMR-determined analytes. The TSP-normalized dataset was glog-transformed and Pareto-scaled prior to principal factor analysis, and Varimax rotation with Kaiser normalization was then applied for the purpose of further analysis. The significance threshold of component (PC) loadings vectors was set at 0.35 in view of the large sample size of this investigation. Abbreviations: as Figure 10, with na, not available; n/a, not applicable. * Values obtained from the HMDB [47]; ** only one observation available.
PC1PC2PC3PC4Mean Salivary Level
(µmol./L) *
Mean Blood Level (µmol./L) *
n-Cap0.190.850.230.127–817 **
n-But0.280.910.140.0012–14701.0 **
Prop0.210.840.020.1238–64200.9 **
Val0.110.170.600.314–48130–266
iso-But0.260.380.080.56117–8852.3 **
3-D-HB0.210.670.290.483–1636–323
Lac0.420.340.080.5996–20,310740–2980
Ace0.480.670.300.42na1 (WB)
Ala0.300.860.320.2414–145200–585
Thy0.460.540.240.522–9na
A0.310.770.010.25112–14,64027–69
N-Ac-10.840.180.120.47n/an/a
N-Ac-20.790.220.090.54n/an/a
N-Ac-30.760.390.280.42n/an/a
5-AV0.320.680.190.3174–470na
Glu0.780.260.340.3712–1424–177
Pyr0.760.470.230.309–535034–67
Gln0.820.350.170.355–42491–658
Suc0.690.400.310.259–22606–16
MA0.300.100.820.27101 **19 *
DMA0.080.390.810.2011–651–48
TMA−0.030.750.570.1521–980.4–27
Chol0.390.420.430.569–336–28
Tau0.390.210.210.8025–10642–162
MeOH0.270.020.250.865–13347–468
Gly0.470.300.360.5517–188213–330
Urea0.360.23−0.14−0.20277–6174010–6500
Tyr0.510.580.080.225–3655–143
Phe0.300.880.09−0.056–4452–166
His0.120.080.380.646–2582–143
Form0.13−0.010.380.4635–60012–225
Publisher’s Note: MDPI stays neutral with regard to jurisdictional claims in published maps and institutional affiliations.

