
Mineral Composite Plaster Containing Hollow Glass Microspheres and CSA Cement for Building Insulation

 , ,
, ,
Abstract
:Featured Application
Abstract
1. Introduction
2. Materials and Methods
2.1. Materials
2.2. Methods
3. Results and Discussion
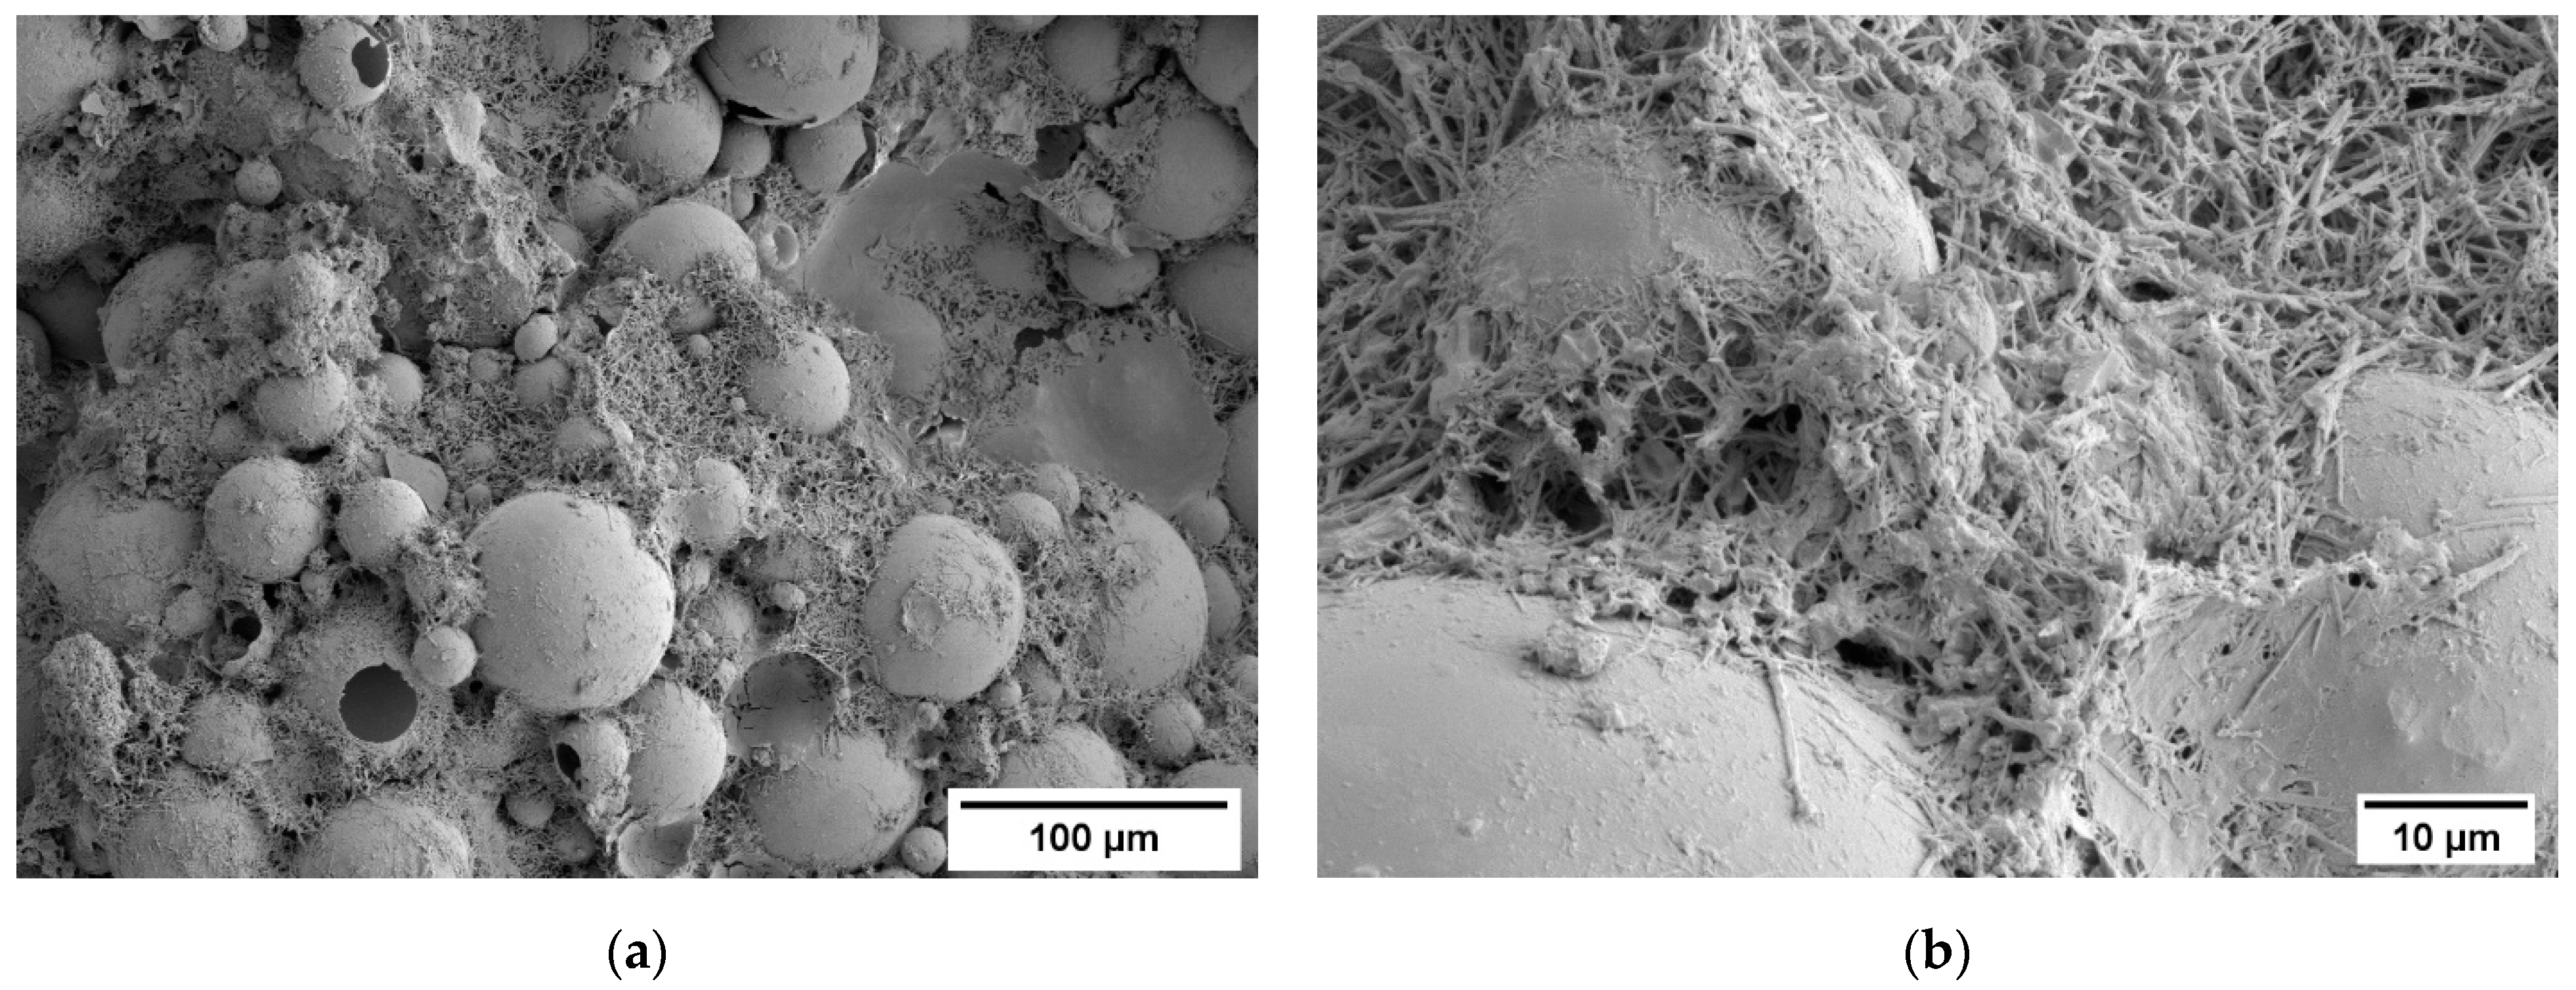
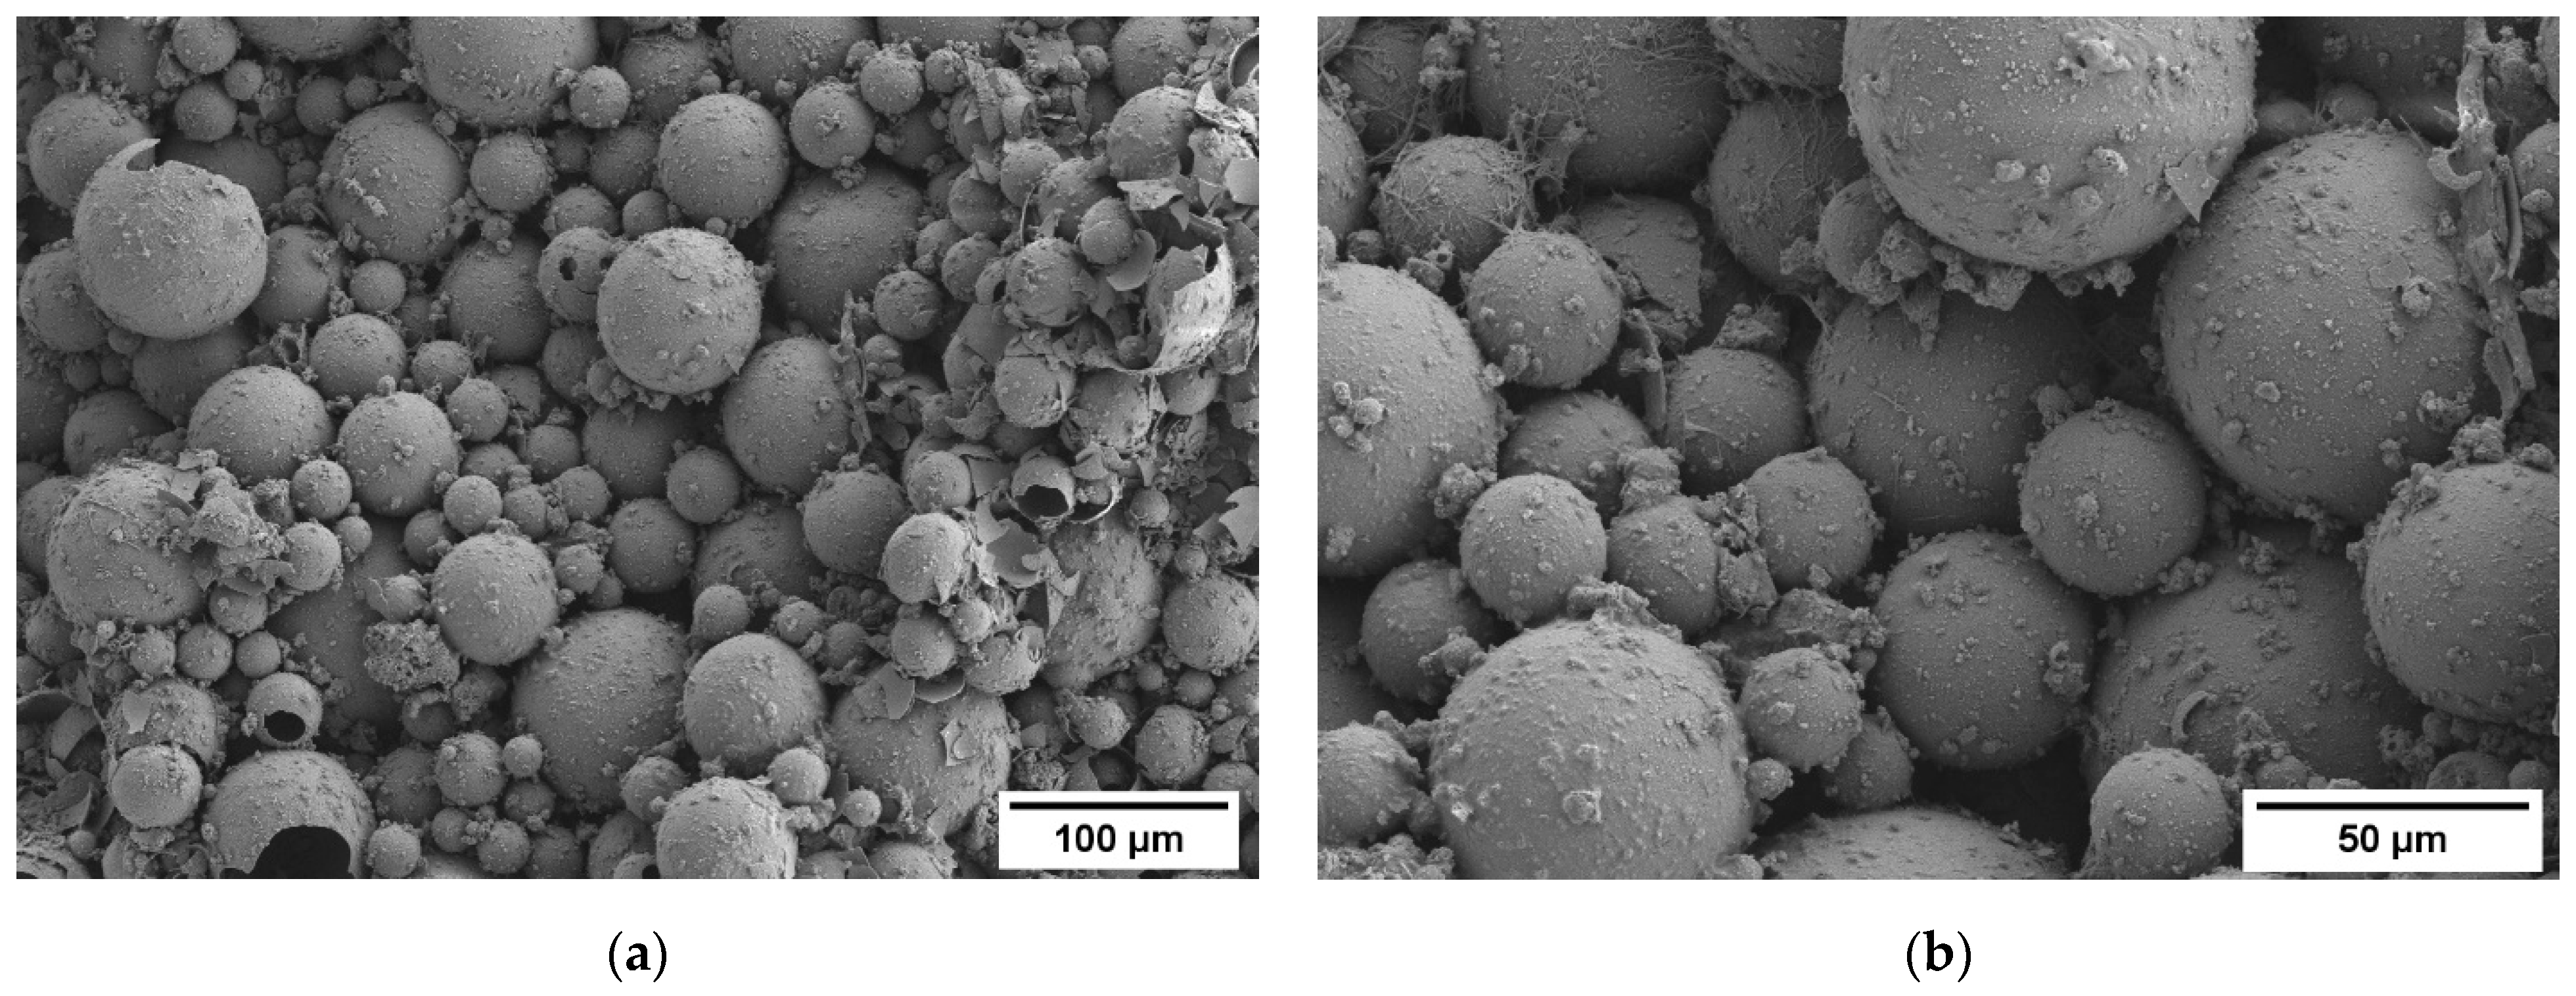
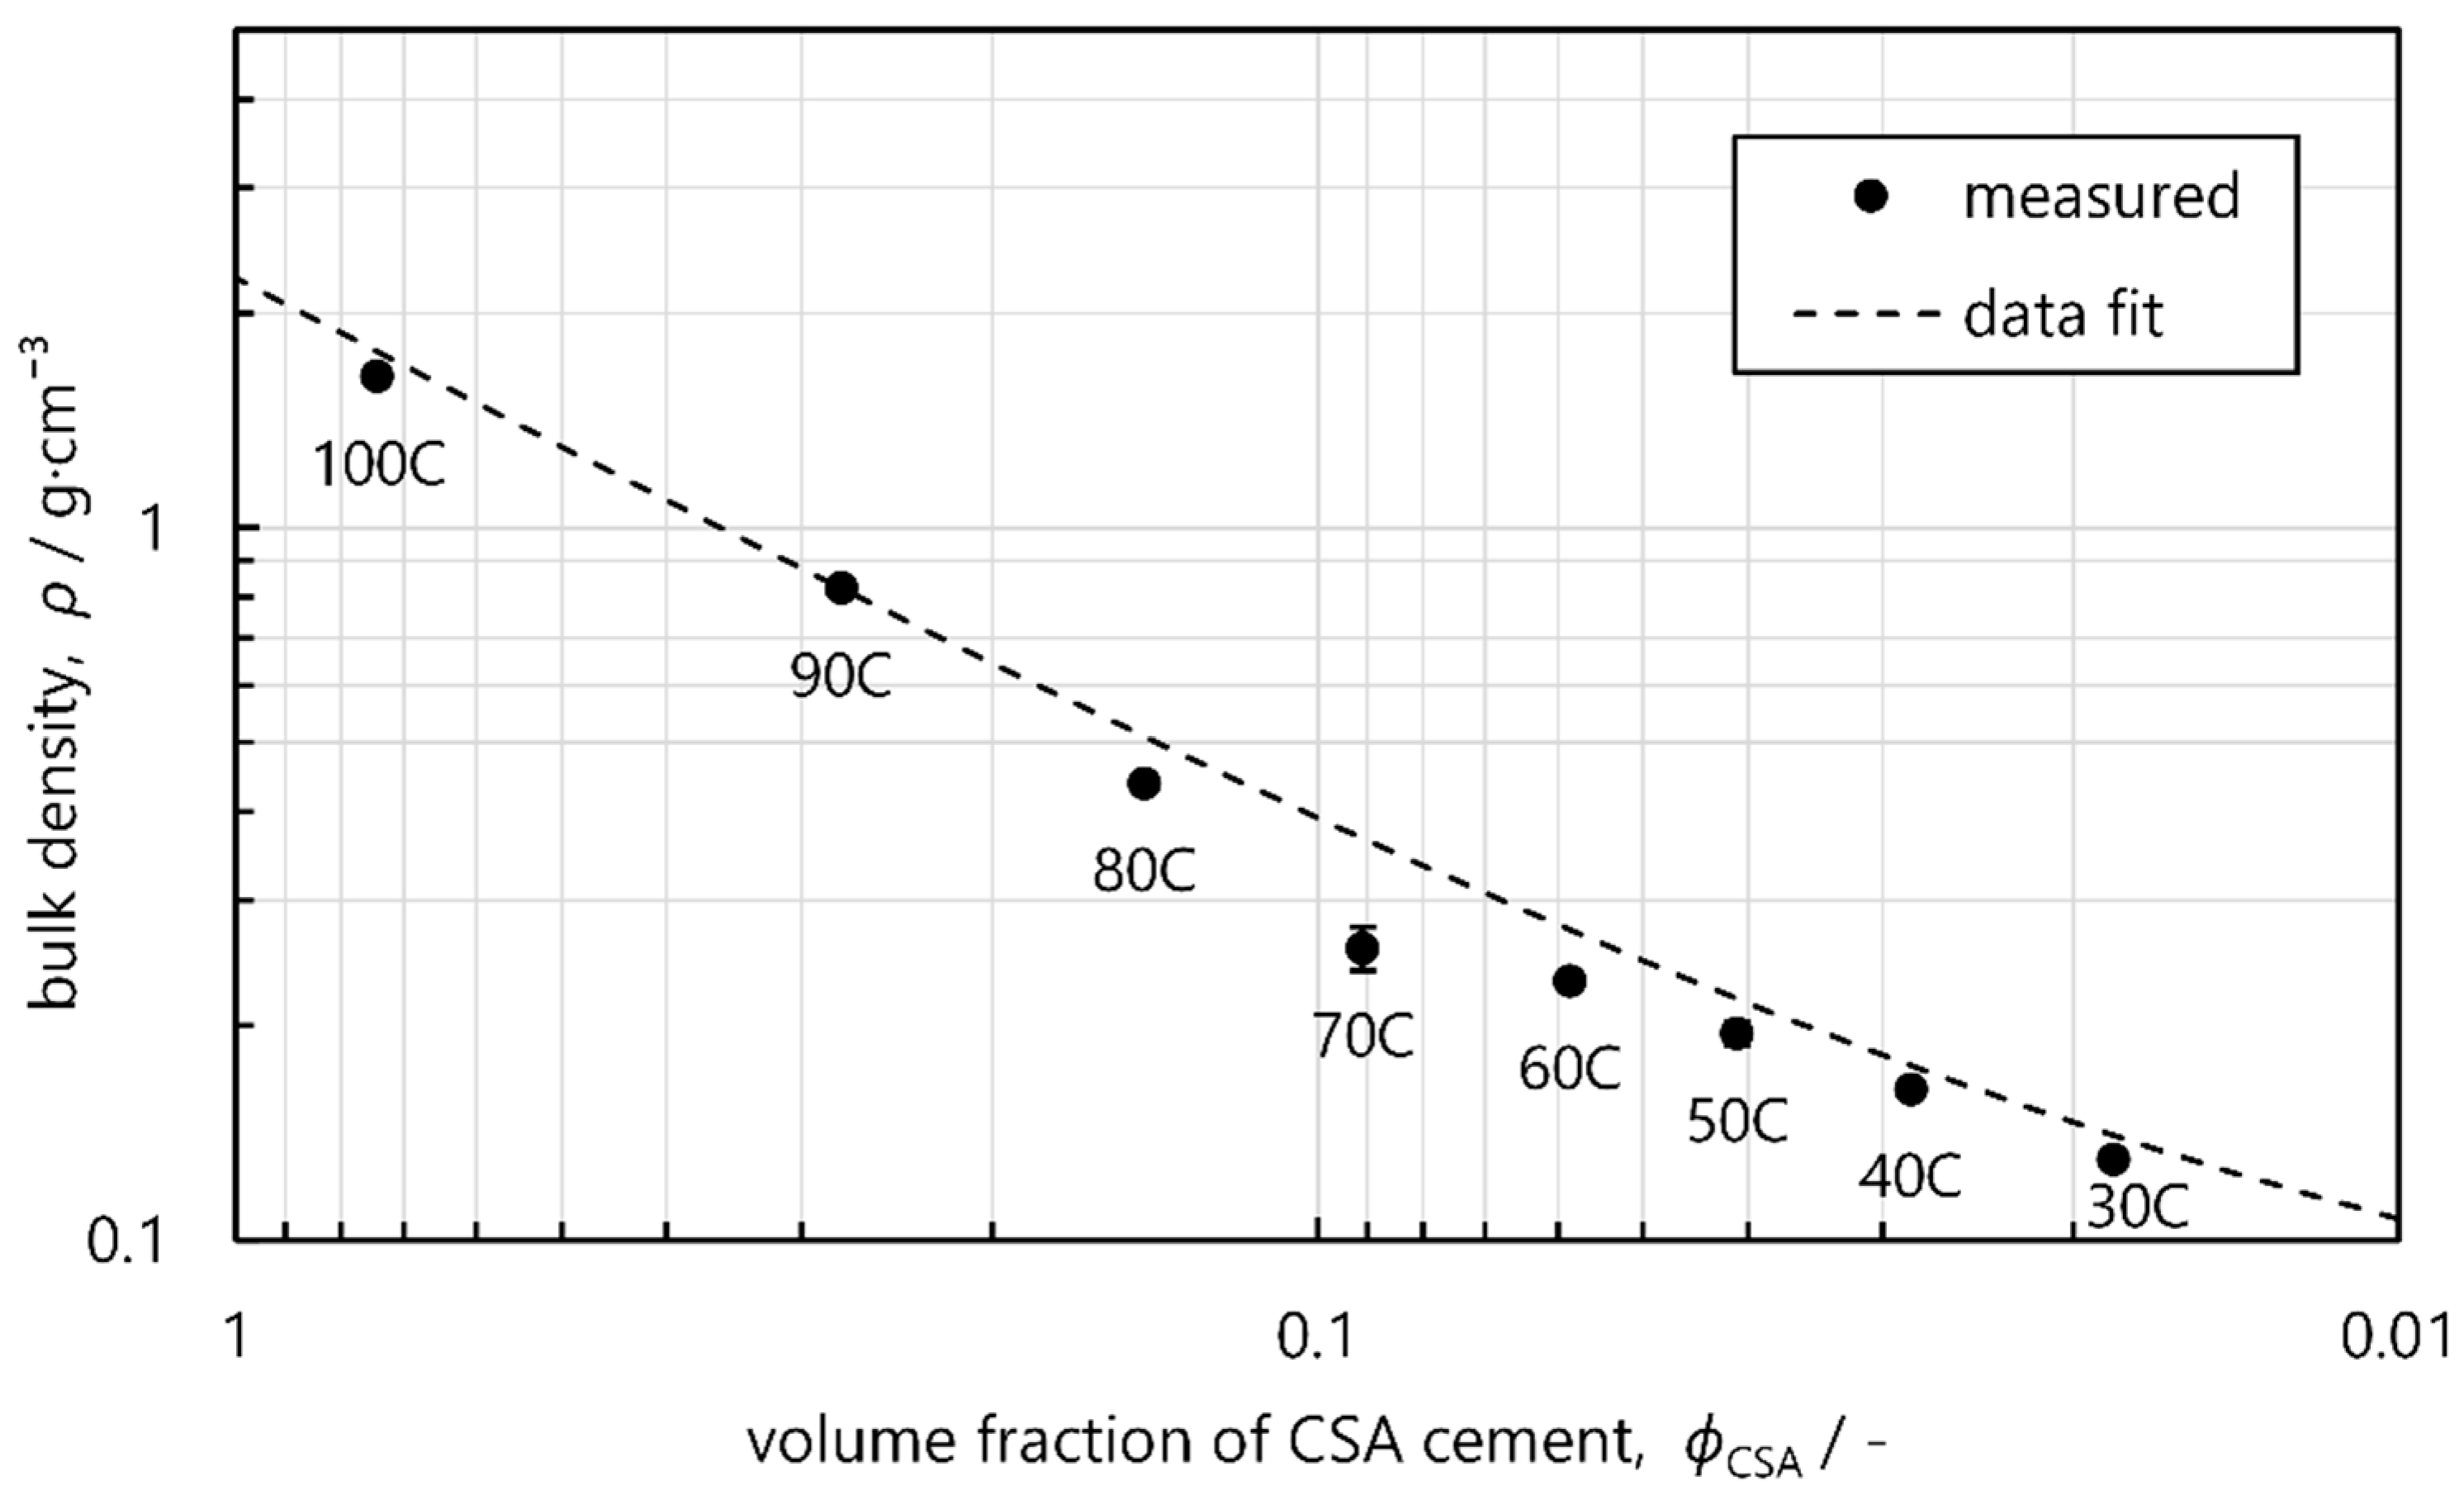
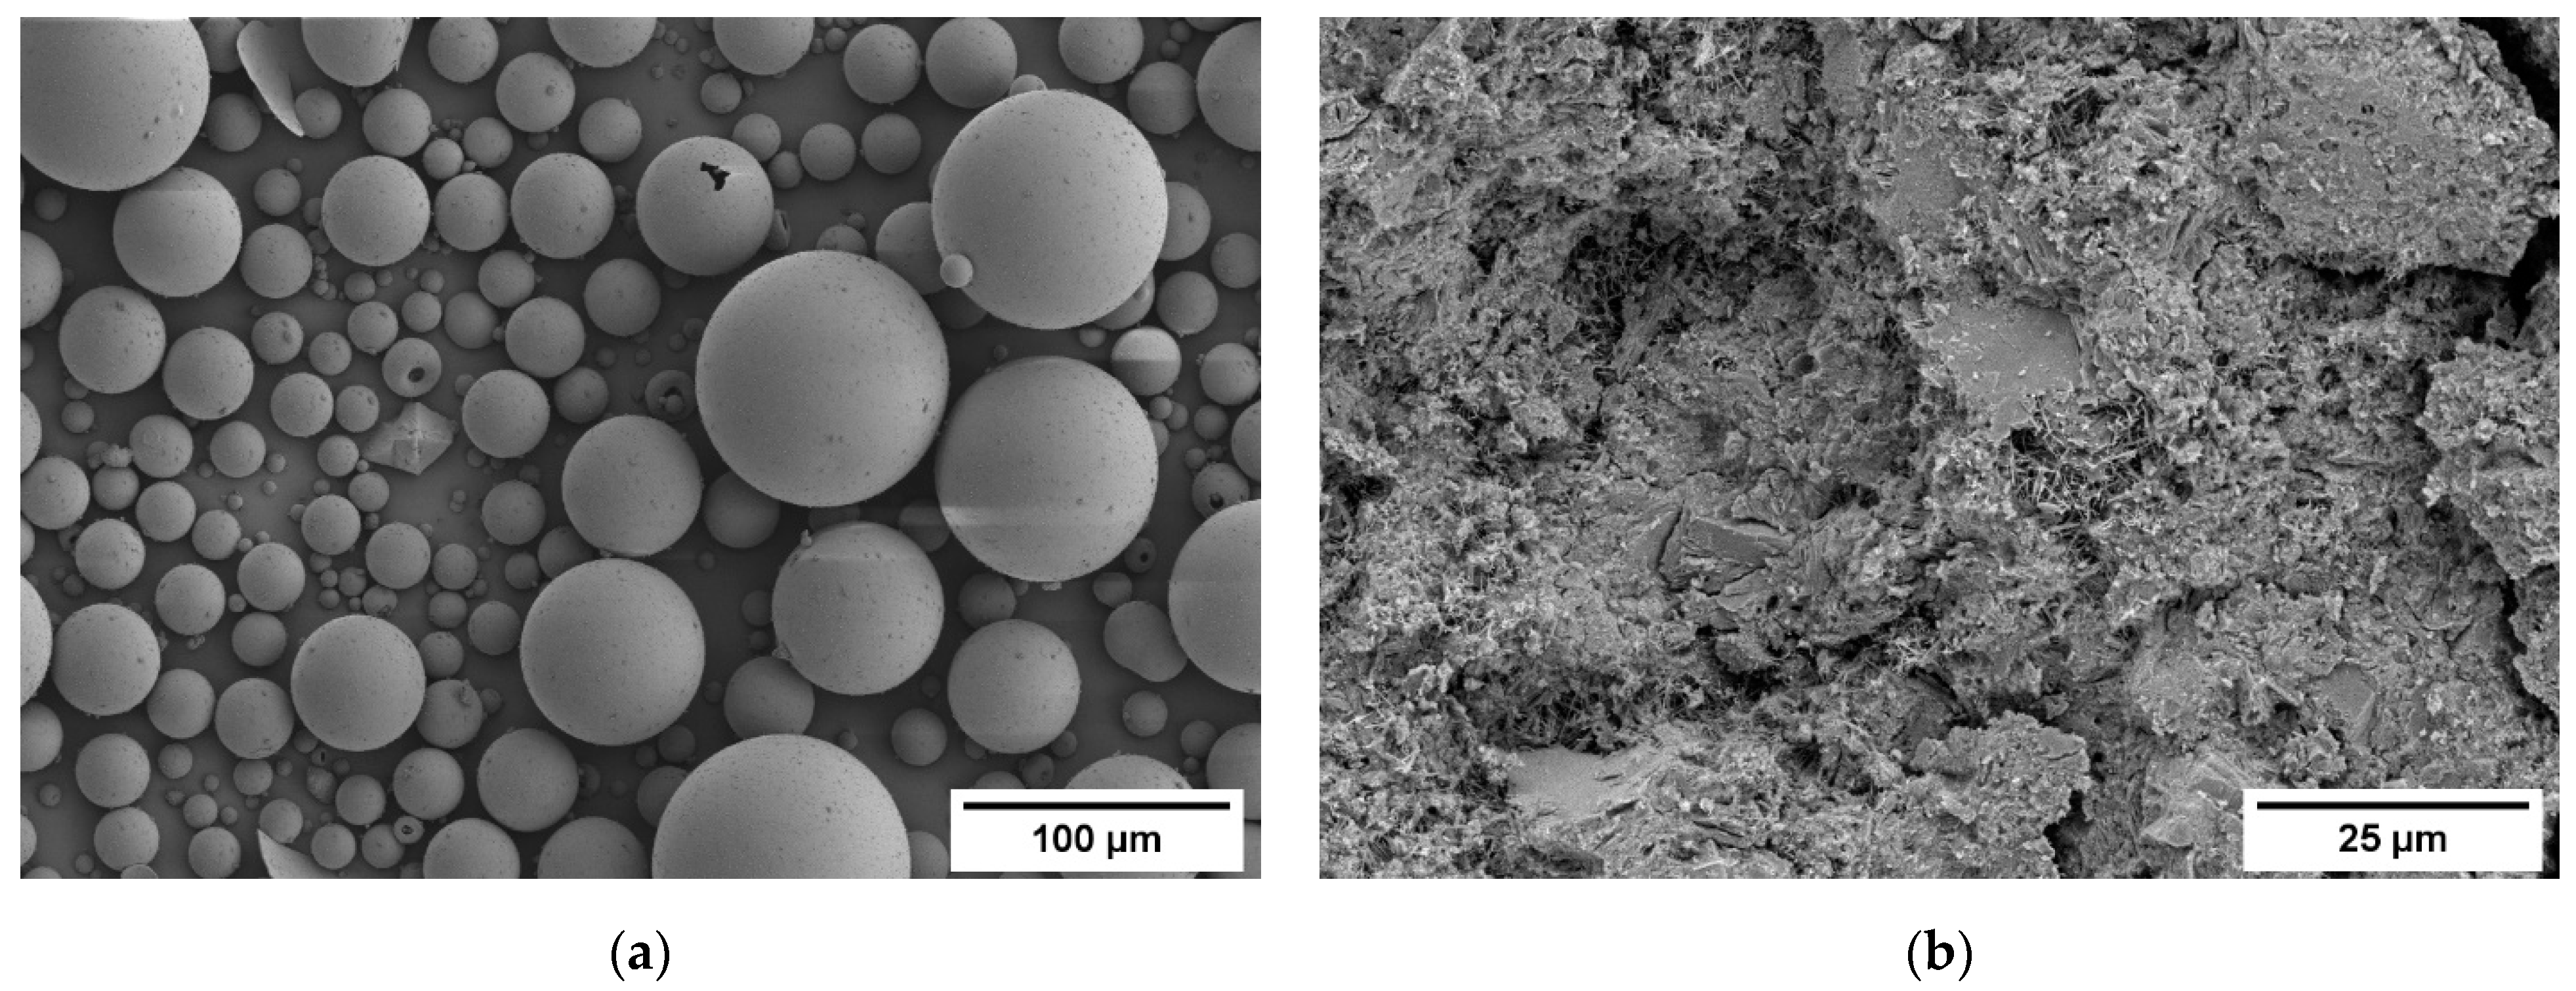
3.1. Density and Microstructure
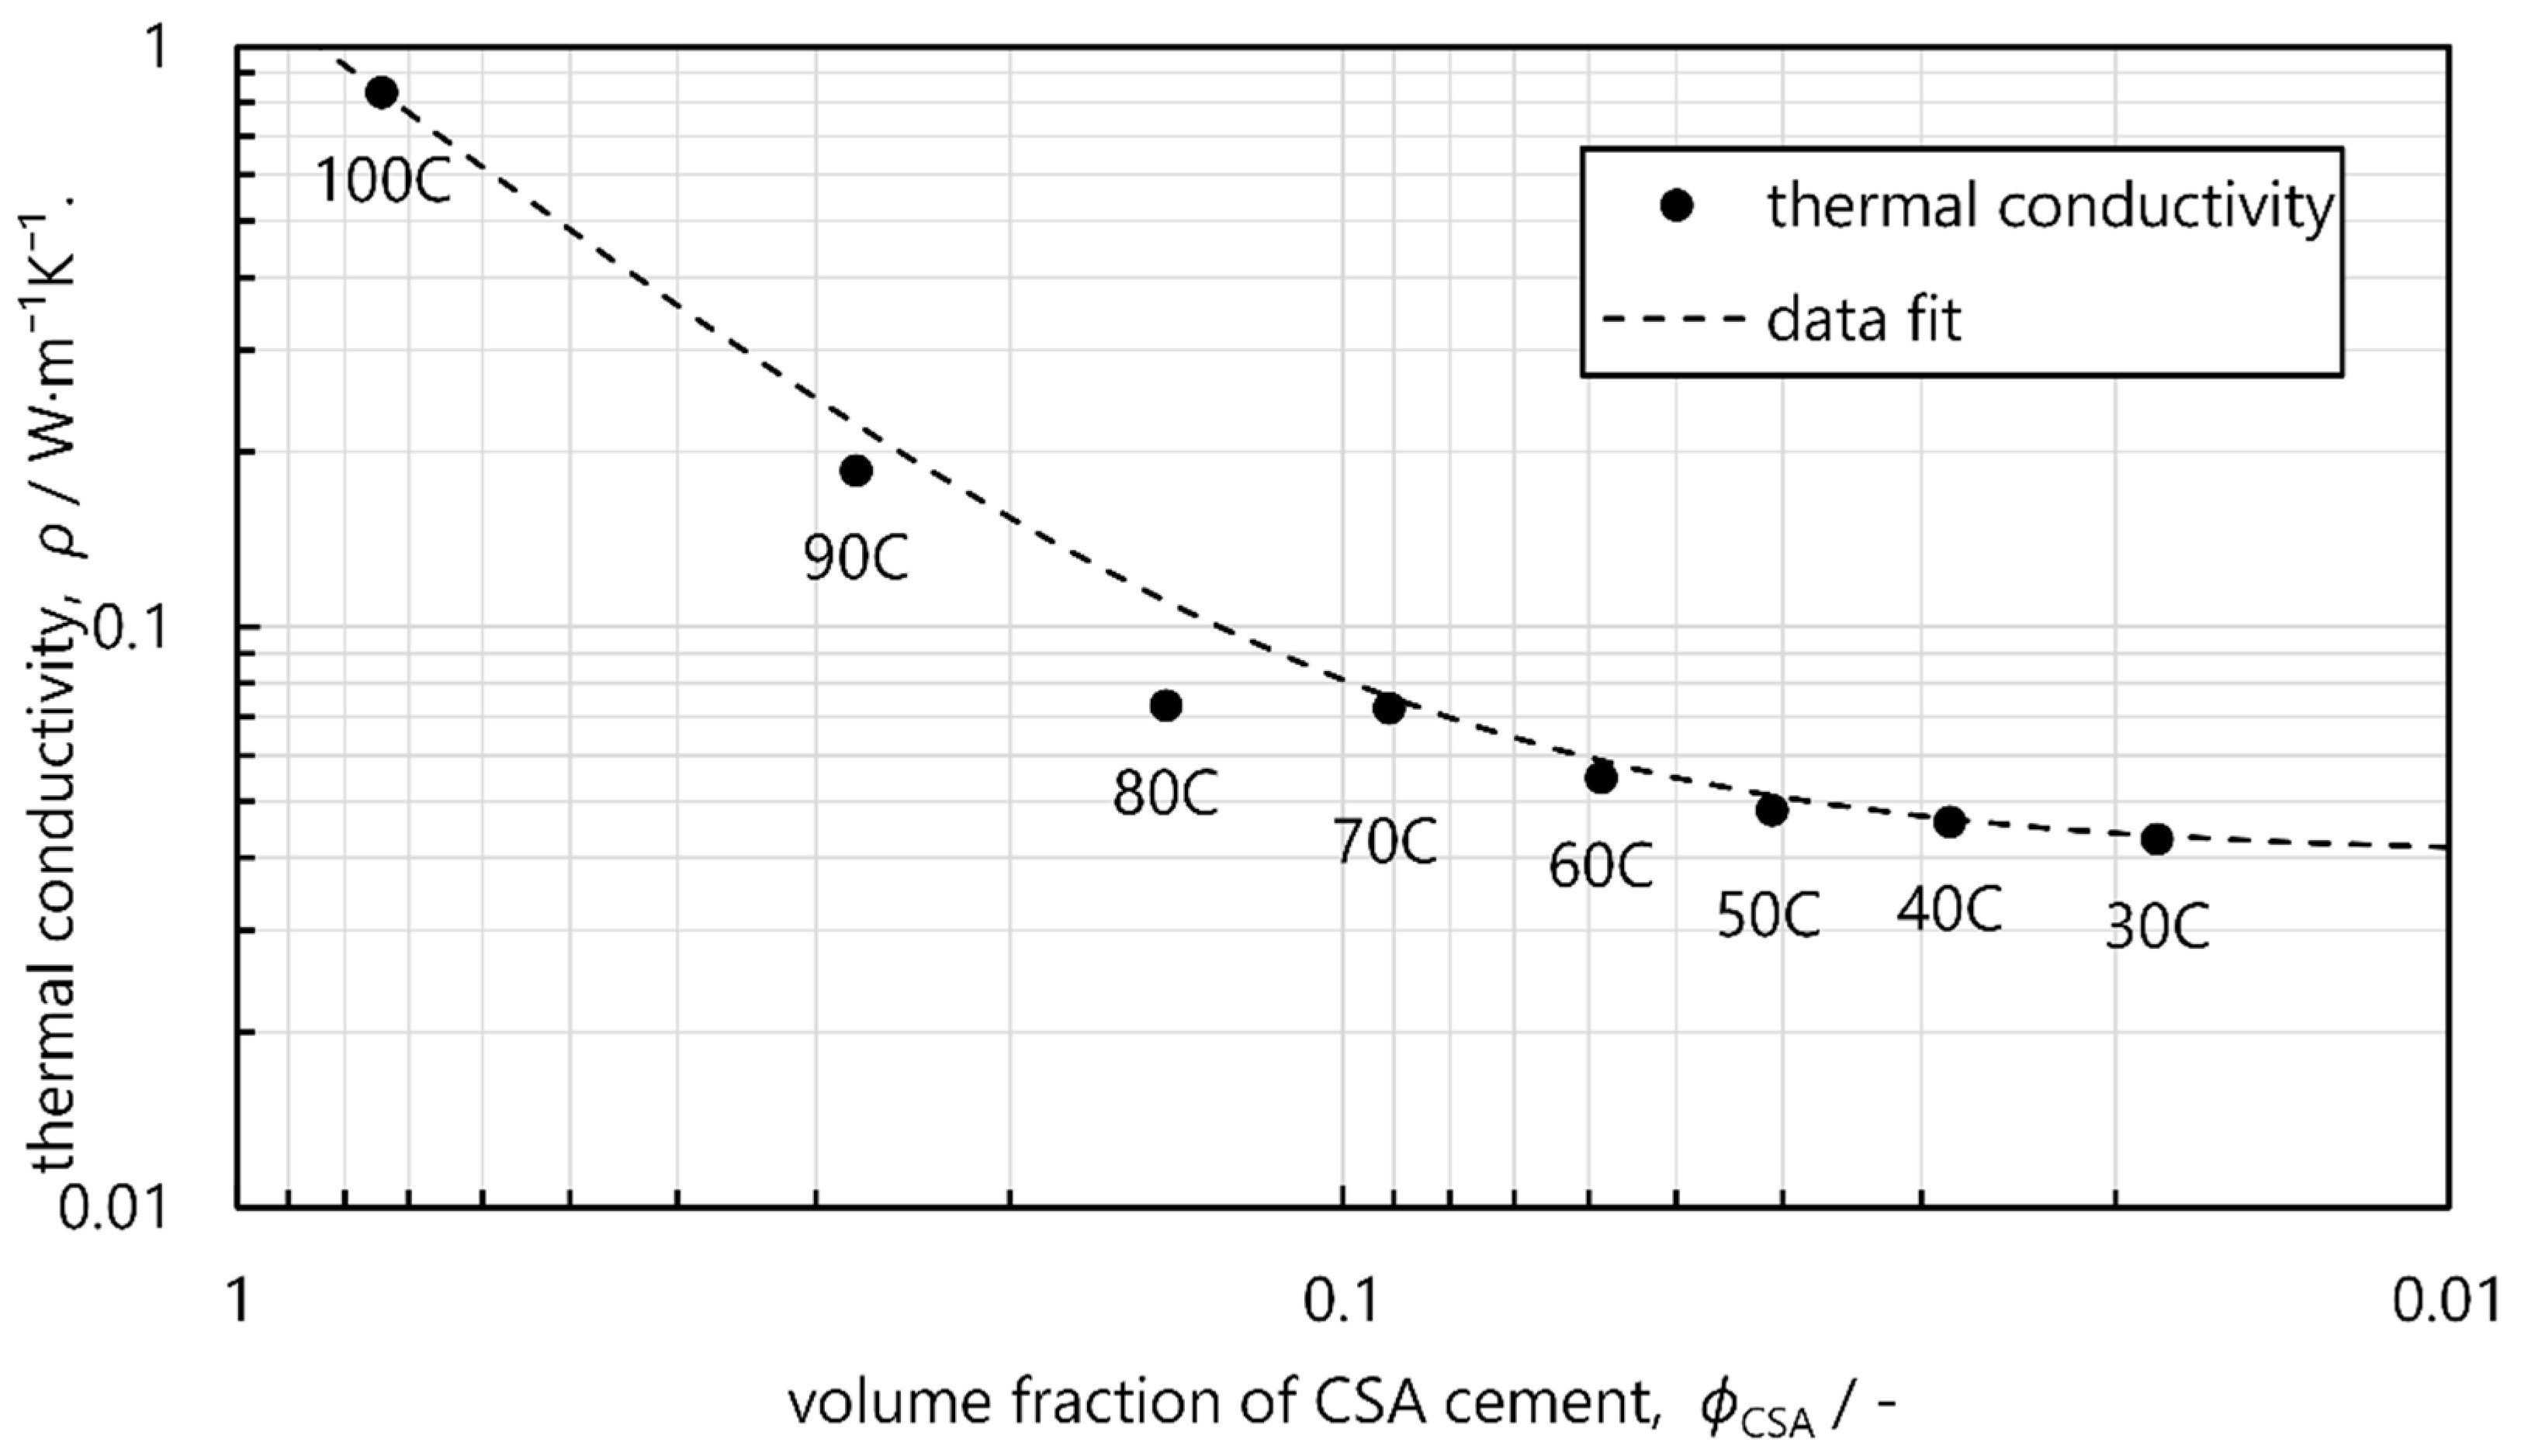
3.2. Thermal Properties
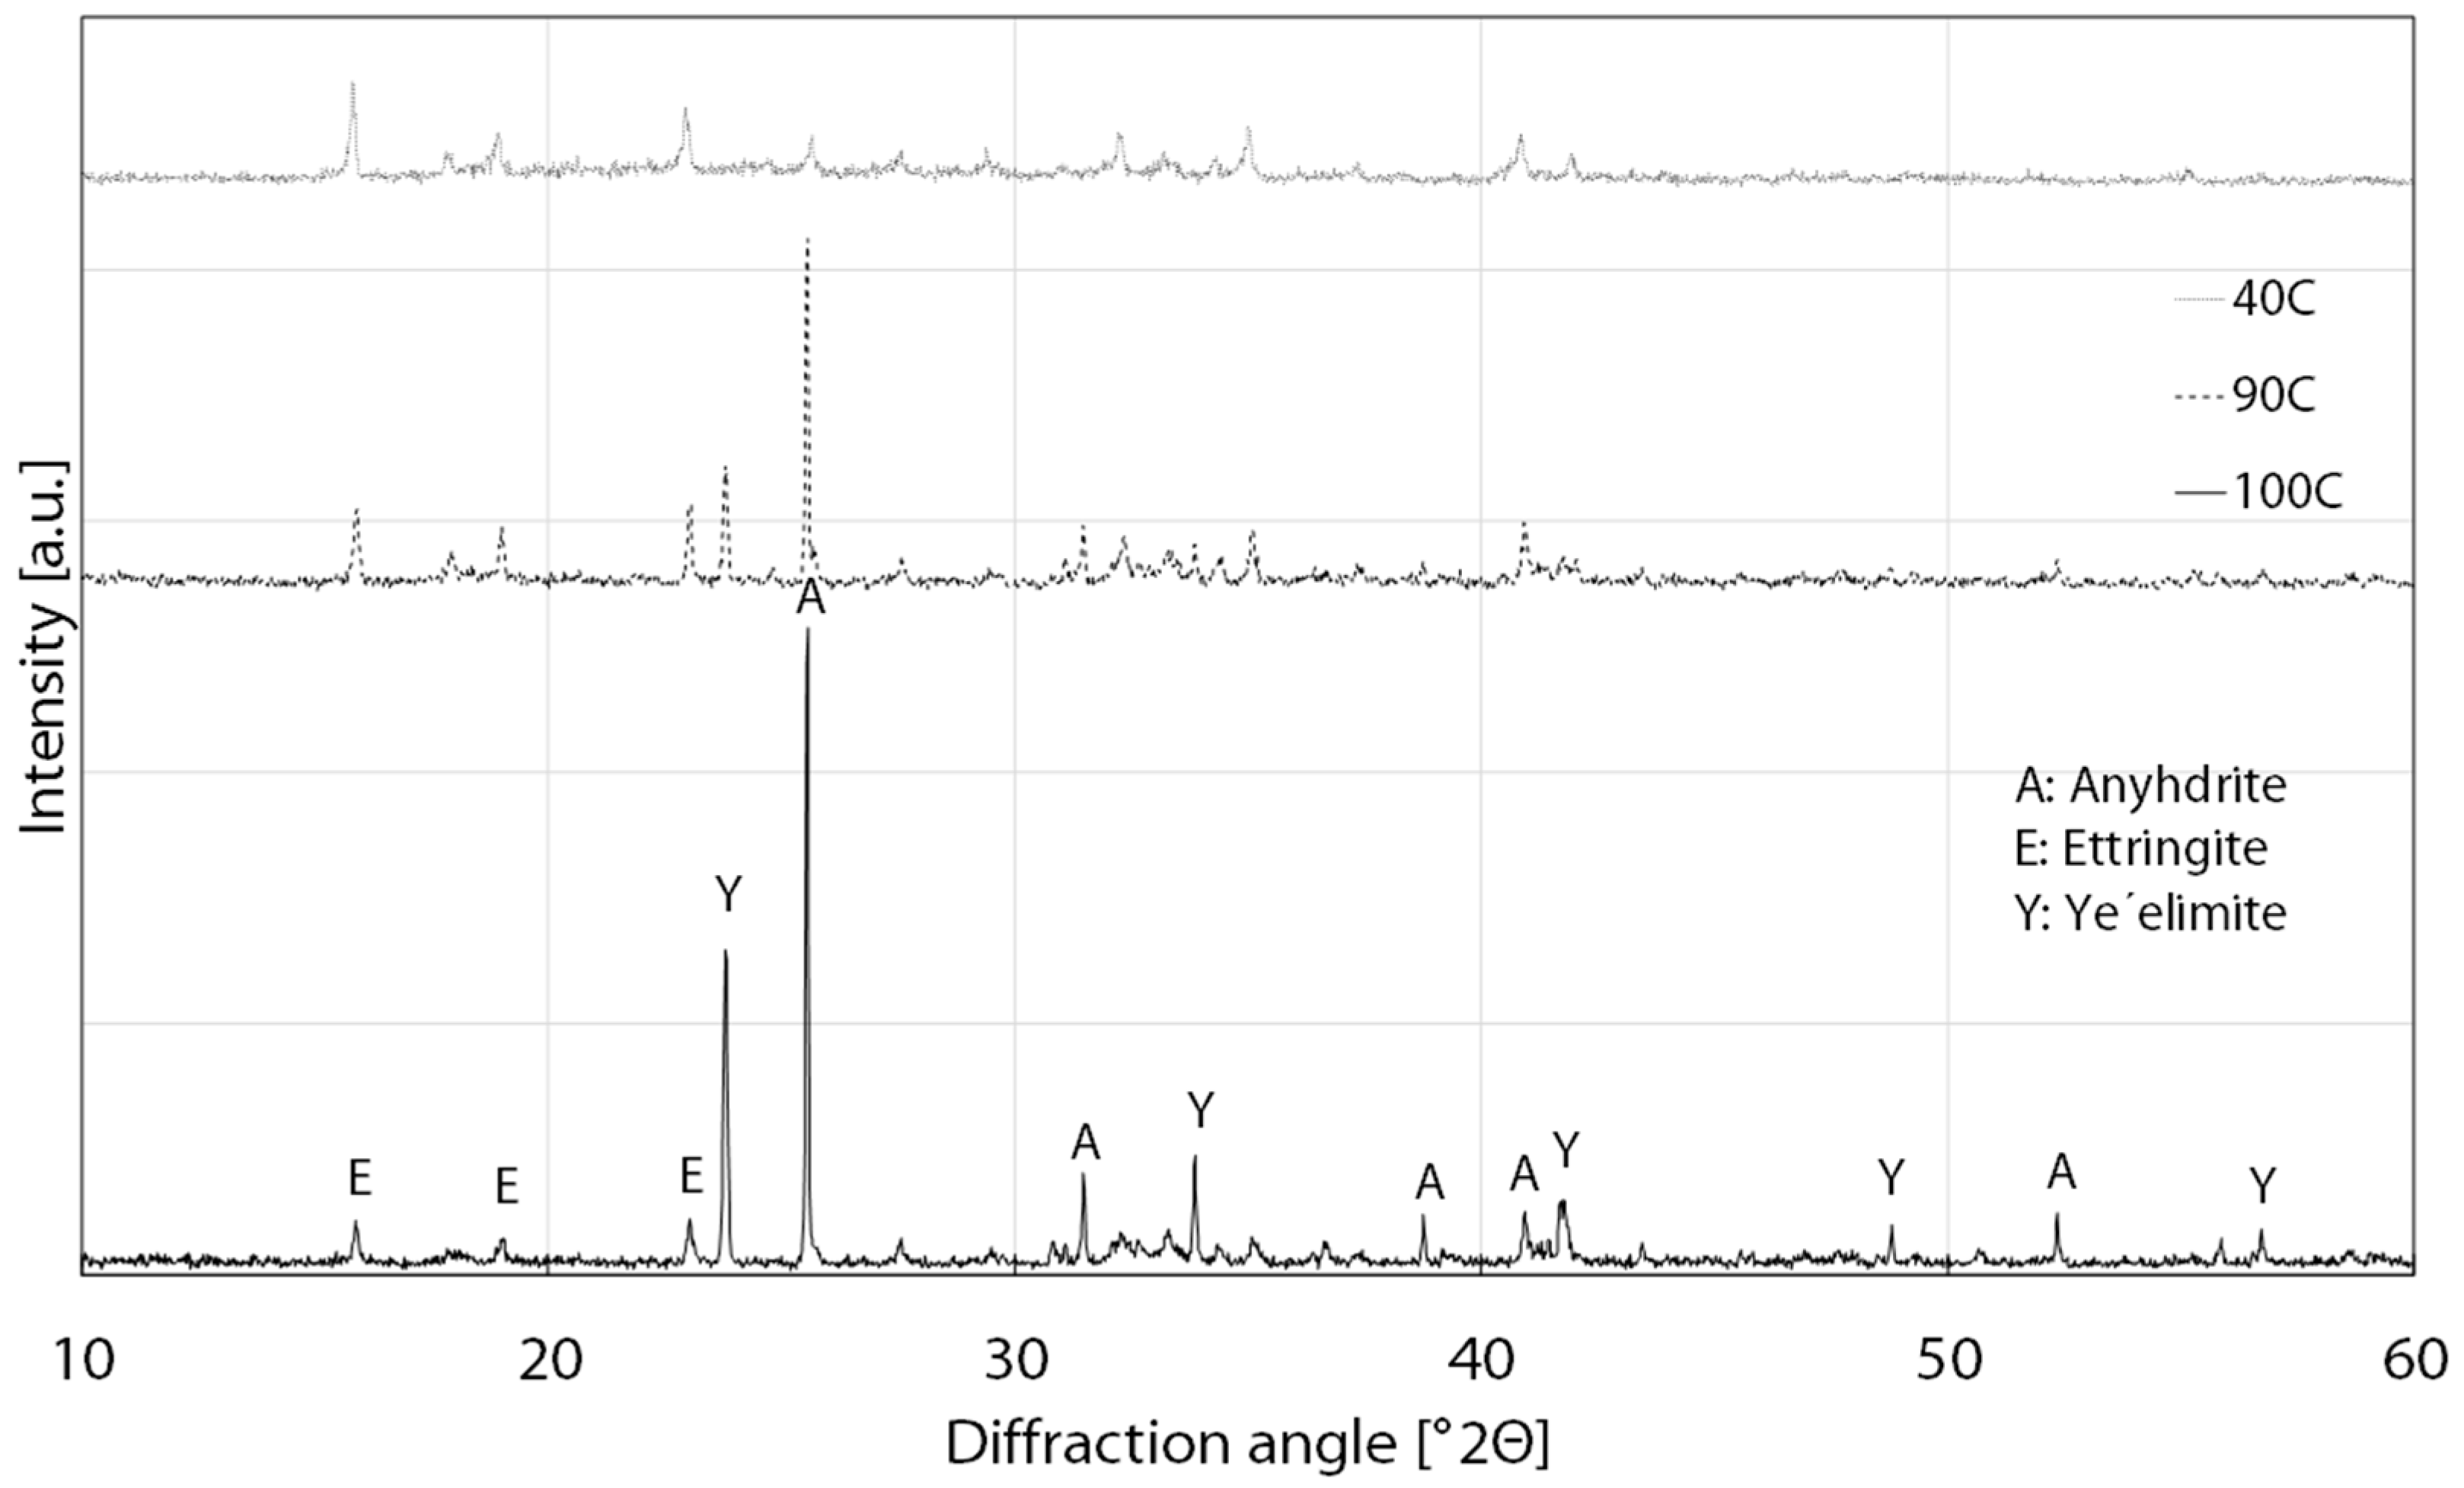
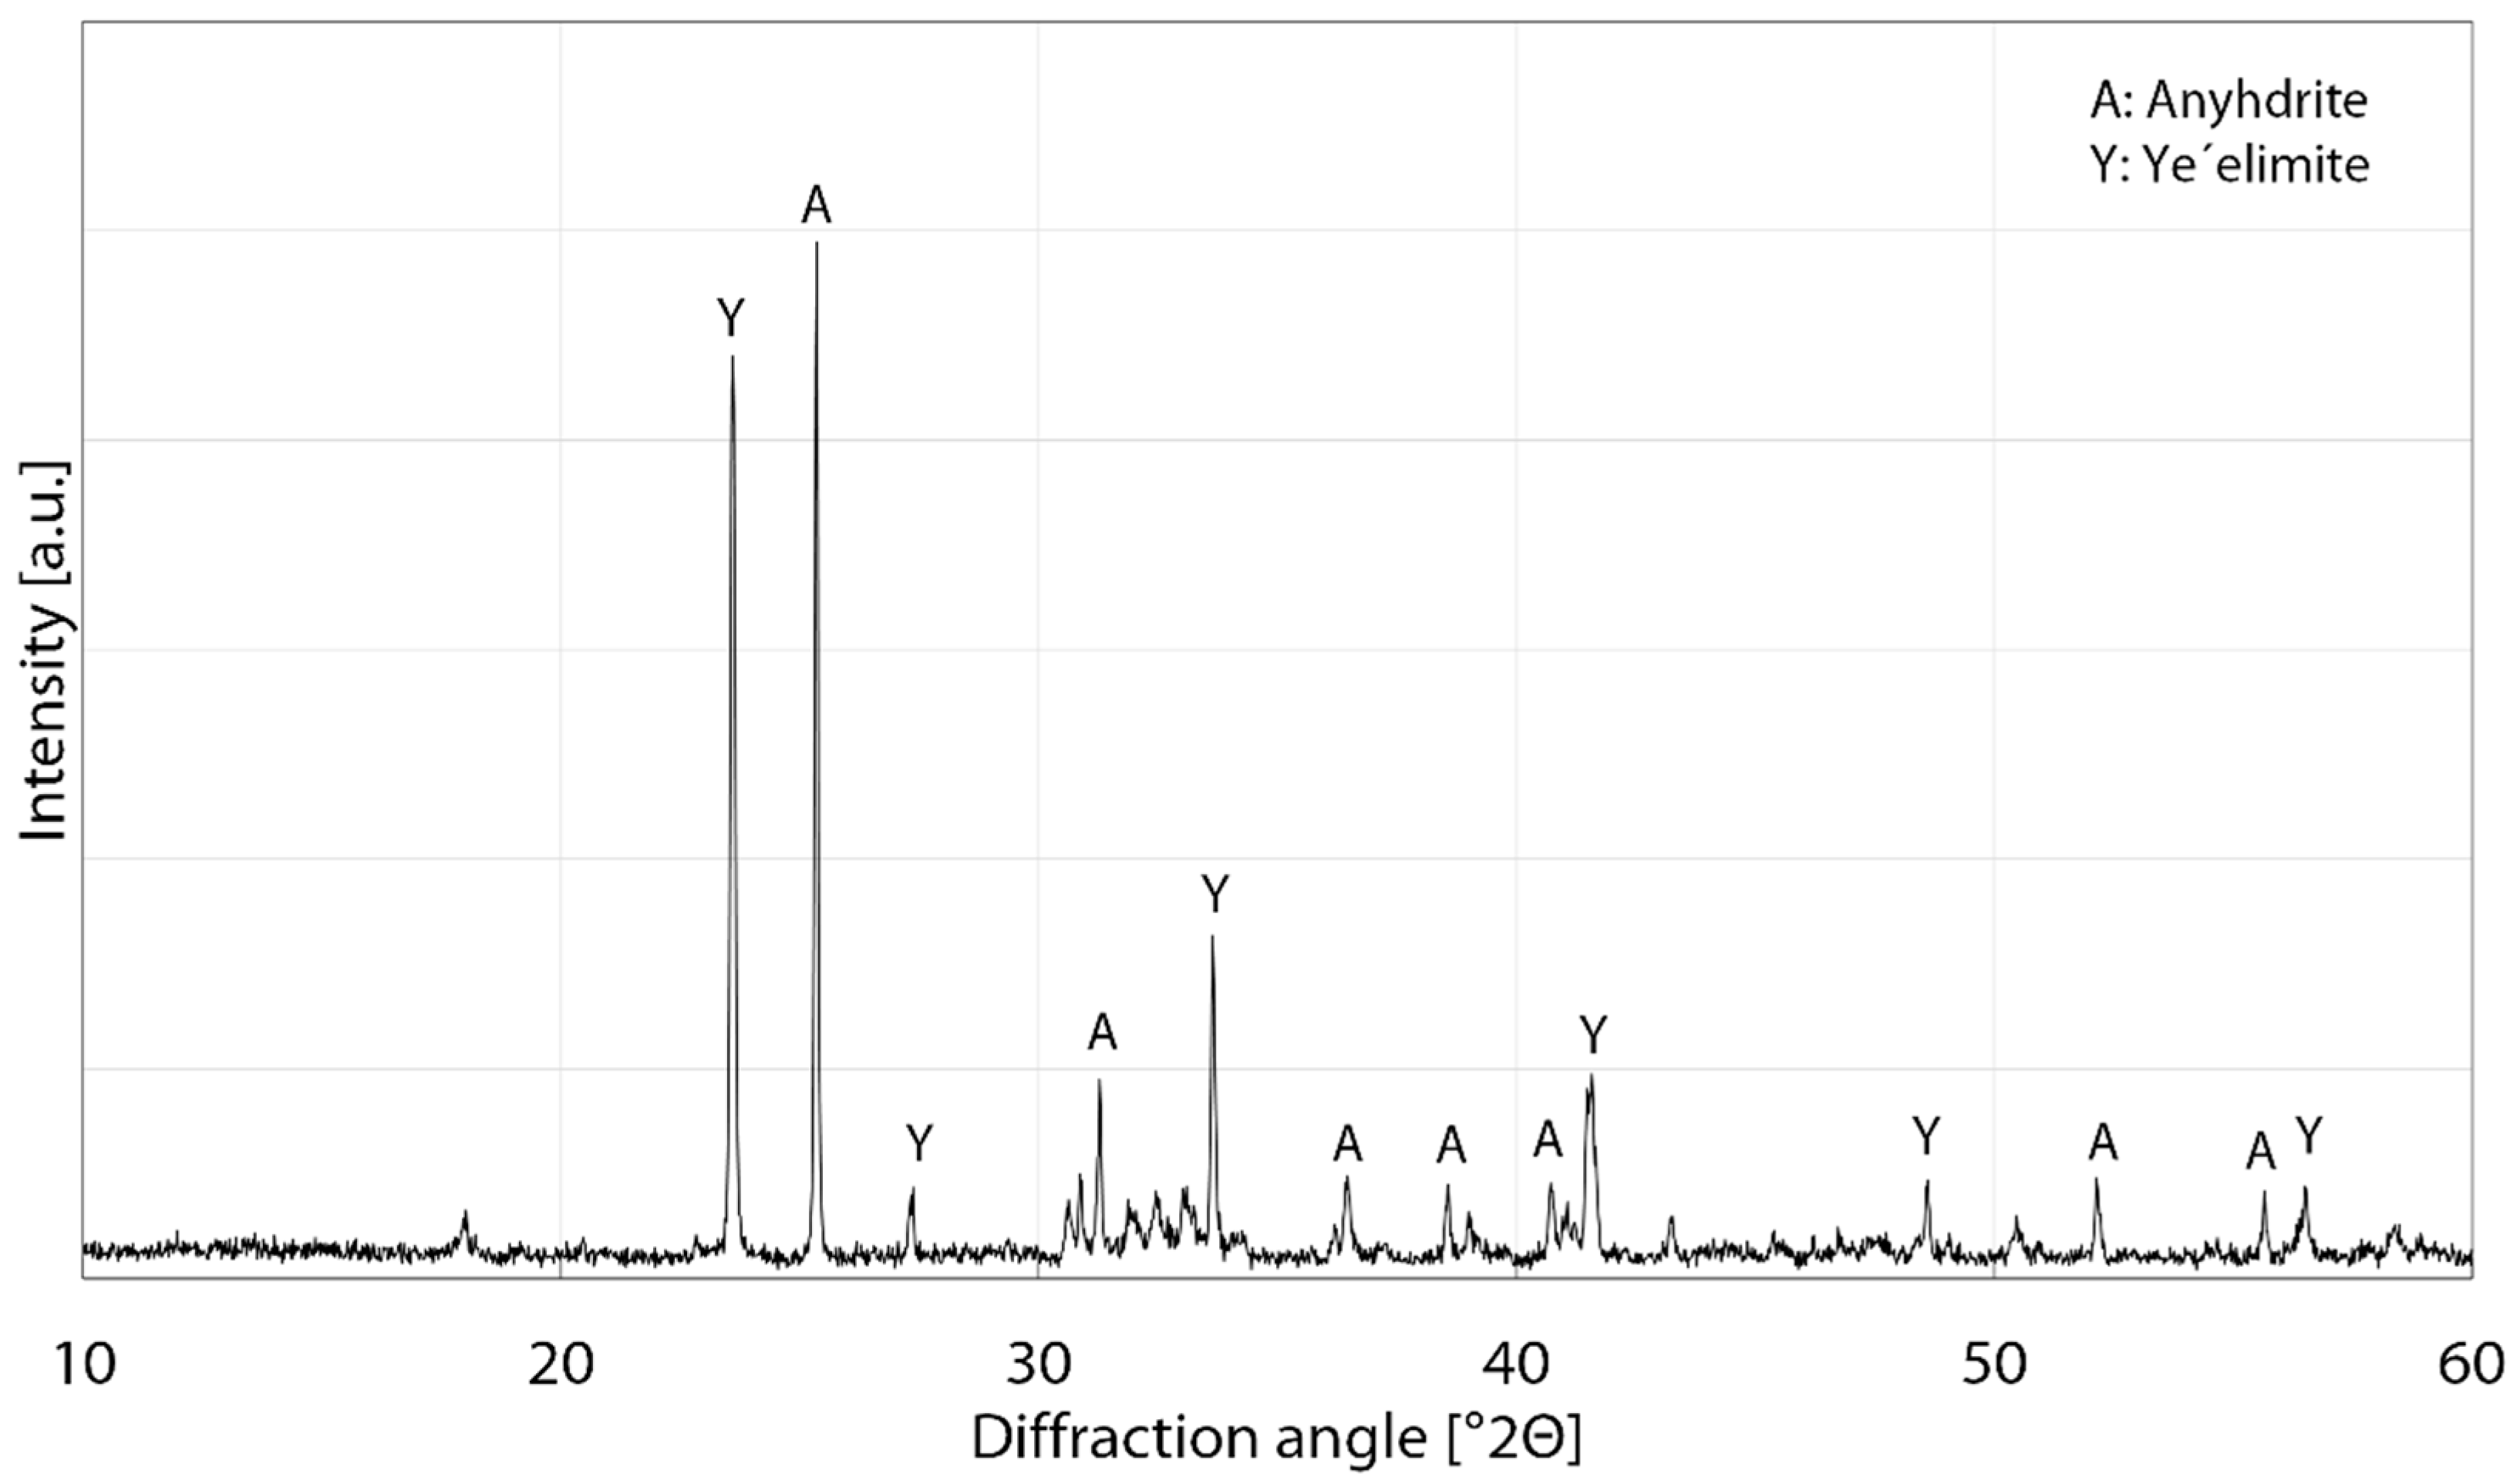
3.3. Phase Analysis
4. Conclusions and Outlook
Author Contributions
Funding
Institutional Review Board Statement
Informed Consent Statement
Data Availability Statement
Acknowledgments
Conflicts of Interest
References
- European Commission. A European Green Deal. Available online: https://ec.europa.eu/info/strategy/priorities-2019-2024/european-green-deal_en (accessed on 11 November 2021).
- European Environment Agency. Greenhouse Gas Emissions from Energy Use in Buildings in Europe 2021. Available online: https://www.eea.europa.eu/data-and-maps/indicators/greenhouse-gas-emissions-from-energy/assessment (accessed on 11 November 2021).
- Dombaycı, Ö.A.; Gölcü, M.; Pancar, Y. Optimization of insulation thickness for external walls using different energy-sources. Appl. Energy 2006, 83, 921–928. [Google Scholar] [CrossRef]
- Paiho, S.; Seppä, I.P.; Jimenez, C. An energetic analysis of a multifunctional façade system for energy efficient retrofitting of residential buildings in cold climates of Finland and Russia. Sustain. Cities Soc. 2015, 15, 75–85. [Google Scholar] [CrossRef]
- European Commission. In Focus: Energy Efficiency in Buildings. Available online: https://ec.europa.eu/info/news/focus-energy-efficiency-buildings-2020-feb-17_en (accessed on 11 November 2021).
- Heller, N.; Flamme, S. Waste management of deconstructed External Thermal Insulation Composite Systems with expanded polystyrene in the future. Waste Manag. Res. 2020, 38, 400–407. [Google Scholar] [CrossRef] [PubMed]
- Lakatos, A. Comparison of the Thermal Properties of Different Insulating Materials. Adv. Mat. Res. 2014, 899, 381–386. [Google Scholar] [CrossRef]
- Ellouze, A.; Jesson, D.; Ben Cheikh, R. The effect of thermal treatment on the properties of expanded polystyrene. Polym. Eng. Sci. 2020, 60, 2710–2723. [Google Scholar] [CrossRef]
- Lehmann, S.; Schwinger, L.; Scharfe, B.; Gerdes, T.; Ehrhardt, M.; Riechert, C.; Fischer, H.-B.; Schmidt-Rodenkirchen, A.; Scharfe, F.; Wolff, F. Mikro-Hohlglaskugeln als Basis energieeffizienter Dämmung von Gebäuden. In HighTechMatBau—Neue Werkstoffe für Urbane Infrastrukturen, Proceedings of the Beiträge der Konferenz für Neue Materialien im Bauwesen, Berlin, Germany, 31 January 2018, 1st ed.; Fraunhofer IRB Verlag: Stuttgart, Germany, 2018; pp. 21–25. ISBN 9783738800821. (In German) [Google Scholar]
- Shahedan, N.F.; Al Bakri Abdullah, M.M.; Mahmed, N.; Kusbiantoro, A.; Tammas-Williams, S.; Li, L.-Y.; Aziz, I.H.; Vizureanu, P.; Wysłocki, J.J.; Błoch, K.; et al. Properties of a New Insulation Material Glass Bubble in Geo-Polymer Concrete. Materials 2021, 14, 809. [Google Scholar] [CrossRef] [PubMed]
- Martín, C.M.; Scarponi, N.B.; Villagrán, Y.A.; Manzanal, D.G.; Piqué, T.M. Pozzolanic activity quantification of hollow glass microspheres. Cem. Concr. Compos. 2021, 118, 103981. [Google Scholar] [CrossRef]
- Schneider, M. The cement industry on the way to a low-carbon future. Cem. Concr. Res. 2019, 124, 105792. [Google Scholar] [CrossRef]
- Bullard, J.W.; Jennings, H.M.; Livingston, R.A.; Nonat, A.; Scherer, G.W.; Schweitzer, J.S.; Scrivener, K.L.; Thomas, J.J. Mechanisms of cement hydration. Cem. Concr. Res. 2011, 41, 1208–1223. [Google Scholar] [CrossRef]
- Shi, C.; Jiménez, A.F.; Palomo, A. New cements for the 21st century: The pursuit of an alternative to Portland cement. Cem. Concr. Res. 2011, 41, 750–763. [Google Scholar] [CrossRef]
- Hanein, T.; Galvez-Martos, J.-L.; Bannerman, M.N. Carbon footprint of calcium sulfoaluminate clinker production. J. Clean. Prod. 2018, 172, 2278–2287. [Google Scholar] [CrossRef] [Green Version]
- Winnefeld, F.; Lothenbach, B. Hydration of calcium sulfoaluminate cements—Experimental findings and thermodynamic modelling. Cem. Concr. Res. 2010, 40, 1239–1247. [Google Scholar] [CrossRef]
- Na, O.; Kim, K.; Lee, H.; Lee, H. Printability and Setting Time of CSA Cement with Na2SiO3 and Gypsum for Binder Jetting 3D Printing. Materials 2021, 14, 2811. [Google Scholar] [CrossRef] [PubMed]
- Chaunsali, P.; Mondal, P. Influence of Calcium Sulfoaluminate (CSA) Cement Content on Expansion and Hydration Behavior of Various Ordinary Portland Cement-CSA Blends. J. Am. Ceram. Soc. 2015, 98, 2617–2624. [Google Scholar] [CrossRef]
- 3M. Datasheet 3M Glass Bubbles K Series, S Series and iM Series. Available online: https://multimedia.3m.com/mws/media/91049O/3m-glass-bubbles-k-s-and-im-series.pdf (accessed on 2 December 2021).
- DIN EN 196-1:2016-11; Prüfverfahren für Zement_-Teil_1: Bestimmung der Festigkeit; Deutsche Fassung EN_196-1:2016; Beuth Verlag GmbH: Berlin, Germany, 2016.
- DIN 66137-2:2019-03; Bestimmung der Dichte fester Stoffe_-Teil_2: Gaspyknometrie; Beuth Verlag GmbH: Berlin, Germany, 2019.
- Doebelin, N.; Kleeberg, R. Profex: A graphical user interface for the Rietveld refinement program BGMN. J. Appl. Crystallogr. 2015, 48, 1573–1580. [Google Scholar] [CrossRef] [Green Version]
- Lemmon, E.W.; Jacobsen, R.T. Viscosity and Thermal Conductivity Equations for Nitrogen, Oxygen, Argon, and Air. Int. J. Thermophys. 2004, 25, 21–69. [Google Scholar] [CrossRef]
- Jeong, Y.; Hargis, C.W.; Kang, H.; Chun, S.-C.; Moon, J. The Effect of Elevated Curing Temperatures on High Ye’elimite Calcium Sulfoaluminate Cement Mortars. Materials 2019, 12, 1072. [Google Scholar] [CrossRef] [Green Version]
- Trauchessec, R.; Mechling, J.-M.; Lecomte, A.; Roux, A.; Le Rolland, B. Impact of anhydrite proportion in a calcium sulfoaluminate cement and Portland cement blend. Adv. Cem. Res. 2014, 26, 325–333. [Google Scholar] [CrossRef]
- Muniz, F.T.L.; Miranda, M.A.R.; Morilla Dos Santos, C.; Sasaki, J.M. The Scherrer equation and the dynamical theory of X-ray diffraction. Acta Cryst. A 2016, 72, 385–390. [Google Scholar] [CrossRef] [PubMed]


| Element | CaO | Al2O3 | SO3 | SiO2 | Fe2O3 | TiO2 | MgO | K2O |
|---|---|---|---|---|---|---|---|---|
| Composition (wt.%) | 45.7 | 23.5 | 19.5 | 6.3 | 2.4 | 1.3 | 1.0 | 0.3 |
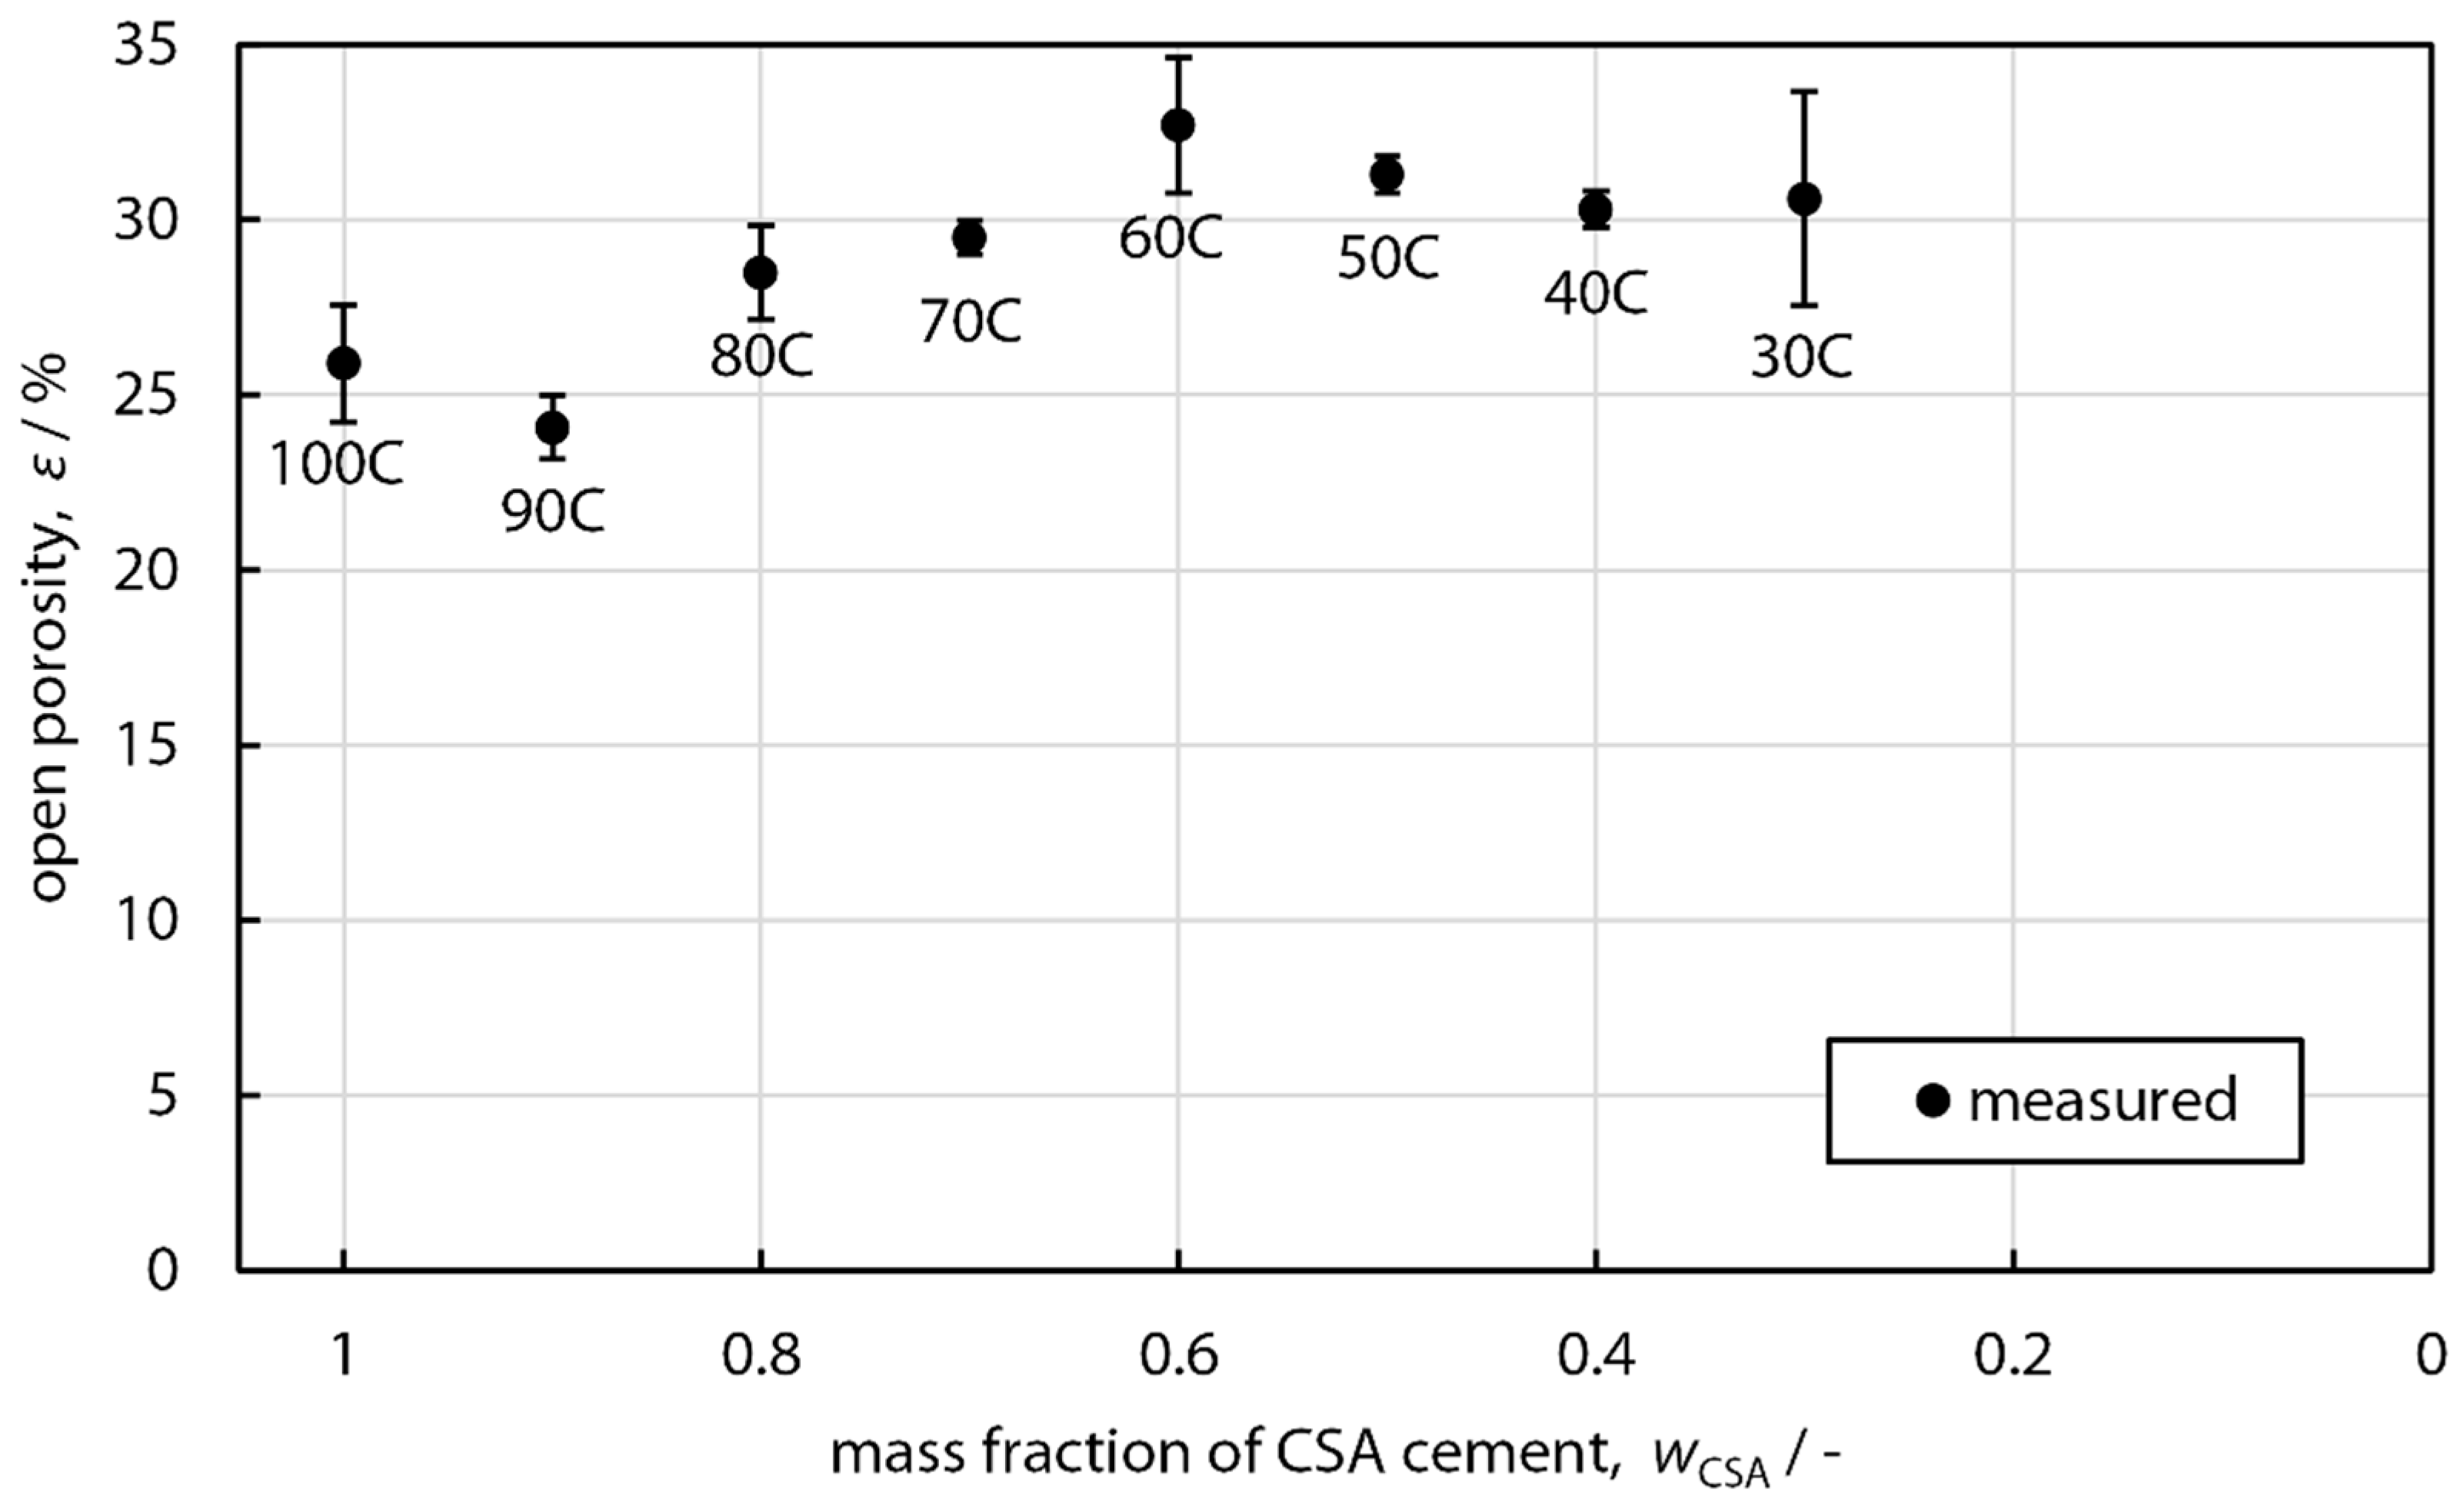
| Specimen | 100C | 90C | 80C | 70C | 60C | 50C | 40C | 30C |
|---|---|---|---|---|---|---|---|---|
| CSA cement in wt.% of dry matter | 100% | 90% | 80% | 70% | 60% | 50% | 40% | 30% |
| HGMSs in wt.% of dry matter | 0% | 10% | 20% | 30% | 40% | 50% | 60% | 70% |
| water/cement ratio | 0.45 | 0.7 | 1.3 | 1.8 | 1.9 | 2.4 | 2.75 | 3 |
| Specimen | 100C | 90C | 80C | 70C | 60C | 50C | 40C | 30C |
|---|---|---|---|---|---|---|---|---|
| ϕair (vol.%) | 25.9 | 24.1 | 28.5 | 29.5 | 32.7 | 31.3 | 30.3 | 30.6 |
| ϕHGMS (vol.%) | 0 | 48.3 | 57.1 | 61.4 | 61.5 | 64.6 | 66.9 | 67.6 |
| ϕCSA (vol.%) | 74.1 | 27.6 | 14.4 | 9.1 | 5.8 | 4.1 | 2.8 | 1.8 |
| Density (g·cm−3) | 1.63 ± 0.02 | 0.82 ± 0.01 | 0.44 ± 0.01 | 0.26 ± 0.02 | 0.23 ± 0.01 | 0.19 ± 0.02 | 0.16 ± 0.01 | 0.13 ± 0.01 |
| Specimen | 100C | 90C | 80C | 70C | 60C | 50C | 40C | 30C |
|---|---|---|---|---|---|---|---|---|
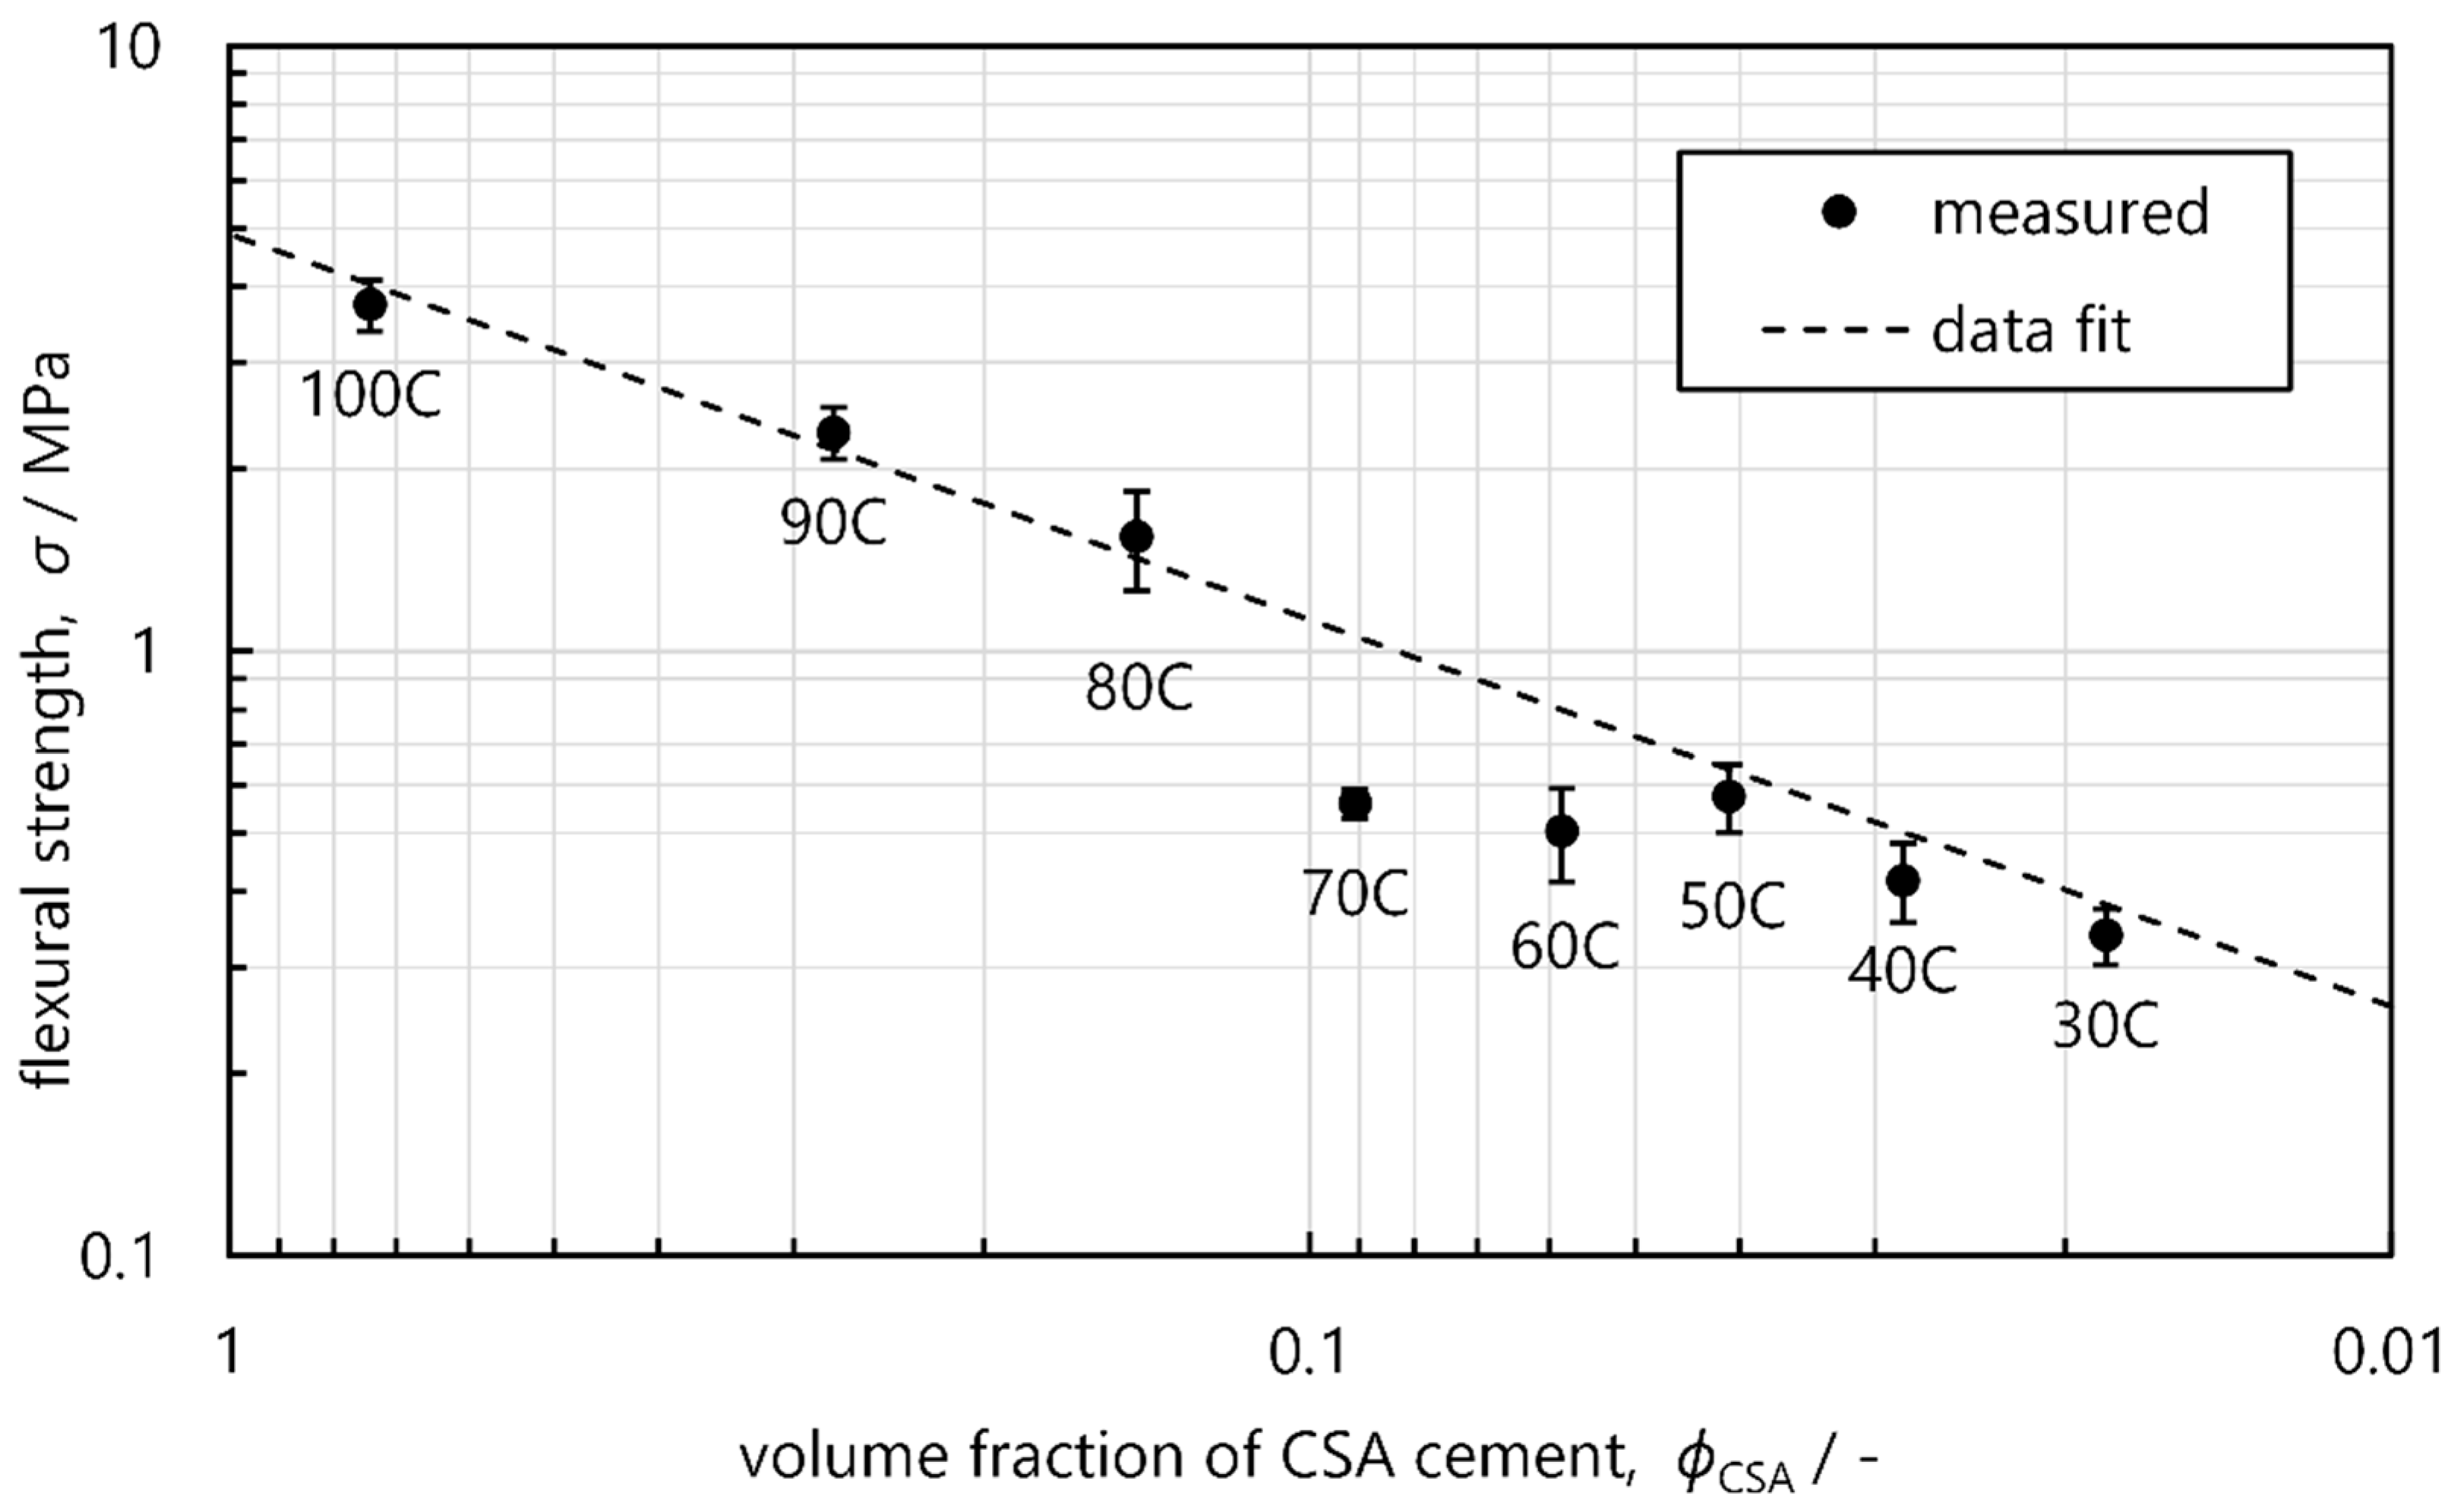
| Flexural strength (MPa) | 3.74 ± 0.36 | 2.30 ± 0.22 | 1.54 ± 0.29 | 0.56 ± 0.03 | 0.50 ± 0.09 | 0.57 ± 0.07 | 0.42 ± 0.06 | 0.34 ± 0.03 |
| Thermal conductivity (W·m−1K−1) | 0.833 ± 0.024 | 0.186 ± 0.003 | 0.073 ± 0.002 | 0.072 ± 0.007 | 0.055 ± 0.001 | 0.048 ± 0.001 | 0.046 ± 0.001 | 0.043 ± 0.001 |
Publisher’s Note: MDPI stays neutral with regard to jurisdictional claims in published maps and institutional affiliations. |
© 2022 by the authors. Licensee MDPI, Basel, Switzerland. This article is an open access article distributed under the terms and conditions of the Creative Commons Attribution (CC BY) license (https://creativecommons.org/licenses/by/4.0/).
Share and Cite
Zelder, S.; Rosin, A.; Helling, D.; Gerdes, T.; Scharfe, F.; Schafföner, S. Mineral Composite Plaster Containing Hollow Glass Microspheres and CSA Cement for Building Insulation. Appl. Sci. 2022, 12, 1152. https://doi.org/10.3390/app12031152
Zelder S, Rosin A, Helling D, Gerdes T, Scharfe F, Schafföner S. Mineral Composite Plaster Containing Hollow Glass Microspheres and CSA Cement for Building Insulation. Applied Sciences. 2022; 12(3):1152. https://doi.org/10.3390/app12031152
Chicago/Turabian StyleZelder, Stefan, Andreas Rosin, Dominik Helling, Thorsten Gerdes, Friedbert Scharfe, and Stefan Schafföner. 2022. "Mineral Composite Plaster Containing Hollow Glass Microspheres and CSA Cement for Building Insulation" Applied Sciences 12, no. 3: 1152. https://doi.org/10.3390/app12031152
APA StyleZelder, S., Rosin, A., Helling, D., Gerdes, T., Scharfe, F., & Schafföner, S. (2022). Mineral Composite Plaster Containing Hollow Glass Microspheres and CSA Cement for Building Insulation. Applied Sciences, 12(3), 1152. https://doi.org/10.3390/app12031152