Abstract
Polyurethane foam (PUF) is an exceptionally adaptable product that has a variety of applications—it can be found almost everywhere. Due to such high utilization, the amount of polyurethane foam waste generated each year is growing over time. Rebonding polyurethane foam waste is a suitable way to progress towards a circular economy. In this paper, the prospect of using rebonded polyurethane foam (RPUF) in noise control applications is examined. An experimental study was carried out on RPUFs with various thicknesses and densities. The sound absorption coefficients at normal incidence and air resistivity were measured. The five-parameter Johnson-Champoux-Allard (JCA) model was adopted for the simulation of the porous layer. The remaining unknown parameters of the JCA model were estimated by inverse acoustic characterization based on fitting the transfer matrix method (TMM) model of an unbounded porous layer with rigid backing to the experimentally obtained sound absorption coefficients. Furthermore, sound absorption coefficients were calculated for a wide range of sample thicknesses, as well as for different air gap thicknesses between the wall and the porous layer. For some of the considered RPUFs, a sound absorption coefficient above 0.8 was achieved over a wide frequency range.
1. Introduction
Extremely large amounts of polyurethane foam are produced. Production reached 15 million tons in 2020 [1] and this figure is forecasted to grow, reaching roughly 20 million tons in 2025. This fact actualizes the need for careful management of substantial polyurethane foam waste and engagement with recycling/reuse practices as much as possible. This is not an easy task. The main ingredients of this large group of polymers are diisocyanate and polyols, which come from petroleum stocks, and the urethane bond that is created is considered non-degradable [2]. Consequently, most polyurethane waste ends up in landfills [3].
However, due to the huge emphasis on environmental concerns in recent years, enormous scientific effort has been put into all aspects of polyurethane recycling/reuse. Bio-based polyurethanes are drawing to attention as well [4] because they can be degraded very easily without the need for high temperatures and complicated reagents. New routes for the production of diisocyanate-free polyurethane have also been proposed [5,6]. Mainly, three different methods exist for polyurethane recycling: mechanical recycling, chemical recycling, and energy recovery [7]. By far, mechanical recycling is the least demanding and most effective recycling process [3].
Mechanical reprocessing, i.e., rebonding of PU foams, is the most commonly used mechanical recycling method. This process consists of connecting shredded polyurethane foam waste pieces together using a binder.
Since various polyurethane foams, both flexible and rigid, have been proven to have a high vibroacoustic potential [8,9,10,11,12,13,14], RPUFs can serve in sound adsorption applications. Several studies have investigated their noise abutment application, but further research is needed. Del Rey et al. [15,16] performed experimental characterization and empirical modelling on recycled polyurethane foams with different densities. Biskupicova et al. [17] conducted an experimental study on the sound absorption of recycled polyurethane foams with different thicknesses and also investigated the effect of included air gap. Atienzar-Navarro et al. [18] experimentally investigated the sound absorption coefficients of recycled polyurethane foams with and without perforation, as well as the effect of attached fabric to the sample. Sabbagh et al. [19] carried out an experimental investigation on RPUFs under a diffuse sound field in a reverberation chamber. Parikh et al. [20] conducted impedance tube absorption testing on floor coverings in combination with different materials as the underpad, among which RPUFs gave the best performance. Hall and Bougdah [10,21] investigated the sound insulation impact of RPUFs through field measurements and static and dynamic tests. Nering et al. [22] also studied the vibroacoustic parameters of RPUFs for their application in flooring systems.
This paper aims to expand the knowledge of sound absorption by RPUFs through experimental and numerical investigation. RPUFs with various densities and thicknesses were produced by a local manufacturer for the purpose of the experimental study. Cylindrical specimens were cut from the fabricated RPUFs and subjected to impedance tube and airflow tests. The nature of the manufacturing process gives a somewhat uneven density distribution, and a variation of ±10% can occur between samples.
For the simulation of the porous layer, the widely used Johnson-Champoux-Allard (JCA) model was adopted. For the JCA model, five non-acoustic parameters need to be determined, namely: air flow resistivity (σ), porosity (ϕ), tortuosity (α∞), thermal characteristic length (Λ′), and viscous characteristic length (Λ). The impedance tube phenomenon was simulated with a porous layer of infinite extent in contact with a semi-infinite fluid on one side and a rigid wall on the other. The sound absorption of such a system under a sound plane wave impinging normally on the porous layer was represented by the well-known transfer matrix method (TMM). By adjusting the parameters within the TMM model to fit the measured sound absorption coefficients, the tortuosity, thermal characteristic length, and viscous characteristic length were estimated. Furthermore, both the transfer matrix method (TMM) and finite element method (FEM) were used to investigate the sound absorption behavior of different sample thicknesses and different air gap thicknesses between the rigid wall and the porous layer. Sound absorption coefficients above 0.8 were achieved over a wide frequency range for some of the RPU foams considered. Hence, sound absorption is one possible application for the reuse of polyurethane waste, which is also a very low-cost solution.
2. Materials and Methods
2.1. Rebonded Polyurethane Foam
Rebonded polyurethane foam is a product of the mechanical reprocessing of shredded polyurethane foam waste pieces connected together by a binder. In this particular case, the shredded pieces were obtained from scrap flexible polyurethane foam with a density of 18–40 kg/m3 and a width varying from 1 to 2.5 cm. The pieces were coated/mixed in a tank with an MDI-based binder. Then, the mixture was placed in a rectangular mould with base dimensions of 160 cm × 200 cm. In the mould, the foam was compressed with a piston until the required density was achieved. Next, steam at 200–250 °C was used to cure the binder. Subsequently, the RPUF was removed from the mould and allowed to dry for at least 24 h.
As a result of this production process, the resulting RPUFs were inhomogeneous, as shown in Figure 1. The density of the specimens was obtained based on measurements of total weight and the dimensions of the cylinders.
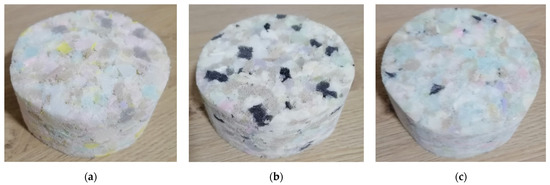
Figure 1.
RPUF samples with different densities for experimental testing: (a) ρ = 40 kg/m3; (b) ρ = 55 kg/m3; (c) ρ = 80 kg/m3.
A polyurethane foam manufacturer, for the purpose of the experimental study, produced three different densities of RPUFs: ρ = 40 kg/m3, ρ = 55 kg/m3, and ρ = 80 kg/m3. Cylinders with a diameter of 10 cm and three different thicknesses, h = 4.5 cm, h = 7 cm, and h = 9.5 cm, were cut from the RPUFs at each density.
2.2. Experimental Measurement of Airflow Resistivity and Sound Absorption Coefficient
For the manufactured RPUF samples, the airflow resistivity and normal sound absorption coefficient were obtained using standardized experimental methods.
Using the device shown in Figure 2, the flow resistivity was measured at un alternating air flow that was generated by a piston at a low frequency (2.0 Hz), following ISO 9053 [23,24]. This parameter was one of the required parameters in the adopted JCA model to characterize the absorption of the porous material.
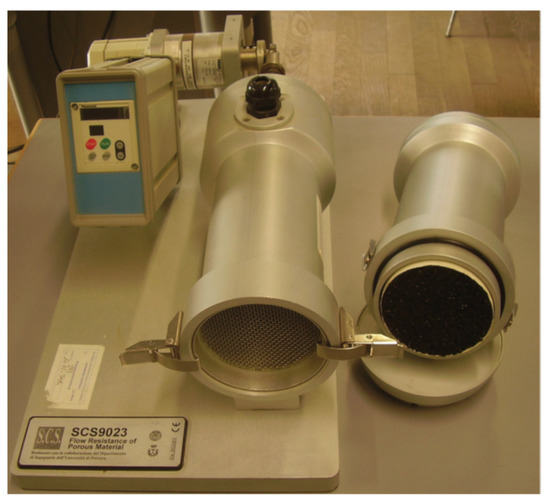
Figure 2.
Device for measuring flow resistivity at the acoustic laboratory of the University of Campania “Luigi Vanvitelli”, Department of Architecture and Industrial Design.
The impedance tube measurement of the sound absorption coefficients was performed using standardized method ISO 10534-2 [25]. For this purpose, an impedance tube with two microphones was used, as shown in Figure 3 [24]. Plane waves were generated by a specially designed speaker mounted on one side of the tube. On the opposite side of the noise source, the sample was mounted with rigid termination. The diameter of the considered impedance tube was 10 cm, which implies that the maximum measurement frequency was 2000 Hz, while the distance between the measurement microphones was 2.5 cm, and therefore the lower measurement limit was 200 Hz. The length of the tube was 57 cm. The technique was consolidated; therefore, there were no possible measurement errors. The specimens were cut to leave no cavities around the wetted perimeter, thus preventing any band gap errors.
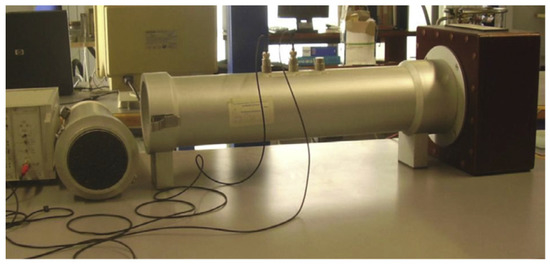
Figure 3.
Impedance tube for measuring the normal sound absorption coefficients at the acoustic laboratory of the University of Campania “Luigi Vanvitelli”, Department of Architecture and Industrial Design.
2.3. Transfer Matrix Method
The transfer matrix method is a well-established method for predicting acoustic properties, including the absorption coefficients of laterally infinite multilayered assembly, considering plane wave propagation. The layers can be of different natures: solid, fluid, poroelastic, etc., and each is represented by a specific transfer matrix. The size of the matrix depends on the number of quantities that represent the acoustic field within the layer. For the poroelastic layer, the number of quantities is 6: the velocities and stresses of the porous frame (ν1s, ν3s, σ33s, and σ13s) and of the fluid (ν3f, and σ33f). For the fluid layer, the transfer matrix is 2 × 2 since the acoustic field is described with the pressure p and the component of the fluid velocity ν3f. The transfer matrices relate the variables from both sides of the considered layer:
where i is the considered layer.
V(Mi) = [T]V(Mi+1)
To simulate the sound absorption phenomenon in the impedance tube, a porous layer of infinite extent was modelled in contact with a semi-infinite fluid on one side and a rigid wall on the other side. Sound plane waves are incident normally on the porous layer, as shown in Figure 4a. On the right side, the condition of rigid wall end was introduced, and the fluid-porous continuum condition was applied on the left side.
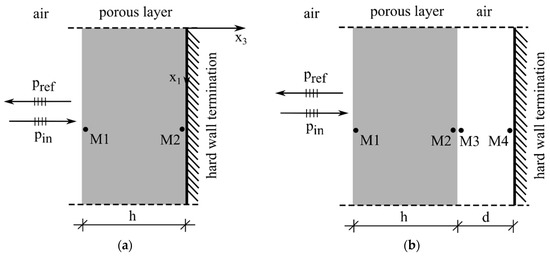
Figure 4.
(a) TMM model of porous layer with rigid backing; (b) TMM model with porous layer and included air gap between the wall and the porous material.
In order to investigate the effect of introducing an air layer between the wall and the porous material, as shown in Figure 4b, the fluid transfer matrix was introduced into the global transfer matrix using a suitable coupling transfer matrix and a hard wall termination was applied to the fluid layer.
The surface impedance can be determined from the assembled transfer matrix; hence, the reflection coefficient and absorption coefficient. Details on the transfer matrix representation and the calculation of the acoustic indicators can be found in ref. [26].
For the bulk modulus of the air saturating the porous medium, the Champoux–Allard model was adopted:
where α′(ω) is
The model by Johnson et al. was used for the coefficient G(ω), which is required to calculate the modified Biot’s densities to obtain the complex wave numbers of the waves that propagate in a porous material [24]:
where P0 is the barometric pressure, ω is the angular frequency, and γ, η, B2, ρ0 are specific heat ratio, dynamic viscosity, Prandtl number, and density of the saturating air, respectfully.
Since the Young’s modulus, E, of the foams was not obtained, the rigid limit was considered, i.e., E was set sufficiently large so that the porous layer behaved as a rigid.
2.4. Inverse Acoustic Characterization Using TMM
For the purpose of predicting the sound absorption coefficient (α) using the adopted TMM model (Figure 4a), four additional parameters were required in addition to the measured airflow resistivity to characterize the porous layer based on the JCA model: porosity (ϕ), tortuosity (α∞), thermal characteristic length (Λ′), and viscous characteristic length (Λ). Porosity was estimated from Equation (5), where the solid density of the polyurethane matrix was 1160 kg/m3 [27].
The other parameters were obtained by inverse characterization using the least squares method: the TMM model was fitted to experimentally obtained sound absorption coefficients by minimizing the error between the experimental data and the theoretically predicted data:
where N is the total number of computed frequencies. The process of optimization was performed on the samples with a thickness of 7 cm and the same values per density were adopted. The inverse characterization was conducted for frequencies above 650 Hz. This limit was set in accordance with ref. [28], because the five-parameter JCA model used in the study is not very precise at low frequencies and with this limit some imprecise data at lower frequencies associated with the experimental set-up is also avoided.
The number of the considered frequencies in the optimization process was N = 721 and they were equidistantly distributed in the frequency region 650–2000 Hz. Several constrains were imposed in the process of optimization:
The technique of inverse acoustic characterization using phenomenological models is not new in the field of applied acoustics. Indeed, many papers have been written on this topic. It is used when it is not possible to obtain direct information on the acoustic characteristics of materials due to possible measurement difficulties; thus, phenomenological models consider the wave propagation inside pores at a microscopic level and the transfer matrix method was employed for calculation of the sound absorption coefficient [28,29,30,31,32,33,34,35].
2.5. Finite Element Method
The finite element method was employed to further investigate the sound absorption coefficients using the obtained 5 intrinsic parameters for each RPUF density considered, in parallel with the transfer matrix method. A 3D finite element model of the impedance tube and the considered RPUF specimen, with their dimensions, was created and frequency domain analysis was performed using the pressure acoustics module of Comsol Multiphysics software, as shown in Figure 5 [36].
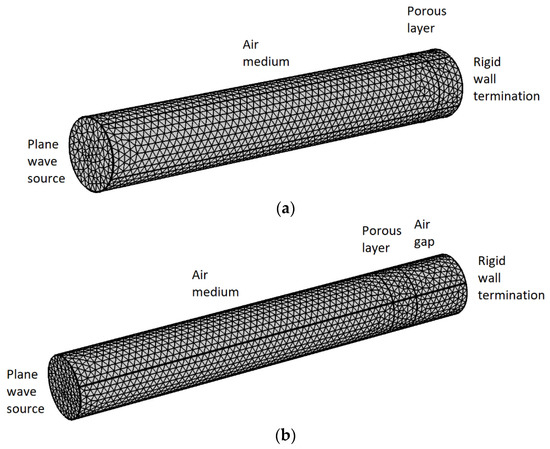
Figure 5.
3D FEM model—discretization: (a) Impedance tube with porous layer backed with rigid wall; (b) Impedance tube with air gap between the porous layer and the rigid wall termination.
Free tetrahedral mesh was generated for the air medium, as well as for the porous layer. The maximal size of the mesh elements was less than 1/6 of the lowest considered acoustic wavelength. The incident sound field was applied as a boundary pressure wave with amplitude 1 Pa on the inlet boundary and all the other boundaries were considered as sound hard boundaries. The porous layer was represented with the Johnson-Champoux-Allard (JCA) rigid model. The surface impedance was obtained, followed by the reflection coefficients and absorption coefficients.
3. Results and Discussion
The airflow resistivity values experimentally obtained using the alternate airflow meter for all considered densities are shown in Table 1. The lowest value of the flow resistivity, σ = 3800 Ns/m4, was obtained for specimens with a density ρ = 40 kg/m3, while the highest value, σ = 10,200 Ns/m4, was obtained for specimens with a density ρ = 80 kg/m3. Airflow resistivity is one of the 5 parameters needed for a simulation of the porous layer.

Table 1.
Experimentally obtained values for the flow resistivity of the considered RPUFs.
The curves of the measured sound absorption coefficients in the impedance tube, obtained as an average of three measurements, are depicted in Figure 6. When the thickness was increased, there was very good improvement in the low to middle frequencies. This was due to the shift of the first peak towards lower frequencies. Unfortunately, the drawback of this phenomenon was a reduction in the sound absorption coefficient for some of the higher frequencies. Thus, the sound absorption coefficients for the RPUF with density ρ = 40 kg/m3 and thickness h = 4.5 cm were higher than those of samples with h = 7 cm and h = 9.5 cm in the region 1515–1730 Hz. This occurred in a wider frequency region (1295–1740 Hz) for the RPUF with ρ = 55 kg/m3 and was even more pronounced (1030–1650 Hz) for the RPUF with ρ = 80 kg/m3. Although there was a decrease in the sound absorption coefficient in these regions, the values remained above 0.8, which represented good sound absorption. Additionally, this effect will be less pronounced for a diffuse sound field. One way to improve the sound absorption coefficient is by creating a layered composite acoustic absorber that can be optimized in both the low and high frequency regions [37].
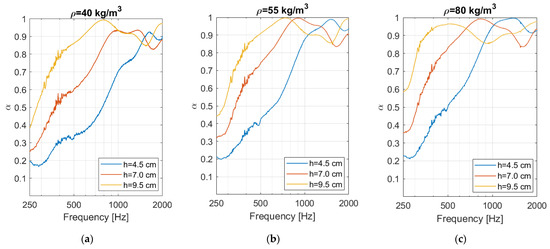
Figure 6.
The measured sound absorption coefficients (average of 3 measurements).
For the frequency of 500 Hz, considering the RPUF with density ρ = 40 kg/m3, the sound absorption coefficients were 0.33, 0.60, and 0.86 for thicknesses h = 4.5 cm, h = 7 cm, and h = 9.5 cm, respectfully. The sound absorption coefficients for the RPUF with density ρ = 55 kg/m3 were 0.42, 0.74, and 0.91 and the sound absorption coefficients were 0.50, 0.83, and 0.96 for the RPUF with density ρ = 80 kg/m3 for thicknesses h = 4.5 cm, h = 7 cm, and h = 9.5 cm, respectfully. In other words, for all specimens with thickness h = 9.5 cm, for f = 500 Hz, a sound absorption coefficient above 0.8 was achieved, as well as for the RPUF with density ρ = 80 kg/m3 and thickness h = 7 cm.
For the RPUF with density ρ = 40 kg/m3, a sound absorption coefficient above 0.8 was achieved after the frequencies 410 Hz, 740 Hz, and 1330 Hz for thicknesses h = 9.5 cm, h = 7.0 cm, and h = 4.5 cm, respectfully. Similarly, for the RPUF with density ρ = 55 kg/m3, a sound absorption coefficient above 0.8 was achieved after the frequencies 380 Hz, 575 Hz, and 910 Hz and after the frequencies 310 Hz, 470 Hz, and 820 Hz for the RPUF with density ρ = 80 kg/m3. For higher frequencies than those stated, the sound absorption coefficients ranged between 0.8 and 1. The efficiency of the specimen with h = 95 mm and ρ = 80 kg/m3 stood out in particular, since its sound absorption coefficient for 250 Hz was near 0.6 and all of the sound absorption coefficients were in the range 0.85–1 after 325 Hz.
The porosity of the specimens was calculated using Equation (5) and the estimated intrinsic parameters (α∞, Λ, and Λ′) from the inverse acoustic characterization performed on specimens with thickness h = 70 mm, for all considered densities, are given in Table 2. The same values were adopted for the other thicknesses with the same density.

Table 2.
Estimated intrinsic parameters from inverse acoustic characterization.
Comparisons between the experimental results using the transfer matrix method and the finite element method are shown in Figure 7, Figure 8 and Figure 9. The predicted results compared well with the experimental results for samples with thickness h = 7 cm. Although the optimization was performed for frequencies above 650 Hz, there was a reasonable match even for some of the lower frequencies, which was a good indicator of the quality of the obtained parameters [28].
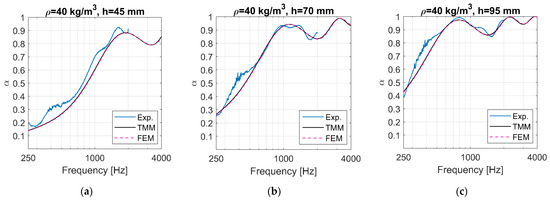
Figure 7.
Comparisons between experimental results, TMM and FEM for RPU foams with ρ = 40 kg/m3.
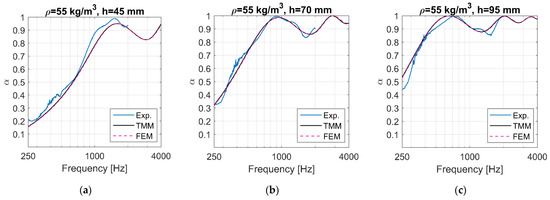
Figure 8.
Comparisons between experimental results, TMM and FEM for RPU foams with ρ = 55 kg/m3.
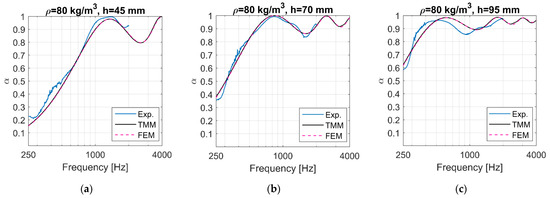
Figure 9.
Comparisons between experimental results, TMM and FEM for RPU foams with ρ = 80 kg/m3.
The prediction for samples with thickness h = 45 mm and h = 95 mm was more successful for some cases than others. The prediction performance may be evaluated through the lowest value of the function F, which was estimated using Equation (6) for N = 721 frequencies in the frequency region from 650 to 2000 Hz. For the RPUF with density ρ = 40 kg/m3, the Fmin values were 1.93, 0.26, and 0.24 for thicknesses h = 4.5 cm, h = 7.0 cm, and h = 9.5 cm, respectfully. For density ρ = 55 kg/m3, the Fmin values were 1.62, 0.23, and 0.43 for thicknesses h = 4.5 cm, h = 7.0 cm, and h = 9.5 cm, respectfully. For density ρ = 80 kg/m3, the Fmin values were 0.54, 0.19, and 0.99 for thicknesses h = 4.5 cm, h = 7.0 cm, and h = 9.5 cm, respectfully. According to the results, the highest error occurred for the thickness h = 4.5 cm and densities ρ = 40 kg/m3 and ρ = 60 kg/m3 and for the thickness h = 9.5 cm and density ρ = 80 kg/m3.
For all the considered samples with thickness h = 4.5 cm, the prediction mainly underestimated the sound absorption coefficients. For thickness h = 9.5 cm and density ρ = 40 kg/m3, the estimated sound absorption coefficients corresponded fairly well to the measured values in the optimization region. For thickness h = 9.5 cm and density ρ = 55 kg/m3, they were overestimated, and for ρ = 80 kg/m3, the behavior was somewhat shifted. Some possible reasons for the discrepancies include the variation of 10% between the densities of the samples and hence other parameters, the inhomogeneity of the rebonded polyurethane foam, and some resonance effects.
Furthermore, TMM and FEM were used to predict the sound absorption coefficients for a wider range of thicknesses. The sound absorption coefficients for the thicknesses h = 2 cm, h = 4 cm, h = 6 cm, h = 8 cm, and h = 10 cm are shown in Figure 10. The results obtained by TMM and FEM matched. As expected, the thickness affected the sound absorption efficiency in the low to mid frequencies. For the RPU foam with thickness h = 2 cm and density ρ = 40 kg/m3, a sound absorption coefficient above 0.8 was not achieved in the considered frequency region and for ρ = 80 kg/m3, a sound absorption coefficient above 0.8 was achieved after 2630 Hz, i.e., even for the highest considered density, the sample with thickness h = 2 cm had low sound absorption.
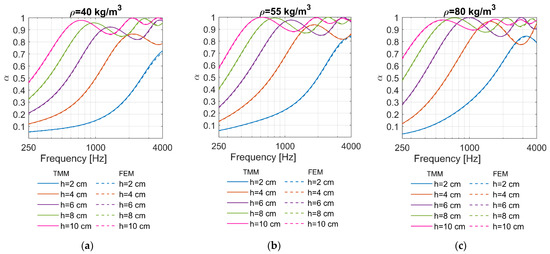
Figure 10.
Calculated sound absorption coefficients for RPU foams with different thicknesses.
Observing the samples with thicknesses of 6 and 8 cm, for the RPUF with density ρ = 40 kg/m3, the shift of the peak’s maximum was from 1355 to 960 Hz (∆f = 395 Hz), i.e., from λ/h = 4.22 to λ/h = 4.47, where λ = 343/f is the acoustic wavelength. For RPUF with density ρ = 55 kg/m3, increasing the thickness from 6 to 8 cm moved the maximum of the peak from 1135 to 800 Hz (∆f = 335 Hz), i.e., λ/h = 5.04 to λ/h = 5.36. For ρ = 80 kg/m3 the shift was from 995 to 730 Hz (∆f = 265 Hz), i.e., from λ/h = 5.75 to λ/h = 5.87. The coefficient λ/h for the considered RPUFs increased with increasing density and thickness and became higher than 4, i.e., the speed of sound in the porous material became lower than the speed of sound in air [17]. In addition, the shifting range decreased with increasing density.
In order to estimate the frequency after which the sound absorption coefficient became larger than 0.8, f0.8, for a given thickness [m] and density [kg/m3] of the RPUF, a polynomial surface model with x degree of 4 and y degree of 2 was fitted to the predicted data for a range of thicknesses h = 0.04–0.13 m and considered densities ρ = 40 kg/m3, ρ = 55 kg/m3, and ρ = 80 kg/m3. The root mean square error for the fitted polynomial surface was RMSE = 16.1. The results are graphically presented in Figure 11. The densities ρ = 50 kg/m3, ρ = 60 kg/m3, and ρ = 70 kg/m3 are included. This graph can help to quickly estimate the starting frequency of good sound absorption for the considered RPUFs. After f0.8, the sound absorption coefficients ranged between 0.8 and 1 for all thicknesses, except for h = 4 cm where a slight drop below 0.8 occurred in a very limited frequency region.
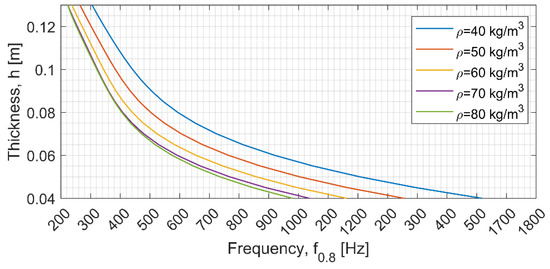
Figure 11.
Predicted relationship between thickness, h, density, ρ, and frequency after which the sound absorption coefficient begins to become larger than 0.8, f0.8, for the considered RPU foams.
According to Figure 11, in order to achieve a sound absorption coefficient greater than 0.8, starting from the 500 Hz, thicknesses of h0.8 = 6.7 cm, h0.8 = 6.8 cm, h0.8 = 7.3 cm, h0.8 = 8.1 cm, and h0.8 = 9.1 cm were required for ρ = 80 kg/m3, ρ = 70 kg/m3, ρ = 60 kg/m3, ρ = 50 kg/m3, and ρ = 40 kg/m3, respectfully. This result has a logical sequence in relation to the obtained measurements (Figure 6) since the sound absorption coefficient was 0.83 for ρ = 80 kg/m3 and h = 7 cm, and 0.86 for ρ = 40 kg/m3 and h = 9.5 cm. The ratio of the acoustic wavelength of 500 Hz and needed thickness h0.8, λ/h0.8, ranged between 10.24 and 7.54. Hence for lower densities, i.e., for 60 kg/m3 and lower, the well-known criterion h~λ/10 will not be sufficient to achieve a sound absorption coefficient of 0.8 for 500 Hz. The predicted curves for ρ = 70 kg/m3 and ρ = 80 kg/m3 converged above thickness h = 7.5 cm.
The effect of including an air gap between the porous layer and the wall was also investigated. Four different thicknesses of the air gap were considered, d = 0 cm, d = 5 cm, d = 8 cm, and d = 10 cm. The introduction of the air gap led to improved sound absorption in the low to mid frequency range (Figure 12, Figure 13 and Figure 14), with very similar results as increasing the thickness. The peak’s maximum shifted towards lower frequencies; thus, the improvement was at the expense of some sound absorption in the higher frequencies.
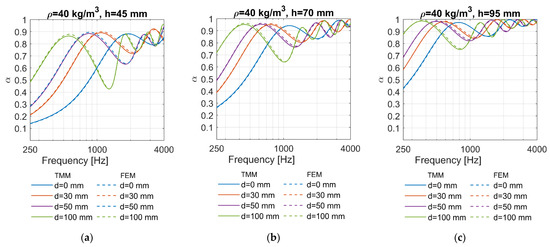
Figure 12.
Sound absorption coefficients for different air gap thicknesses, ρ = 40 kg/m3.
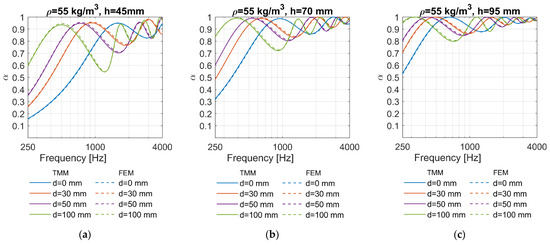
Figure 13.
Sound absorption coefficients for different air gap thicknesses, ρ = 55 kg/m3.
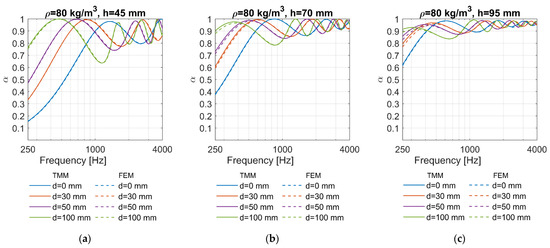
Figure 14.
Sound absorption coefficients for different air gap thicknesses, ρ = 80 kg/m3.
For example, at 500 Hz, h = 7 cm, and ρ = 40 kg/m3, the sound absorption coefficient increased 66% when an air gap of d = 5 cm was introduced. For ρ = 55 kg/m3, the sound absorption coefficient increased 38% and for ρ = 80 kg/m3, the absorption coefficient increased 21%. However, at 1000 Hz, the sound absorption coefficients decreased when the air gap is introduced.
For the RPUF with thickness h = 7 cm and density ρ = 40 kg/m3, the introduction of air gap d = 5 cm shifted the peak’s maximum from 1120 to 630 Hz (∆f = 490 Hz). This shifted peak created a region from 405 to 1160 Hz where the sound absorption coefficients were above 0.8. For the RPUF with thickness h = 7 cm and density ρ = 55 kg/m3, the introduction of air gap d = 5 cm shifted the peak’s maximum from 950 to 540 Hz (∆f = 410 Hz). The lowest frequency above which the sound absorption coefficient was above 0.8 was 328 Hz, and the value dropped to 0.80 at 1130 Hz. For the RPUF with thickness h = 7 cm and density ρ = 80 kg/m3, the introduction of air gap d = 5 cm shifted the peak’s maximum from 840 to 510 Hz ((∆f = 330 Hz). The lowest frequency above which the sound absorption coefficient was above 0.8 was 280 Hz, and the value dropped to 0.84 at 1045 Hz.
A comparison between several absorbing materials that are well established in the field of vibro-acoustics and the studied RPUFs is presented in Figure 15. These materials were measured in different laboratories using the impedance tube procedure. Since the thicknesses of the considered traditional acoustic materials range from 3 to 5 cm, only comparable RPUFs with thicknesses 4.5 cm and 7 cm were plotted. The RPUF with density ρ = 40 kg/m3 and thickness h = 4.5 cm had lower values than the considered traditional acoustic materials, while the RPUFs with thickness h = 9.5 cm at all considered densities had superior values in the low to mid frequency region. Hence, these curves are not shown in Figure 11. Rock wool (RW) with thickness h = 5 cm and density ρ = 40 kg/m3 [38] and melamine foam (MF) with thickness h = 5.1 cm and density ρ = 8.3 kg/m3 [39] had comparable sound absorption coefficients with the RPUF with h = 4.5 cm and ρ = 55 kg/m3 and the RPUF with h = 4.5 cm and ρ = 80 kg/m3. Polyurethane foam (PU) with thickness h = 3 cm and ρ = 40 kg/m3 [40] had comparable values with the RPUF with h = 7 cm and ρ = 40 kg/m3. Glass wool (GW) [41] with h = 5 cm and ρ = 52 kg/m3 was comparable to the RPUF with h = 7 cm and ρ = 55 kg/m3, while the same sound absorption coefficients as GW at the lowest considered frequencies were achieved with the RPUF with h = 7 cm and ρ = 80 kg/m3.
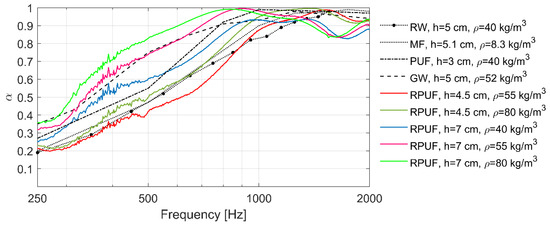
Figure 15.
Comparison of the considered rebonded polyurethane foams with traditional vibro-acoustic materials.
The obtained results demonstrated that rebonded polyurethane foam can provide a good sound-absorbing material over a wide frequency range. This is enhanced by considering the fact that rebonded polyurethane foam is produced from waste, which is a sustainable concept and provides a low-cost product.
As the humidity increases, the volume of the solid fraction of the material increases due to water absorption. An increase in temperature leads to an increase in the volume of the sample. These effects also involve small variations in the acoustic characteristics of the foam, which will be studied in the near future. In thermally harsh environments, these effects can be important. When the water content is controlled within a certain range, the sound absorption performance improves as the water content increases. However, when the water content continues to increase, the sound absorption performance decreases. The reason for this change is related to the water content of the foam. Average porosity increases and density becomes lower with increasing water content. Therefore, reasonable control of the water content is necessary to improve the sound absorption properties of foams [13,42].
4. Conclusions
In this study, the sound absorption properties of rebonded polyurethane foam were considered. Three different densities and three different thicknesses were measured using an impedance tube and airflow device. Sound absorption coefficients above 0.8 were achieved over a wide frequency range for some of the considered RPUFs. The efficiency of the specimen with thickness h = 95 mm and density ρ = 80 kg/m3 was particularly notable, since all sound absorption coefficients were in the range 0.85–1 after 325 Hz.
Based on the experimental results, inverse acoustic characterization was performed using TMM in order to obtain the necessary intrinsic parameters for the JCA model. TMM and FEM were used to further investigate the sound absorption coefficients for different RPU foam thicknesses and for configurations that included an air gap between the porous layer and the wall. The results showed that by increasing the thickness of the RPUF and by introducing an air gap between the porous layer and the wall, the maximum peak of the sound absorption curve shifted towards lower frequencies, hence improving sound absorption in the low to mid frequency range.
A comparison of the sound absorption coefficients of the RPUFs with several traditional acoustic materials showed that the RPUFs had good sound absorption. For example, glass wool with thickness h = 5 cm and density ρ = 52 kg/m3 was comparable to the RPUF with h = 7 cm and ρ = 55 kg/m3, except in the region of 250–350 Hz, where the sound absorption coefficients of GW could be achieved with the RPUF with h = 7 cm and ρ = 80 kg/m3.
Rebonded polyurethane foams represent a good way to reuse polyurethane waste, but it is especially important that the manufacturing process be optimized to achieve properties that are as uniform as possible. Even though there are acoustic materials with better absorption properties than the considered RPUFs, RPUFs can expand the range of choice for acousticians because they are low-cost products designed with sustainability in mind.
Author Contributions
All authors have contributed equally in the research, testing, analysis and writing the paper. All authors have read and agreed to the published version of the manuscript.
Funding
This work was co-funded by FITR—Fund for Innovation and Technology Development of R. Macedonia and M-Akustik dooel, Skopje, Macedonia, and it is a part of the project “Development and production of rubber-steel elements and products from recycled polyurethane foam for protection against noise and vibration”.
Institutional Review Board Statement
Not applicable.
Informed Consent Statement
Not applicable.
Data Availability Statement
Not applicable.
Conflicts of Interest
The authors declare no conflict of interest.
References
- Kiss, G.; Rusu, G.; Bandur, G.; Hulka, I.; Romecki, D. Advances in Low-Density Flexible Polyurethane Foams by Optimized Incorporation of High Amount of Recycled Polyol. Polymers 2021, 13, 1736. [Google Scholar] [CrossRef]
- Chesterman, J.; Zhang, Z.; Ortiz, O.; Goya, R.; Kohn, J. Chapter 18—Biodegradable polymers. In Principles of Tissue Engineering, 5th ed.; Academic Press: London, UK, 2020; pp. 317–342. ISBN 978-0-12-818422-6. [Google Scholar] [CrossRef]
- Kemona, A.; Piotrowska, M. Polyurethane Recycling and Disposal: Methods and Prospects. Polymers 2020, 12, 1752. [Google Scholar] [CrossRef] [PubMed]
- Akindoyo, J.O.; Beg, M.D.H.; Ghazali, S.; Islam, M.R.; Jeyaratnam, N.; Yuvaraj, A.R. Polyurethane Types, Synthesis and Applications—A Review. RSC Adv. 2016, 6, 114453–114482. [Google Scholar] [CrossRef]
- Gama, N.V.; Ferreira, A.; Barros-Timmons, A. Polyurethane Foams: Past, Present, and Future. Materials 2018, 11, 1841. [Google Scholar] [CrossRef] [PubMed]
- Matsumura, S.; Soeda, Y.; Toshima, K. Perspectives for synthesis and production of polyurethanes and related polymers by enzymes directed toward green and sustainable chemistry. Appl. Microbiol. Biotechnol. 2006, 70, 12–20. [Google Scholar] [CrossRef]
- Njuguna, J.K.; Muchiri, P.; Mwema, F.M.; Karuri, N.W.; Herzog, M.; Dimitrov, K. Determination of thermo-mechanical properties of recycled polyurethane from glycolysis polyol. Sci. Afr. 2021, 12, e00755. [Google Scholar] [CrossRef]
- Imai, Y.; Asano, T. Studies of Acoustical Absorption of Flexible Polyurethane Foam. J. Appl. Polym. Sci. 1982, 27, 183–195. [Google Scholar] [CrossRef]
- Gwon, J.G.; Kim, S.K.; Kim, J.H. Sound absorption behavior of flexible polyurethane foams with distinct cellular structures. Mater. Des. 2016, 89, 448–454. [Google Scholar] [CrossRef]
- Hall, R. Impact Sound Insulation of Flooring Systems with Polyurethane Foam on Concrete Floors. Ph.D. Thesis, Sheffield Hallam University, Sheffield, UK, 1999. [Google Scholar]
- Dib, L.; Bouhedja, S.; Amrani, H. Mechanical Parameters Effects on Acoustic Absorption at Polymer Foam. Adv. Mater. Sci. Eng. 2015, 2015, 896035. [Google Scholar] [CrossRef]
- Park, J.H.; Yang, S.H.; Lee, H.R.; Yu, C.B.; Pak, S.Y.; Oh, C.S.; Kang, Y.J.; Youn, J.R. Optimization of low frequency sound absorption by cell size control and multiscale poroacoustics modeling. J. Sound Vib. 2017, 397, 17–30. [Google Scholar] [CrossRef]
- Chen, S.; Jiang, Y.; Chen, J.; Wang, D. The Effects of Various Additive Components on the Sound Absorption Performances of Polyurethane Foams. Adv. Mater. Sci. Eng. 2015, 2015, 317561. [Google Scholar] [CrossRef]
- Yuvaraj, L.; Vijay, G.; Jeyanthi, S. Study of sound absorption properties on rigid polyurethane foams using FEA. Indian J. Sci. Technol. 2016, 9, 1. [Google Scholar] [CrossRef]
- Del Rey, R.; Alba, J.; Arenas, J.P.; Sanchis, V.J. An empirical modelling of porous sound absorbing materials made of recycled foam. Appl. Acoust. 2012, 73, 604–609. [Google Scholar] [CrossRef]
- Del Rey, R.; Alba, J.; Arenas, J.P.; Sanchis, V. Sound absorbing materials made of recycled polyurethane foam. In Proceedings of the Intrenoise 2011, Osaka, Japan, 4–7 September 2011. [Google Scholar]
- Biskupicová, A.; Roozen, N.B.; Ledererová, M.; Uncík, S.; Rychtáriková, M.; Glorieux, C. Acoustic characterization of recycled porous material by means of an impedance tube measurement, varying the air gap behind the sample. In Proceedings of the 27th International Congress on Sound and Vibration, Prague, Czech Republic, 11–16 July 2021. [Google Scholar]
- Atiénzar-Navarro, R.; del Rey, R.; Jesús, A.; Sánchez-Morcillo, V.J.; Picó, R. Sound Absorption Properties of Perforated Recycled Polyurethane Foams Reinforced with Woven Fabric. Polymers 2020, 12, 401. [Google Scholar] [CrossRef]
- Sabbagh, M.; Elkhateeb, A. Sound Absorption Characteristics of Polyurethane and Polystyrene Foams as Inexpensive Acoustic Treatments. Acoust. Aust. 2019, 47, 285–304. [Google Scholar] [CrossRef]
- Parikh, D.V.; Chen, Y.; Sun, L. Reducing Automotive Interior Noise with Natural Fiber Nonwoven Floor Covering Systems. Text. Res. J. 2006, 76, 813–820. [Google Scholar] [CrossRef]
- Bougdah, H.; Hall, R. Impact Sound Insulation of Floors Using Recycled Polyurethane Foam. In Proceedings of the Clima 2000, Brussels, Belgium, 30 August–2 September 1997. [Google Scholar]
- Nering, K.; Kowalska-Koczwara, A. Determination of Vibroacoustic Parameters of Polyurethane Mats for Residential Building Purposes. Polymers 2022, 14, 314. [Google Scholar] [CrossRef]
- ISO 9053; Acoustics e Materials for Acoustical Applications—Determination of Airflow Resistance. International Organization for Standardization: Geneva, Switzerland, 1998.
- Berardi, U.; Iannace, G. Acoustic characterization of natural fibers for sound absorption applications. Build. Environ. 2015, 94, 840–852. [Google Scholar] [CrossRef]
- ISO 10534-2; Acoustics—Determination of Sound Absorption Coefficient and Impedance in Impedance Tubes—Part 2: Transfer-Function Method. International Organization for Standardization: Geneva, Switzerland, 1998.
- Allard, J.F.; Atalla, N. Propagation of Sound in Porous Media, 2nd ed.; John Wiley & Sons Ltd.: Chichester, UK, 2009; ISBN 978-0-470-746615-0. [Google Scholar]
- Merillas, B.; Villafane, F.; Rodriguez-Perez, M.A. A New Methodology Based on Cell-Wall Hole Analysis for the Structure-Acoustic Absorption Correlation on Polyurethane Foams. Polymers 2022, 14, 1807. [Google Scholar] [CrossRef]
- Atalla, Y.; Panneton, R. Inverse Acoustical Characterization Of Open Cell Porous Media Using Impedance Tube Measurements. Can. Acoust. 2005, 33, 11–26. [Google Scholar]
- Egner, F.; Deckers, E.; Desmet, W. Fast Inverse Estimation of 9 Poroelastic Material Parameters Based on Absorption Coefficient Measurement. In Proceedings of the E-Forum Acusticum, Lyon, France, 7–11 December 2020. [Google Scholar] [CrossRef]
- Lee, I.S.; Park, Y.H. Non-acoustic parameter estimation for multilayer system with porous material by genetic algorithm. Int. J. Nav. Archit. 2022, 14, 100469. [Google Scholar] [CrossRef]
- Dossi, M.; Brennan, M.; Moesen, M.; Vandenbroeck, J.; Huo, L. An inverse method to determine acoustic parameters of polyurethane foams. In Proceedings of the 48th International Congress and Exhibition on Noise Control Engineering, Madrid, Spain, 16–19 June 2019. [Google Scholar]
- Chevillotte, F.; Perrot, C.; Guillon, E. A direct link between microstructure and acoustical macro-behavior of real double porosity foams. J. Acoust. Soc. Am. 2013, 134, 4681–4690. [Google Scholar] [CrossRef] [PubMed]
- Brennan, M.; Dossi, M.; Moesen, M. A Multi-Physics Study of the Wave Propagation Problem in Open Cell Polyurethane Foam. In Proceedings of the Comsol Conference, Rotterdam, The Netherlands, 18–20 October 2017. [Google Scholar]
- Ciaburro, G.; Parente, R.; Iannace, G.; Puyana-Romero, V. Design Optimization of Three-Layered Metamaterial Acoustic Absorbers Based on PVC Reused Membrane and Metal Washers. Sustainability 2022, 14, 4218. [Google Scholar] [CrossRef]
- Iannace, G.; Ciaburro, G. Modelling sound absorption properties for recycled polyethylene terephthalate-based material using Gaussian regression. Build. Acoust. 2021, 28, 185–196. [Google Scholar] [CrossRef]
- COMSOL Multiphysics Documentation and Library—Software for Multiphysics Simulation. Available online: https://doc.comsol.com/6.1/docserver/#!/com.comsol.help.comsol/helpdesk/helpdesk.html (accessed on 1 September 2022).
- Trinh, V.H.; Guilleminot, J.; Perrot, C. On the sensitivity of the design of composite sound absorbing structures. Mater. Des. 2021, 210, 110058. [Google Scholar] [CrossRef]
- Zubir, M.Z.I.M.; Abdul Rahman, W.M.W.W. Alternative Soundproof Material to Reduce Noise HVAC Round Duct System (Rockwool and Bamboo Fiber). Prog. Eng. Appl. Technol. 2021, 2, 683–693. [Google Scholar]
- Lai, H.Y.; Gentry-Grace, C.; Bonilha, M.W.; Yoerkie, C.A.J. Experimental characterization of materials for acoustic performance with applications. In Proceedings of the Intrenoise 2000, Nice, France, 27–30 August 2000. [Google Scholar]
- Forouharmajd, F.; Mohammadi, Z. Assessment of normal incidence absorption performance of sound absorbing materials. Int. J. Environ. Health Eng. 2016, 5, 10. [Google Scholar] [CrossRef]
- Cucharero, J.; Hannien, T.; Lokki, T. Angle-Dependent Absorption of Sound on Porous Materials. Acoustics 2020, 2, 753–765. [Google Scholar] [CrossRef]
- Opreni, A.; Mariani, S.; Dossi, M.; Brennan, M. Combined effects of temperature and humidity on the mechanical properties of polyurethane foams. J. Rheol. 2020, 64, 161–176. [Google Scholar] [CrossRef]
Publisher’s Note: MDPI stays neutral with regard to jurisdictional claims in published maps and institutional affiliations. |
© 2022 by the authors. Licensee MDPI, Basel, Switzerland. This article is an open access article distributed under the terms and conditions of the Creative Commons Attribution (CC BY) license (https://creativecommons.org/licenses/by/4.0/).