Article

Application and Comparison of Non-Contact Vibration Monitoring Methods for Concrete Railway Sleepers

1
Independent Researcher, Gosposvetska 25, 2000 Maribor, Slovenia
2
Faculty of Civil Engineering, Transportation Engineering and Architecture, University of Maribor, Smetanova 17, 2000 Maribor, Slovenia
3
Faculty of Geodesy, University of Zagreb, Kačićeva 26, 10000 Zagreb, Croatia
*
Author to whom correspondence should be addressed.
Appl. Sci. 2022, 12(24), 12875; https://doi.org/10.3390/app122412875
Submission received: 14 October 2022 / Revised: 27 November 2022 / Accepted: 8 December 2022 / Published: 15 December 2022

Abstract

:
This paper describes the non-contact vibration monitoring of prestressed reinforced concrete railway sleepers. The monitoring was carried out using physical measuring equipment consisting of a seismograph and geophones, a robotic total station (RTS) and scanning laser Doppler vibrometry (SLDV) equipment. Measurements of the dynamic response of sleepers to the dynamic loading induced by the running of train sets provides data that give an insight into the actual state of the sleeper structure at the moment when it is most stressed. The main objective of the study was to identify the most appropriate form of monitoring to monitor events related to the occurrence of cracks in the rail sill, which can also be caused by the impact of vibration. As is well-known, monitoring the dynamic response of railway sleepers is very important for the sustainable management and maintenance of railway lines. The vibration analysis was carried out in the field on the Ormož–Ptuj section of the railway line, in Velika Nedelja and in the laboratory of the UM FGPA, where the vibration was simulated using a hydraulic kit with a static and pulsed force of 100 kN. Several cycles of measurement were carried out and the results were compared with the results of the field monitoring. The vibration parameters measured for the concrete sleepers are necessary to develop a realistic dynamic model of the railway line, which will be able to predict its response to impact loads and the possible occurrence of damage, as has recently been observed for concrete sleepers in several European Union countries.

1. Introduction

Today, trains are one of the most common options for transporting passengers and freight. Rising oil prices will inevitably force us to use rail transport even more. Studies on the improvement of railway track components contribute greatly to the construction of better and, above all, more comfortable railway lines, which also ensure greater safety [1]. This study focused on the measurement of vibration and consequent deformation of railway concrete sleepers, which are a key element in the railway track structure ensuring railway safety. Prestressed concrete sleepers (PCSs) are a key structural element that support the railway system and absorb the varying load from trains running on the track [2]. Rail sleepers, which are one of the most important elements of the railway superstructure, are very important in maintaining the geometry of the track and transferring the loads and vibrations from the rails to the infrastructure [3]. The vibrations absorbed by the rails and, through them, by the rail sleepers can be harmonic or inharmonic. Harmonic vibrations occur in the case of periodic anomalies due to rail irregularities or inappropriate wheel geometry, while inharmonic vibrations occur when the distance between sleepers changes, switches are positioned or the track beam is deformed [4]. In addition to quality sleepers, a suitable subgrade is also important for taking dynamic loads, as the stability of railway tracks is a key safety and operational requirement [5,6,7].
Research to date has shown that improving the railway system should start with accurate analysis and monitoring of vibrations and deformations on track elements. Such monitoring reliably leads to correct decisions related to track maintenance and railway safety. Properly carried out monitoring of the dynamic response of railway sleepers can greatly assist engineers involved in the analysis of the causes of damage—which are usually due to vibration, particularly at resonant frequencies—and of the procedures for improvements in design [8]. It is important that such measurements use simple techniques that do not impede traffic on the railway line, and the most appropriate are undoubtedly non-contact measurement techniques. Increasing traffic load, together with higher speeds and axial loads, requires special measures for maintenance or adequacy control, such as non-contact monitoring. One of the important issues in this respect is the early detection, identification and analysis of possible deformations in all elements of the railway line. This is very important, especially for railway lines that are in almost continuous use and where it is very difficult to find traffic-free periods for sophisticated geodetic measurements [9,10,11].
Over the last fifteen years, the development of geodetic instruments, sensors and global positioning systems (GPSs) and navigation satellite systems (GNSSs) has allowed for the wider integration of these types of instruments in motion and vibration monitoring systems [12]. Dynamic tests have recently become more widespread. They are considered to be the most comprehensive monitoring techniques for bridge structures, allowing a global assessment of the structure [13]. The first investigations and projects for the determination of displacements and deformations in construction structures using geodetic measurements appeared in the 1990s [14]. The first applications of GPS measurement systems for the determination of displacements and deformations in dams appeared at the end of the 1980s [15]. After the first dynamic monitoring projects using geodetic instruments—primarily GNSSs—research has focused on sensor integration and monitoring system operability. In recent years, however, the use of GNSSs has been replaced by the use of robotic total stations (RTS), which allow us to continuously monitor a geodetic target in motion at a frequency of up to 30 Hz.
The drawbacks of the GNSS method, such as uneven sampling after removal of poor quality and missing measurements, the unreliability of the height component, signal interference, etc., were overcome by the introduction of additional surveying measurements with the RTS. With the development of technology and additional software, such drawbacks have been eliminated. As far as construction, conditions and, of course, time allow, it is best to perform measurements with different methods (GNSSs, RTSs and accelerometers) and to compare the results, as shown in previous studies [16,17]. Recently, many authors [18,19,20,21,22,23,24,25,26,27,28] have been working on the use and accuracy of GNSSs, terrestrial laser scanners and RTSs in determining the dynamic responses of structures in the form of continuous monitoring. In previous studies [29,30,31], the results of investigations into the possibility of using RTSs for tracking targets in motion have been described. In this work, the authors describe, in particular, the error of non-synchronised operation of the sensors of the length- and direction-measuring instruments, which leads to systematic errors in the determination of the coordinates of the target position. In other work [32,33,34], robotic total stations from different manufacturers were tested in determining the position of a target moving along regular circular arcs and directions at different target-motion speeds. In [35], an RTS was tested in measuring high-frequency displacements in the horizontal direction. In another paper [36], an RTS was tested for dynamic bridge displacement measurements, and the advantages and disadvantages of using RTSs for such measurements were given. The biggest disadvantage of the measurement instruments is the slow and uneven performance of the measurements. In [16], comparisons of bridge dynamic parameters determined with GNSSs, RTSs and accelerometers are presented.
In the last five years, however, a new technology has appeared in the field of vibration measurement of structures that allows us to continuously measure with high frequency the response of a structure in all three axes. The article [37,38,39,40,41,42,43,44,45,46] describe data capture methods that allow measurements of up to 20,000 Hz and more, from which we can obtain highly accurate and reliable results. The problem with these methods is their range and their difficult installation on demanding structures. By this we mainly mean inaccessible terrain, situations involving water and traffic under buildings, structures with large spans and prestressed structures that prevent us from obtaining a horizontal view. Precisely for this purpose, we looked for solutions with other simple non-contact methods that could also be used to obtain reliable results; the methods were independent of the previously listed problems. As we have already mentioned, measurements can be performed using the geodetic RTS method, which can be used to perform measurements at greater distances and angles. In the future, the development of this equipment will also enable continuous and more frequent results from which we will be able to reliably calculate the dynamic responses of structures. Geodetic monitoring is now recognised as one of the fundamental approaches for obtaining data on the dynamic responses of structures in civil engineering, as instruments such as the robotic tachymeter (RTS) can be used to obtain monitoring data at frequencies of up to 30 Hz. The advantage of geodetic monitoring over conventional physical methods is the elimination of physical sensor placements, as is known from inductive meters. The data obtained with a non-contact measurement system include the displacements at specific points, which may be at different locations. By automatically capturing the measured values, the positions of the measurement points can be determined quickly and reliably. As the analysis of the oscillation signals is conditioned by the sampling frequency, the accuracy of the measurements improves with the sampling frequency. In the papers [47,48,49], researchers analysed the capture of vehicle dynamic response data using GNSS methods, which are the simplest to use. They found that the drawbacks of this method are related to non-uniform sampling and errors due to the unfavourable position of the satellites. Today, the RTS method has been proven to overcome these drawbacks.

The Purpose of Research

In this paper, we present an example of the use of RTS monitoring followed by physical monitoring using SLDV equipment and a seismograph with an associated geophone. The purpose of this study was to demonstrate the usefulness of the RTS method for determining the dynamic response of a structure. The advantages of this method include its wide usability, the reliability of its results, its ease of use and its economic aspects. The monitoring took place on a dynamically loaded prestressed concrete threshold in a railway line. The purpose of the measurements was to obtain basic information about the dynamic response of a railway sleeper lying on an elastic subgrade in a simple, reliable and safe way. The measurements made can serve as very important information on the influence of the dynamic loading caused by trains running on a railway line on the causes of the damage—mainly cracks—that is nowadays observed in several European Union countries by the maintenance services of the railway infrastructure managers.

2. Methods for Measuring Dynamic Response

Geodetic methods are non-invasive methods that can be used to monitor various responses of structures. The authors of [50] conclude that global navigation satellite system (GNSS) methods, light detection and ranging (LiDAR) technology and synthetic aperture radar (SAR) interferometry can be used for construction monitoring to determine the dynamic response and study structure deformations [51,52,53,54,55,56,57]. The use of these approaches is not adequately explored in the available literature. From our previous research on the use of geodetic methods for determining dynamic responses, we found that the described methods are quite unreliable, as they do not give uniform results, the sampling frequency is too low, the height component is unreliable and the accuracy of the results is questionable. Among the geodetic non-invasive methods described, the RTS method is generally used for this type of monitoring.
Recently, the automated acquisition and processing of spatial data on deformations has been the subject of numerous studies. Detecting structural deformations and determining their shape and dimensions are complex processes that require an interdisciplinary approach [58,59,60,61].
In our study, we focused on monitoring the dynamic response of concrete railway sleepers replacing wooden sleepers. The study was carried out with a practical example for which we determined the response of the threshold under the load of different train compositions and simulated the dynamic responses in the laboratory of our faculty. The purpose of the study was to investigate how we can determine the responses of a structure in the most ideal, cost-effective, fast and reliable way, even in places where electronic high-precision methods are out of the question due to ranges, inaccessibility and safety. In order to compare the results for the dynamic response obtained with different methods, the results of the geodetic measurements were additionally processed and, with the help of FFT analysis, the frequency, dominant frequency and amplitude were obtained.
The devices we typically use for non-contact monitoring have high price ranges and do not usually offer a wide range of applications. Recently, vibration monitoring devices of sufficient quality to perform vibration monitoring and analysis, with a graphical interface capable of storing, processing and displaying the input data from the sensors in real time, have also been used to convert signals from the time domain to the frequency domain. An example of the use of such a device is given in [62], where it demonstrated very good accuracy. The analysis of vibration monitoring results can also include statistical modelling based on multi-binary rules [63]. Choosing the right measurement technique is nowadays crucial to obtain accurate results. One very precise and efficient monitoring process is based on the integration of non-contact measuring systems and simultaneous monitoring with contact measuring instruments. Contact sensors vary in size and weight. Some of them are quite difficult to install. Non-contact sensors are relatively small and light, making them easier and cheaper to install, which speeds up monitoring. In general, non-contact methods are less accurate but not by much. The LDV method used in this study is a typical example of non-contact monitoring, as it generates a point cloud or voxel as the most basic data format. In this way, a huge amount of data can be obtained in a very short time, which is the primary advantage of non-contact monitoring methods.

Measuring Equipment and Methods

A railway threshold with a characteristic longitudinal surface crack was randomly selected as a measurement site and is shown in Figure 1. The sensors of the measuring equipment were rigidly fixed to the threshold with a glued steel-threaded rod, as shown in Figure 2.
Three sets of monitoring equipment were used:
  • A Minimate Plus seismograph with Instantel geophone, Canada;
  • A Leica TS 50 RTS with associated geodetic target from Leica Geosystems AG, Switzerland;
  • A Polytec PDV 100 laser Doppler vibrometer (LDV) from Polytec GmbH, Germany.
A seismograph is a device classified as a seismic instrument that is usually used for physical measurements. The RTS Leica TS 50 and the LDV Polytec PDV 100 are classified in the group of instruments specifically used in the field of vibrometry for the measurement of physical quantities by means of non-contact control processes. For the measurements with the RTS TS50 instrument, we used an additional program that allowed us to record the results at a frequency of up to 30 Hz. The GeoCOM/ZG program was developed at the Faculty of Geodesy of the University of Zagreb. The data on the characteristics of these instruments are given in Table 1, Table 2 and Table 3.
The dynamic responses of the railway threshold were monitored for a passenger train and a freight train travelling at 100 km/h above the reference point. The axle load of the passenger train was 93 kN and that of the freight train was 187 kN. The measuring devices were triggered manually at the same instant and the measurement lasted 30 s.

3. Results

Vibrations caused by rail traffic are ground vibrations, represented by different types of elastic waves propagating through the ground. These waves are surface waves and plural longitudinal and transverse waves that propagate into the depths of the soil. These waves can be described by their amplitude, which is a description of the amount of motion, and frequency. Vibrations are measured in terms of peak particle velocity, which is the movement of molecular particles in the soil in units of mm/s. The motion of the particles is three-dimensional.

3.1. Dynamic Response Measurements in a Test Field on a Section of Railway Line

The results of the monitoring with the above measurement equipment for both load cases are shown graphically in Figure 3, Figure 4, Figure 5, Figure 6, Figure 7 and Figure 8.
For the measurements with the Minimate Plus seismograph, a plot of the vibration velocity in the vertical direction is shown. The Instantel Blastware 10.74 Advanced Module software package was used for the analysis. For the RTS Leica and LDV Polytec measurements, the vertical deformation measurements were plotted. Leica Geo office 8.4 software was used to analyse the Leica RTS measurements. The results of the vertical deformation measurements were obtained using Polytec’s VibSoft software.
Analysis of the maximum vertical displacement measurements determined through non-contact monitoring with an RTS and LDV equipment indicated very similar results in terms of values. The diagrams showing the maximum vertical displacement values were also very similar in shape. The evaluation of the results for both load cases is shown in Table 4 and Table 5.
The Minimate Plus measuring equipment cannot measure actual vertical displacements. The result is expressed as a relative value, but the physical measurements obtained with this equipment are very important for further investigations carried out in the context of determining the causes of cracking in prestressed concrete railway sleepers. The measured values are given in Table 6 and Table 7.

3.2. Dynamic Response Measurements on the Test Field in the Laboratory

Vibration was measured using Instantel seismographs with associated geophones. The location of the geophone measurement points on the railway threshold marked 007B, which was constructed in 2010 and exposed to railway traffic for 11 years at the location of the Velika Nedelja settlement, is shown in Figure 9. At the G1 measurement site, measurements were made with a four-channel apparatus and a calibrated three-axis geophone complying with DIN 45669-1. At measurement sites G2 and G3, measurements were made with an eight-channel instrument and two calibrated geophones also complying with DIN 45669-1. The frequency range of these geophones is from 1 to 315 Hz. The seismographs were triggered manually in sequence during the measurement period from 25 February 2022 to 30 July 2022 inclusive, with the measurement time set to 60 s. Two hydraulic sets with separate power packs were used to excite a vibration or pulsed force load. A static force of 100 kN was applied to the rail of the test field with the railway sleepers under investigation at the measuring point marked G1. At test point G3, a pulse forced ranging from 20 to 100 kN with a pulse frequency of 1.5 to 2 Hz was applied to the rail of the test field with railway sleepers. During the monitoring period, 1,000,000 cycles of low-frequency dynamic fatigue were employed.
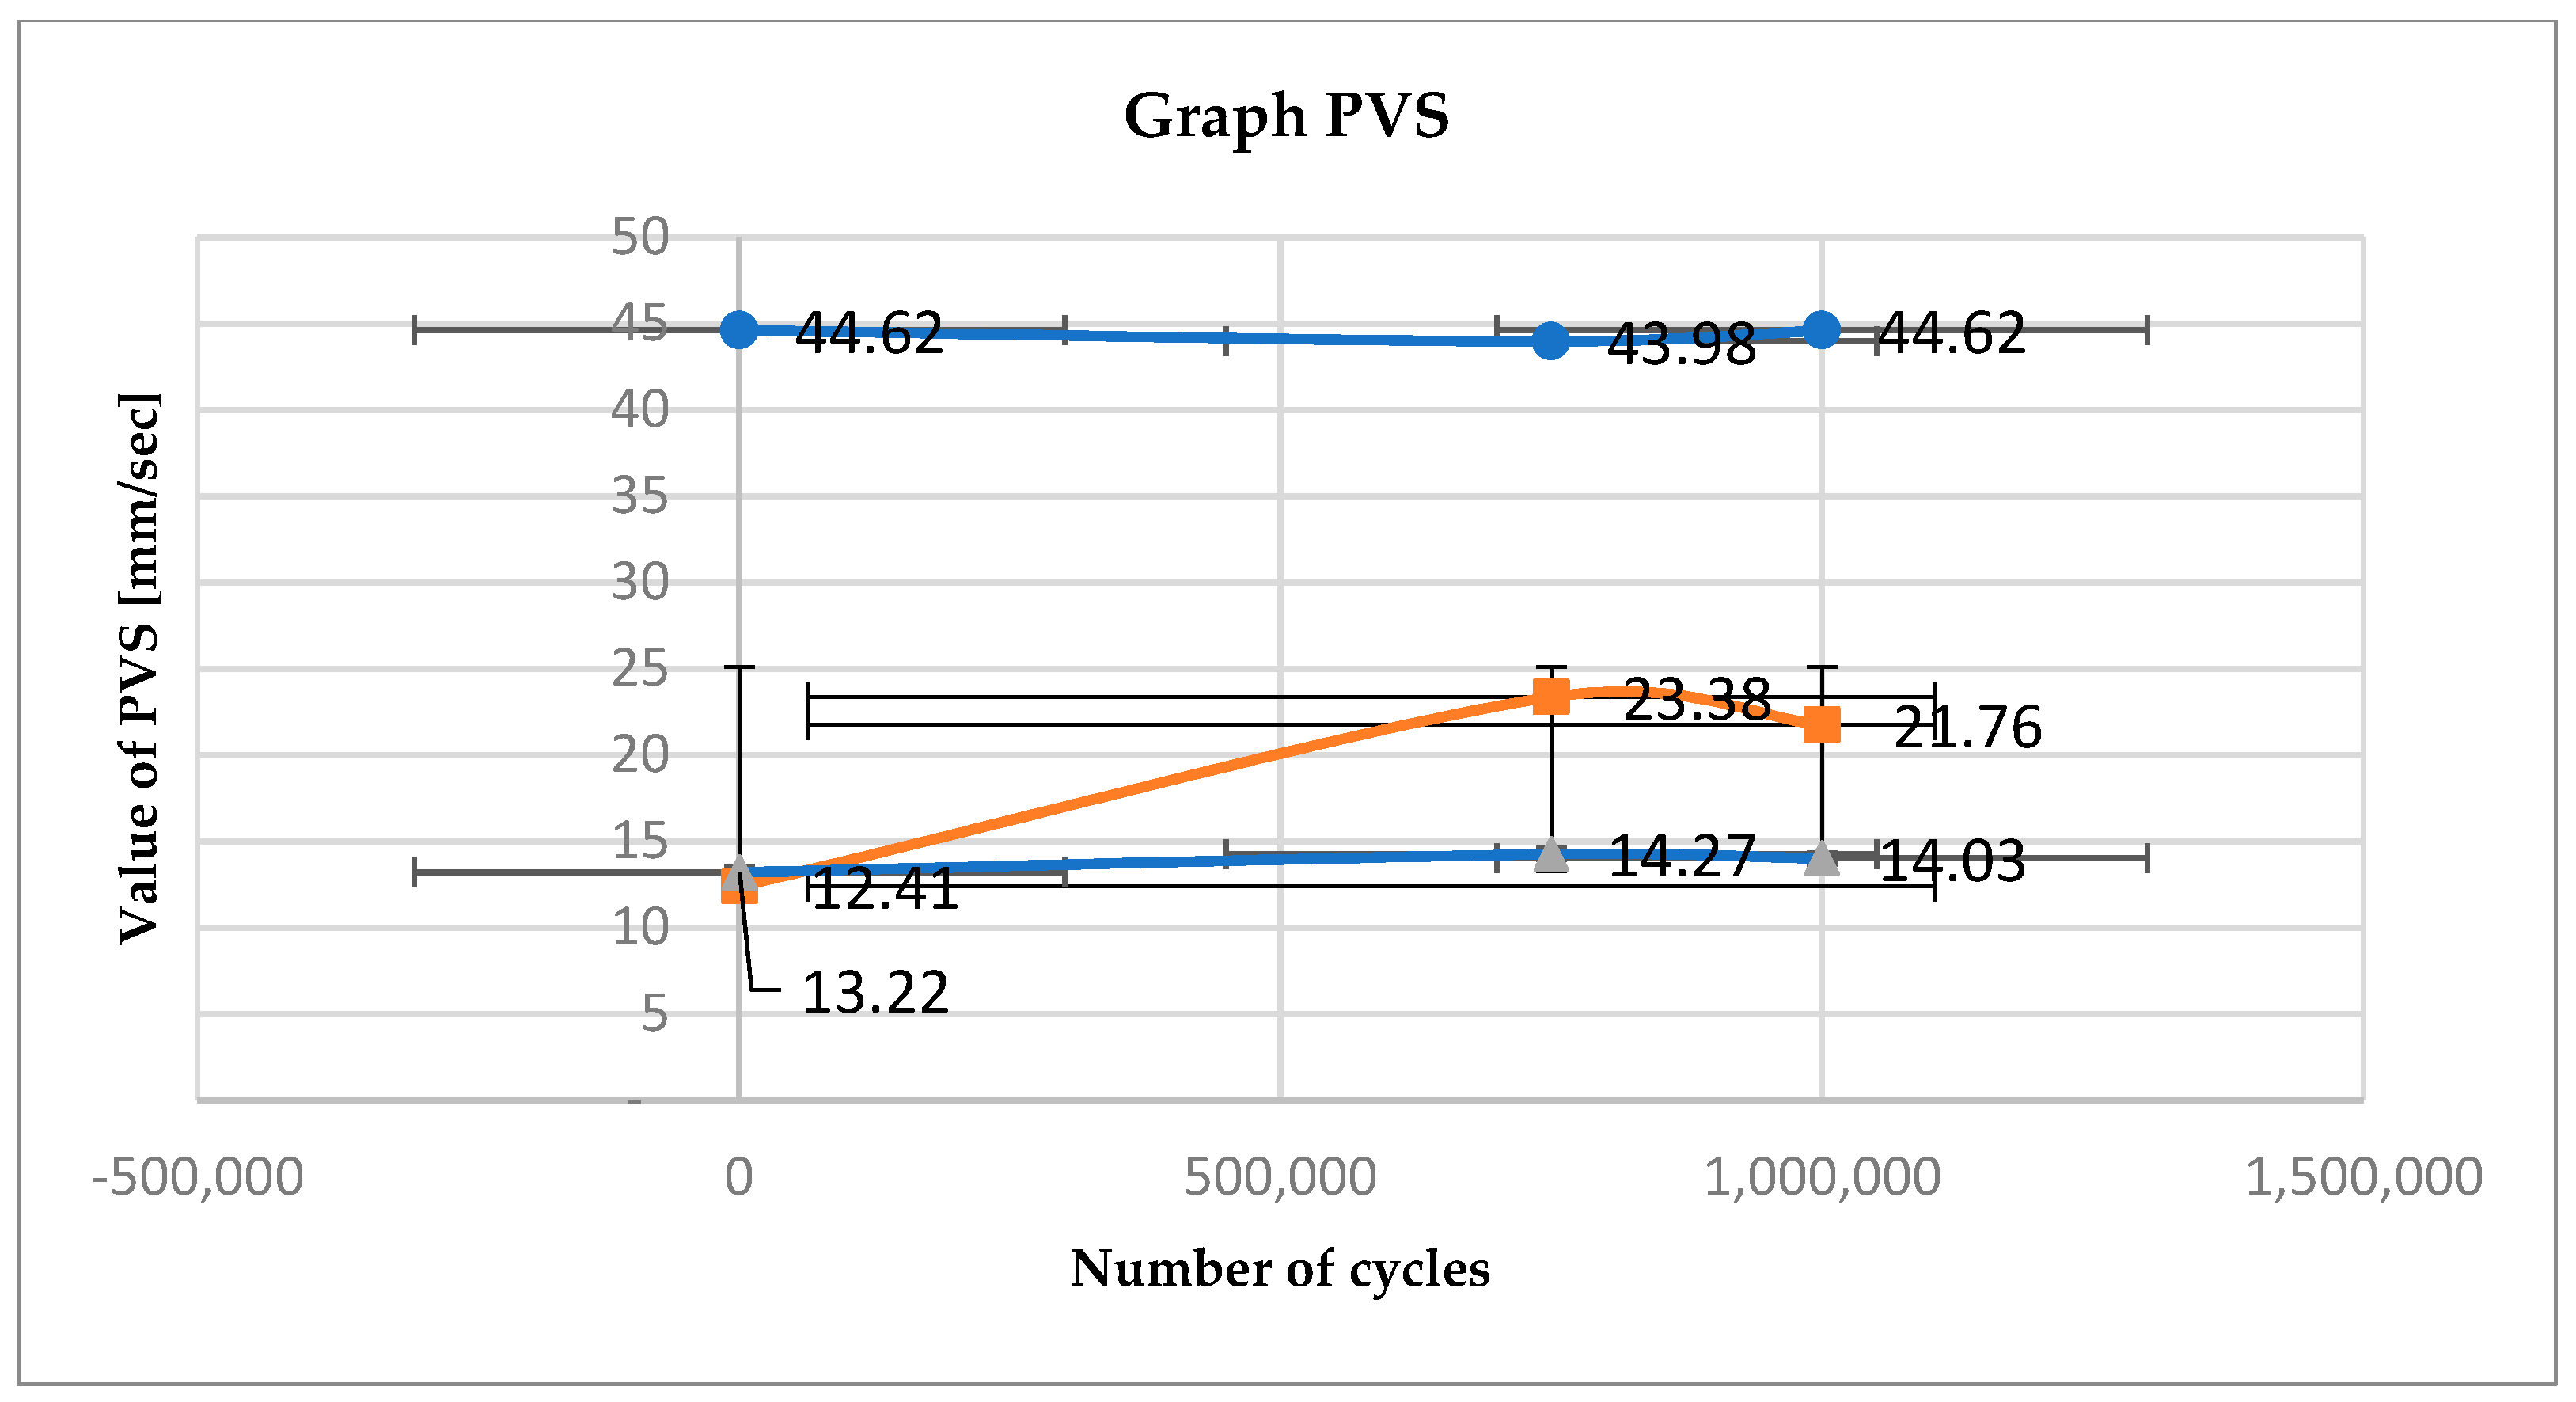
The results of the measurements with the Instantel Minimate Plus measuring equipment, which were the relative displacements of the measuring points in all three orthogonal directions and the resultant vibration velocity vector, are shown in Figure 10 and Figure 11.
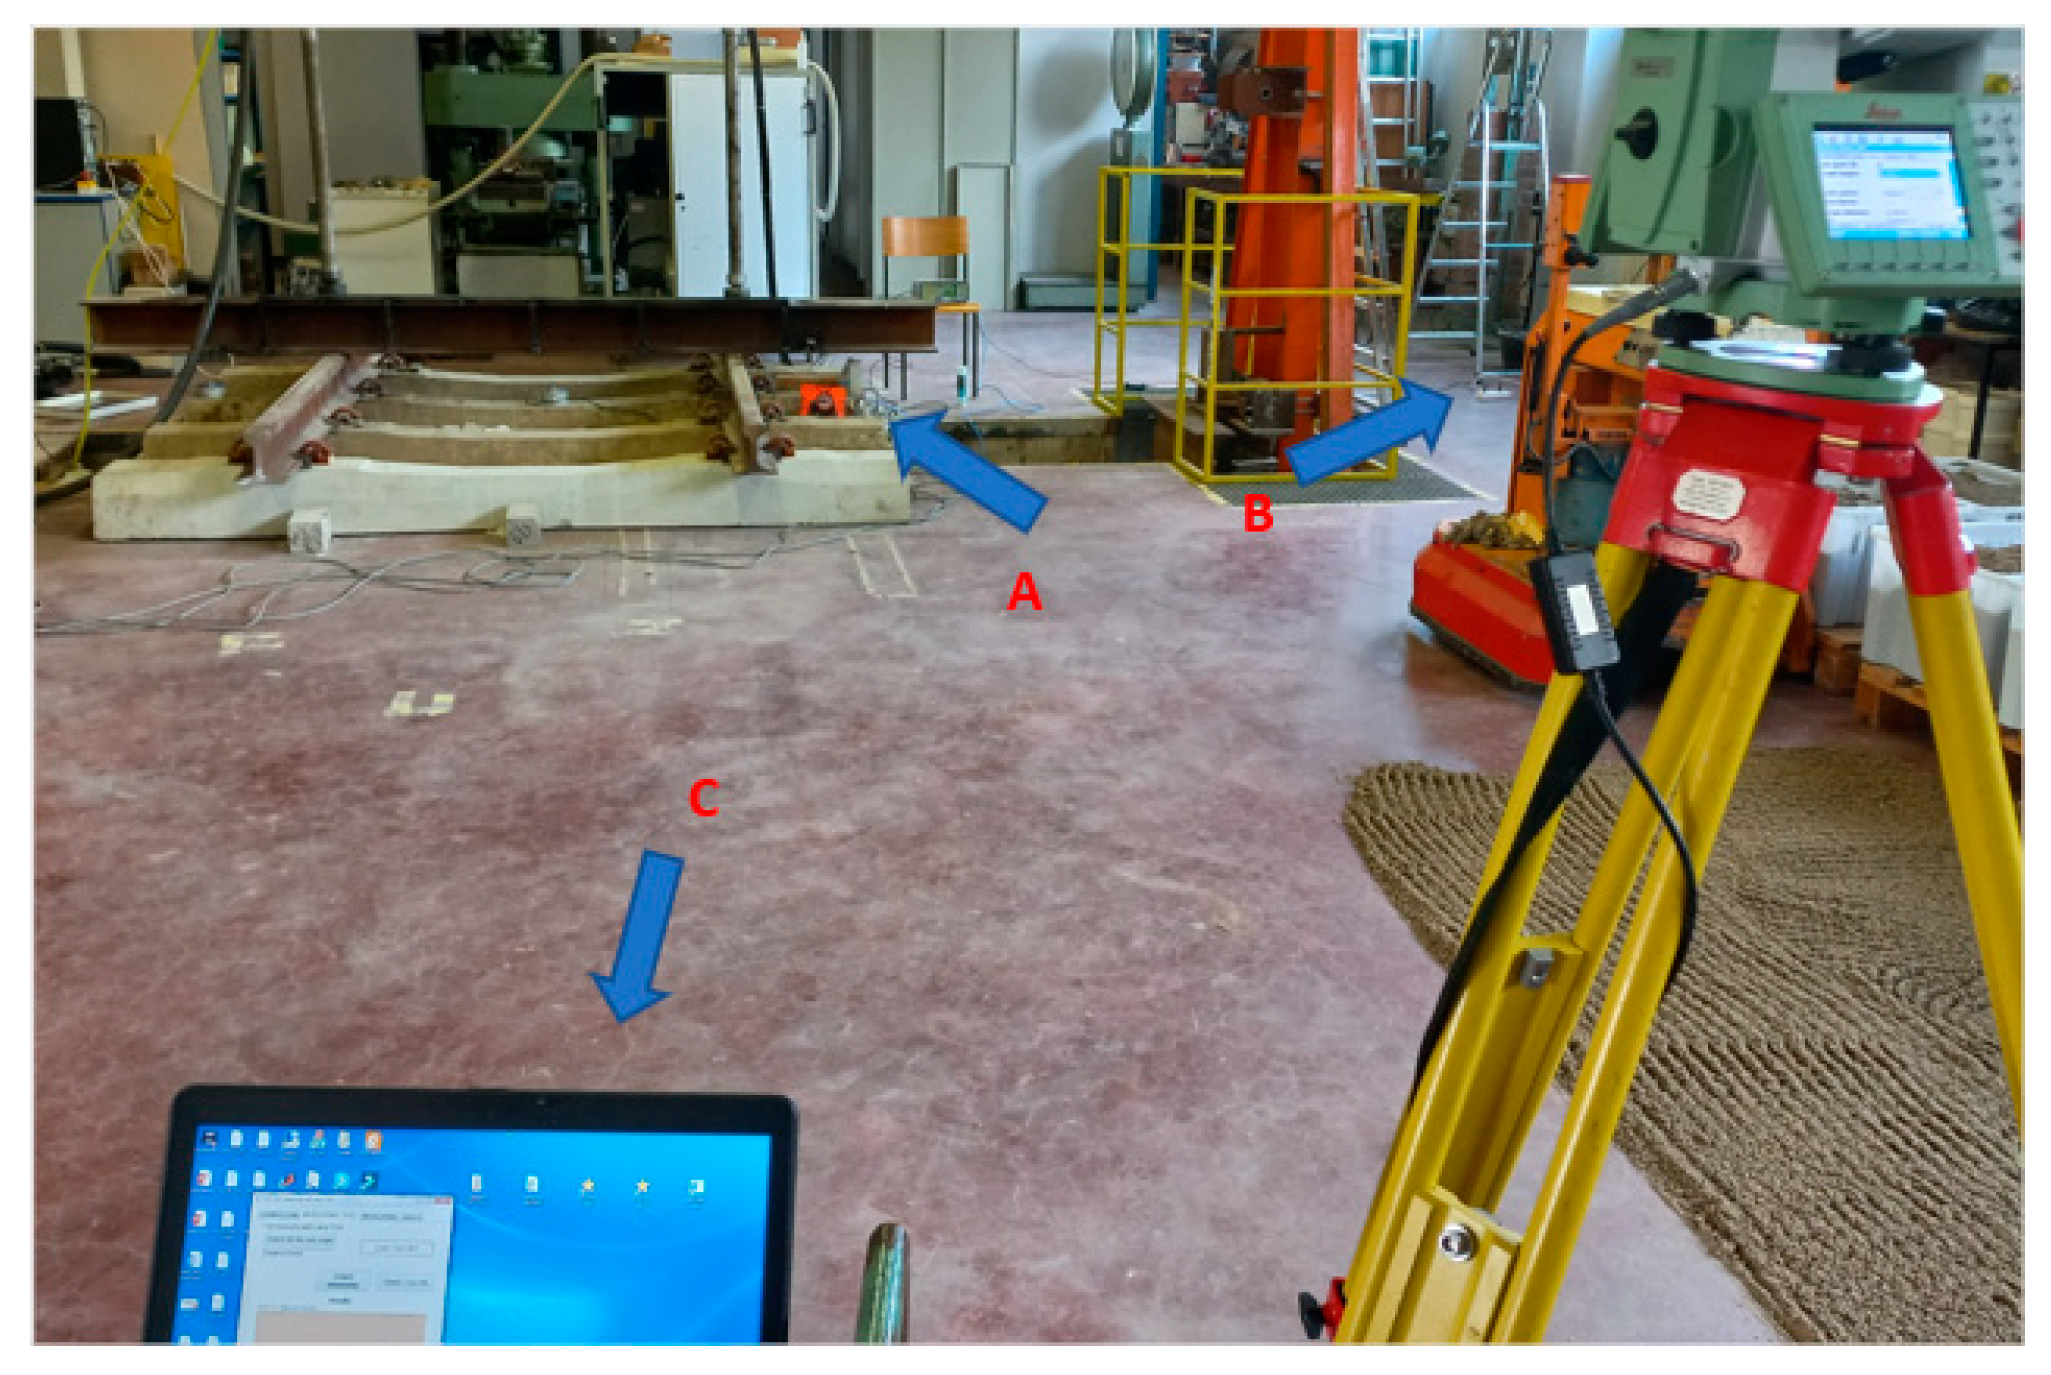
Figure 12 and Figure 13 show the monitoring of the railway sill displacements during the application of low-frequency dynamic fatigue with the Leica TS 50 surveying equipment, which provides data at a sampling rate of 30 Hz.
Figure 14 shows the results from the dynamic fatigue measurements with the SLDV equipment (Poytec PDV 100), which provides 2.4 kHz acquisition of the measured values. A measurement interval of 100 s is shown.
The peak vector sum (PVS) is the value of the square root of the sum of the squares of the peak particle velocity (PPV) in all three orthogonal directions measured with a seismograph. The PVS is a scalar quantity that always has a value greater than the single value of the PPV vector. The PVS provides a simple way to interpret vibration data, as it gives an indication of the total vibration intensity.

4. Analysis, Comparison and Discussion of the Results

As we mentioned with regard to the purpose of our research, we performed dynamic response measurements using three different methods. For further analysis of the results for the purpose of determining the dynamic response, it was necessary to determine the frequency, dominant frequency and amplitude parameters. In the case of the RTS method, which is understood to be a non-invasive method and one used for determining the response in places where other methods are not used, the results of the measurements must be further analysed. From the obtained results, we can only determine the vertical displacement versus the loading time, which is useful for static analyses.
In order to determine the frequency, dominant frequency and amplitude, we have to further process the data from the geodesic measurements.
Measurements in most scientific and engineering fields are characterised by the periodic signal of the measured object, the periodicity of which is identified using spectral analysis techniques. Spectral analysis or spectrum analysis is thus a method of analysis employing mathematical parameterisation, where the selected object is studied in terms of frequencies or other directly related quantities, such as energy, eigenvalues and the like. The most widely used and widely represented technique in the field of spectral analysis is the Fourier-transform method, which is applicable to both continuous and linear signals. The main limitation in the appropriate use of the Fourier transform is the requirement for a constant (equivalent) measurement time interval [64].
The Fourier transform is an extremely powerful mathematical tool that is used in a wide range of fields. The main reason for the widespread use of this method is that the Fourier transform converts the complicated operations of subtraction and convolution into simple multiplication and, as such, it is an important tool in the solution of differential equations. In the field of physical science, the method is most commonly used for the determination of so-called frequency spectra of oscillations with the presence of a certain amount of noise and where the acquisition of the data is, in principle, uniform. In today’s practice, uniform sampling is basically only possible with more advanced automated measurement systems, such as accelerometers or strain gauges. In contrast to this situation, in our work with surveying methods, we are confronted with the problem of non-uniformity in the acquisition of measured data obtained at unequal or irregular time intervals. Incorrect registration intervals and, consequently, sampling errors occur in the wake of technical shortcomings in surveying instruments. The errors are visually reflected as so-called coarse errors, which are caused by the insufficient frequency range of a device, partial automation, noise and mechanical interruption of the measurement [64].
The Fourier transform, whether discrete or fast, becomes practically useless when we want to take into account the different, temporally unequal measurement data that can be obtained from different surveying instruments, such as RTSs, in an analysis. The Lomb periodogram method was introduced in 1976 by Nicholas R. Lomb and Jeffrey D. Scargle as a means to incorporate and account for sampling irregularities in data processing. The Lomb periodogram can, therefore, be used for spectral analysis of both irregularly and correctly sampled measurement data [65].
The Lomb or Lomb–Scargle periodogram is a mathematical method based on the least-squares principle for estimating the frequency spectra of arbitrary oscillations and the periodicity of uniform and non-uniform sampling. The procedure is based on the fitting of sinusoidal shape functions [64]:
h t = a · cos 2 π T · t τ + b · sin 2 π T · t τ
The Lomb periodogram P(t) describes the dimensionless value used to express the power spectrum and is defined for a time period T as [64]:
P T = 1 2 σ 2 · { j = 1 N x j x ¯ · cos 2 π t i τ T 2 j = 1 N cos 2 2 π t i τ T                 + j = 1 N x j x ¯ · sin 2 π t i τ T 2 j = 1 N sin 2   2 π t i τ T }
where the parameter τ is defined in the time lag equation as [64]:
tan 4 π τ T = j = 1 N sin 4 π τ i T j = 1 N cos 4 π τ i T
where:
N is the data block size;
t i is the measured drift time i ;
x ¯ is the mean displacement calculated using the expression x ¯ = 1 N · i = 1 N x i ;
σ 2 is the standard deviation calculated using the expression σ 2 = 1 N 1 · i = 1 N ( x i x ¯ ) 2 .
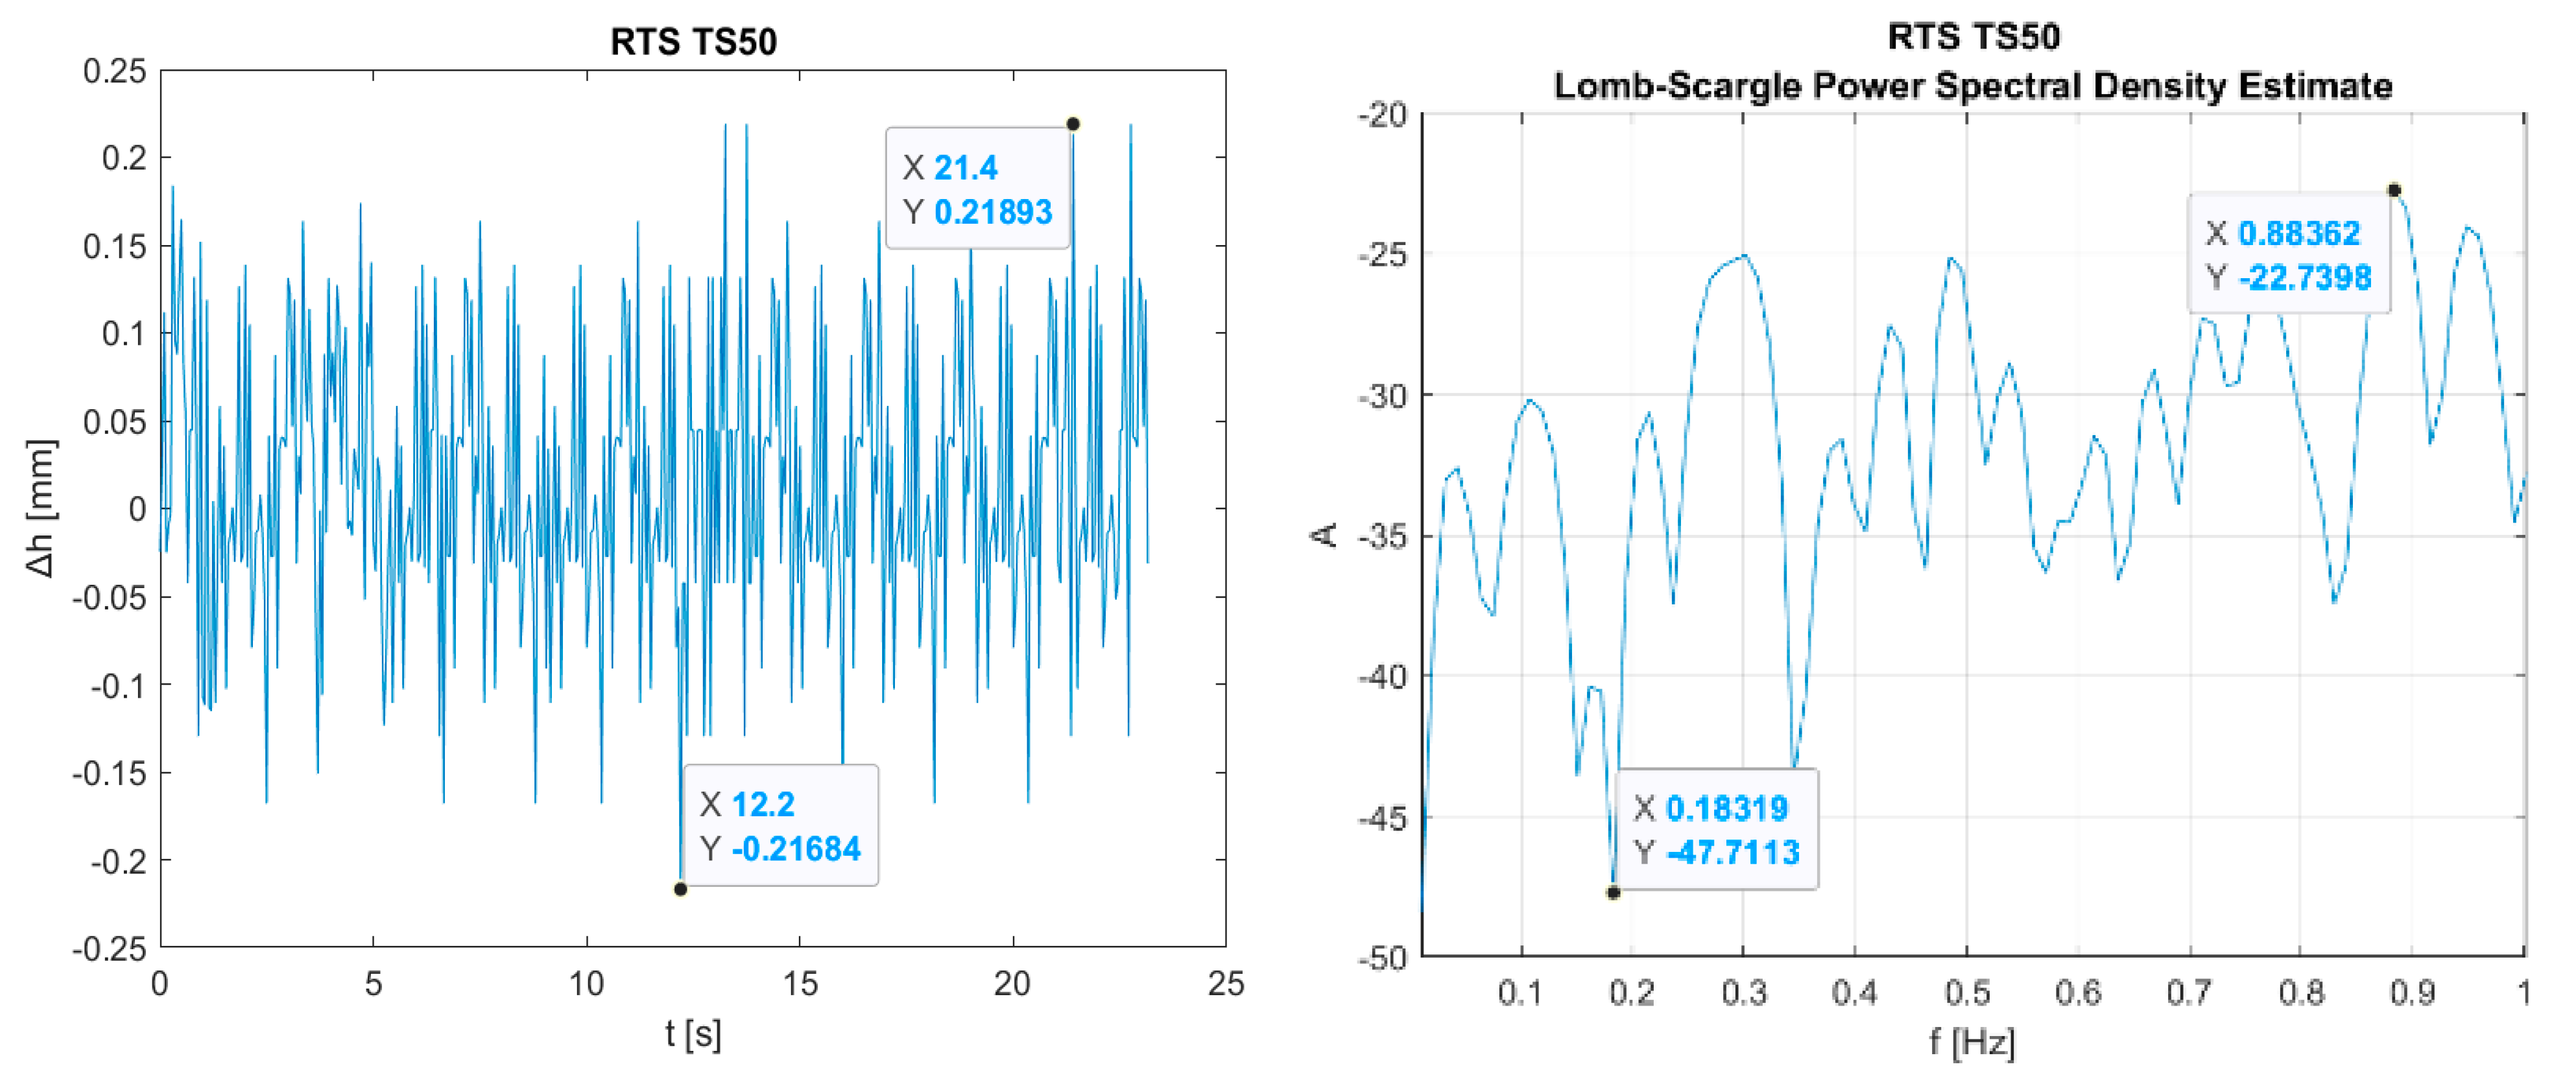
In the graphs in Figure 14, the first shows the measured signal, while the second shows the calculated waveform of the associated Lomb–Scargle periodogram and Lomb–Scargle spectral approximation in the frequency range from 0 to 1 Hz.
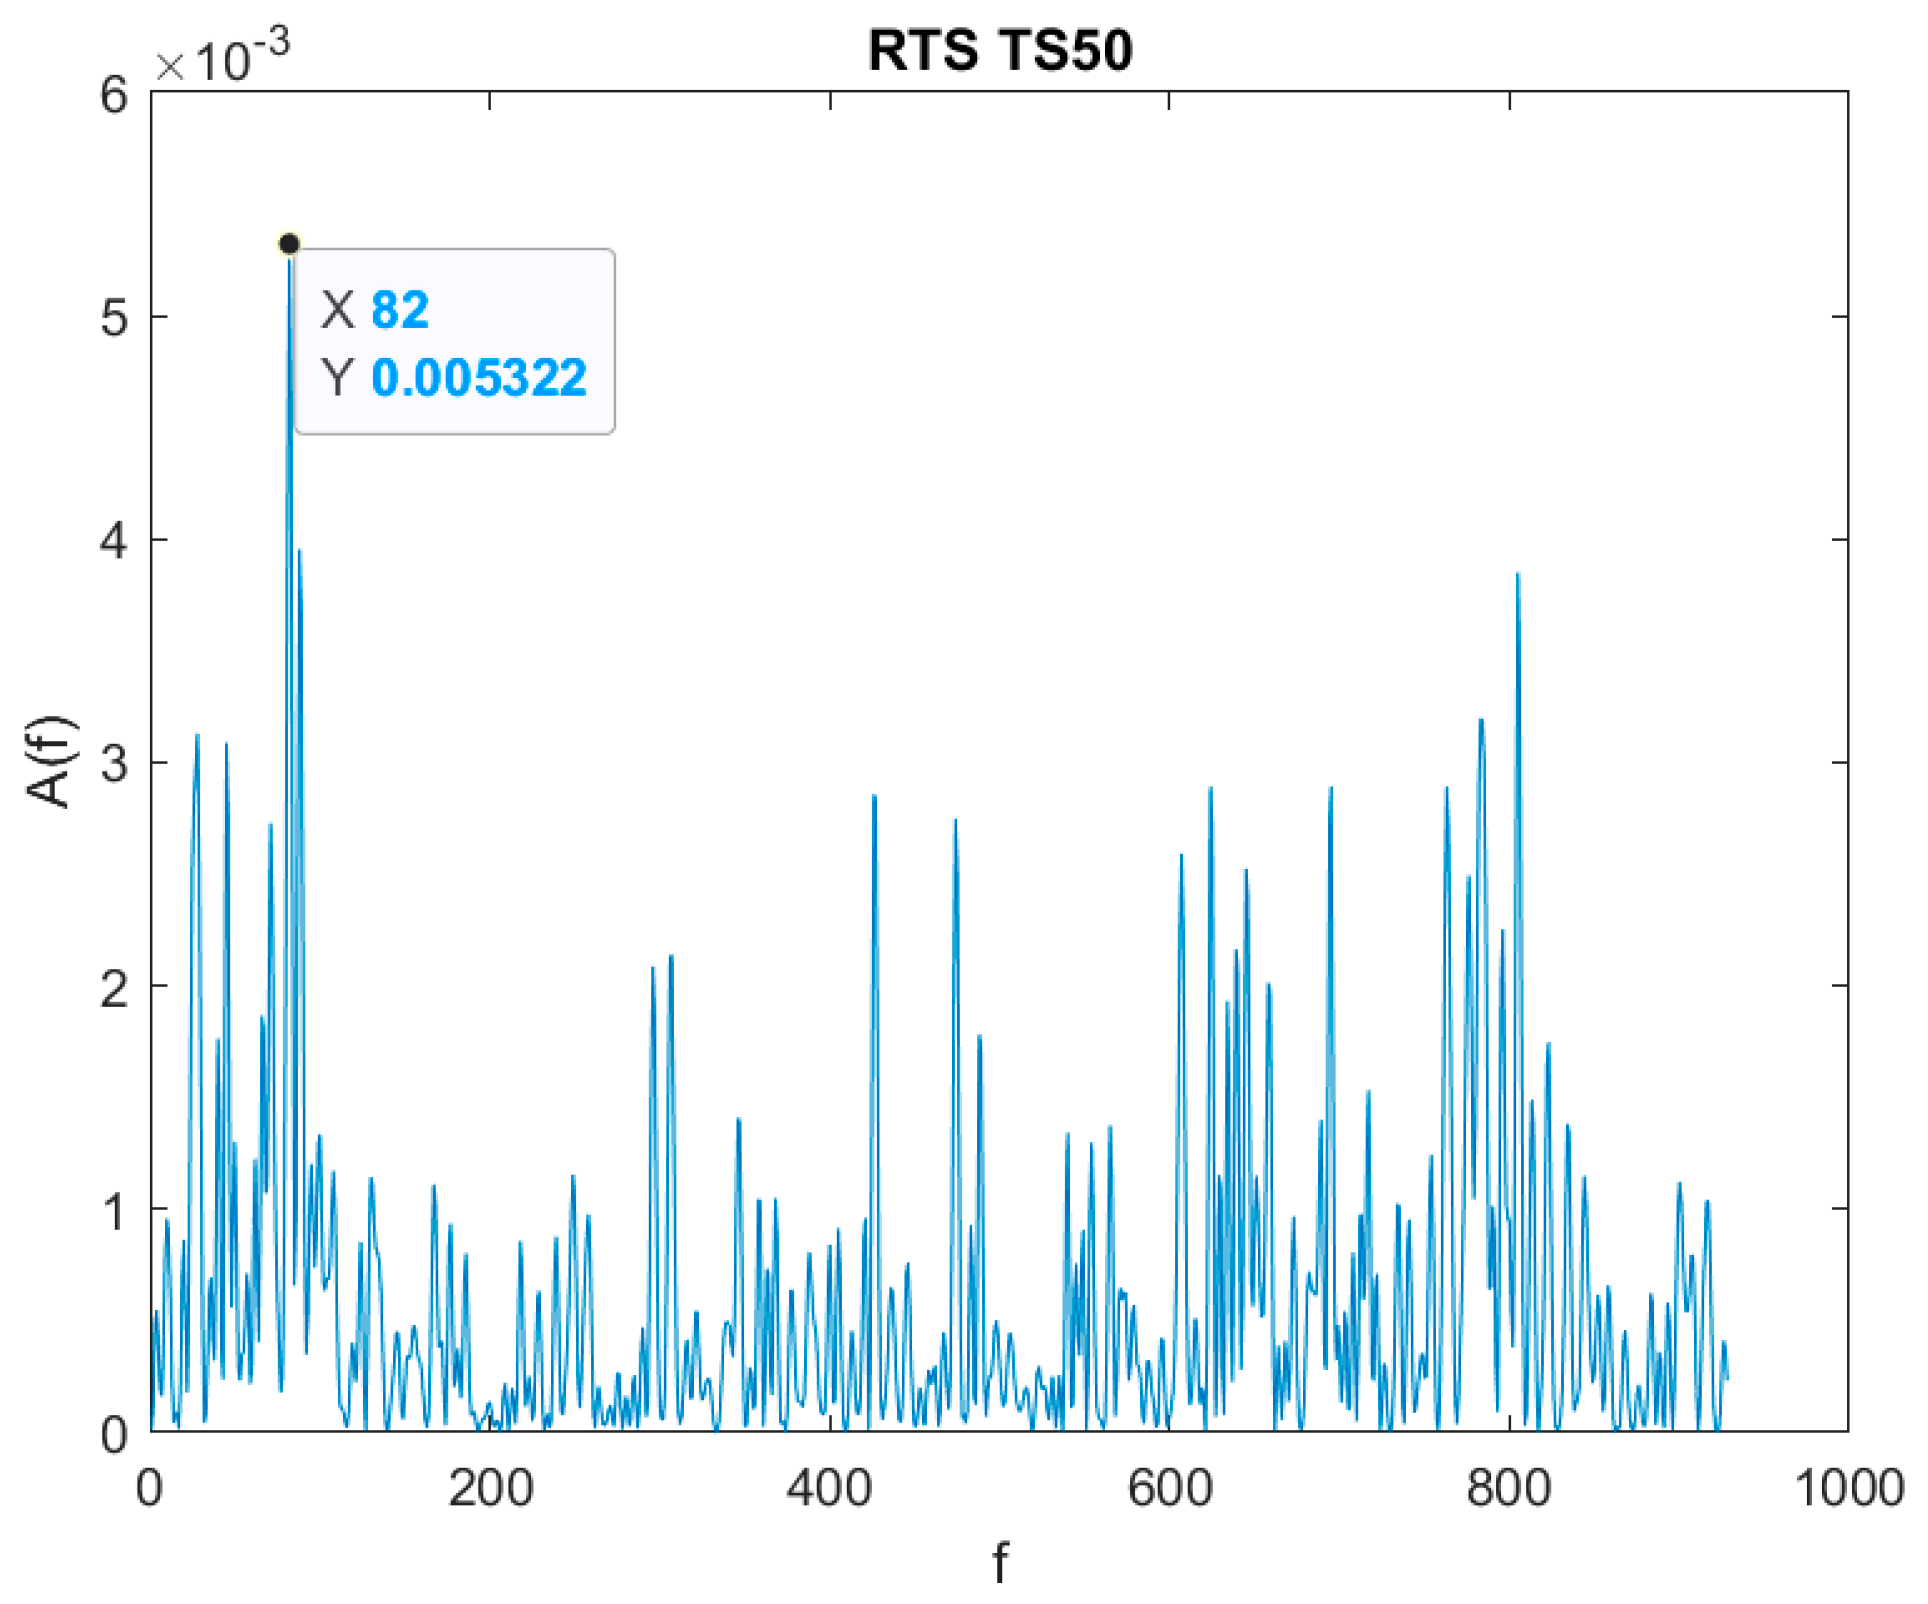
The third graph represents the power spectrum A(f) for the total Lomb–Scargle signal, where A(f) represents P(T) and is calculated from Equation (2). The maximum associated values and absolute differences are shown graphically in Figure 15 and Table 8.
As part of the second analysis of the signals from the surveys, we used SignalLab Sigview. Here, the analysis was entirely limited to the consideration of the complete source signals from the surveying equipment. Using commands, we performed an FFT analysis for each input signal, but this time we were interested in the overall frequency spectrum and the peak values of the entire source signal. Finally, based on the results of the FFT analysis and the plotted graphical waveforms, the corresponding dominant frequency and maximum amplitude were determined for each input signal. In summary, an analysis of the geodetic measurements was thus performed with the example of the general frequency spectrum and the example of the corresponding Lomb–Scargle spectral approximations in the selected range [65].
Based on the presented and analysed responses of the structure to certain loading events and the spectral analysis of the individual signals, the final practical value was obtained. Starting from the previously compared values of the vertical displacements, it follows that, when measuring the response of the structure, the mutual difference is relatively negligible, which indicates the possibility of relatively easy mutual alignment in practically all the events analysed. In almost all load cases, when analysing the results obtained with the RTS TS50, we observed a lower sampling frequency compared to the declared value, which indicated the capability of measurements up to 30 Hz when using GeoCOM/ZG. The average sampling frequency across the whole of the experimental work was 16 Hz.
The monitoring of the dynamic effect on the displacement of the measuring points on the railway threshold was based on the acquisition of signals for the determination of the vertical displacement. The monitoring was carried out in the field and in the laboratory. The results of the monitoring in the laboratory were compared with the results of the FFT analyses performed to determine the dominant frequency and amplitude. These results also showed the consistency of the measured values. Field measurements have shown that train mass and speed have a strong influence on the intensity of vertical deformation [66]. The vertical deformation caused by a freight train can be up to three times greater than the vertical deformation caused by a passenger train. This was confirmed by the measurement of vertical accelerations, which were four times higher when a freight train passed over the same measuring point. In the laboratory measurements, we could not fully follow the tides generated by a moving train in the field, as we could not simulate the rolling effect of the train wheels, which also cause loads in the longitudinal and transverse directions. Based on the field measurements and the possibilities allowed by the measuring equipment, we set the excitation frequency to 1.5 Hz. We found that, for pulsed loads of up to 750,000 cycles, the resultant vibration velocity vector increased linearly, after which it did not increase further and stabilised. The results of the FFT frequency analysis showed that geodetic vibration monitoring is a useful and sufficiently accurate method despite the lower signal acquisition rate. The values listed are shown in Table 9.
Measurements in most scientific and engineering fields are characterised by the periodic signal of the measured object. The signal represents an arbitrary measurable physical quantity containing information about a time-dependent physical process. The determination of the periodicity of a signal from a mathematical point of view can be achieved in a number of different ways, among which so-called spectral analysis is of great importance for processing. The most widely used and widely represented technique in the field of spectral analysis is the Fourier-transform (FT) method of computation. FT is a mathematical concept that can be used to decompose a signal into its constituent frequencies. The FT not only gives the frequencies present in the signal but also the magnitude of each frequency present in the signal. Mathematically, the definition of the basic Fourier transform of an integrable function can be represented by an integral relation [64]:
X f = x t · e j 2 π f t d t    
where:
f is an arbitrary real number (frequency);
x t is a function of the time-dependent signal;
e j 2 π f t is a complex harmonic signal;
X f is the Fourier transform (spectrum).
The fast Fourier transform (FFT) is a mathematical algorithm that calculates the discrete Fourier transform (DFT) of a given sequence. When the time function under consideration is formed of or includes a finite number of discrete objects of knowledge or periodic signals of period N, we speak of a discrete Fourier transform. Starting from the determination of the fundamental and circular frequencies of the signal, the signal can be developed into a finite series of complex exponential functions, such as [64]:
x n = k = 0 N 1 X k e j n k Ω 0  
Here, in general, the complex coefficients X k . represent the spectrum of the signal, and e j n k Ω 0 is again an arbitrary complex harmonic signal. The coefficients of a periodic function X k with period N are calculated using the inverse expression [64]:
X k = 1 N · k = 0 N 1 x n e j n k Ω 0  
The DFT can be further transformed for further necessary analyses by introducing the complex constant transformation X k . In the following, the periodic factors W N k n define the equidistant points on the unit circle in the complex plane [64]:
W N = e j Ω 0 = e j 2 π / N  
X k = 1 N · k = 0 N 1 W N k n  
FFT procedures, as with the ordinary Fourier transform, are based on the decomposition of the considered interval of length N into a number of subintervals, in principle equidistant. Importantly, when using FFT algorithms, the length of the interval N is usually an integer power M of 2, which can be written mathematically as [64]:
N = 2 M  
The usefulness of the procedure is mainly reflected in the increase in the computational efficiency of the analysis, as some mathematical operations are easier to perform in frequency space than in time space. The main advantage is practically reflected in the special fast algorithms for the calculation of the DFT known collectively as the FFT. Mathematically, the most widely used FFT algorithm (the Cooley–Tukey algorithm) can be written as [64]:
X K = n = 0 N 1 x n · e i · 2 · π · k · n N   n = 0 ,   , N 1
The Instantel Blastware software package allows the frequency content of waveforms to be analysed using the dominant frequency for each waveform. The dominant frequency is defined as the frequency with the largest amplitude in the spectrum.
As can be seen from Table 9, the frequency of signal acquisition has a major impact on the results of dynamic response measurements. The RTS Leica TS50 geodetection equipment has a sampling frequency of 26 Hz, while the Polytec PDV 100 has a sampling frequency of 2.4 kHz. The pre-calculated values of the dominant frequencies differed. With the RTS Leica TS50 measuring equipment, this value was 2.55 Hz, and with the Polytec PDV 100 measuring equipment, it was 1.48 Hz. The explanation for this deviation is the wide frequency distribution of the measured signals, which was made possible by the Polytec PDV 100, which samples more quickly and accurately. Despite this difference, the results for the vertical displacement measurement with the two measuring devices were very similar: 5.18 and 5.24 mm, respectively. From the above, it can be concluded that the RTS Leica TS50 surveying equipment is sufficiently accurate for measuring displacements. Comparing the results obtained with the Instantel Minimate Plus, it can be seen that they deviate. The converted dominant frequency was 3.30 Hz, which is the maximum. Unfortunately, this equipment cannot measure real vertical displacement.

5. Conclusions

The results of dynamic response measurements using two different methods—RTSs and SLDV—show that geodetic methods are suitable for monitoring the dynamic response of structures subjected to vibration. Despite the higher number of readings, the problem of sampling uniformity may still arise. By excluding the distance meter, more uniform readings can be obtained. When determining the dynamic response, it is sufficient to only capture the variation along the angular directions.
When using RTSs to monitor the dynamic response of a structure, it is important to incorporate conventional physical methods into the monitoring. In this way, sufficient accuracy and visibility for changes in physical quantities that cannot be measured by geodetic methods can be ensured.
In order to compare the results obtained by geodetic and physical methods, it is necessary to transform the geodetic results. This can be achieved using spectral analysis methods, such as the fast Fourier transform and the Lomb–Scargle algorithm, which were proven to be appropriate mathematical tools for the analysis and processing of the measured signals. Using the Lomb–Scargle algorithm, we were also able to check the consistency of the original signals in the case of the geodetic methods by means of a spectral approximation in the range from 0 to 1 Hz. Furthermore, in the case of the physical methods, we were able to conclude that the spectral analysis provided extremely important information about the measured signals, such as the dominant frequency and the corresponding amplitude. Spectral analysis was thus proven to be a good mathematical tool for advanced data processing when comparing data.
The limitations of the presented model for monitoring the dynamic response of railway sleepers arise mainly when using contact methods on bridging facilities. If we want to monitor the response in a bridging object, it is necessary to provide an additional structure that is not tied to the observed object, since we have to install equipment on it to determine the responses of the observed object. Placing an additional structure—in the sense of construction scaffolding—is, of course, a problem for tall buildings, for inaccessible terrain under a building and, of course, for greater distances. The problem with the described measurement using the LDV equipment was also the range, as we were limited to maximum of 30 m. That is why we were looking for a solution to these problems and used a non-contact geodetic method, which can be used practically everywhere and at great distances and ranges. The method also has an advantage, as it provides the results for vertical movements in real time. Of course, this method also has its limitations, which mainly manifest in uneven and insufficient numbers of samples, presenting a problem in the calculation of the dynamic response. The overall conclusion is that the limits of the use of geodetic sensors for monitoring engineering structures have been greatly expanded, opening up new horizons in the monitoring of the condition of these structures during their service life.

Author Contributions

Conceptualization, B.K., S.T., R.P. and S.L.; methodology, B.K. and S.L.; software, B.K. and S.L.; validation, B.K., S.T., R.P. and S.L.; formal analysis, B.K. and S.L.; investigation, B.K., S.T., R.P. and S.L.; resources, B.K. and S.L.; data curation, B.K., S.T., R.P. and S.L.; writing—original draft preparation, B.K. and S.L.; writing—review and editing, B.K., S.T., R.P. and S.L.; visualization, B.K. and S.L.; supervision, B.K. and S.L.; project administration, S.L. All authors have read and agreed to the published version of the manuscript.

Funding

This research received no external funding.

Institutional Review Board Statement

Not applicable.

Informed Consent Statement

Not applicable.

Data Availability Statement

Not applicable.

Conflicts of Interest

The authors declare no conflict of interest.

References

  1. Rozli, M.I.F.; Safiuddin, M.H.; Dora, A.G.K.; Senin, S.F.; Rahman, A.S.A.; Ali, M.; Amin, N.M.; Nordin, M.N.F. Investigation of prestressed concrete sleeper’s vibration located at KM71.75 And KM79. IOP Conf. Ser. Earth Environ. Sci. 2020, 476, 012060. [Google Scholar] [CrossRef]
  2. Kumaran, G.; Menon, D.; Nair, K.K. Dynamic studies of railtrack speepers in a truck structure system. J. Sound Vib. 2003, 286, 485–501. [Google Scholar] [CrossRef]
  3. Çeçen, F.; Aktaş, B. Yeni Nesil Demiryolu Traversleri ve Yerli FRP Donatı Kullanımının Deneysel Aras¸tırması. Demiryolu Mühendisliği 2021, 13, 53–64. [Google Scholar]
  4. Çeçen, F.; Aktas, B. Modal and Harmonic Response Analysis of New CFRP Laminate Reinforced Concrete Railway Sleepers. Eng. Fail. Anal. 2021, 127, 105471. [Google Scholar] [CrossRef]
  5. Coelho, B.; Holscher, P.; Priest, J.; Powrie, W.; Barends, F. An assessment of transition zone performance. Proc. Inst. Mech. Eng. Part F J. Rail Rapid Transit 2021, 225, 129–139. [Google Scholar] [CrossRef]
  6. Esveld, C. Modern Railway Track, 2nd ed.; MRT-Productions, TU Delft: Zaltbommel, The Netherlands, 2001. [Google Scholar]
  7. Varandas, J.; Holscher, P.; Silva, M.A.G. Settlement of ballasted track under traffic loading: Application to transition zones. Proc. Inst. Mech. Eng. Part F J. Rail Rapid Transit 2013, 228, 242–259. [Google Scholar] [CrossRef]
  8. Grassie, S.L. Dynamic modelling of concrete railway sleepers. J Sound Vib. 1995, 187, 799–813. [Google Scholar] [CrossRef]
  9. Roberts, G.W.; Meng, X.; Henry Dodson, A. Integrating a global positioning system and accelerometers to monitor the deflection of bridges. J. Surv. Eng. 2004, 130, 65–72. [Google Scholar] [CrossRef]
  10. Ma, W.; Mu, Y.; Wu, Q.; Sun, Z.; Liu, Y. Characteristics and mechanisms of embankment deformation along the Qinghai–Tibet Railway in permafrost regions. Cold Reg. Sci. Technol. 2011, 167, 178–186. [Google Scholar] [CrossRef]
  11. Stiros, S.; Psimoulis, P. Response of a historical short-span railway bridge to passing trains: 3-D deflections and dominant frequencies derived from Robotic Total Station (RTS) measurements. Eng. Struct. 2012, 45, 362–371. [Google Scholar] [CrossRef]
  12. Paar, R.; Marendič, A.; Jakopec, I.; Grgac, I. Vibration Monitoring of Civil Engineering Structures Using Contactless Vision-Based Low-Cost IATS Prototype. Sensors 2021, 21, 7952. [Google Scholar] [CrossRef]
  13. Palazzo, D.; Friedmann, R.; Nadal, C.; Filho, M.S.; Veiga, L.; Faggion, P. Dynamic Monitoring of Structures Using a Robotic Total Station. In Proceedings of the XXIII FIG Congress, Muenchen, Germany, 8–13 October 2006. [Google Scholar]
  14. Rüeger, J.M. Overview of geodetic deformation measurements of Dams, Australian National Commitee on Large Dams. In Proceedings of the Annual Congress of the Australian National Committee on Large Dams (ANCOLD), Sydney, Australia, 20–22 November 2006. [Google Scholar]
  15. DeLoach, S.R. Continuous deformation monitoring with GPS. J. Surv. Eng. 1989, 115, 93–110. [Google Scholar] [CrossRef]
  16. Lekidis, V.; Tsakiri, M.; Makra, K.; Karakostas, C.; Klimis, N.; Sous, I. Evaluation of Dynamic Response and Local Soil Effects of the Evripos Cablestayed Bridge Using Multi-Sensor Monitoring Systems. Eng. Geol. 2005, 179, 7–17. [Google Scholar]
  17. Lienhard, W.; Ehrhart, M.; Grick, M. High Frequent Total Station Measurements for the Monitoring of Bridge Vibrations. In Proceedings of the 3rd Joint International Symposium on Deformation Monitoring (JISDM), Vienna, Austria, 30 March–1 April 2016. [Google Scholar]
  18. Schmitz, B.; Holst, C.; Medic, T.; Lichti, D.D.; Kuhlmann, H. How to Efficiently Determine the Range Precision of 3D Terrestrial Laser Scanners. Sensors 2019, 19, 1466. [Google Scholar] [CrossRef] [PubMed] [Green Version]
  19. Yi, Z.; Kuang, C.; Wang, Y.; Yu, W.; Cai, C.; Dai, W. Combination of High- and Low-Rate GPS Receivers for Monitoring Wind-Induced Response of Tall Buildings. Sensors 2018, 18, 4100. [Google Scholar] [CrossRef] [Green Version]
  20. Yang, X.; Steward, K.; Tang, L.; Xie, Z.; Li, Q. A Review of GPS Trajectories Classification Based on Transportation Mode. Sensors 2018, 18, 3741. [Google Scholar] [CrossRef] [PubMed] [Green Version]
  21. Psimoulius, P.; Pytharouli, S.; Karambalis, D.; Stiros, S. Potencial of GPS to measure frequencies of oscillation of engineering structures. J. Sound Vib. 2008, 318, 606–623. [Google Scholar] [CrossRef]
  22. Psimoulius, P.; Stiros, S. Monitoring of Bridged Structures Using GPS and RTS Experimental and Field Evidence. In Proceedings of the 4th International Conference on Engineering Surveying INGEO, Bratislava, Slovakia, 23–24 October 2008. [Google Scholar]
  23. Novakovic, G.; Marendić, A.; Grgac, I.; Paar, R.; Ilijaš, R. Locata—A New Technology for High Precision Outdoor and Indoor Positioning. Geodetski List 2015, 69, 279–304. [Google Scholar]
  24. Psimoulis, S.; Stiros, S. Measuring deflections of a Short-span Railway Bridges Using Robotic Total Station. J. Bridge Eng. 2013, 18, 182–185. [Google Scholar] [CrossRef]
  25. Poyraz, F. Uncertainty in the Determination of Fault Locking Depth and Strike Slip Rates by GNSS Measurements. Tech. Gaz. 2016, 23, 107–114. [Google Scholar]
  26. Grgić, I.; Repanić, M.; Malović, I. Preliminary Results of Combined Geodetic Methods in Monitoring. Tech. Gaz. 2017, 24, 301–308. [Google Scholar]
  27. Guntel, A.; Karabork, H.; Karasaka, L. Accuracy of Control Point Distribution for Different Terrain Types on Photogrammetric Block. Tech. Gaz. 2018, 25, 66–74. [Google Scholar]
  28. Ilci, V.; Ozulu, I.; Arslan, E.; Alkan, R.M. Investigation on the Accuracy of Existing Qibla Directions of the Mosques from Different Periods: A Case Study in Çorum City, Turkey. Tech. Gaz. 2018, 25, 1642–1649. [Google Scholar]
  29. Stempfhuber, W. The Integration of Kinematic Measuring Sensors for Precision Farming. In Proceedings of the 3rd International Symposium on Mobile Mapping Technology, Cairo, Egypt, 16–21 April 2000. [Google Scholar]
  30. Radovanovic, R.S.; Teskey, W.F. Dynamic monitoring of deforming structures: GPS versus robotic tacheometry systems. In Proceedings of the 10th FIG Symposium on Deformation Measurements, Orange, CA, USA, 19–22 March 2001. [Google Scholar]
  31. Kopačik, A.; Kyronović, P.; Kadlecikova, V. Laboratory Tests of Robotic Stations. In Proceedings of the FIG Working Week, Cairo, Egypt, 16–21 April 2005. [Google Scholar]
  32. Ceryova, I.; Kubanka, P.; Kopačik, A.; Kyrinović, P. Dynamic Tests of Robot Stations. In Proceedings of the FIF XXII International Congress, Washington, DC, USA, 15–19 March 2002. [Google Scholar]
  33. Chua, S.C. Testing of Robotic Total Stations for Dynamic Tracking. Bachelor’s Thesis, University of Southern Queensland, Faculty of Engineering and Surveying, Toowoomba, Australia, 2004. [Google Scholar]
  34. Garget, D. Testing of Robotic Total Stations for Dynamic Tracking. Bachelor’s Thesis, University of Southern Queensland, Faculty of Engineering ang Surveying, Toowoomba, Australia, 2005. [Google Scholar]
  35. Gikas, V.; Daskalakis, S. Full Scale Validation of Tracking Total Stations Using a Long Stroke Electrodynamic Shaker. In Proceedings of the 13th FIG Congress Shaping the Change, Munich, Germany, 8–13 October 2006. [Google Scholar]
  36. Cosser, E.; Roberts, G.W.; Meng, X.; Dodson, A.H. Measuring the dynamic deformation of bridges using a total station. In Proceedings of the 11th FIG Symposium of Deformation Monitoring, Santorini, Greece, 25–28 May 2003. [Google Scholar]
  37. Ferrer, B.; Espinosa, J.; Roig, A.; Perez, J.; Mas, D. Vibration frequency measurement using a local multithreshold technique. Opt. Express 2013, 21, 26198–26208. [Google Scholar] [CrossRef] [PubMed]
  38. Ugwiri, M.A.; Carratù, M.; Pietrosanto, A.; Paciello, V.; Lay-Ekuakille, A. Vibrations Measurement and Current Signatures for Fault Detection in Asynchronous Motor. In Proceedings of the 2020 IEEE International Instrumentation and Measurement Technology Conference (I2MTC), Dubrovnik, Croatia, 25–28 May 2020; pp. 1–6. [Google Scholar]
  39. Górski, P.; Napieraj, M.; Konopka, E. Variability evaluation of dynamic characteristics of highway steel bridge based on daily traffic-induced vibrations. Measurement 2020, 164, 108074. [Google Scholar] [CrossRef]
  40. Durand-Texte, T.; Melon, M.; Simonetto, E.; Durand, S.; Moulet, S.H. Single-camera single-axis vision method applied to measure vibrations. J. Sound Vib. 2020, 465, 115012. [Google Scholar] [CrossRef]
  41. Komarizadehasl, S.; Mobaraki, B.; Ma, H.; Lozano-Galant, J.-A.; Turmo, J. Development of a Low-Cost System for the Accurate Measurement of Structural Vibrations. Sensors 2021, 21, 6191. [Google Scholar] [CrossRef]
  42. Shang, Z.; Sun, L.; Xia, Y.; Zhang, W. Vibration-based damage detection for bridges by deep convolutional denoising autoencoder. Struct. Health Monit. 2021, 20, 1880–1903. [Google Scholar] [CrossRef]
  43. Zhao, J.; Li, W.; Guo, X.; Wang, H.; Rogers, J.A.; Huang, Y. Theoretical modeling of tunable vibrations of three-dimensional serpentine structures for simultaneous measurement of adherent cell mass and modulus. MRS Bull. 2021, 46, 107–114. [Google Scholar] [CrossRef]
  44. Cardona, C.I.; Tinoco, H.A.; Perdomo-Hurtado, L.; López-Guzmán, J.; Pereira, D.A. Vibrations Analysis of the Fruit-Pedicel System of Coffea arabica var. Castillo Using Time–Frequency and Wavelets Techniques. Appl. Sci. 2021, 11, 9346. [Google Scholar] [CrossRef]
  45. Li, L.; Cai, H.; Jiang, Q. Adaptive synchrosqueezing transform with a time-varying parameter for non-stationary signal separation. Appl. Comput. Harmon. Anal. 2020, 49, 1075–1106. [Google Scholar] [CrossRef] [Green Version]
  46. Sakurai, N.; Akimoto, H.; Takashima, T. Measurement of vertical and horizontal vibrations of a probe for acoustic evaluation of food texture. J. Text. Stud. 2020, 52, 25–35. [Google Scholar] [CrossRef]
  47. Meng, X.; Dodson, A.; Roberts, G.W. Detecting bridge dynamics with GPS and triaxial accelometers. Eng. Struct. 2007, 29, 3178–3184. [Google Scholar] [CrossRef]
  48. Celebi, M.; Sanli, A. GPS in Pioneering Dynamic Monitoring of Long-Period Structures. Earth-Quake Spectra 2001, 18, 47–61. [Google Scholar] [CrossRef]
  49. Marendič, A.; Paar, R.; Duvnjak, I.; Buterin, A. Determination of dynamic displacements of the roof of sports hall Arena Zagreb. In Proceedings of the Conference INGEO 2014, Prague, Czech Republic, 3–4 April 2014. [Google Scholar]
  50. D’Apuzzo, M.; Festa, B.; Giuliana, G.; Mancini, L.; Nicolosi, V. The Evaluation of Runway Surface Properties. A New Approach. Procedia Soc. Behav. Sci. 2012, 53, 1192–1201. [Google Scholar] [CrossRef]
  51. Bianchini Ciampoli, L.; Gagliardi, V.; Ferrante, C.; Calvi, A.; D’Amico, F.; Tosti, F. Displacement Monitoring in Airport Runways by Persistent Scatterers SAR Interferometry. Remote Sens. 2020, 12, 3564. [Google Scholar] [CrossRef]
  52. Ding, W.; Wu, J. An Airport Knowledge-Based Method for Accurate Change Analysis of Airport Runways in VHR Remote Sensing Images. Remote Sens. 2020, 12, 3163. [Google Scholar] [CrossRef]
  53. Đapo, A. Obrada i intrepretacija geodetskih mjerenja na Geodinamičkoj mreži Grada Zagreba. Master’s Thesis, University of Zagreb, Faculty of Geodesy, Zagreb, Croatia, 2005. [Google Scholar]
  54. Ferretti, A.; Prati, C.; Rocca, F. Permanent Scatterers in SAR Interferometry. IEEE Trans. Geosci. Remote Sens. 2001, 39, 8–20. [Google Scholar] [CrossRef]
  55. Pribičević, B.; Medak, D.; Đapo, A. Densification of the Zagreb Geodynamic Network in the area of northeast Medvednica. Geodetski List 2007, 61, 247–258. [Google Scholar]
  56. Mileusnic, M.; Parlov, J.; Bacani, A.; Durn, G. Conceptual model for groundwater status and risk assessment—Case study of the Zagreb aquifer system. Geol. Croat. 2013, 66, 55–76. [Google Scholar]
  57. Osmanoglu, B.; Sunar, F.; Wdowinski, S.; Cabral-Cano, E. Time series analysis of InSAR data: Methods and trends. ISPRS J. Photogramm. Remote Sens. 2016, 115, 90–102. [Google Scholar] [CrossRef]
  58. Wang, W. Protocol Based Pavement Cracking Measurement with 1 mm 3D Pavement Surface Model. Ph.D. Thesis, Oklahoma State University, Stillwater, OK, USA, 2015. [Google Scholar]
  59. Kamath, V.R.; Martinez, J.C. Generic representation of 3D motion paths in dynamic animations of simulated construction processes. Autom. Constr. 2008, 17, 188–200. [Google Scholar] [CrossRef]
  60. Khoemarga, K.V.; Tajudin, A.N. Structural design of Airport runway Case study: Jos Orno Imsula MOA Airport. IOP Conf. Ser. Mater. Sci. Eng. 2020, 852, 012013. [Google Scholar] [CrossRef]
  61. Becek, K.; Koppe, W.; Kutoğlu, Ş.H. Evaluation of Vertical Accuracy of the WorldDEM™ Using the Runway Method. Remote Sens. 2016, 8, 934. [Google Scholar] [CrossRef] [Green Version]
  62. Shewale, M.S.; Mulik, S.S.; Deshmukh, S.P.; Patange, A.D.; Zambare, H.B.; Sundare, A.P. Novel Machine Health Monitoring System. In Proceedings of the 2nd International Conference on Data Engineering and Communication Technology, Advances in Intelligent Systems and Computing; Springer: Singapore, 2019; Volume 828, pp. 461–468. [Google Scholar]
  63. Patange, A.D.; Jegadeeshwaran, R.; Bajaj, N.S.; Khairnar, A.N.; Gavade, N.A. Application of Machine Learning for Tool Condition Monitoring in Turning. Sound Vib. 2022, 56, 127–145. [Google Scholar] [CrossRef]
  64. Marendić, A. Primjena geodetskih mjernih sustava u nadgledanju građevina s naglaskom na praćenje dinamičkih pomaka. Ph.D. Thesis, University of Zagreb Faculty of Geodesy, Zagreb, Croatia, 2011. [Google Scholar]
  65. Motoh, T. Možnost merjenja dinamičnega odziva konstrukcij z nekontaktnimi geodetskimi metodami. Master’s Thesis, University of Maribor, Maribor, Slovenia, 2017. [Google Scholar]
  66. Benoit, P.; Le Donatien, H. Diagnosis and prediction of vibration from railway trains. Soil Dyn. Earthq. Eng. 2005, 25, 905–921. [Google Scholar]
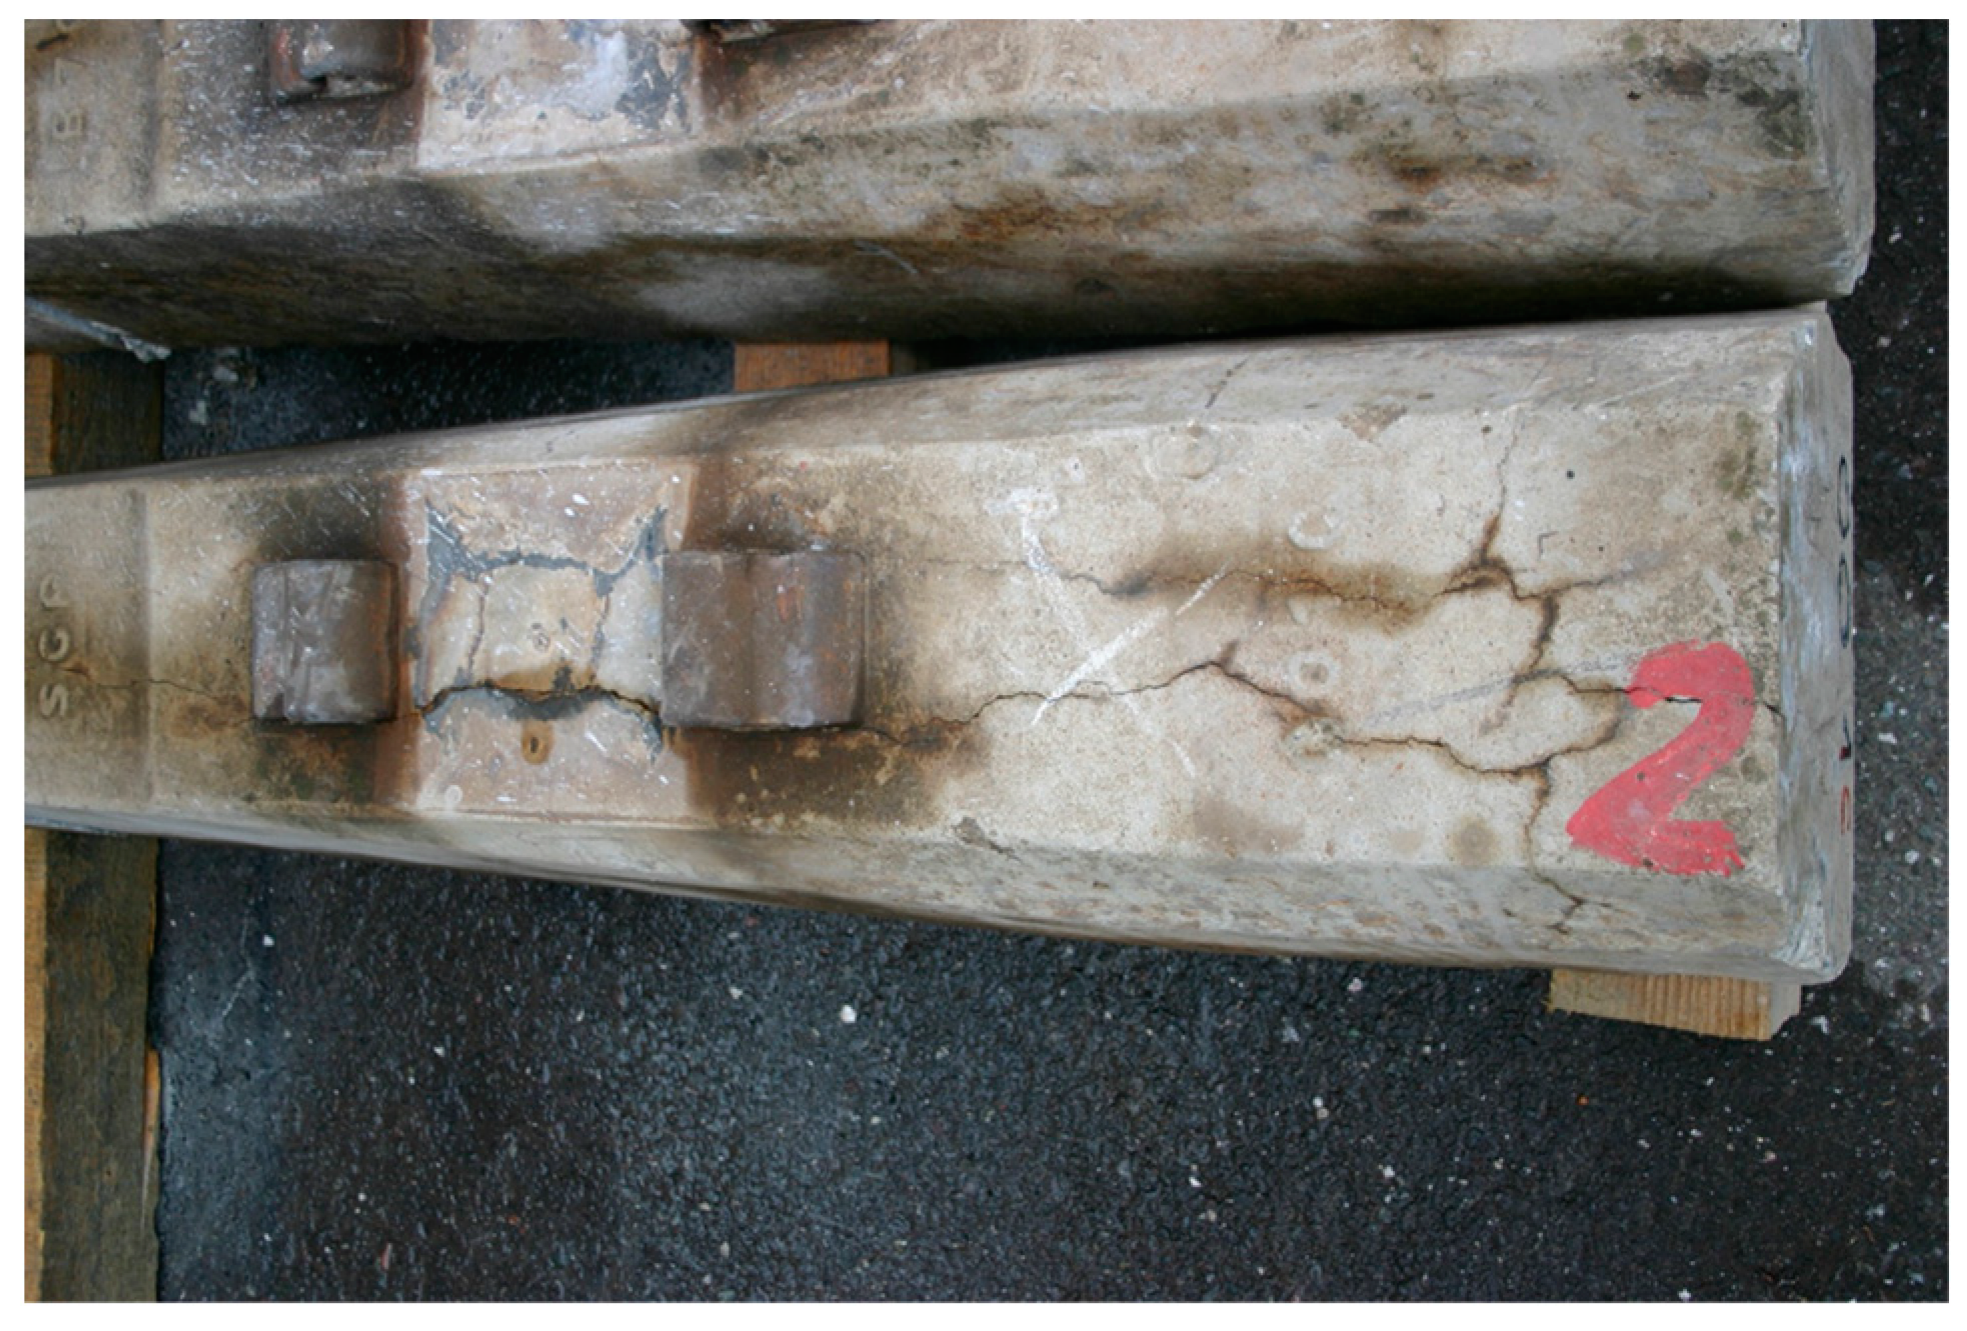
Figure 1. Typical cracks in the prestressed reinforced concrete railway sleepers investigated.
Applsci 12 12875 g001
Figure 2. The sensors of the measuring equipment used, rigidly connected to the prestressed reinforced concrete railway sleeper with a glued threaded rod: (1) geophone, (2) geodetic prism, (3) Doppler radar beam measuring sheet glued to the geophone casing.
Applsci 12 12875 g002
Figure 3. Results of vibration velocity measurements with the Minimate Plus seismograph for a passenger train in motion, where PPV—vertical is the vertical component of the vibration velocity and the number of vibration measurements is the number of measurements recorded over a period of 5.75 s.
Applsci 12 12875 g003
Figure 4. Results of vibration velocity measurements with the Minimate Plus seismograph for a freight train in motion, where PPV—vertical is the vertical component of the vibration velocity and the number of vibration measurements is the number of measurements recorded over a period of 31.75 s.
Applsci 12 12875 g004
Figure 5. Results of a vertical displacement measurement with a Leica TS 50 RTS for a passenger train in motion.
Applsci 12 12875 g005
Figure 6. Results of a Leica TS 50 RTS vertical displacement measurement for a freight train in motion.
Applsci 12 12875 g006
Figure 7. Results of a vertical displacement measurement with LDV Polytec PDV 100 for a passenger train in motion.
Applsci 12 12875 g007
Figure 8. Results of a vertical displacement measurement with the LDV Polytec PDV 100 for a freight train in motion.
Applsci 12 12875 g008
Figure 9. The location of the geophones labelled G1, G2 and G3. The arrow labelled B shows a static hydraulic piston with a capacity of 100 kN and the arrow labelled A shows a piston that was pulsed at a frequency of 1.5 to 2 Hz in the range between 20 and 100 kN.
Applsci 12 12875 g009
Figure 10. The graph shows the average peak displacement (PD) values in all three orthogonal directions (T—transversal, V—vertical, L—longitudinal) under cyclic low-frequency pulsed loading for the geophone locations shown in Figure 9.
Applsci 12 12875 g010
Figure 11. Plot of the calculated PPV values under cyclic low-frequency pulsed loading for the geophone locations shown in Figure 9.
Applsci 12 12875 g011
Figure 12. Geodetic measurement equipment. (A) Geodetic measurement point; (B) Leica TS50; (C) personal computer with GeoCOM/ZG software.
Applsci 12 12875 g012
Figure 13. Plot of the vertical displacement measurement at the G3 (B) measuring point for an interval of 40 s; the maximum vertical displacement is 5.18 mm.
Applsci 12 12875 g013
Figure 14. Illustration of the vertical displacement measurement interval at site G1 (B) with SLDV equipment; the maximum vertical displacement is 5.24 mm.
Applsci 12 12875 g014
Figure 15. Maximum corresponding values and absolute differences of the Lomb–Scargle spectral approximation in the frequency range from 0 to 1 Hz.
Applsci 12 12875 g015aApplsci 12 12875 g015b
Table 1. Characteristics of the Instantel Minimate Plus measuring equipment.
Measuring rangeUp to 254 mm/s
Resolution0.127 mm/s
Accuracy±0.5%
Frequency range2–250 Hz
Table 2. Characteristics of the RTS Leica TS 50 measuring equipment.
Angle Measurement Accuracy0.5″
Minimum reading0.01″
Accuracy of the reflector measurement0.6″ + 1 ppm
Measurement accuracy without reflector2.0″ + 2 ppm
Capture frequency—original
Capture frequency with GeoCOM/ZG
Up to 9 Hz
Up to 30 Hz
Table 3. Characteristics of the Polytec PDV 100 measuring equipment.
Frequency range0–22 kHz
Full-scale peak20/100/500 mm/s
Scaling factor5/25/125 m s−1/V
Velocity resolution˂0.02 μm s−1/Hz0.5
Maximum acceleration2760/13,800/69,000 m s−2
Table 4. Numerically evaluated vertical displacement for Passenger Train.
Passenger TrainVertical Displacement (mm)
RTS2.97
LDV2.62
Table 5. Numerically evaluated vertical displacement results for Freight Train.
Freight TrainVertical Displacement (mm)
RTS8.13
LDV9.12
Table 6. Calibrated measurement results from Minimate Plus measuring equipment for Passenger Train.
Passenger TrainTransversalVerticalLongitudinal
Peak particle velocity (mm/s)8.12823.115.715
ZC frequency (Hz)9.37.2>100
Peak acceleration (g)0.8481.5510.729
Peak displacement (mm)0.1610.2920.093
FFT dominant frequency (fHz)2.9363.5004.125
Table 7. Calibrated measurement results from Minimate Plus measuring equipment for Freight Train.
Freight TrainTransversalVerticalLongitudinal
Peak particle velocity (mm/s)17.9169.0920.70
ZC frequency (fHzg)>100>100>100
Peak acceleration (fg)2.6785.7802.492
Peak displacement (fmm)0.1150.4920.063
FFT dominant frequency (fHz)2.5632.5632.563
Table 8. Numerical differences of the Lomb–Scargle spectral approximation in the frequency range from 0 to 1 Hz.
Vertical Displacement (mm)Lomb Scargle Periodogram
(Range 0–1 Hz)
A(f)
MinMaxΔMinMaxΔ
TS50−5.031.216.23−47.7113−22.739824.97150.005322
Table 9. Analysis: laboratory monitoring results.
Measuring DeviceFrequency Range (Hz)Dominant Frequency (Hz)Amplitude Vertical Displacement (mm)
RTS Leica TS50 26 Hz2.55550.52005.18
Instantel Minimate Plus250 Hz3.3070.307-
Polytec PDV 1002.4 kHz1.4841.5595.24
Publisher’s Note: MDPI stays neutral with regard to jurisdictional claims in published maps and institutional affiliations.