Article

Repair of Damaged Continuity Joints Using Ultra-High Performance, Fiber Reinforced Self-Consolidating, and Magnesium–Aluminum–Liquid–Phosphate Concretes

1
U.S. Army Engineer Research and Development Center, Geotechnical and Structures Laboratory, 3909 Halls Ferry Rd., Vicksburg, MS 39180, USA
2
Civil Engineering and Environmental Science, University of Oklahoma, 202 W. Boyd St. Rm. #334, Norman, OK 73019, USA
*
Author to whom correspondence should be addressed.
Appl. Sci. 2022, 12(24), 12775; https://doi.org/10.3390/app122412775
Submission received: 14 November 2022 / Revised: 5 December 2022 / Accepted: 10 December 2022 / Published: 13 December 2022
(This article belongs to the Special Issue Existing Bridges: From Inspection to Structural Rehabilitation)

Abstract

:
Bridge elements known to develop damage over time are individual continuity joints connecting girders. Replacing damaged joints is an expensive and invasive process and a need exists to design a less invasive repair method. This study focused on evaluating an encapsulation repair method for continuity joints that would not require extensive demolition of the bridge deck to implement and could potentially be constructed without bridge closure. Approximately half scale connected bridge girder specimens were constructed and purposely damaged to create similar crack patterns to those seen in bridges. Once damaged, a set of three specimens was repaired using the encapsulation method with three different high performance materials, ultra-high performance concrete (UHPC), fiber reinforced self-consolidating concrete (FRSCC), and magnesium–aluminum–liquid–phosphate (MALP) concrete. Of the three repaired specimens for each material, one was tested in positive moment bending and two in negative moment bending, similar to in situ conditions. The results appear to indicate that using each of the tested materials as an encapsulation repair for damaged continuity joints is viable to re-establish continuity and load capacity. However, the UHPC repairs’ resistance to cracking could indicate the best performance by further protecting the continuity joint reinforcing steel from water ingress.

1. Introduction

Aging infrastructure continues to be a major issue, and, over time, the costs of replacement continue to grow to a scale where immediate replacement of damaged infrastructure is no longer economically feasible. As a result, novel, lower cost repair methods have been developed to extend the service life of these damaged infrastructure elements until replacement can occur. One major area of concern in bridges and a known location where damage is common is in the joints connecting individual precast, prestressed concrete girders to provide continuity for live loads (i.e., the continuity joints). The continuity joints are placed simultaneously with the bridge deck concrete after installation of the prestressed girders on the bridge bents. The self weight of the girders and deck is supported by the girders in a simply supported condition and, once the continuity joints and deck concrete reach sufficient strength and stiffness, the entire system becomes continuous for any additional loading [1]. However, a major concern with these types of girder connections is loads imposed by time-dependent effects such as creep and shrinkage of the prestressed concrete girders and shrinkage of the deck concrete. Such differential movement can lead to positive bending stresses developing in the joint and are meant to be accounted for in the joint reinforcement design [2,3].
This method of connecting individual prestressed girders is used in several bridges in Oklahoma. However, over time, the positive moments induced by these time-dependent effects have caused excessive cracking along the height of the continuity joints. An example of this type of damage is shown in Figure 1. The development of this cracking implies a loss of continuity through these joints, resulting in the girders behaving as simply supported elements instead of continuous for superimposed and live loads. To test this, researchers at the University of Oklahoma conducted load testing before and after replacing damaged conventional concrete continuity joints with a commercially available ultra-high performance concrete (UHPC). The pre-repair load test appeared to show a lack of continuity. After the joints were removed and replaced with UHPC, the same load test was performed, and continuity was monitored using internal strain gauges in the joints. The results of the post-repair load test appeared to show that continuity was reestablished once the joints were replaced [4].
While this process was effective in repairing the damaged joints, replacing every damaged joint with UHPC would be prohibitively expensive and time consuming. Therefore, researchers at the University of Oklahoma designed an encapsulation repair method that would not require demolition of the existing joints and uses far less repair material. One requirement for this repair method was the use of a highly durable material to resist moisture ingress and reduce the likelihood of deterioration to the existing already damaged continuity joint.
Three high performance materials were chosen for testing this repair method. The first material was a non-proprietary UHPC mix design developed at the University of Oklahoma [5]. UHPC was chosen due to its high compressive and tensile strength coupled with its enhanced durability [6,7,8,9]. It has been shown to have excellent bond performance to conventional concrete [10,11,12]. UHPC has previously been used as an overlay material to protect existing bridge decks [13,14,15]. Investigations have also successfully used UHPC to repair girder end regions. The Connecticut Department of Transportation (CDOT) demonstrated that UHPC encapsulation repairs of artificially damaged steel girders enhanced the end bearing capacity beyond undamaged girders [16]. Later, this UHPC encapsulation repair was implemented on an in-service bridge in Houston, TX [17]. Shafei successfully repaired artificial web damage at the end region of an Iowa bulb-tee-C-shaped girder, highlighting the satisfactory bond performance between the UHPC and conventional concrete substrate [18].
The second material chosen for this repair was a fiber reinforced, self-consolidating concrete (FRSCC) also developed at the University of Oklahoma [19]. FRSCC incorporates both shrinkage compensating cement and polypropylene fibers to improve post-crack performance, reduce the potential for cracking caused by shrinkage, and improve the material performance when used as a repair material [20]. Khayat also noted that the presences of fibers in addition to an expansive agent improved flexural strength and flexural toughness [21]. This material was successfully used to repair a damaged, full scale AASHTO Type II girder and restored 83% of the original capacity of the girder. The FRSCC was able to flow around congested reinforcement without creating any major voids [22].
The third and final material chosen for this repair was a magnesium–aluminum–liquid–phosphate (MALP) concrete. This material was originally developed for repairs of industrial floors exposed to spills of high-temperature materials [23]. The material has been shown to rapidly gain compressive strength, have high bond strength, and have excellent durability performance [24,25]. MALP concrete can potentially halt the progression of steel reinforcement corrosion by converting the iron oxide to a metal phosphate [26]. This material has been successfully used to repair expansion joint headers and as a patching material on bridge decks in several states [23,27,28].
While the mentioned materials have been successfully used as repair materials in a number of applications, the above referenced repair methods have not been attempted on continuity joints connecting individual prestressed, precast concrete girders. The encapsulation repair method was evaluated by testing specimens consisting of two approximately half scale AASHTO girders connected by a continuity joint. The joint was artificially damaged through positive bending until the specimens mimicked damage observed on in-service bridges. After being damaged, the continuity joints of the specimens were repaired with the three chosen repair materials. The repaired girders were then tested and compared to control, undamaged connected girder specimens to assess the ability of the repair to re-establish continuity and design strength of the system. The validation of this repair method provides an alternative to bridge owners to removing and replacing in-kind materials and protects the damaged areas from additional deterioration by using high performance materials in a new application. This method allows for repair of bridges without closure of the bridge and interruption to traffic. In addition, it would provide a cost-effective interim solution to the reduction of performance of aging infrastructure, effectively extending service life until replacement is possible.

2. Materials and Methods

2.1. Concrete Mix Designs and Mixing Procedures

Four different concretes were used in this study, the base concrete used for the original girders and continuity joints and the three specialty concretes used for repair. The test girders and the continuity joints were constructed of a Class AA concrete, which was the specified concrete for bridge superstructures outlined in the Oklahoma Department of Transportation (ODOT) standard specifications [29]. The mix design is shown in Table 1. The material was provided by the ready-mixed concrete provider Dolese Bros. Co. in Norman, OK. The material was loaded into a standard mixer truck and the transit time between the batch plant and the casting location was approximately twenty minutes. Water was added upon arrival of the truck to obtain the desired slump before being placed in the forms.
The first repair material evaluated was the UHPC. The mix design is also shown in Table 1. A 0.15 m3 batch of UHPC was mixed in a Mixer Systems, Inc. Horizontal Shaft Mixer with a 0.6 m3 capacity. First, all the dried materials were placed in the mixer and allowed to blend for ten minutes. Then, half of the water reducer was added to the water, and the water then added to the mixer over the course of two minutes. After an additional minute of mixing, the remainder of the water reducer was added. Once the mix achieved flowability, the fibers were added to the mixer and allowed to blend over the course of three minutes. The material was then dispensed into buckets for placement into forms.
The second repair material evaluated was the FRSCC. The mix design is also shown in Table 1. The same mixer was used for the FRSCC as the UHPC and the same amount of concrete was mixed. After adding the air entraining admixture to the sand, all the aggregates were added to the mixer with half of the water and allowed to mix for several minutes. Then, the cementitious material was added to the mixer, along with the high range water reducer and the remaining water. After mixing for eight minutes, MasterFiber MAC Matrix polypropylene fibers were added to the mix and allowed to disperse for three minutes. Citric acid was added to the mixture at a dose of 0.4% of the weight of the Type K shrinkage compensating additive alongside the fibers to provide additional working time, due to the fast-setting nature of the mixture. The material was then dispensed into buckets and placed in the forms.
The final repair material evaluated was the MALP concrete. This proprietary product consisted of a dry, bagged mixture containing the cementitious material, aggregates, and 25 mm long fibers, along with a liquid activator. The manufacturer’s recommended proportions for mixing was one bag of dry material to one container of activator. The material was mixed according to the manufacturer’s recommendations in 0.02 m3 buckets using the supplied mixing paddle attached to a standard electric drill. The liquid activator was poured into the bucket, and the dry ingredients were then slowly poured on the liquid activator while the paddle was simultaneously rotating in the bucket. The materials were mixed for one minute before being poured into the forms. The material was only mixed one bucket at a time, and subsequently poured over the previous material, due to its fast-setting nature. Due to the speed of mixing and placement, no cold joints were apparent upon removal of the forms.

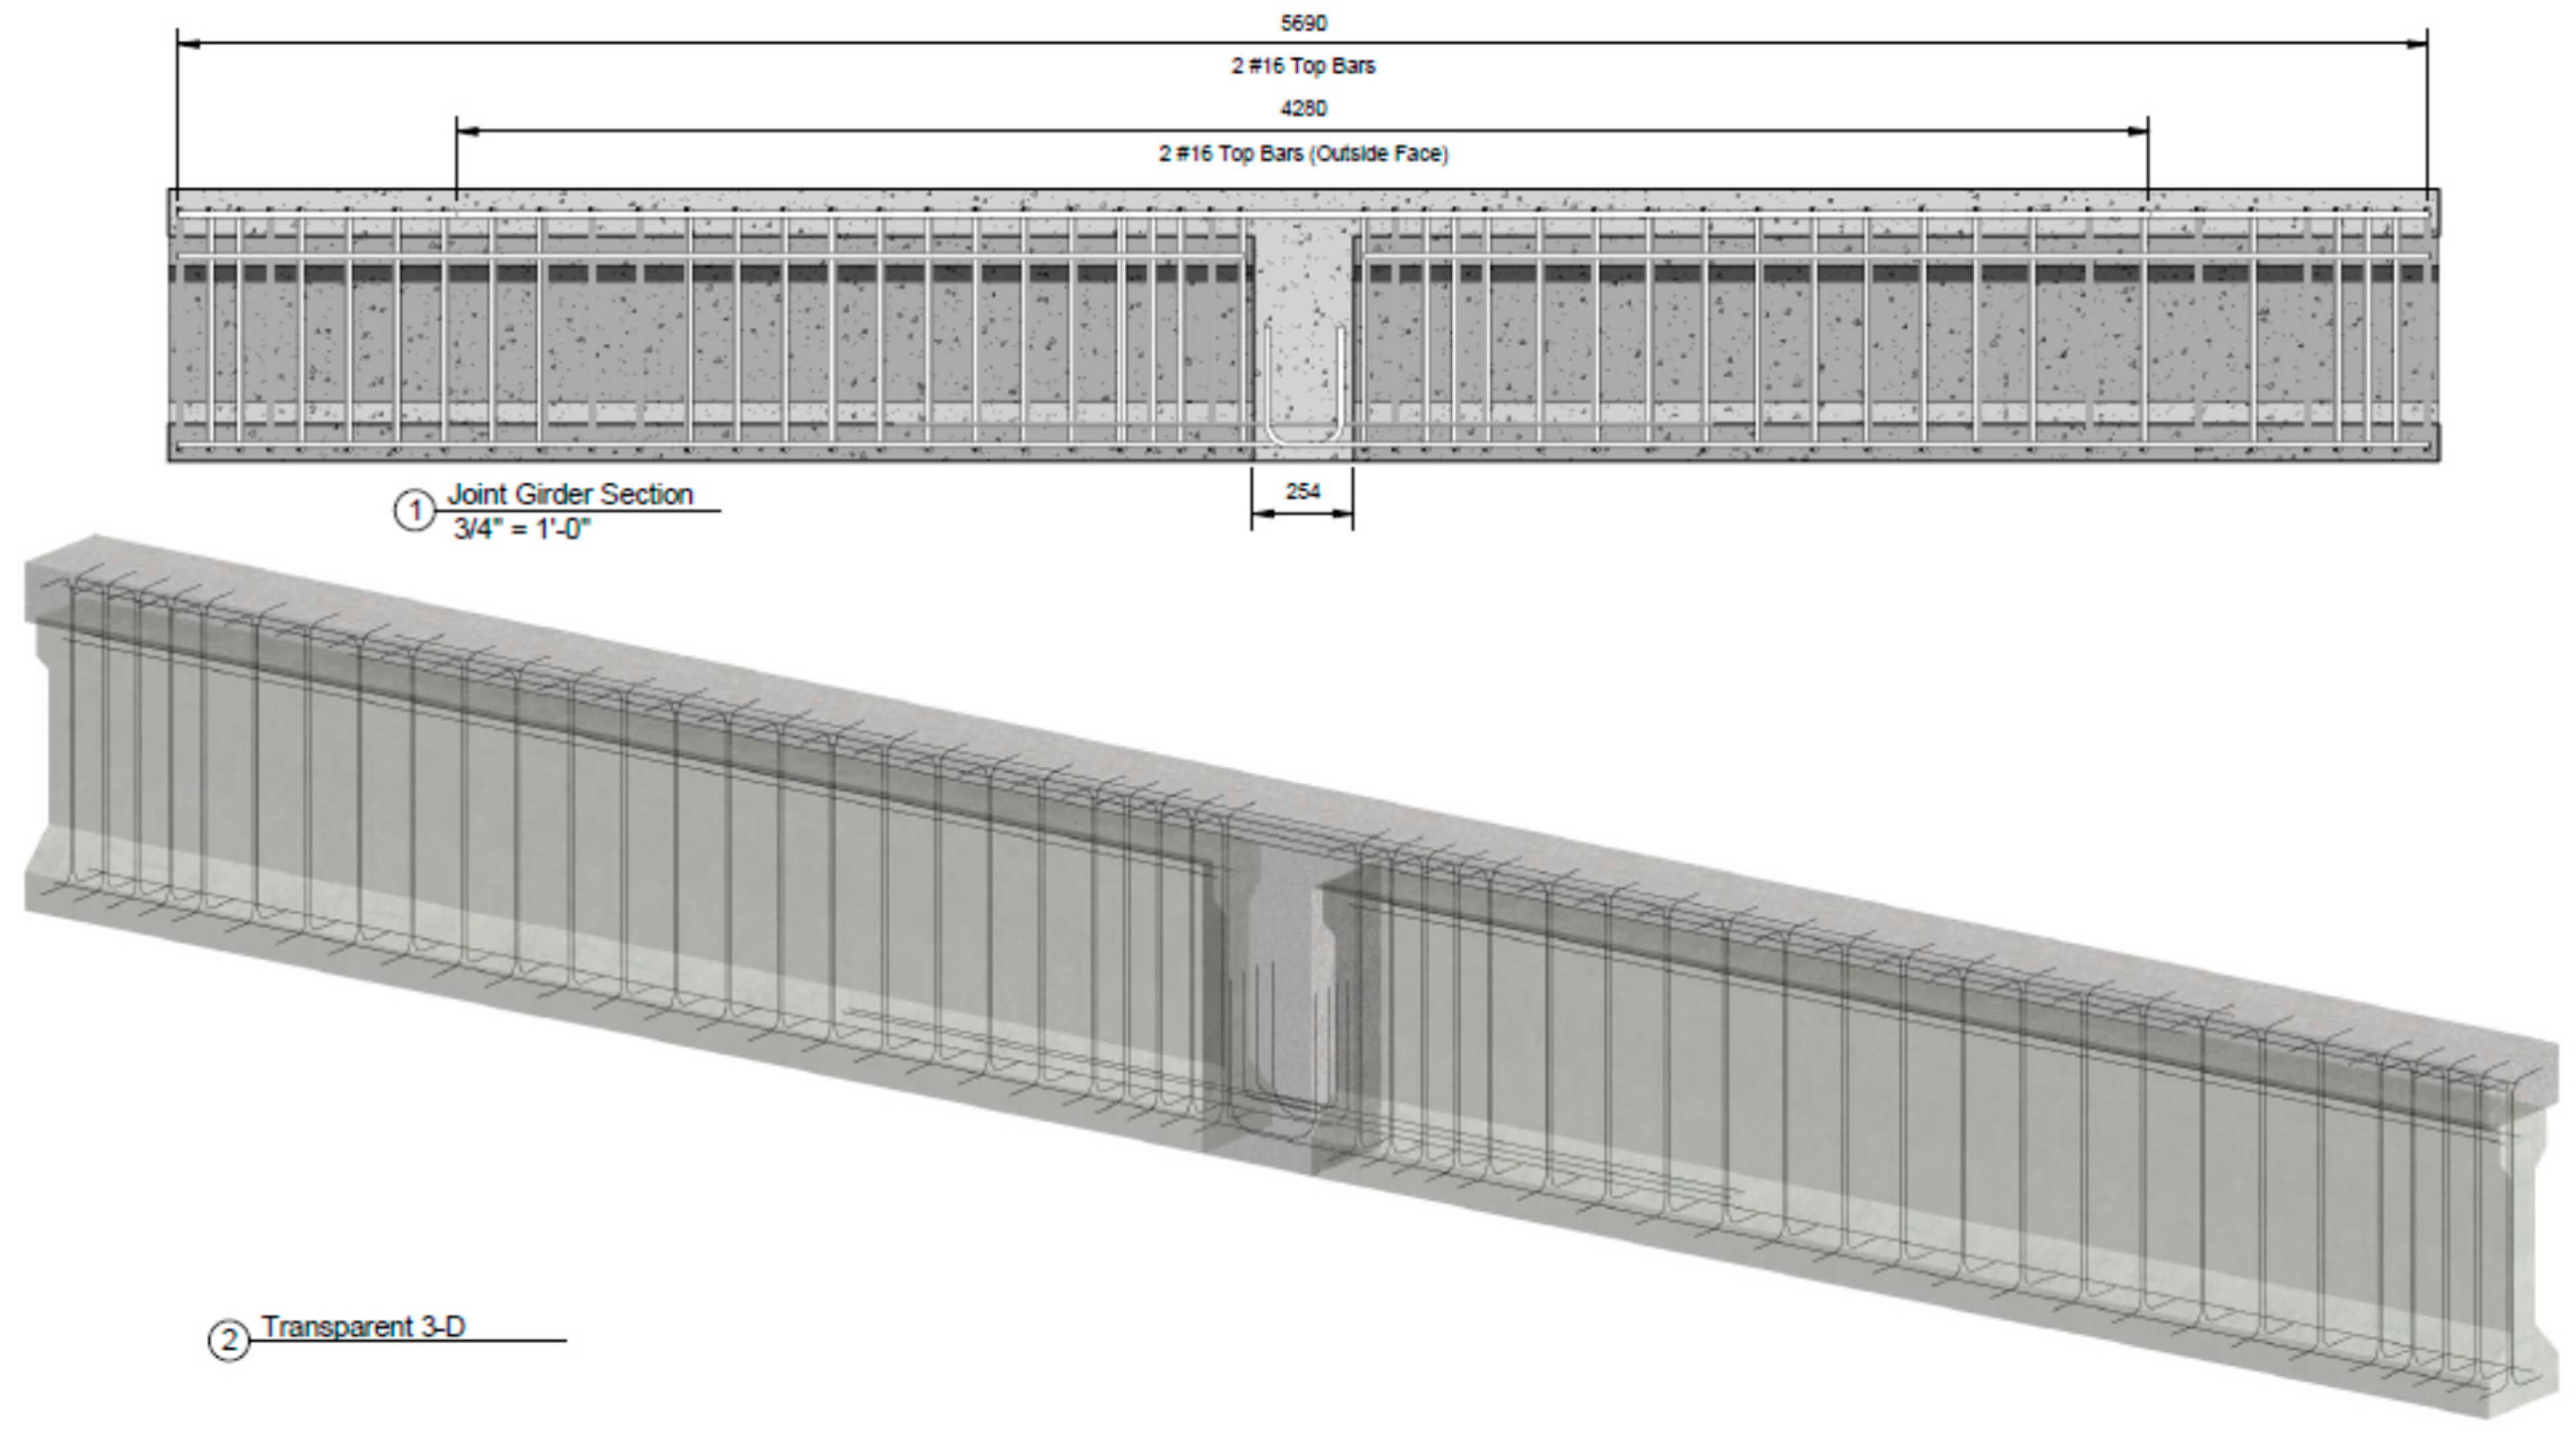
2.2. Continuous Girder Construction

The test connected girder specimens consisted of two, 2.74 m long approximately half scale AASHTO girders that were connected by a 254 mm wide continuity joint. This girder connection mimics a similar detail that was used on bridges in Oklahoma to make the girder continuous for live load. The dimensions and reinforcing layout of the individual girders were based on previous research [30,31,32] and are shown in Figure 2. The fully constructed connected girder test specimen is shown in Figure 3.
Typically, precast girders used in bridges in Oklahoma are prestressed with steel strands. However, the individual girders were not prestressed to simplify construction and remove one of the variables. In a typical continuity joint, six of the bottom strands in the girder would extend approximately 1 m from the girder end then be bent up at a 90° angle approximately 200 mm from the end of the girder to reinforce the continuity joint. Since there was no prestressing strand in the girders, two #10 and two #16 mild steel reinforcing bars were extended into the continuity joint to provide the connection between the girder and the joint. This reinforcement provided the same flexural capacity as the prestressing strands would have provided. The shear reinforcement in the girder was designed to ensure the girder did not fail in shear during testing.
Connected girder test specimen construction began by first casting two 2.74 m long girder sections. After casting, the girders were arranged to their final configuration. Once the girders were set, formwork was placed around the two girders to form the top deck and the continuity joint. The concrete for the deck and continuity joint was then placed in one pour, similar to construction of in situ bridges. A total of twelve completed connected girder test specimens were constructed. Three undamaged connected girder specimens were tested as control tests. The remaining nine were damaged in positive bending, repaired with each of the repair materials, then tested again post-repair in negative bending to determine whether continuity was restored.

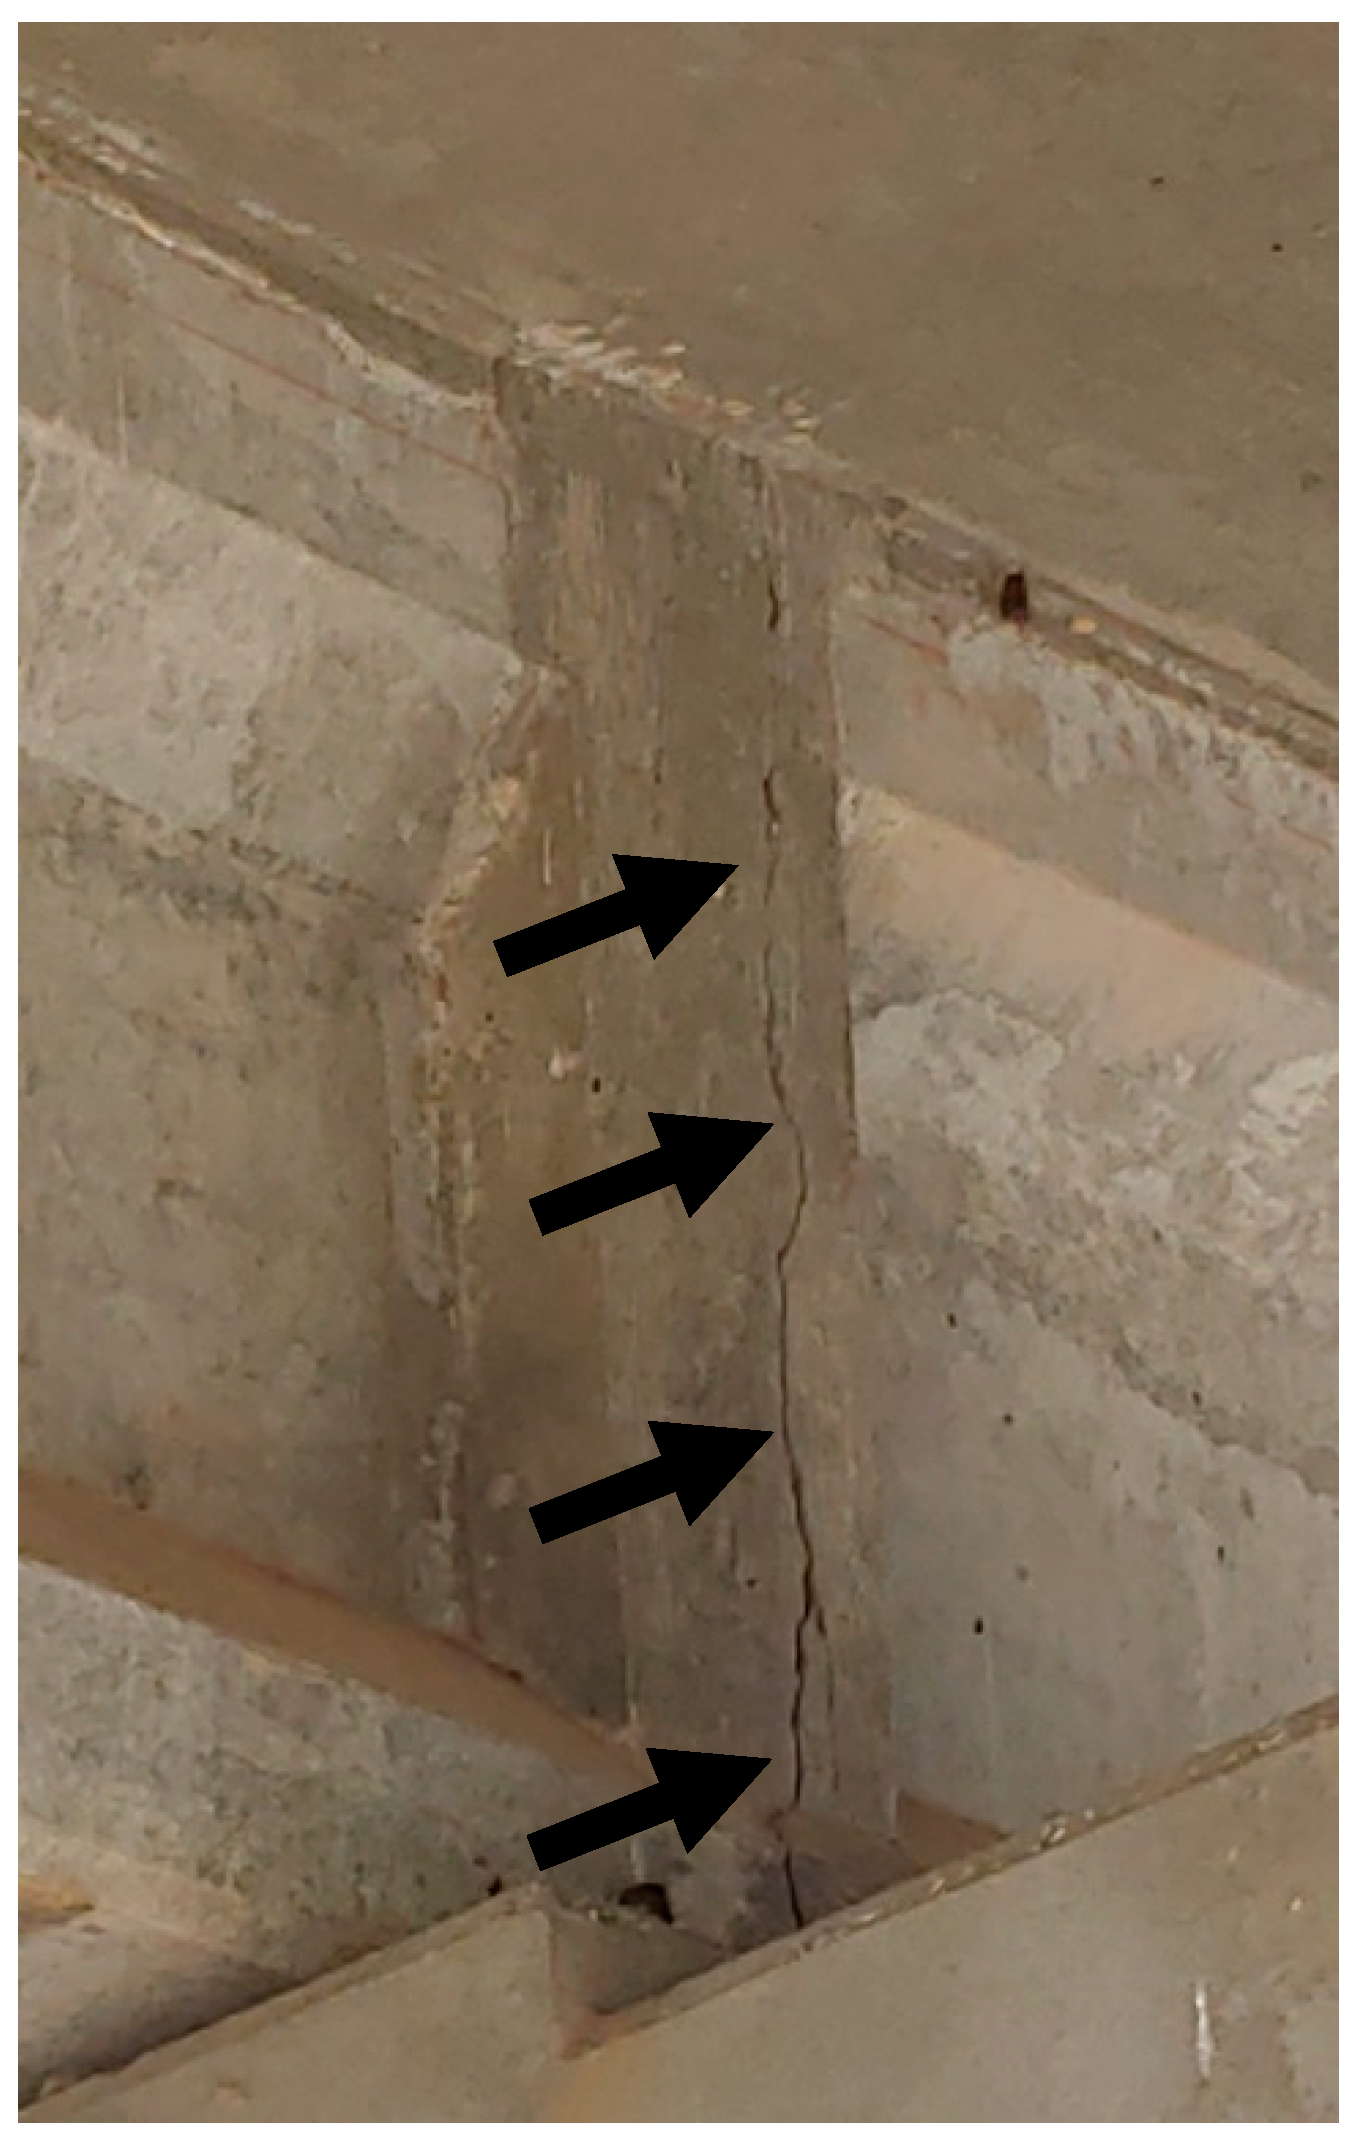
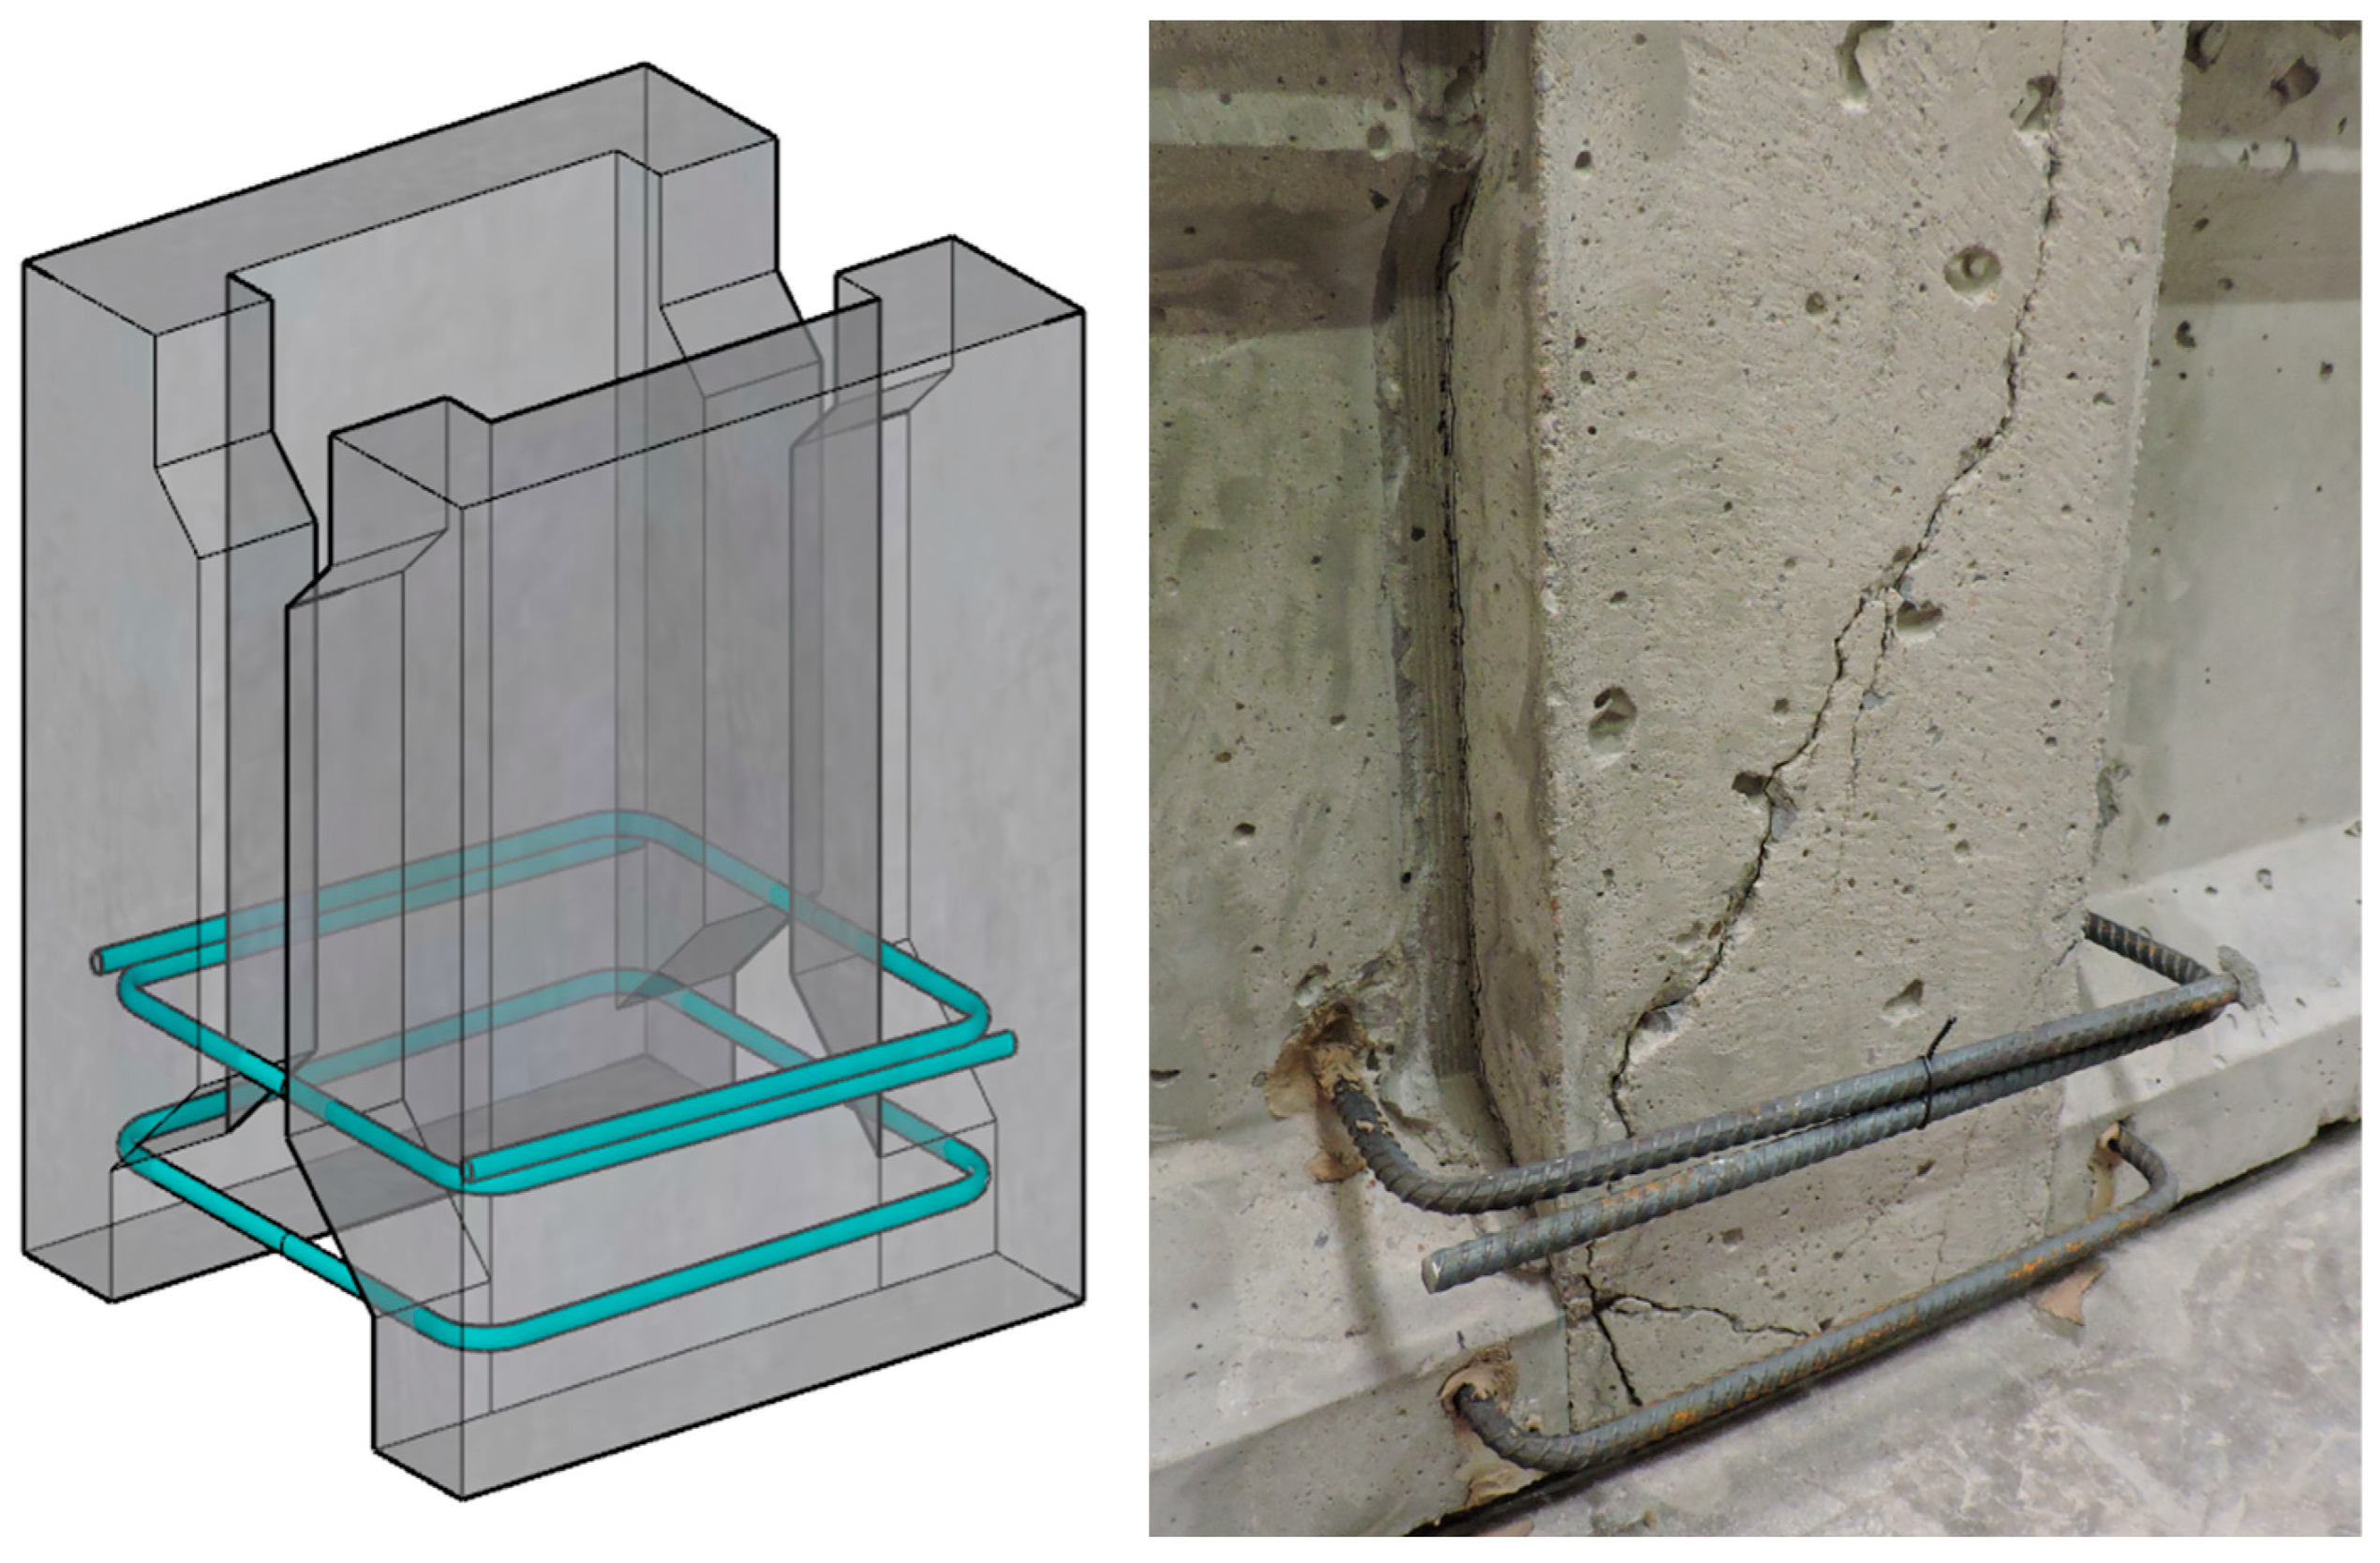
2.3. Positive Bending to Induce Crack Mimicking In Situ Damage

Once the connected girder specimens were constructed, the next step was to create the damage that has been observed in bridges using this continuity joint. Damage observed in the field appears to be caused by movement of the prestressed girders due to a combination of creep, shrinkage, and temperature effects that are restrained by the joint. The cracks formed in the in situ joints appear to provide evidence of excessive movement in the bottom region of the girders due to the large concentration of prestressed tendons, causing a stress condition similar to a beam subjected to positive moment bending [2]. Since the continuity joints were typically not designed to withstand large tensile stresses in the bottom of the joints, large cracks were formed. An example of such damage is shown in Figure 1.
Since the damage mimics positive moment cracking, each connected girder test specimen that would be repaired was tested to apparent failure in positive bending, indicated by large crack formation coupled with a significant drop in the applied load. The clear span between 100 mm wide neoprene bearing pads was set to 5.54 m and the connected girder specimens were subjected to a single point load centered on the continuity joint. The connected girder specimens were loaded to 40 kN in 20 kN increments, and then were loaded to failure in 10 kN increments. Deflection was not monitored during this test. Cracks were marked on the connected girder specimens after each load increment to ensure the behavior was satisfactory and no large shear cracks were formed. A connected girder specimen is shown in the test setup in Figure 4.

2.4. Continuity Joint Repair

Once damage was induced, the connected girder specimens were repaired with each of the specialty concretes described in Section 2.1. The continuity joints were repaired by encapsulating all sides with a 76 mm thick section of the repair material. This thickness was chosen due to the approximately half scale size of the specimens and allowing for a minimum of 25 mm clear cover for the reinforcing steel bars in the repair. The repair encapsulated the sides of the joints from the bottom of the deck to the bottom of the girder. This repair layout was chosen based on what portion of an in-service continuity joint would be accessible for repair. Due to interference from the girder supports, there would be no way to wrap a repair around the bottom of the joint without lifting the girders off the supports. Also, an in situ repair would have to stop at the bottom of the bridge deck, or else extensive demolition would be required.
The intent of the repair was to provide an additional load path for the compressive forces induced by the negative moment developed by traffic, provide additional support for any positive moments caused by expansion and contraction of the bridge due to temperature gradients, and to protect the joint reinforcement from corrosion. Therefore, reinforcing steel was placed only in the lower portion of the repair, since the tensile forces from live loads would be carried by the reinforcing steel in the bridge deck. The eighth edition of the AASHTO LRFD Bridge Design Specifications [3] was used to design the reinforcing steel to resist the effects of a temperature gradient on the bridge. The flexural deformation caused by a specified temperature gradient on the cross section of a girder and the moment caused by the deformation were determined using equations C4.6.6-3 (below as Equation (1)) and C4.6.6-7 (below as Equation (2)) in the AASHTO specification [3], respectively. Each equation is shown below.
ϕ = α I c   T G z d w d z
M c = 3 2 E I c ϕ
where ϕ is beam rotation per unit length, α is the concretes coefficient of thermal expansion, TG is the temperature gradient, z is the vertical distance from the center of gravity, and E is the modulus of elasticity. The temperature induced moment was calculated using the dimension of the actual connected girder test specimen. The material properties of the concrete were determined using the AASHTO specification, assuming a concrete compressive strength of 27.6 MPa, the design strength of the Class AA concrete. With a temperature gradient of 7.8 °C determined using AASHTO Figure 3.12.3-1 [3], the beam rotation induced by the temperature gradient was determined to be 0.000008429 radians, causing a moment of 85,240 N-m. This moment would require a minimum of 357 mm2 of Grade 420 reinforcing steel in the tension region. To facilitate placement of the reinforcing steel in two layers, a total of four #13 bars in two layers was chosen for reinforcement.
Two different sized U-bars were used as reinforcement for each layer. The bottom layer consisted of two 356 mm long bars (measured from outside of hook to outside of hook) with 165 mm long hooks, which were epoxied into the bottom bell 114 mm using Hilti HIT-HY 200-R structural epoxy. One U-bar was place on either side of the bottom bell. The top layer consisted of two 330 mm long bars (measured from outside of hook to outside of hook) with 356 mm long hooked legs. A hole was drilled through the 76 mm wide web and the straight bar was fed through. The hooks were then added to the bar using a manual rebar bender. These bars were designed for the legs to lap 240 mm. Strain gauges were attached to the bottom layer of reinforcing steel parallel to the specimens’ longitudinal axis in the repair on the side of the bar to monitor the stress development during loading and were attached to the top of one inner and one outer reinforcing bar in the deck at the joint locations. All gauges were placed at the center of the joint in the longitudinal direction.
Prior to placement of the repair material, the surfaces that would be in contact with the repair materials were sandblasted to facilitate bonding between the two materials. After sandblasting, the reinforcing bars were installed, and the formwork was placed around both sides of the damaged joint that would provide the space for the 76 mm thick repair. The joint repair reinforcing is shown in in Figure 5. After placement of the repair material, the repaired specimens were allowed to cure for a minimum of 28 days in ambient conditions in Fears Structural Engineering Laboratory (variable temperature and humidity based on the weather after casting in similar conditions seen by in-service bridge girders) prior to testing.

2.5. Post-Repair Testing

Of the three repaired specimens for each repair material, one was tested in positive bending using the same test setup used to induce the failure cracks. This testing was conducted to assess how the repaired specimens perform under the same loading conditions used to damage the continuity joint. This behavioral difference could provide insight into how the repaired joint could withstand additional positive moment induced by temperature and time-dependent effects. The remaining two specimens were tested in a manner that induced negative bending stresses, similar to what an in-service continuity joint would be subjected to from traffic loading. For this test, the connected girder specimens were rotated about their longitudinal axis 180° so that the deck was on the bottom of the specimen. Once rotated, the connected girder specimens were subjected to the same positive bending test setup with a single point load at midspan. With the specimen rotated, this would cause tensile stresses in the deck and compressive stresses in the bottom web, mimicking negative moment bending on the upright specimen. The loading rate used for the post-repair connected girder specimens was the same as used for developing the flexural failure crack in the continuity joint. The deflection was monitored using wire potentiometers at midspan and strains were measured on the joint repair reinforcement and the longitudinal deck reinforcement. Three undamaged control connected girder specimens were also tested in this manner to compare performance between a pristine joint and a repaired joint.

3. Discussion of Results

3.1. Compressive Strengths

The average compressive strengths for each of the concretes used are shown in Table 2. There were only two cylinders available for testing the compressive strength of the FRSCC, resulting in a high coefficient of variation. However, the average value reported was similar to compressive strengths determined during the development of the mix design by Choate [22]. The compressive strengths of the two cylinders tested for FRSCC were 41.4 MPa and 56 MPa.

3.2. Behavior during Pre-Repair Crack Formation

Each connected girder specimen exhibited the same behavior during this testing. As the load neared the maximum, extensive flexural cracks were noted in the girders on either side of the continuity joint. No major shear cracks were observed. Failure was taken as the point when large cracks formed in the continuity joint, and a simultaneous substantial (approximately 40%) drop occurred in the applied load, suggesting a sudden increase in deflection. Once this drop in load was observed and large cracks were visible in the joint, the testing was halted. The average peak load of the nine beams tested was 104.5 kN with a coefficient of variation of 9.4%. The sudden cracking appeared to follow a path around the hooked ends of the bars embedded in the continuity joint. This procedure produced very similar crack patterns to those formed in continuity joints on in-service bridges (see Figure 1). Examples of the cracks formed by this loading, taken as representative of all connected specimens, are shown in Figure 6. Crack patterns in the left two photos were marked using a permanent marker, making them appear larger than in the photo on the right. However, the cracks patterns in the specimens were similar after each test.

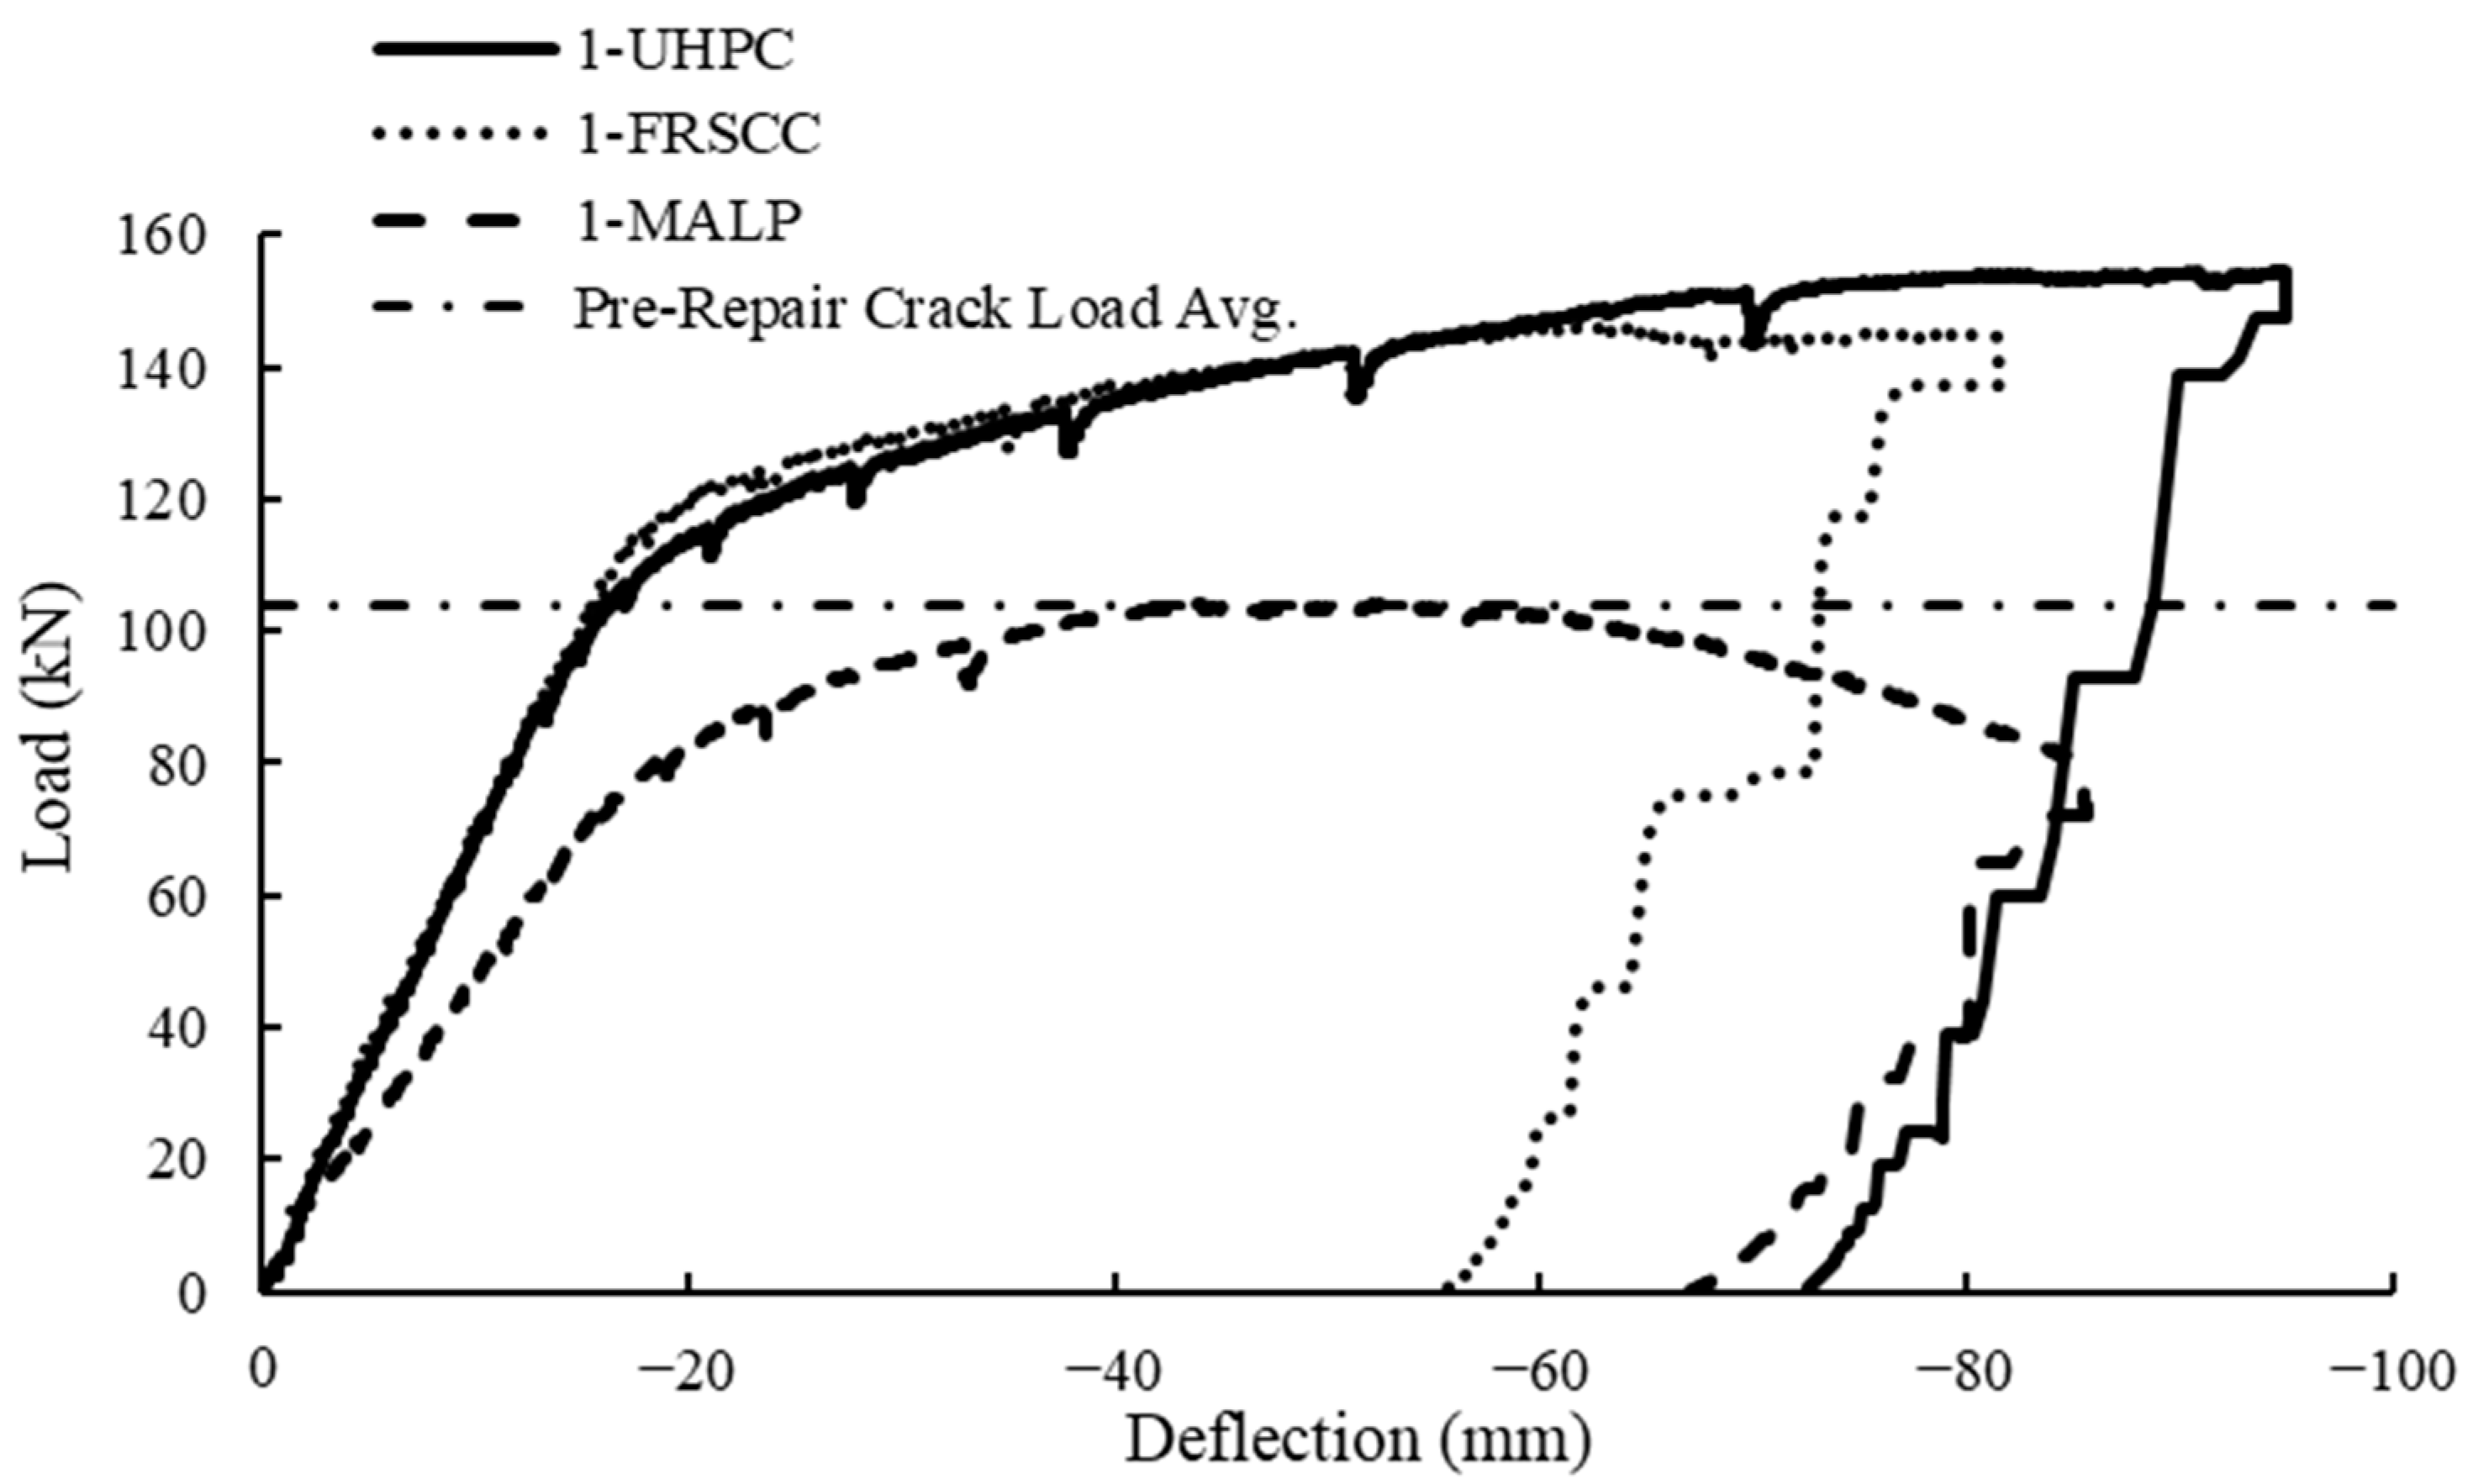
3.3. Positive Bending Behavior Post-Repair

One of the three repaired girders for each material was tested in positive bending identically to the crack-inducing loading regime to assess how the added repairs would improve performance. The load vs. deflection curves for each of the post-repair tests are shown in Figure 7 and the strain readings from the reinforcing in the deck and in the repair are shown in Figure 8, Figure 9 and Figure 10.
The girder joint repairs using the UHPC and FRSCC re-established load carrying capacity beyond the original failure load. Both repaired girders exhibited near-identical responses up to the point of the average pre-repair cracking load. This included a linear response up to a yielding load, where the stiffness was reduced (see Figure 7). The overall behavior appears to mimic the conventional reinforced beam bending response, except there is no low-load stiffness change caused by crack initiation in a pristine beam. This could be due to the pre-cracked nature of the repaired specimen and the fiber reinforcement of both repair materials precluding the formation of large, traditional flexural cracks. Conversely, the MALP repair exhibited a softening behavior and did not reach the pre-repair cracking load (see Figure 7). The better stiffness response appears to indicate load transfer to the UHPC and FRSCC repairs. However, the low strain values in the repair reinforcing bars implies that the additional load carrying capacity was mostly developed by the fibers in the repair materials. This would explain why the UHPC reached a higher peak load than the FRSCC, since the UHPC uses steel fibers, compared to polypropylene fibers in the FRSCC, providing both higher bending strength and ductility for the UHPC.
Lack of load transfer to the MALP repair is also indicated in the strain readings. The deck reinforcing steel located in the top of the girder was in tension through the entire test of the MALP specimen. This indicates that there was little to no load transfer to the MALP repair. Conversely, the UHPC and FRSCC deck reinforcing steel was in compression up to near the failure load. For both UHPC and FRSCC, the deck reinforcing reached an apex compression strain at approximately the same load as when the load vs. deflection curve exhibited signs of softening behavior. This load indicates the point at which the repair material lost stiffness by either localized damage in the repair material or loss of bond to the damaged substrate. The fact that the UPHC had a higher peak load than the FRSCC appears to indicate that this softening was more a function of localized damage in the repair material due to the higher strength of the UHPC. In addition, no cracks were observed on the longitudinal face of either the UHPC or the FRSCC repairs. After the loss of stiffness and as the underlying flexural cracks formed higher up in the continuity joint, the neutral axis was gradually shifted up as the load increased until it was above the deck reinforcing, producing tensile strains in the steel.

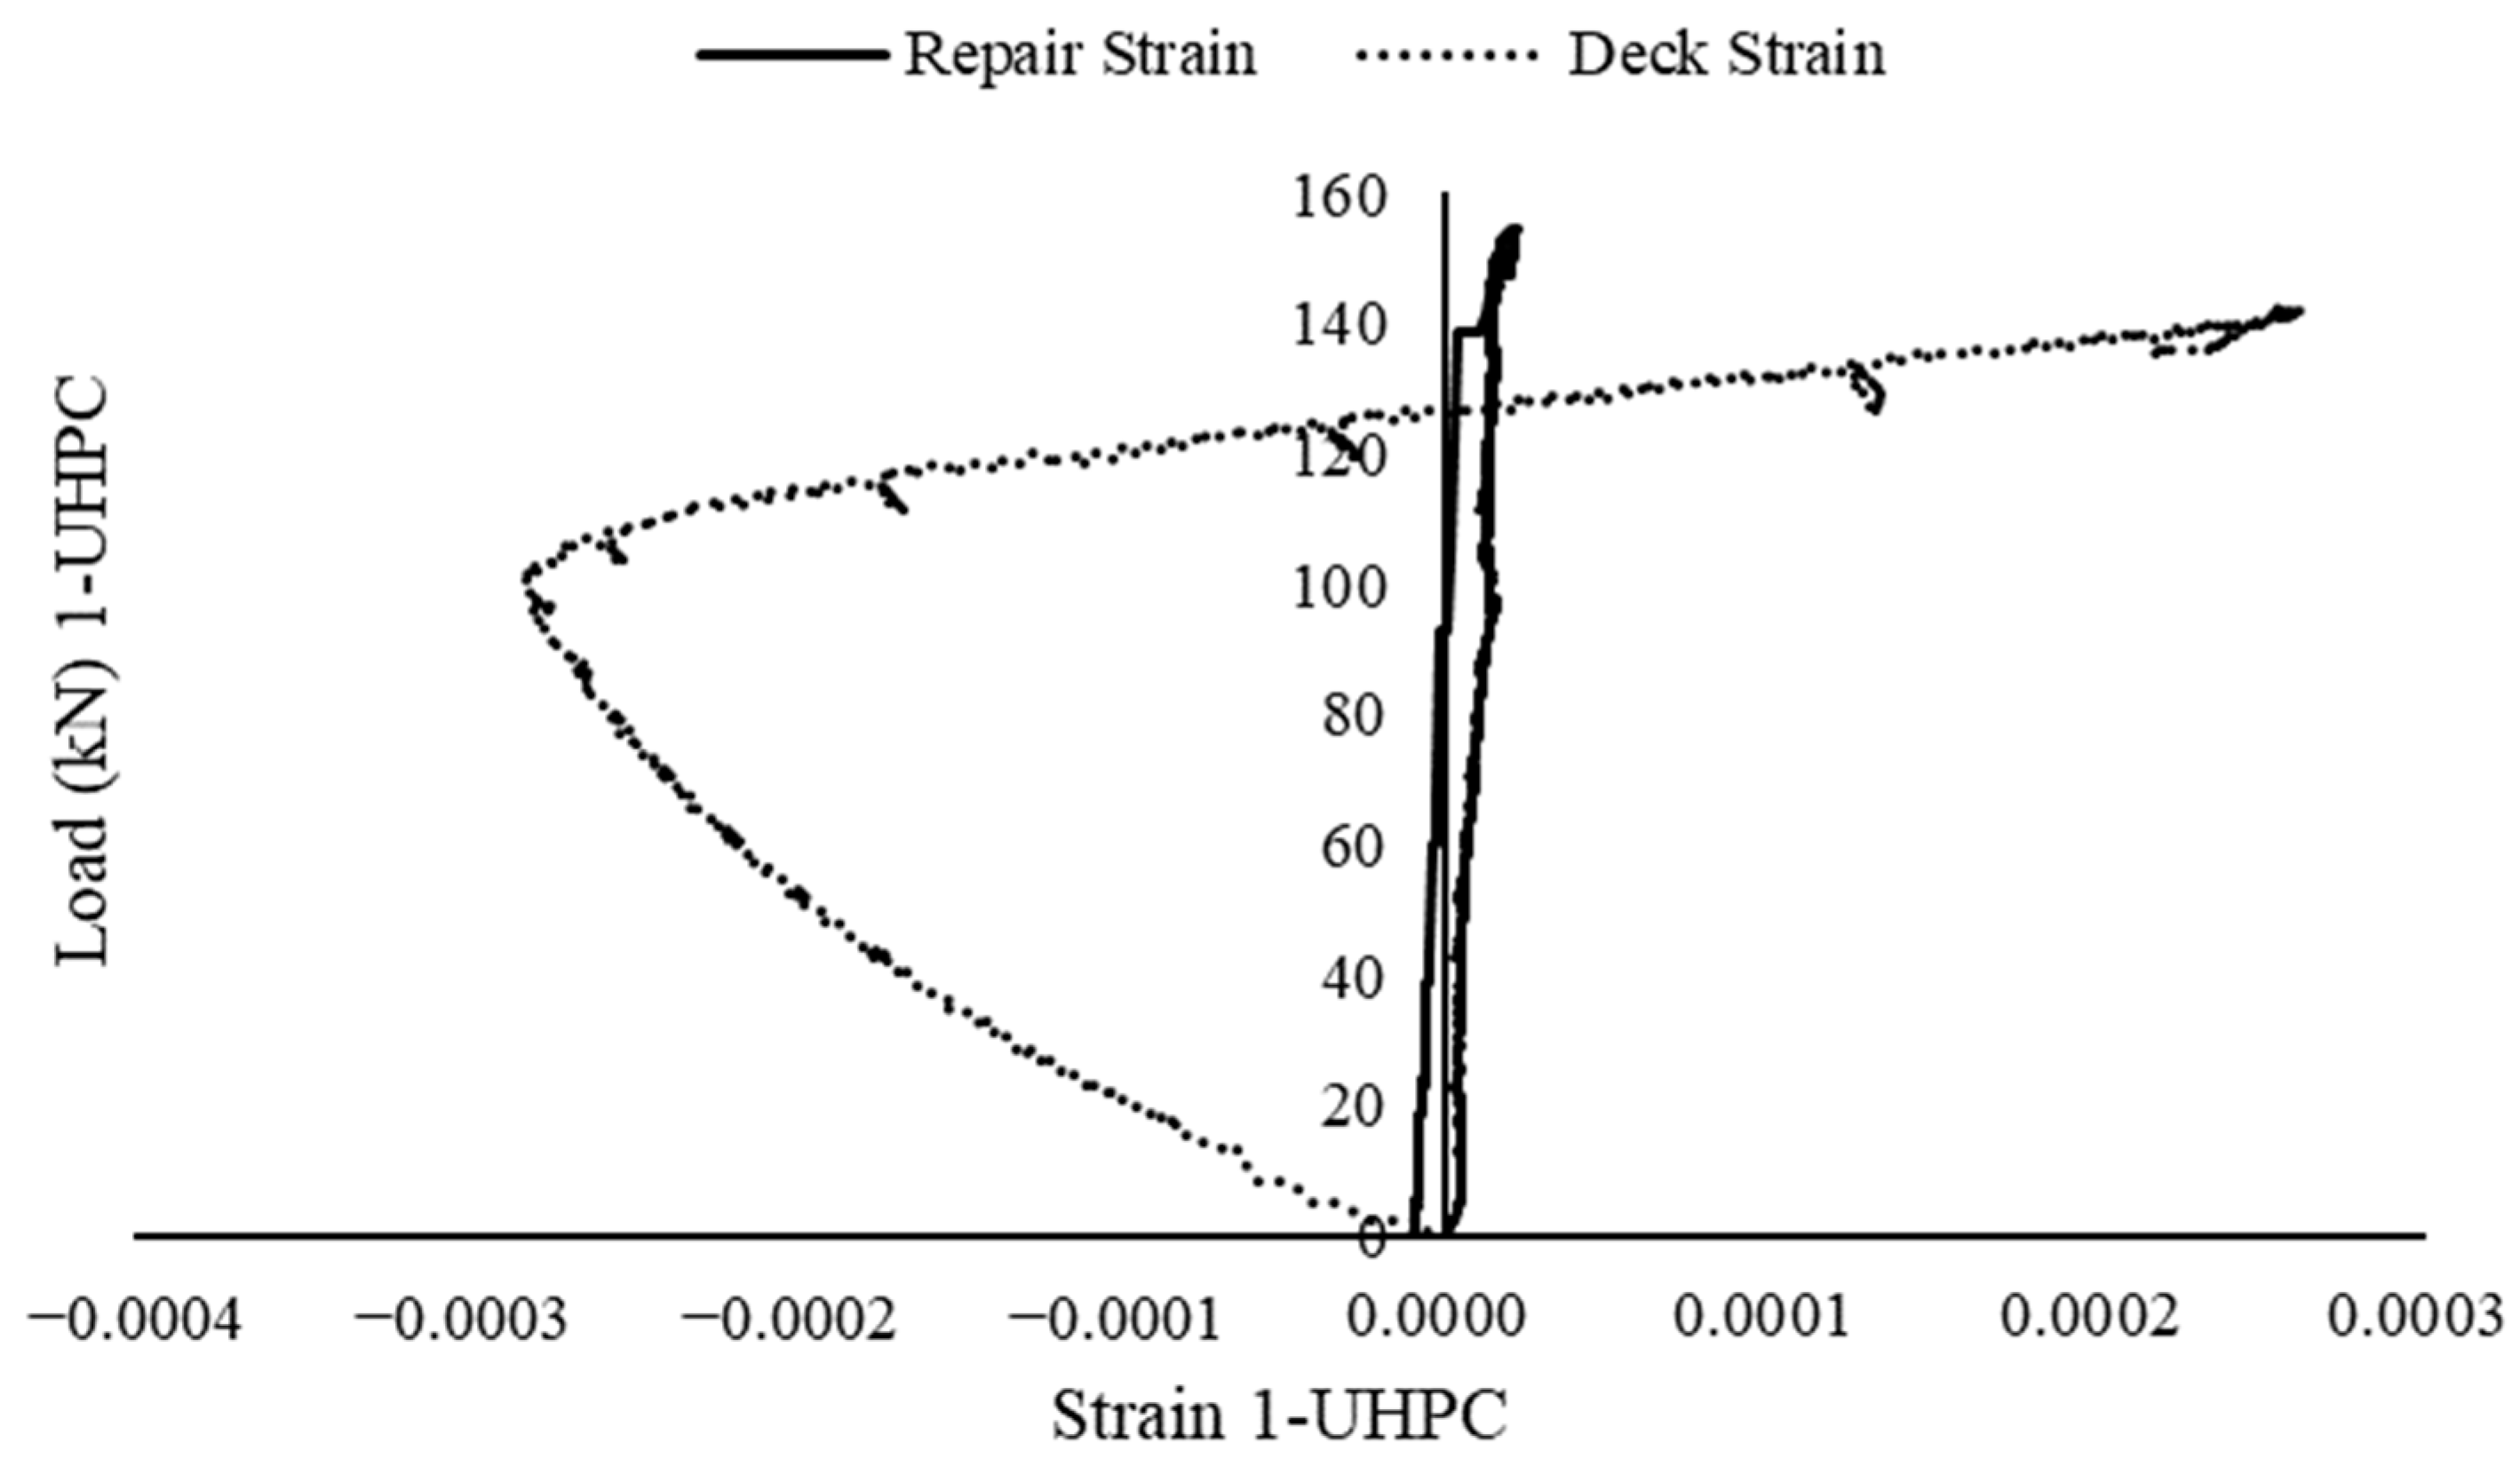
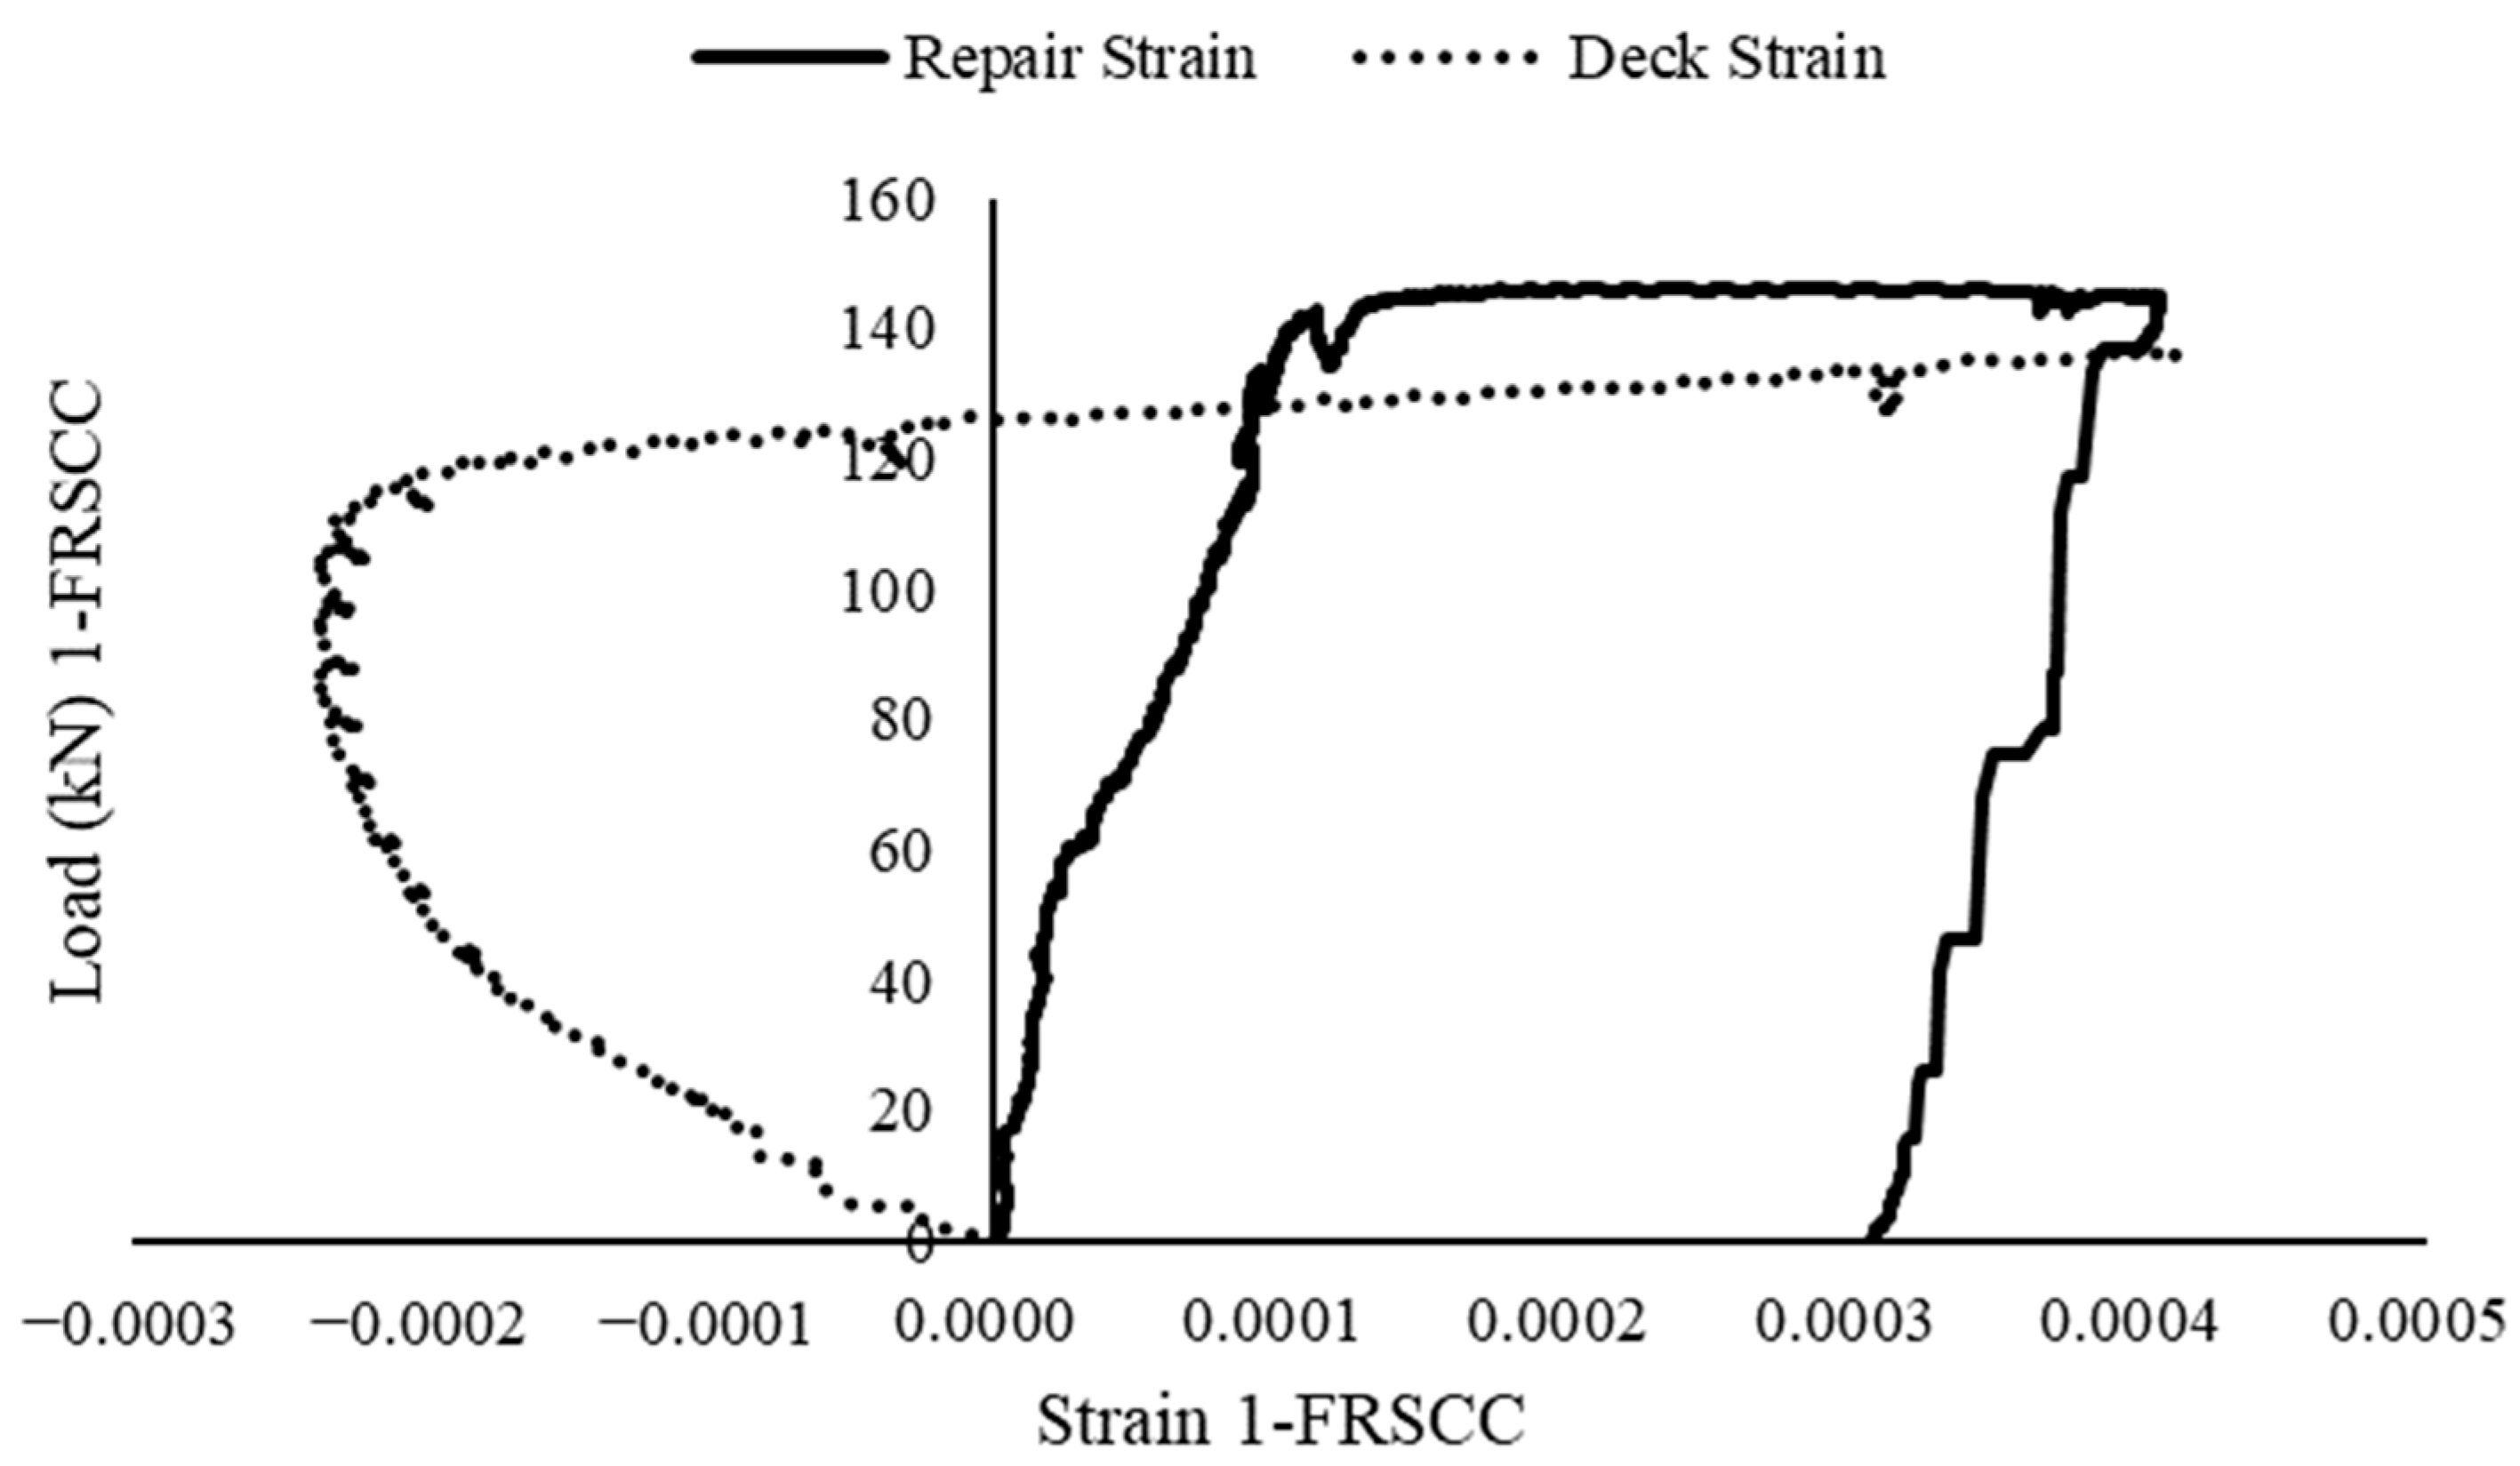
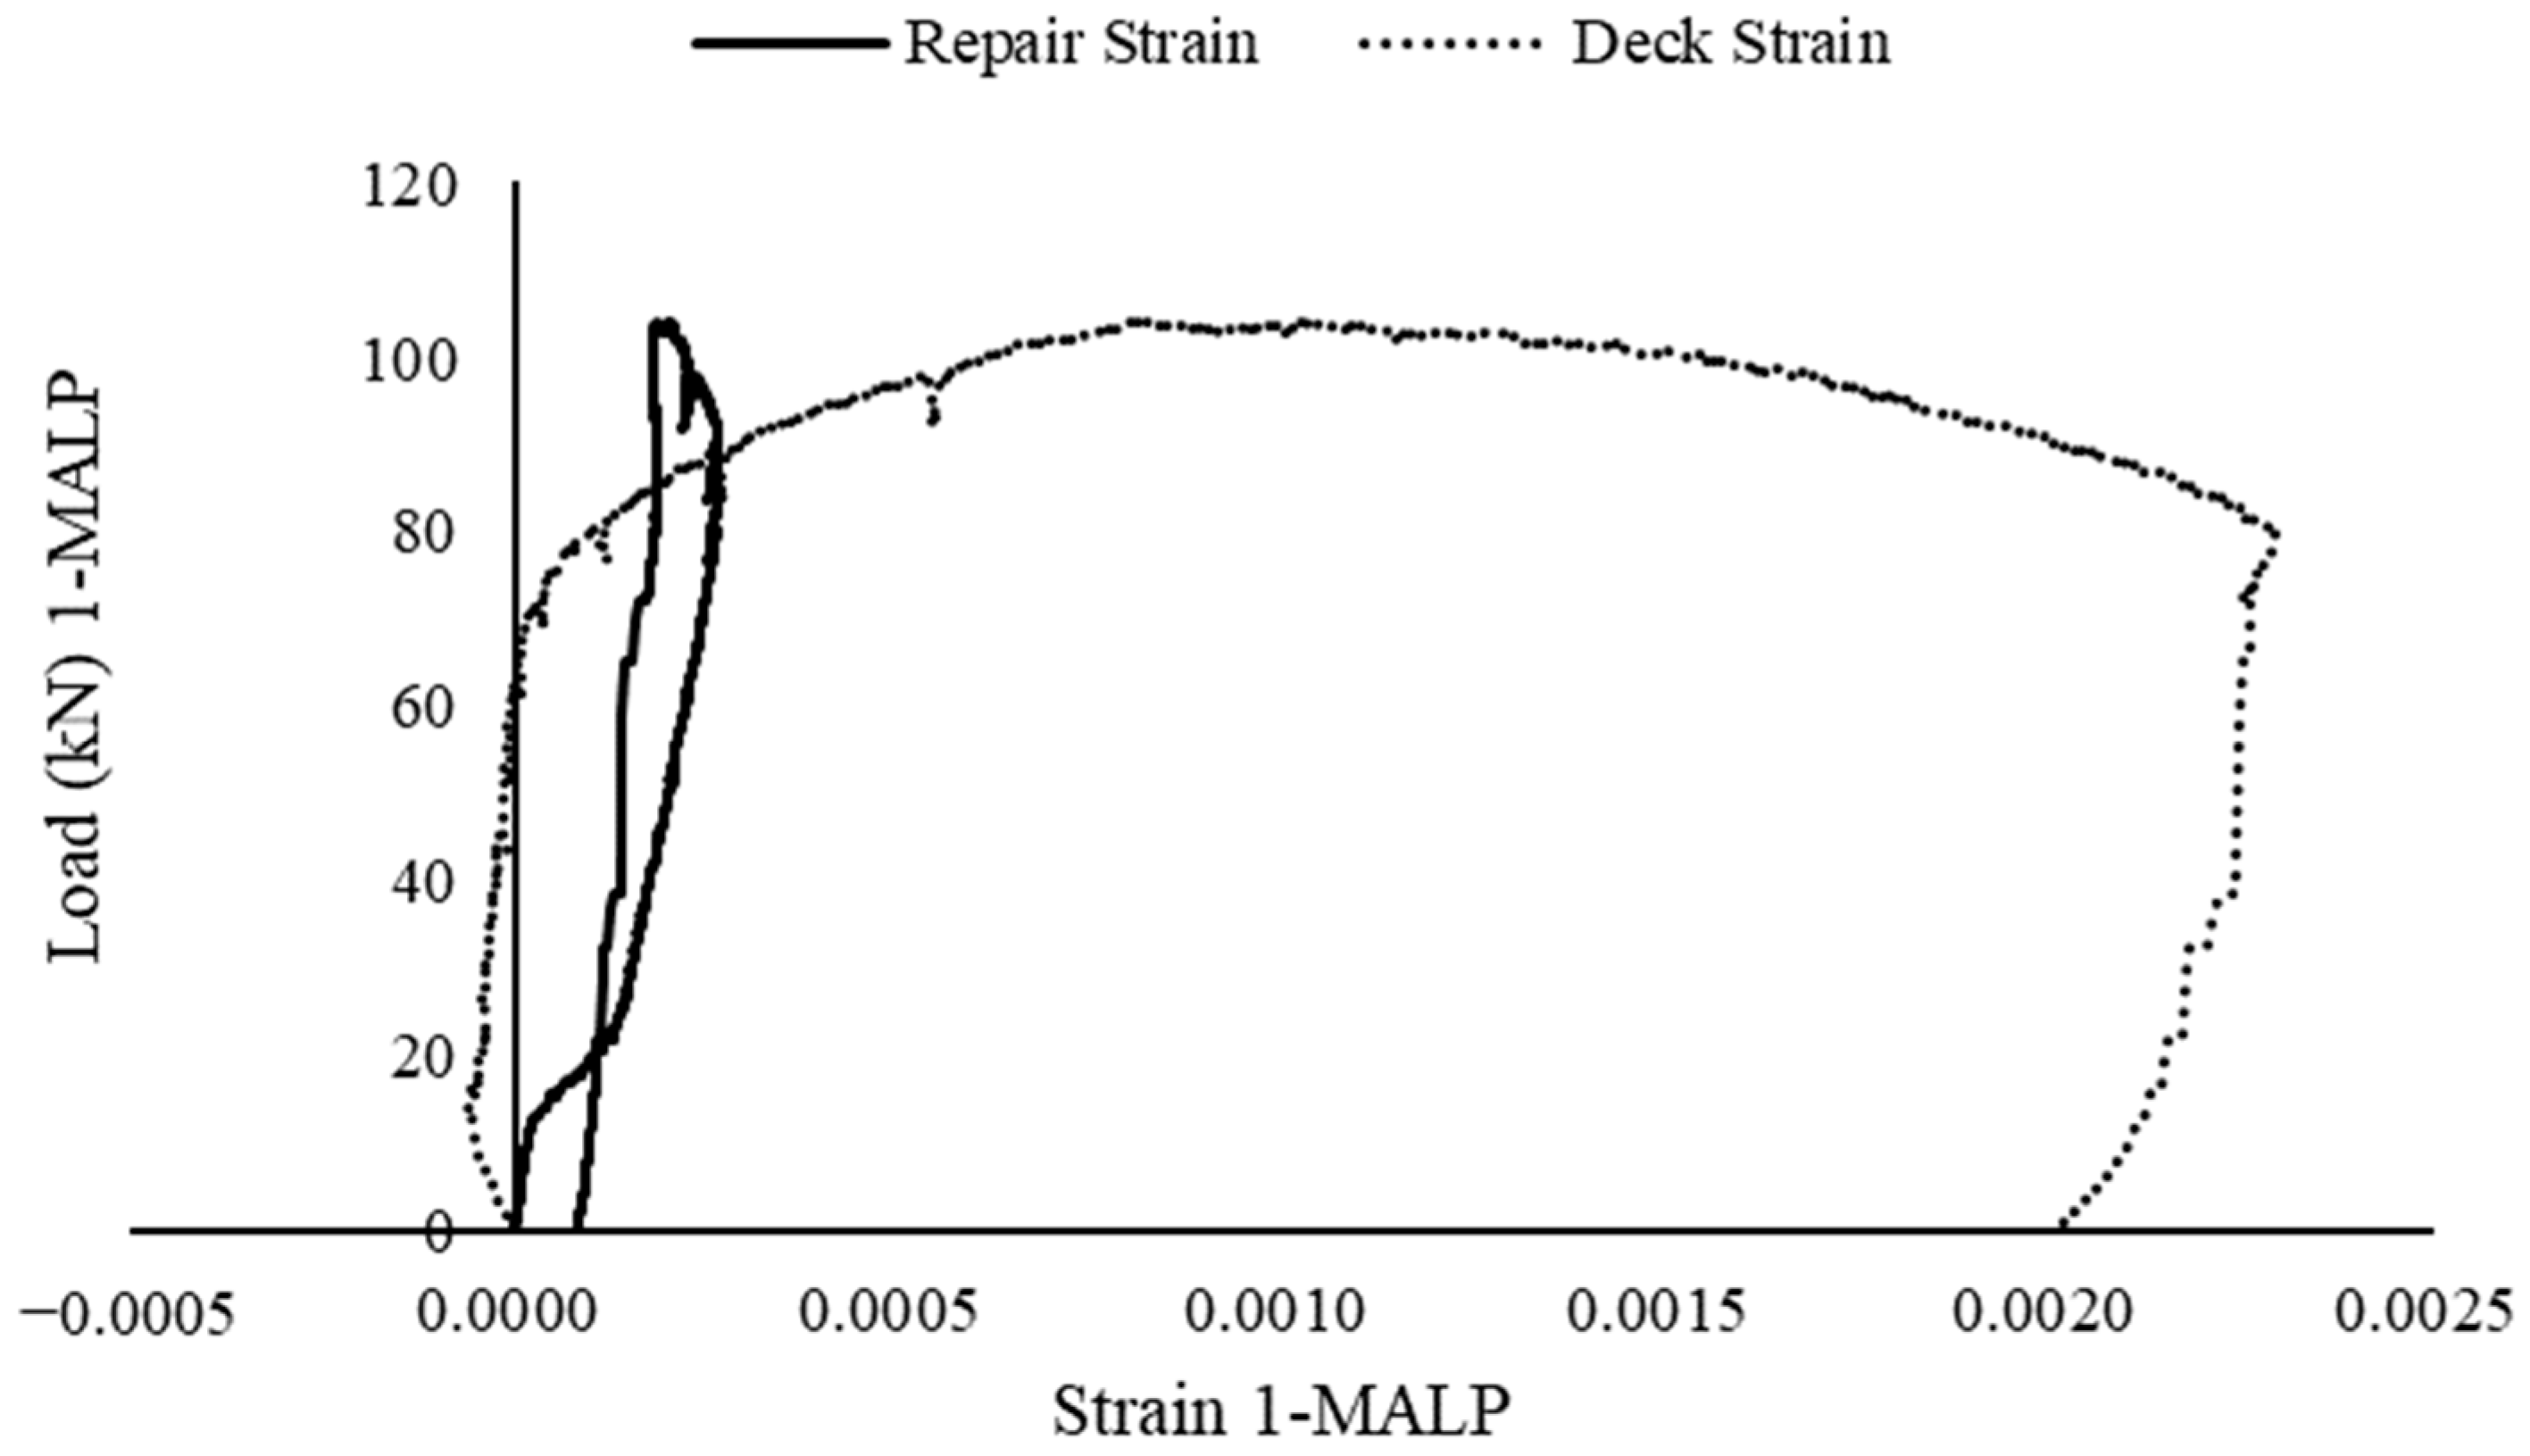
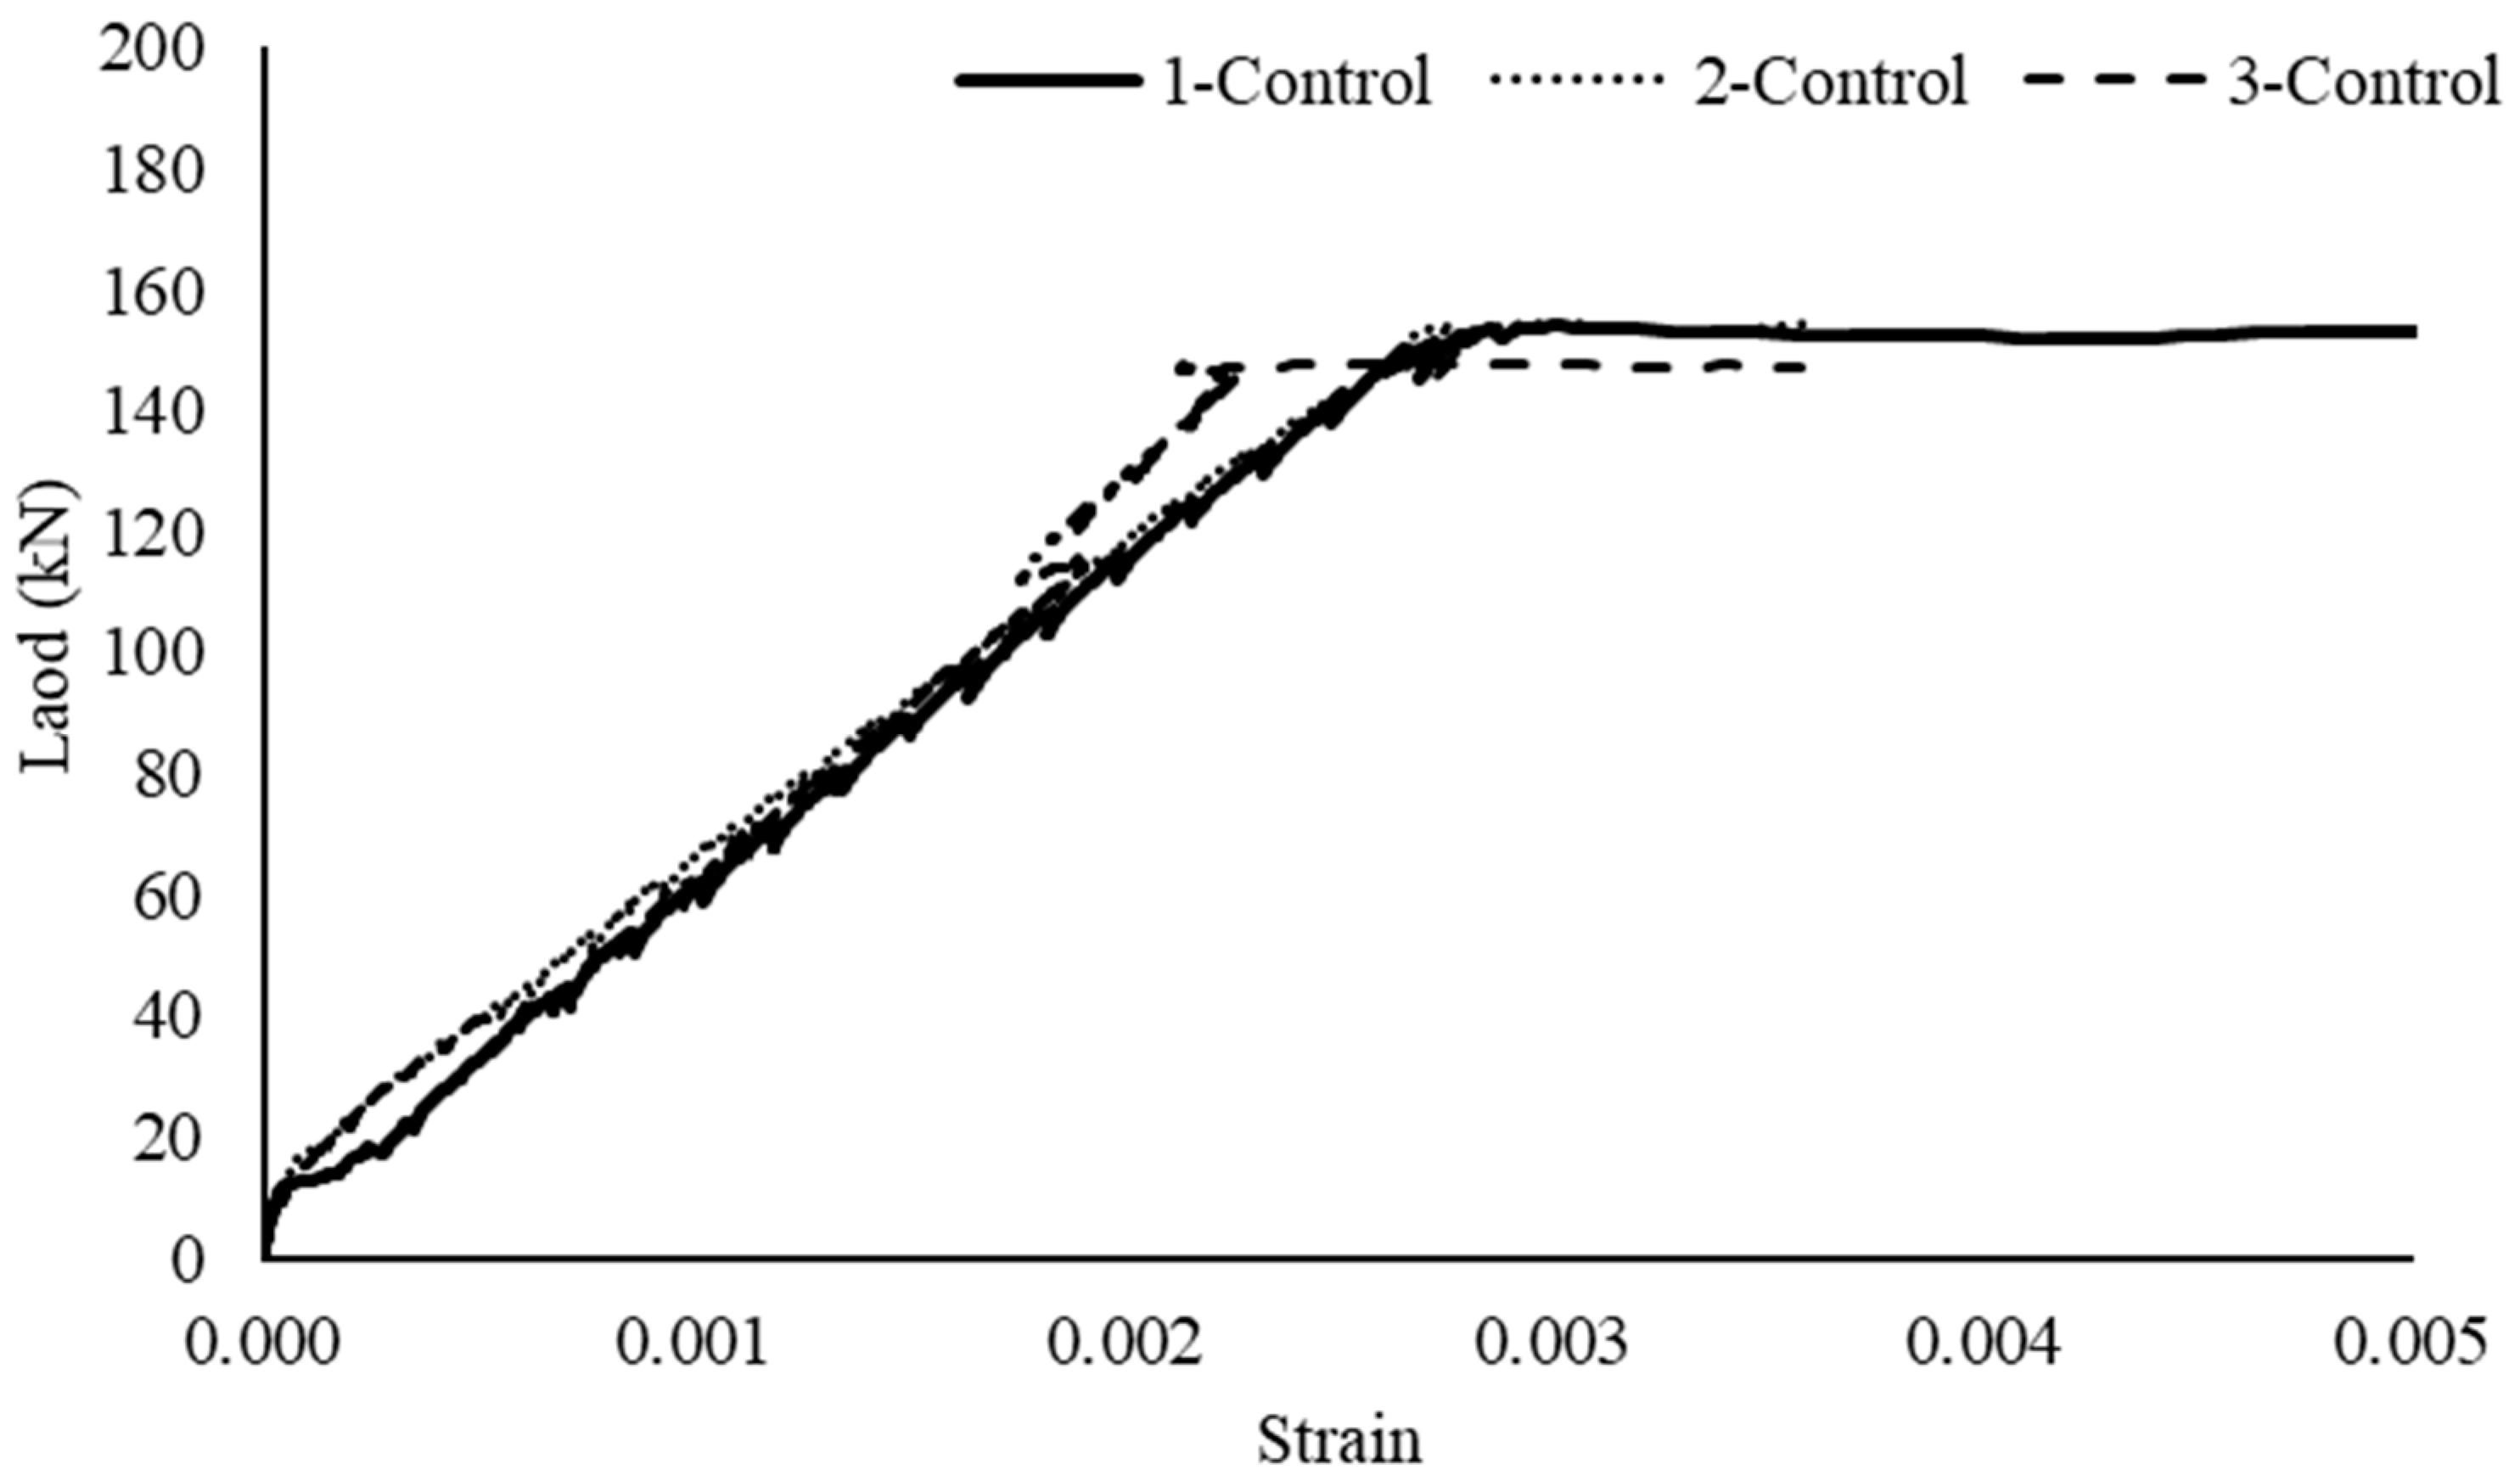
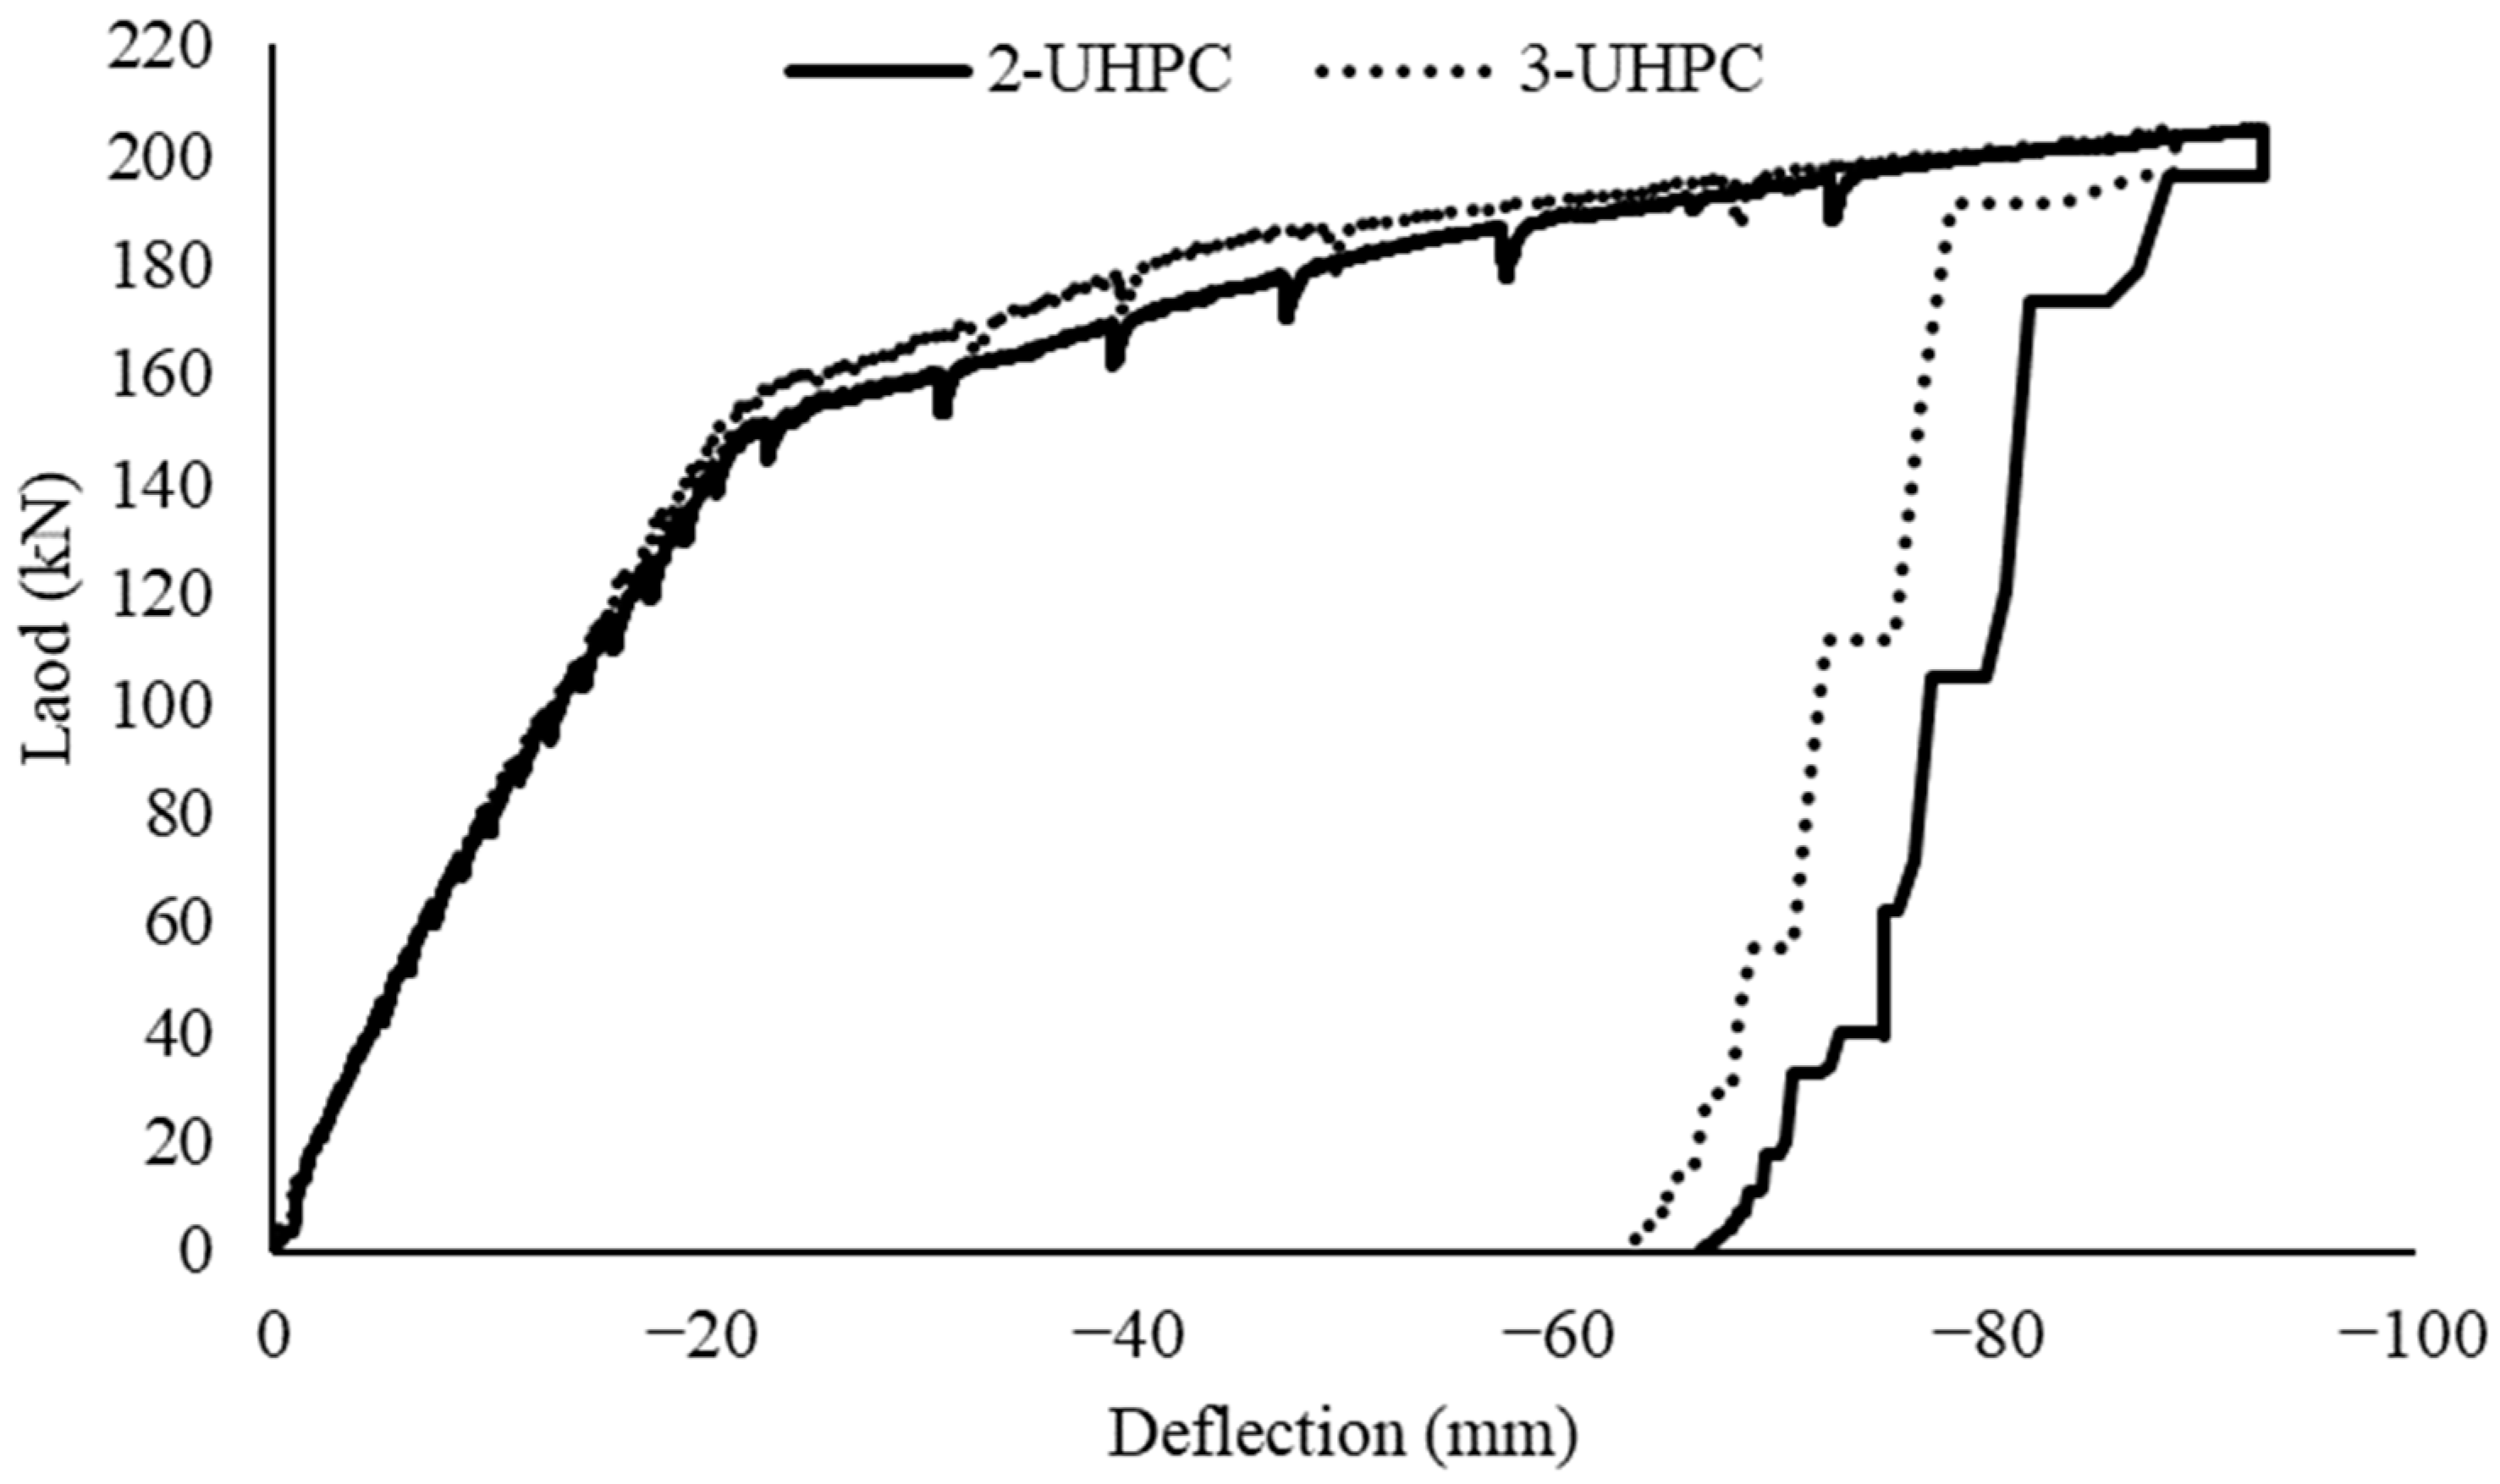
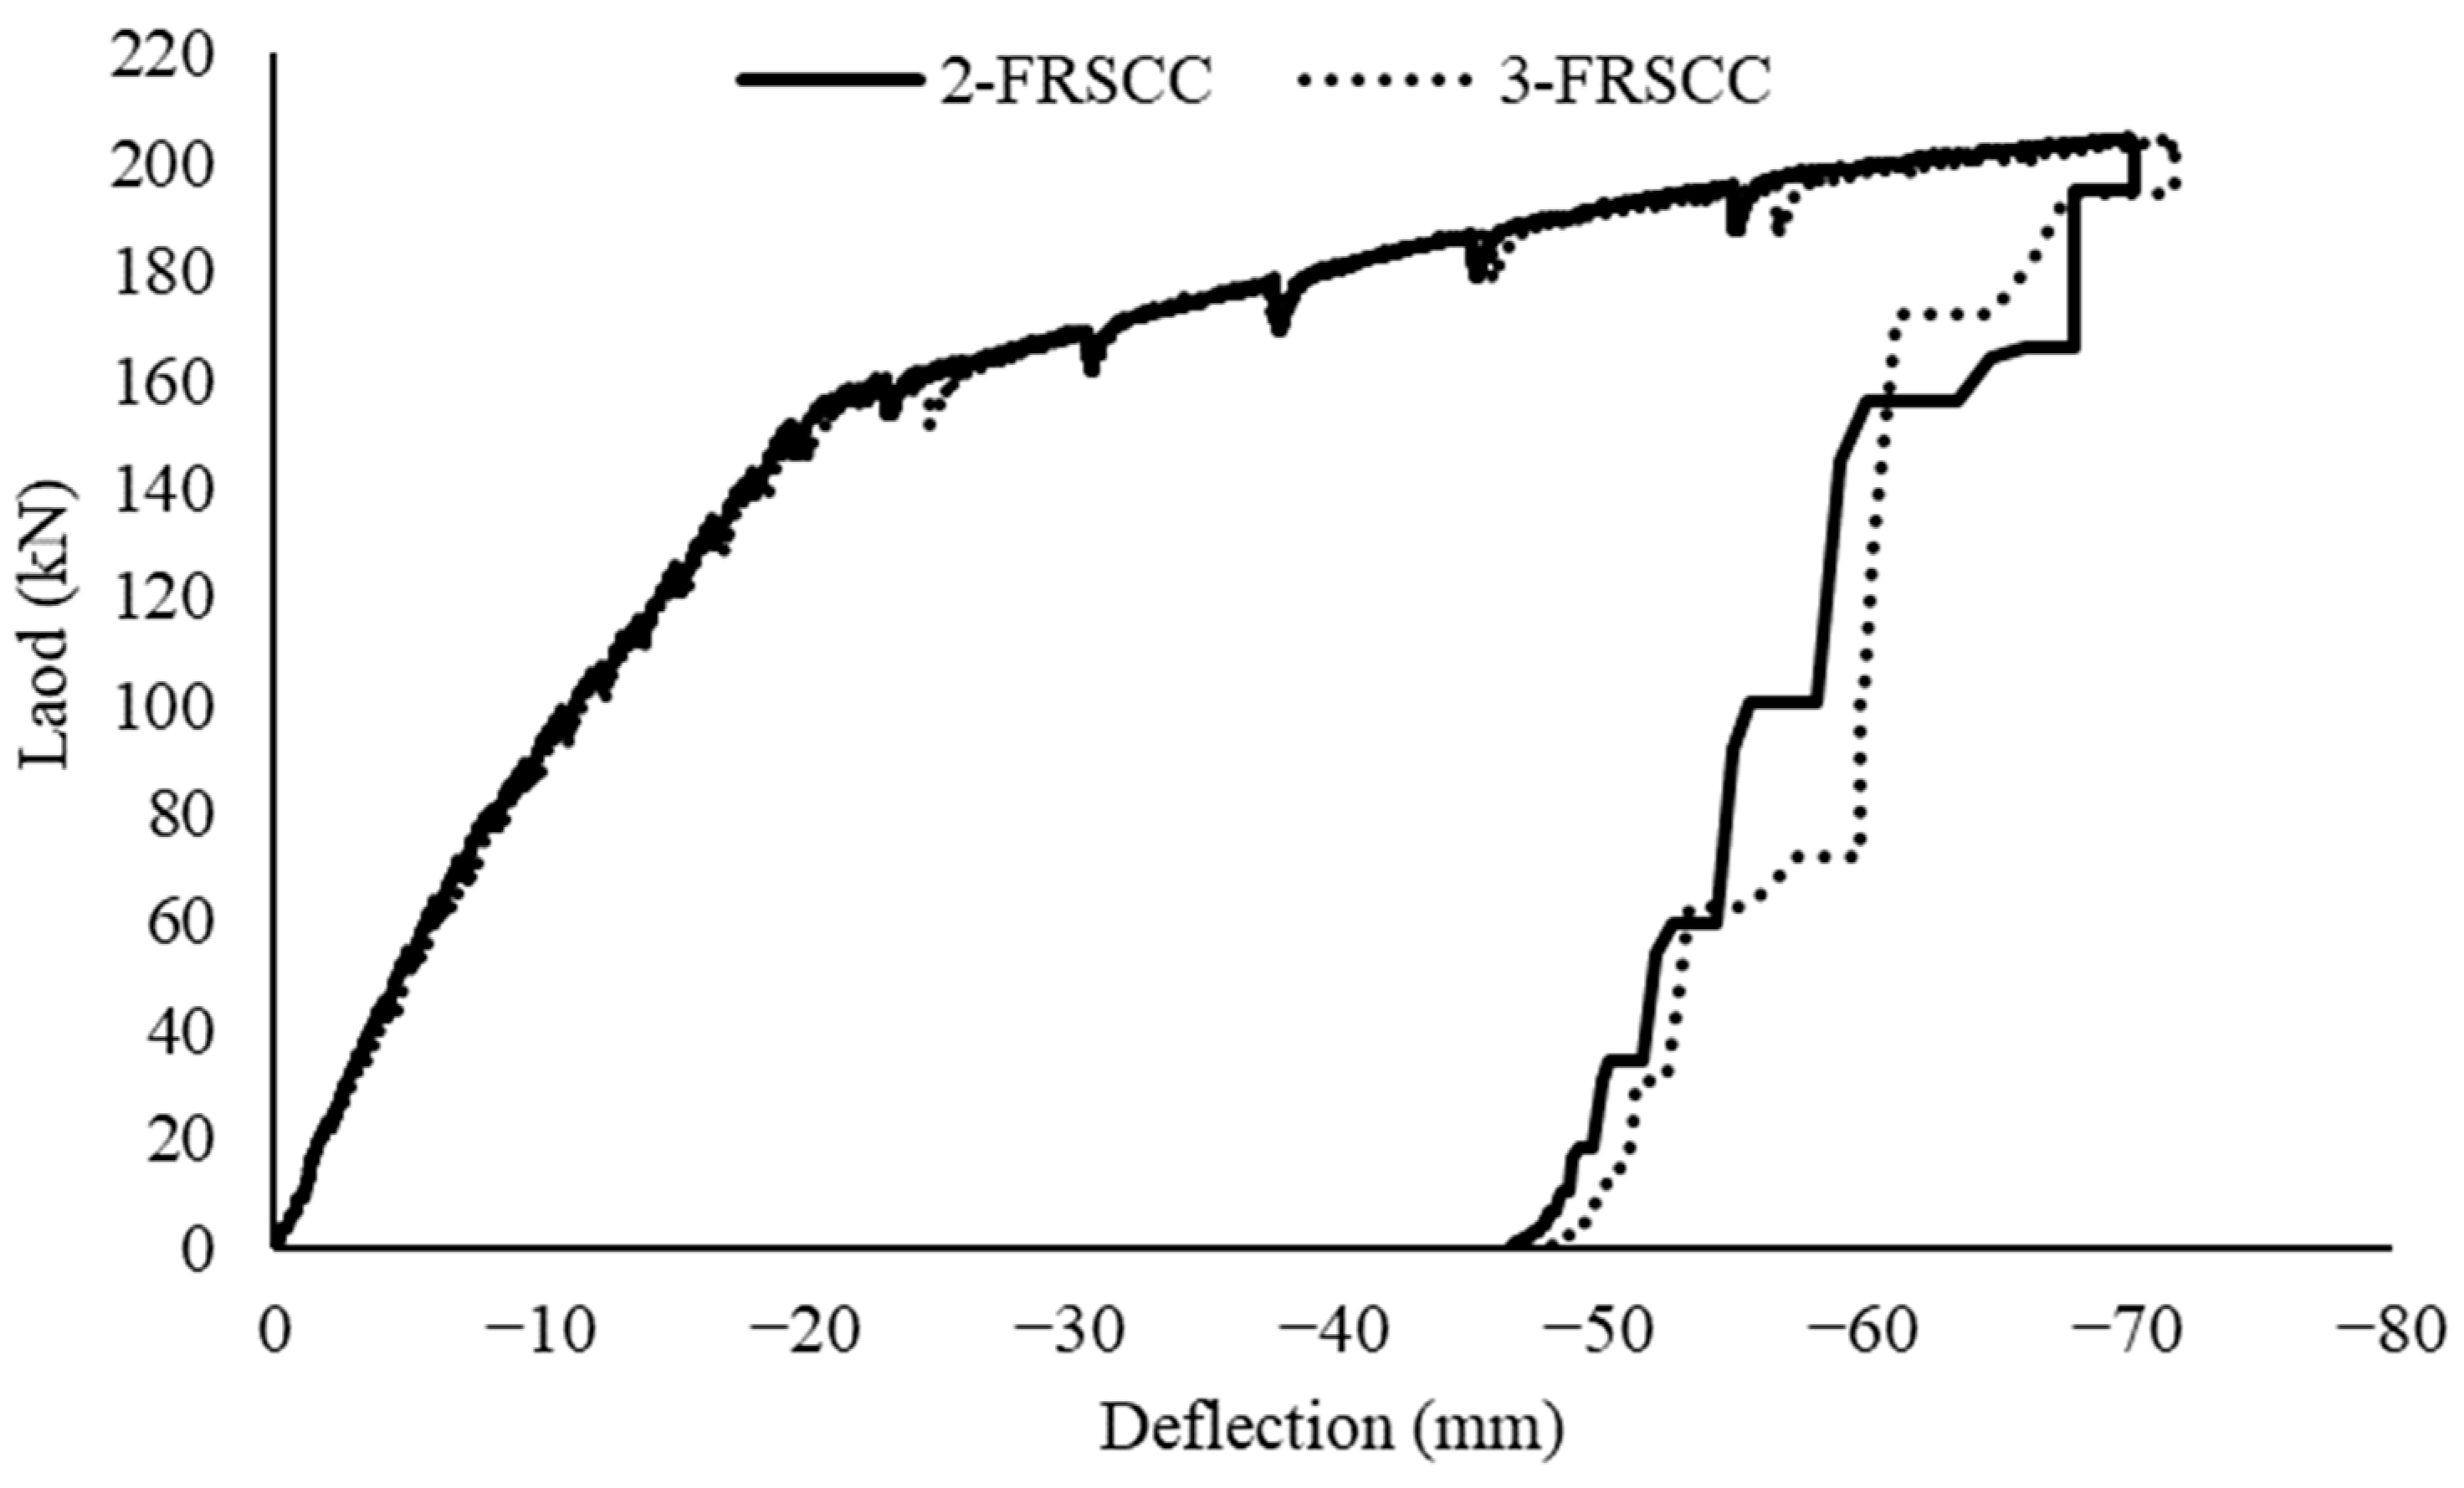
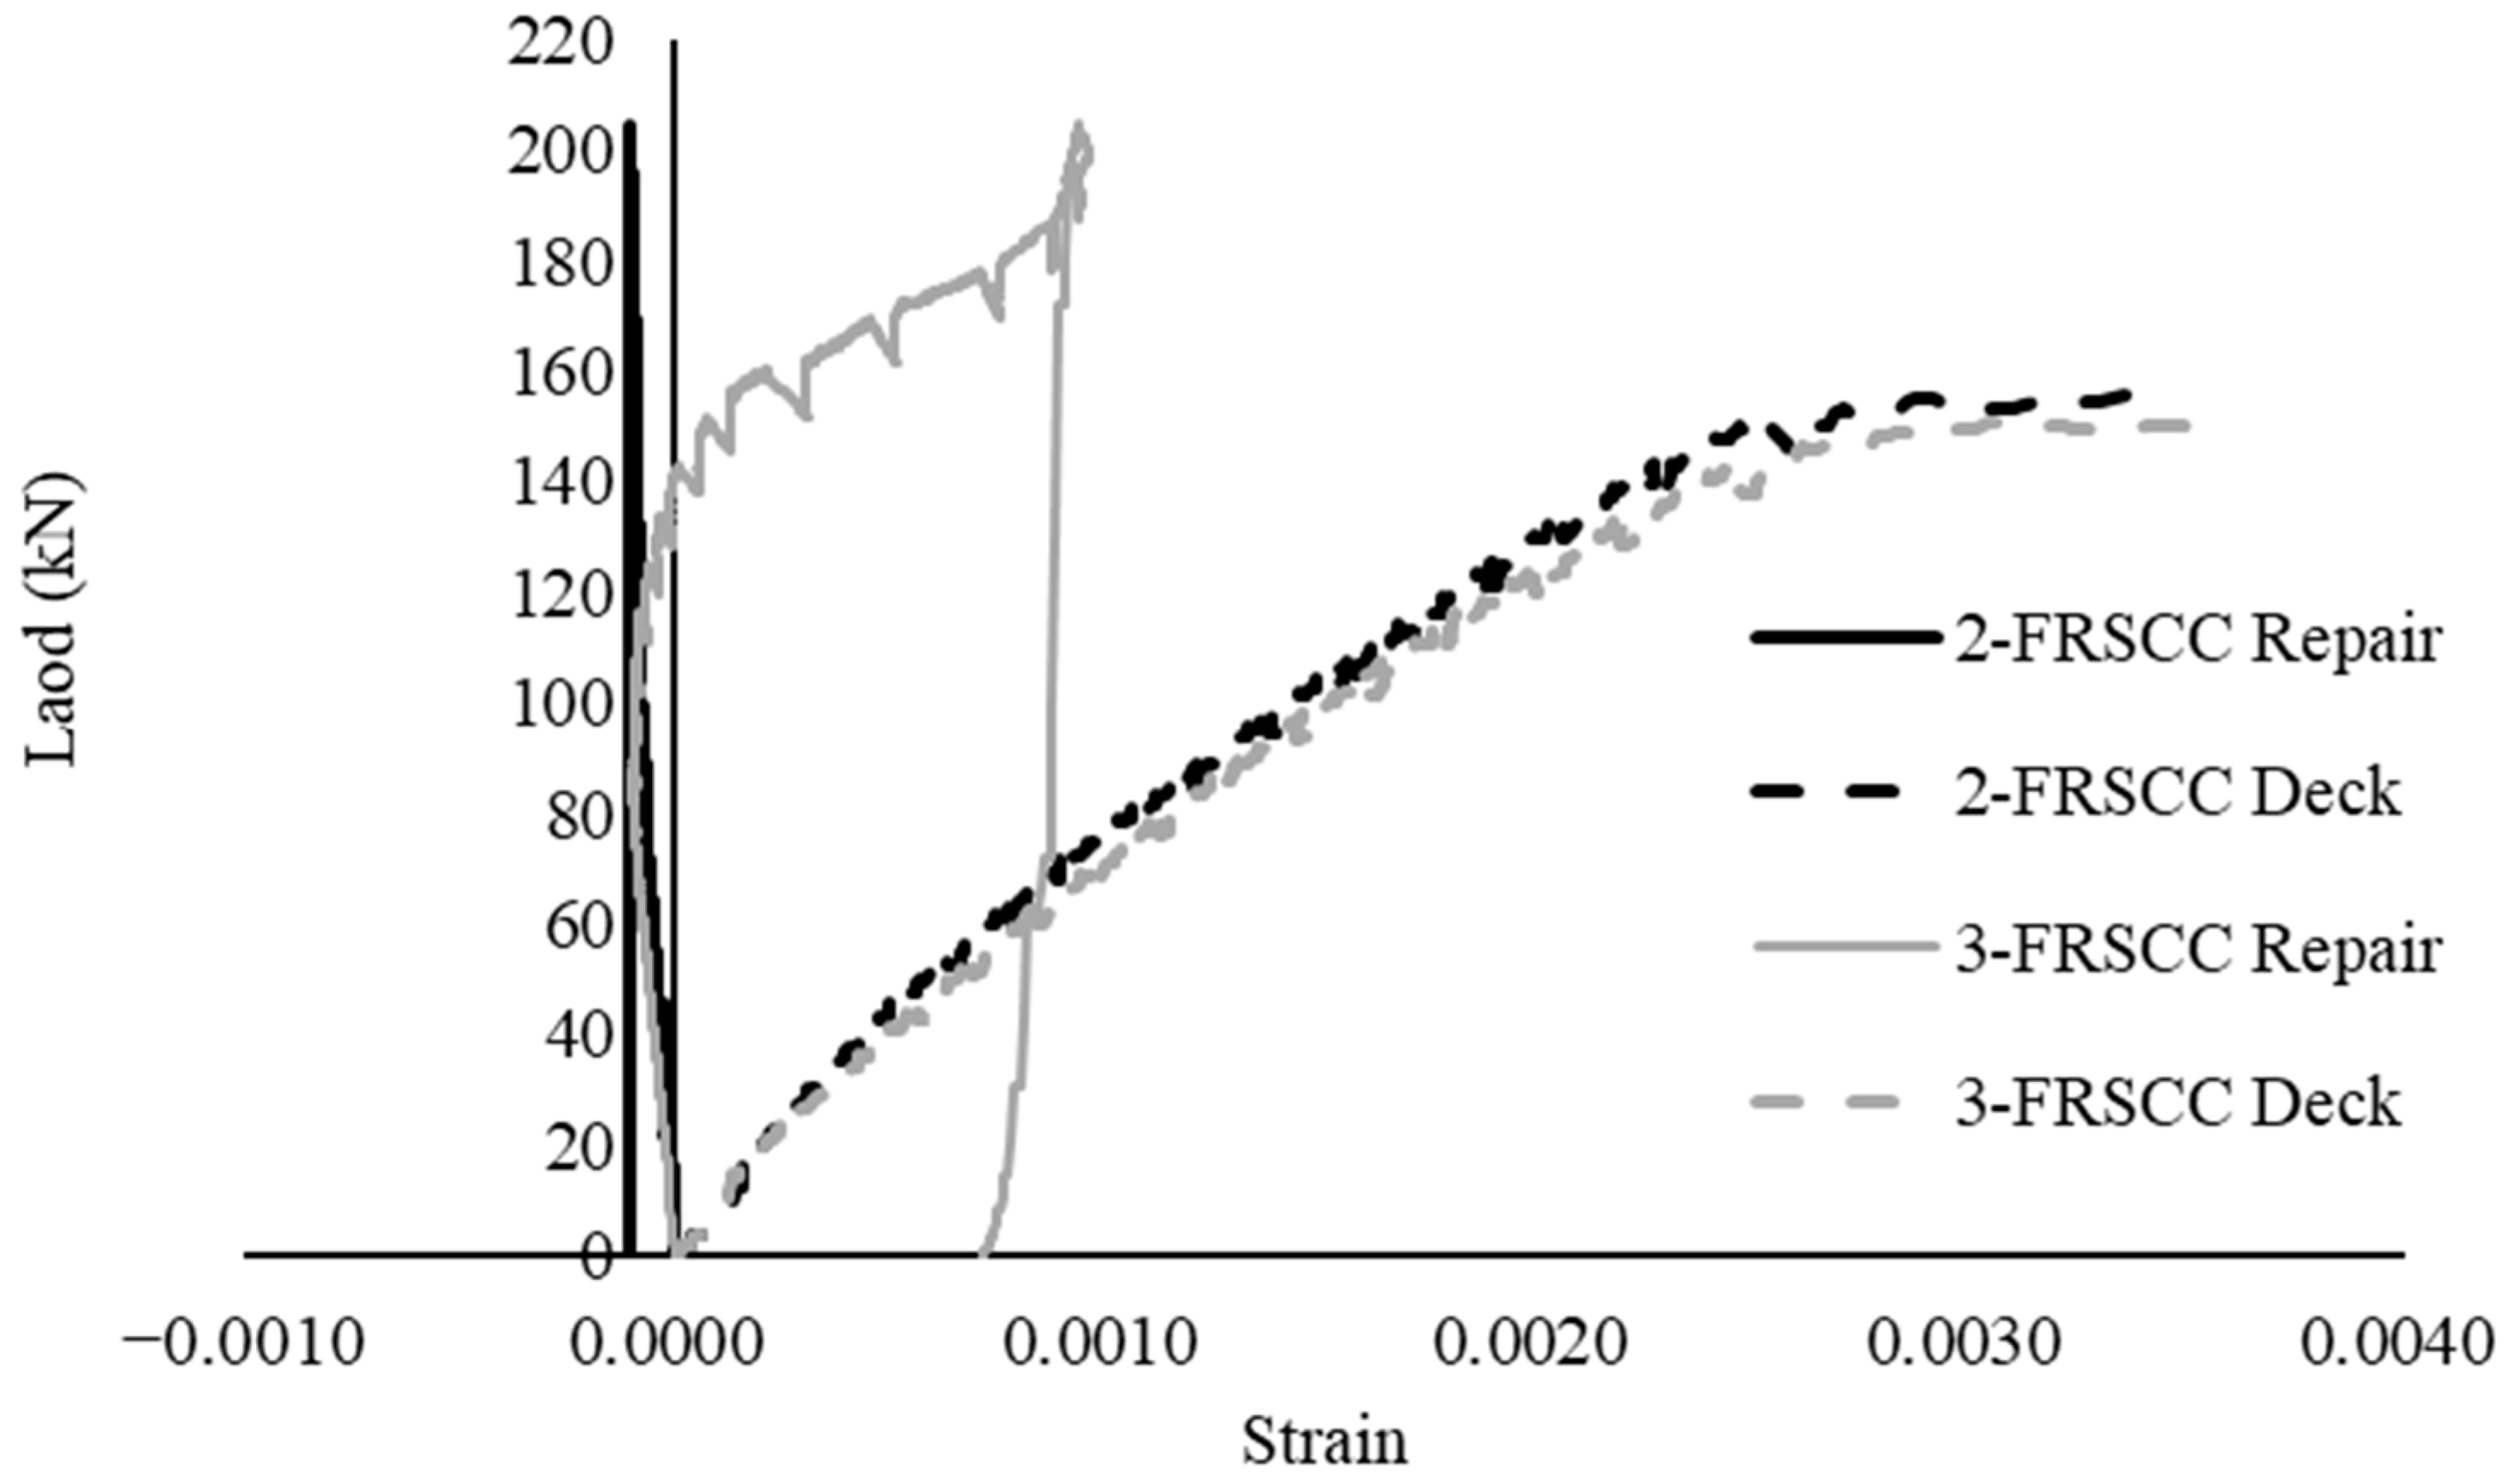
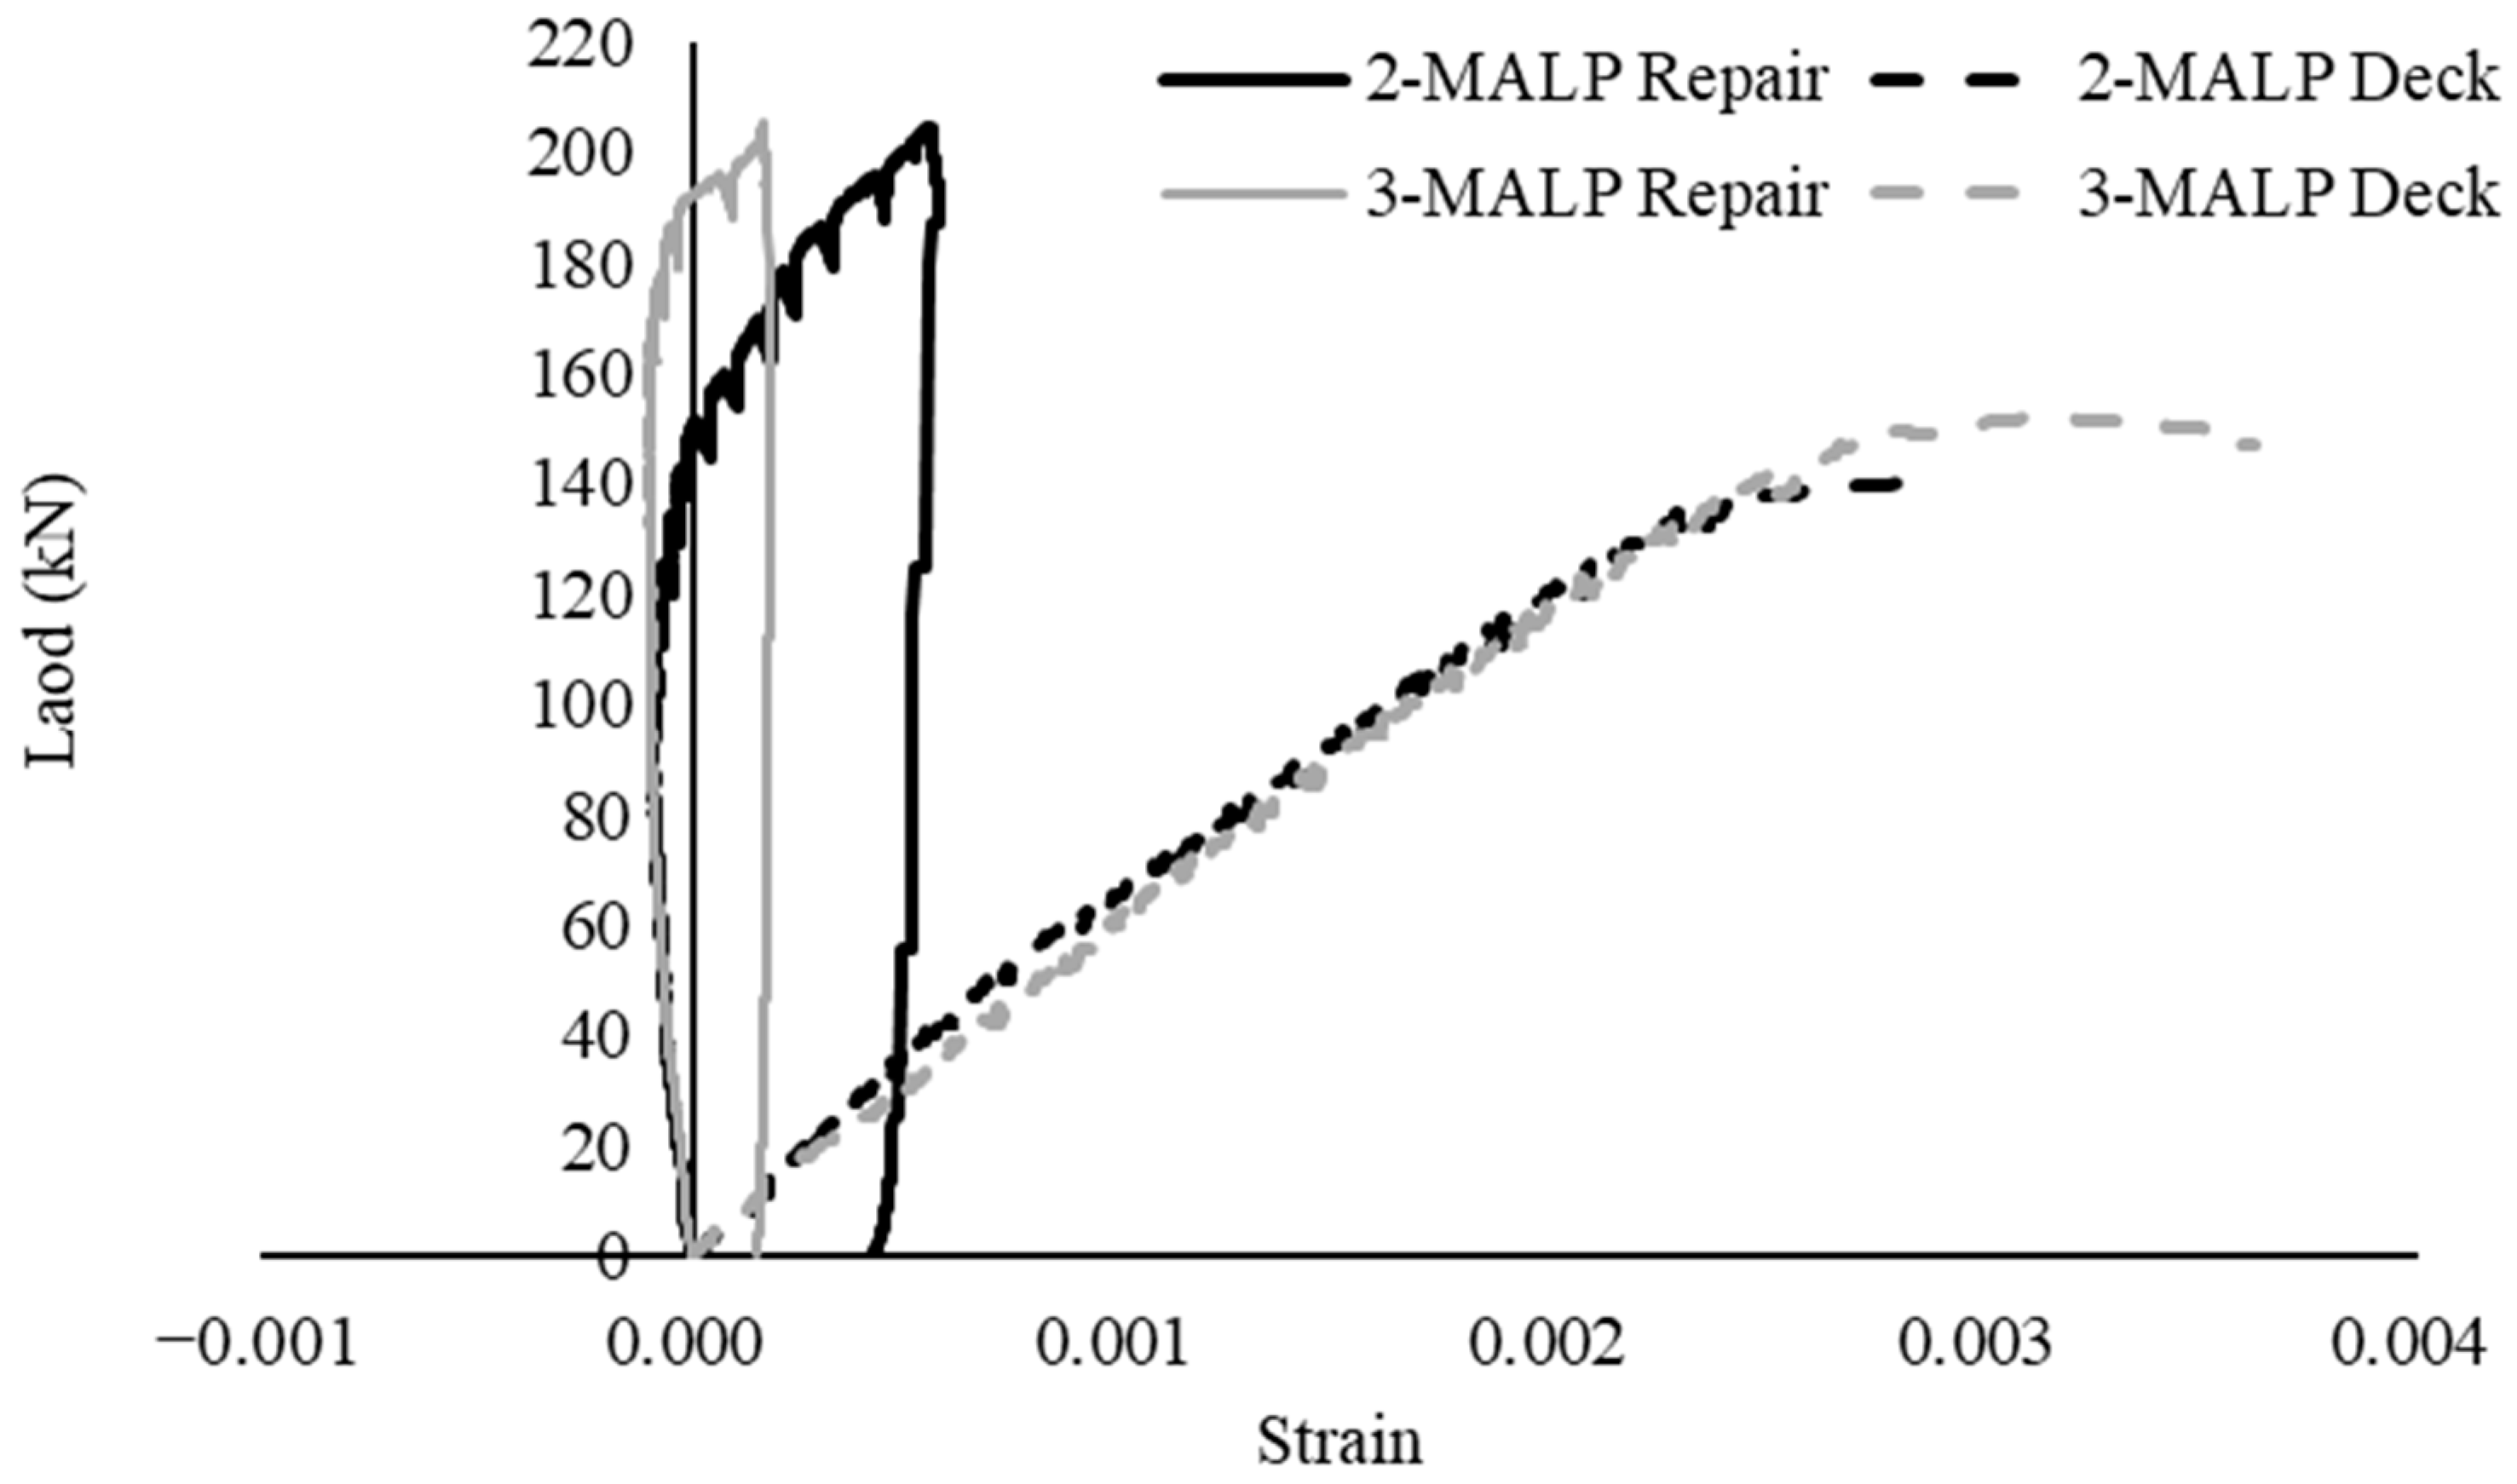
3.4. Negative Bending Behavior of Undamaged and Post-Repair Girders

The two remaining repaired specimens for each repair material were tested in negative bending as described previously. Three pristine girders with undamaged continuity joints were also tested in this manner to determine the effect of the repair material. The peak loads resisted by each of the girders tested in negative bending are shown in Table 3. The load vs. deflection and load vs. strain plots for each of the tested connected girder specimens are shown in Figure 11, Figure 12, Figure 13, Figure 14, Figure 15, Figure 16, Figure 17 and Figure 18. A plot showing all the tests on the same plot is shown in Figure 19.
Each of the repaired girders failed at approximately the same load, which was larger than each of the pristine girder failure loads. This could show that the repairs acted mainly to confine the damaged compression zone, as well as to provide additional material in the compression zone to increase the girder capacity. Each of the control connected girder specimens failed by crushing in the compression zone. The deck reinforcement also yielded in each of the tested girders (see Figure 12, Figure 14, Figure 16 and Figure 18). However, several of the strain gauges appeared to become damaged at various points post-yield and stopped collecting useable data. The data shown represent the useable collected data. The reinforcing steel in the repair area did not appear to be strained heavily throughout testing. However, a definite trend was observed where the reinforcing would be in compression until near the peak load in most cases, then the strain would reverse and go into tension (see Figure 14, Figure 16 and Figure 18). This could be an indication that the neutral axis was raised to a level that placed the repair reinforcing steel in tension due to increased crack growth. The low strain values could indicate that the now confined, damaged joint area could transfer compressive bending stresses.
Each of the repaired girders exhibited stiffness reduction caused by yielding of the reinforcing, which appeared to occur at approximately 150 kN (see Figure 19). The stiffness of all the repaired girders appeared to show a gradual softening as the load progressed up to yielding, as opposed to a larger stiffness up to a cracking load, as with the apparent behavior of the pristine girders. While this behavior could indicate that the repair material acted solely as confinement for the damaged joint, cracks appeared on both the FRSCC and MALP repairs in both of the negative bending tests at approximately 165 kN. No cracks were observed in the UHPC repair throughout testing, possibly due to the distribution of steel fibers creating smaller cracks not visible on the surface. Additionally, the consistent performance of the FRSCC repairs and comparable performance to the UHPC repairs indicates good quality concrete. Examples of the condition of the repaired girders after testing are shown in Figure 20 for each repair material. The dark lines on the face of the connected girder specimens indicate crack locations during testing, which included flexural and shear cracking. Both the MALP and FRSCC specimens cracked in the repair material, but no visible cracking was observed in the UHPC. This could be due to the small size of cracks in UHPC [8]. While deck reinforcement yielding occurred at approximately the same load for each specimen, the post-yielding stiffness varied. Post-yielding stiffness of the FRSCC and MALP specimens appeared nearly identical to that of the control specimens, and the UHPC exhibited a softer post-yielding response (see Figure 19).

4. Conclusions

This study evaluated the behavior of an encapsulation repair of damaged girder continuity joints using UHPC, FRSCC, and MALP materials for the repairs. Approximately half scale AASHTO girders were fabricated with continuity joints connecting the ends of two such girders. Of the twelve fabricated connected girder specimens, nine were initially cracked to mimic damage common on in situ bridges with similar continuity joint details. After replicating damage, the continuity joints were encapsulated with 76 mm thick repairs of UHPC, FRSCC, and MALP materials. Once repaired, the connected girder specimens were tested in both positive and negative bending. The conclusions of this study are listed below.
  • The UHPC and FRSCC repairs were able to increase the positive moment capacity of the connected girder specimens beyond the initial cracking load and the MALP repairs did not. Overall, the UHPC and FRSCC specimens appeared to exhibit better load transfer between the original joint material and the repair material.
  • Each of the repair materials increased the negative moment capacity of the repaired connected girder specimens beyond that of the control specimens and each failed at approximately the same load. While the pre-yielding stiffness was nearly identical for specimens with each of the repair materials, the UHPC specimens exhibited a softer response and the MALP and FRSCC specimens exhibited a stiffer response post-yield. Due to the similar failure loads, the repair materials most likely acted as a confinement material to increase the capacity of the girders.
  • These results appear to indicate that using each of the tested materials as an encapsulation repair for damaged continuity joints is viable to re-establish continuity. However, the UHPC repairs’ resistance to cracking could indicate the best performance by further protecting the continuity joint reinforcing steel from water ingress. Such repairs should be designed to be thick enough to provide the minimum clear distance required, and reinforcement designed based on effects of a temperature gradient on the bridge as defined in AASHTO LRFD Bridge Design Specifications [3] on existing damaged continuity joints. Thicker repair sections could provide additional capacity and protection from moisture ingress to damaged concrete. Future testing would be necessary to verify the behavior of such a repair.

Author Contributions

Conceptualization, T.L., M.M., J.V. and R.F.; methodology, T.L., M.M., J.V. and R.F.; investigation, T.L., M.M., J.V. and R.F.; data curation, T.L. and M.M.; writing—original draft preparation, T.L.; writing—review and editing, T.L., M.M., J.V. and R.F.; supervision, J.V. and R.F.; project administration, J.V. and R.F.; funding acquisition, J.V. and R.F. All authors have read and agreed to the published version of the manuscript.

Funding

This research was funded by the Oklahoma Department of Transportation [project SPR 2284].

Data Availability Statement

Data are contained within the article.

Acknowledgments

The authors would like to thank the Oklahoma Department of Transportation for their generous support. Furthermore, the authors would like to thank the companies involved in this study for donating time and materials needed to conduct this research. The views expressed in this paper are those of the authors and do not reflect the views of the research sponsors.

Conflicts of Interest

The authors declare no conflict of interest.

References

  1. Miller, R.A.; Castrodale, R.; Mirmiran, A.; Hastak, M. Connection of Simple-Span Precast Concrete Girders for Continuity; National Cooperative Highway Research Program Report 519; The National Academies Press: Washington, DC, USA, 2004. [Google Scholar] [CrossRef]
  2. Freyermuth, C.L. Design of Continuous Highway Bridges with Precast, Prestressed Concrete Girders. PCI J. 1969, 14, 14–39. [Google Scholar] [CrossRef]
  3. American Association of State Highway and Transportation Officials (AASHTO). AASHTO LRFD Bridge Design Specifications, 8th ed.; AASHTO: Washington, DC, USA, 2017. [Google Scholar]
  4. Looney, T.; Volz, J.; Floyd, R. Behavior of a 3-Span Continuous Bridge Before and After Continuity Joint Replacement Using Ultra-High Performance Concrete. J. Perform. Constr. Facil. 2021, 35, 04021087. [Google Scholar] [CrossRef]
  5. Looney, T.; McDaniel, A.; Volz, J.; Floyd, R. Development and Characterization of Ultra-High Performance Concrete with Slag Cement for Use as Bridge Joint Material. Br. J. Civ. Archit. Eng. 2019, 1, 1–14. [Google Scholar]
  6. Graybeal, B. Material Property Characterization of Ultra-High Performance Concrete; FHWA-HRT-06-103; Federal Highway Administration: McLean, VA, USA, 2006.
  7. Graybeal, B. Compression Response of a Rapid-Strengthening Ultra-High Performance Concrete Formulation; FHWA-HRT-12-64; Federal Highway Administration: McLean, VA, USA, 2012.
  8. Graybeal, B.A.; Baby, F. Development of Direct Tension Test Method for Ultra-High Performance Fiber-Reinforced Concrete. ACI Mater. J. 2013, 110, 177–186. [Google Scholar] [CrossRef]
  9. Haber, Z.B.; De la Varga, I.; Graybeal, B.A.; Nakashoji, B.; El-Helou, R. Properties and Behavior of UHPC-Class Materials; FHWA-HRT-18-036; Federal Highway Administration: McLean, VA, USA, 2018.
  10. Carbonell Muñoz, M.A.C.; Harris, D.K.; Ahlborn, T.M.; Froster, D.C. Bond Performance Between Ultrahigh-Performance Concrete and Normal Strength Concrete. J. Mater. Civ. Eng. 2014, 26, 04014031. [Google Scholar] [CrossRef]
  11. Tayeh, B.A.; Abu Baker, B.H.; Megat Johari, M.A.; Ranam, M.M. The Relationship Between Substrate Roughness Parameters and Bond Strength of Ultra Higher-Performance Fiber Concrete. J. Adhes. Sci. Technol. 2013, 27, 1790–1810. [Google Scholar] [CrossRef]
  12. Looney, T.; Coleman, R.; Funderburg, C.; Volz, J.; Floyd, R. Concrete Bond and Behavior of Nonproprietary Utlrahigh-Performance Concrete Bridge Slab Joints. J. Bridge Eng. 2021, 26, 04020128. [Google Scholar] [CrossRef]
  13. Haber, Z.B.; Munoz, J.F.; Graybeal, B.A. Field Testing of an Ultra-High Performance Concrete Overlay; FHWA-HRT-17-096; Federal Highway Administration: McLean, VA, USA, 2017.
  14. Wibowo, H.; Sritharan, S. Use of Ultra-High-Performance Concrete for Bridge Deck Overlays; IHRB Project TR-683; Bridge Engineering Center: Ames, IA, USA, 2018. [Google Scholar]
  15. Khayat, K.H.; Valipour, M. Design and Performance of Cost-Effective Ultra High Performance Concrete for Bridge Deck Overlays; CMR 18-006; Missouri. Dept. of Transportation. Construction and Materials Division: Jefferson City, MO, USA, 2018.
  16. Zmetra, K.M.; McMullen, K.F.; Zaghi, A.E.; Wille, K. Experimental Study of UHPC Repair for Corrosion-Damaged Steel Girder Ends. J. Bridge Eng. 2017, 22, 04017037. [Google Scholar] [CrossRef]
  17. Fan, Z.F.; Huang, W.; Negoita, A. Repairing Steel Girder End Corrosion Using Ultra-High Performance Concrete. J. Bridge Eng. 2022, 27, 05021015. [Google Scholar] [CrossRef]
  18. Shafei, B.; Phares, B.; Shi, W. Beam End Repair for Prestressed Concrete Beams; IHRB Project TR-715; Bridge Engineering Center: Ames, IA, USA, 2020. [Google Scholar]
  19. Wirkman, C. Performance of Fiber-Reinforced Self-Consolidating Concrete for Repair of Bridge Sub-Structures. Master’s Thesis, University of Oklahoma, Norman, OK, USA, 2016. [Google Scholar]
  20. Kassimi, F.; El-Sayed, A.K.; Khayat, K.H. Performance of Fiber-Reinforced Self-Consolidating Concrete for Repair of Reinforced Concrete Beams. ACI Struct. J. 2014, 111, 1277–1286. [Google Scholar] [CrossRef]
  21. Khayat, K.H.; Abdelrazik, A. Performance of Fiber-Reinforced Self-Consolidating Concrete for Repair of Bridge Sub-Structures and Fiber-Reinforced Super-Workable Concrete for Infrastructure Construction; CMR 17-012; Missouri. Dept. of Transportation. Construction and Materials Division: Jefferson City, MO, USA, 2017.
  22. Choate, J.G. Implementing Fiber-Reinforced, Self-Consolidating Concrete as a Repair Material for AASHTO Prestressed Concrete Girders. Master’s Thesis, University of Oklahoma, Norman, OK, USA, 2018. [Google Scholar]
  23. Fournier, P. Bridge Maintenance Experts Evaluate MALP Concrete Repair Technology Applied to Route 26 Span. Constructioneer 2014, 4–6. [Google Scholar]
  24. Ding, Z.; Li, Z. High-Early-Strength Magnesium Phosphate Cement with Fly Ash. ACI Mater. J. 2005, 102, 375–381. [Google Scholar] [CrossRef]
  25. Yue, L.; Bing, C. Factors That Affect the Properties of Magnesium Phosphate Cement. Constr. Build. Mater. 2013, 47, 977–983. [Google Scholar] [CrossRef]
  26. Concrete Repair Products—See Our Data Guides. Available online: https://www.phoscrete.com/data-guides/ (accessed on 12 November 2022).
  27. Expansion Joint Headers. Available online: https://www.phoscrete.com/expansion-joint-repairs/ (accessed on 12 November 2022).
  28. Concrete Spall Patches. Available online: https://www.phoscrete.com/horizontal-spall-patches/ (accessed on 12 November 2022).
  29. Oklahoma Department of Transportation (ODOT). Standard Specifications for Highway Construction; ODOT: Oklahoma City, OK, USA, 2019.
  30. Mayhorn, D. Investigations of the Effects of End Region Deterioration in Precast, Prestressed Concrete Bridge Girders. Master’s Thesis, University of Oklahoma, Norman, OK, USA.
  31. Murray, C.D. Understanding Ultimate Shear Behavior of Prestressed Concrete Girder Bridges as a System Through Experimental Testing and Analytical Methods. Ph.D. Thesis, University of Oklahoma, Norman, OK, USA, 2017. [Google Scholar]
  32. Casey, C.W. Ultra-High Performance Concrete for Connections of Precast, Prestressed Girders Made Continuous for Live Load. Master’s Thesis, University of Oklahoma, Norman, OK, USA, 2019. [Google Scholar]
Figure 1. Example of continuity joint damage noted by arrows.
Applsci 12 12775 g001
Figure 2. Individual girder dimensions and reinforcing layout.
Applsci 12 12775 g002
Figure 3. Fully constructed connected girder test specimen.
Applsci 12 12775 g003
Figure 4. Initial crack test setup.
Applsci 12 12775 g004
Figure 5. Joint repair reinforcement.
Applsci 12 12775 g005
Figure 6. Example crack patterns in the connected girder specimens when subjected to positive moment bending.
Applsci 12 12775 g006
Figure 7. Load vs. deflection plots for all repairs subjected to positive bending.
Applsci 12 12775 g007
Figure 8. 1-UHPC load vs. strain for each instrumented reinforcing bar.
Applsci 12 12775 g008
Figure 9. 1-FRSCC load vs. strain for each instrumented reinforcing bar.
Applsci 12 12775 g009
Figure 10. 1-MALP load vs. strain for each instrumented reinforcing bar.
Applsci 12 12775 g010
Figure 11. Load vs. deflection plot for control connected girder specimens.
Applsci 12 12775 g011
Figure 12. Load vs. strain plot for control connected girder specimens.
Applsci 12 12775 g012
Figure 13. Load vs. deflection plot for connected girder specimens repaired with UHPC.
Applsci 12 12775 g013
Figure 14. Load vs. strain plot for connected girder specimens repaired with UHPC.
Applsci 12 12775 g014
Figure 15. Load vs. deflection plot for connected girder specimens repaired with FRSCC.
Applsci 12 12775 g015
Figure 16. Load vs. strain plot for connected girder specimens repaired with FRSCC.
Applsci 12 12775 g016
Figure 17. Load vs. deflection plot for connected girder specimens repaired with MALP.
Applsci 12 12775 g017
Figure 18. Load vs. strain plot for connected girder specimens repaired with MALP.
Applsci 12 12775 g018
Figure 19. Load vs. deflection plot for all connected girder specimens.
Applsci 12 12775 g019
Figure 20. Repaired UHPC (top), FRSCC (middle), and MALP (bottom) after testing.
Applsci 12 12775 g020
Table 1. Class AA, UHPC, and FRSCC mix designs.
Class AAUHPCFRSCC
Type I/II Cement (kg/m3)267535187
#57 Crushed Limestone (kg/m3)83500
9.5 mm River Rock (kg/m3)00575
Concrete Sand (kg/m3)5810648
Fine Masonry Sand (kg/m3)08920
Type K additive (kg/m3)0051
Class C Fly Ash (kg/m3)00102
Slag Cement (kg/m3)02680
Silica Fume (kg/m3)0890
High Range Water Reducer (oz./cwt)319.561.9
Air Entrainer (oz./cwt)0.708.2
Steel Fibers (kg/m3)01200
MasterFiber MAC Matrix Fibers (kg/m3)003
Water (kg/m3)1051780
Table 2. Concrete compressive strengths at 28 days.
Compressive Strength (MPa)Coefficient of Variation
Class AA34.93.3%
UHPC139.53.3%
FRSCC48.715.0%
MALP30.61.7%
Table 3. Peak loads reached in negative bending tests.
Repair MaterialSpecimen #Failure Load (kN)Average Failure Load (kN)Coefficient of Variation
Control1198.38193.93.33%
2198.47
3184.73
UHPC2204.70204.70.02%
3204.61
FRSCC2204.65204.70.00%
3204.65
MALP2204.79205.00.10%
3205.19
Publisher’s Note: MDPI stays neutral with regard to jurisdictional claims in published maps and institutional affiliations.

