1. Introduction
Sympathetic detonation involves the initiation (usually unwanted) of an explosive charge called the acceptor due to the detonation of another charge called the donor. The initiation of the acceptor can be induced by detonation products and/or shock waves, depending on the distance between the two explosive charges.
The issue of sympathetic detonation is encountered in both military and civilian applications. In the military domain, avoiding sympathetic detonation is important, among other things, in the process of neutralizing IEDs or unexploded ordnance (UXO). In order to determine the critical distances at which the neutralization system can be placed, the possibility of sympathetic initiation of the IED load must also be taken into account since it is very important to avoid the effects that are produced by an unwanted initiation of the IED.
Starting from the principle of IED neutralization, namely preventing its operation (detonation of the explosive charge) and separating the component elements so that its functioning can no longer be triggered by the subsequent handling or interacting with the environment, the requirement of the neutralization system’s performance can be formulated as the ability to induce a high enough shock in the IED to separate its parts, but at the same time to avoid the initiation of the explosive charge caused by the effects of the donor charge’s detonation.
In both military and civilian fields, the storage, transportation, handling, and the production of explosives or items that include explosives involve risks due to the sensitivity and reactivity of such materials. As history has proven, one of the main risks is associated with the tendency of energetic materials to react to a nearby stimulus, such as an explosion or a kinetic impact. Over time, the above-mentioned tendency led to several catastrophic accidents in military facilities as well as in civil mining and industrial sites. Due to these tragic events, regulations regarding the design and use of items containing explosives were imposed. Among these regulations, sympathetic detonation evaluation tests are mandatory and can be seen as the backbone of safety program tests.
The evaluation of the tendency of an energetic material toward sympathetic detonation is assessed using the gap test. Basically, the gap test is a widely used test that aims to evaluate the sensitivity of explosives to blast waves. The gap test and other associated tests have been performed numerically and experimentally for different types of explosives, both on land and underwater, by several researchers throughout history. Thus, Yang et al. [
1] numerically investigated Composition B’s susceptibility to sympathetic detonation based on a Direct Numerical Simulation (DNS) scheme, which was also validated experimentally. They concluded that the probability of sympathetic detonation is related not only to the type of explosive and distance but also to the size of the charge. Zhang et al. [
2] experimentally evaluated the underwater sympathetic detonation of TNT and analyzed the energy, pressure, and pulsing cycle. Kubota et al. [
3,
4] investigated using high-speed photography the sympathetic detonation of Composition B both in air and underwater and also investigated it numerically by using Lee and Tarver’s phenomenological reaction-rate law. An experimental study by Becuwe and Delclos [
5] on the sympathetic detonation of low-sensitivity explosive compounds (NTO and HMX-based PBX) showed that the shock insensitivity of the studied explosive mixture is combined with very good behavior under fire, slow heating, and a ball impact. Keshavarz et al. [
6] studied the possibility of using a small-scale gap test to evaluate the sympathetic detonation of CaHbNcOd explosives and proposed a simple procedure for the analytical calculation of the shock sensitivity of energetic compounds. Ko et al. [
7] investigated experimentally and numerically the shock sensitivity of a shaped charge underwater and showed that in an underwater explosion, the index of the sympathetic detonation is slightly higher than in the air. Along with the previously mentioned research teams, several others can easily be named, including researchers/teams that approached the subject in a theoretical manner, such as M.H. Keshavarz, E.N. Ferm, H.R. James, and A.C. Victor [
6,
8,
9,
10].
When an explosive charge (explosive bars) is subjected to the action of a shock wave, this shock wave will produce the initiation of the acceptor charge only if the energy of the shock wave is greater than the critical energy. The critical energy considers not only the pressure level (shock amplitude) but also the pulse duration and the acceptor impedance as stated by Walker and Wasley [
11]. The formula for energy calculation is given in Equation (1).
where
P is the shock amplitude,
t indicates the pulse duration,
ρ0 denotes the acceptor’s initial density, and
U is the shock velocity that travels through the acceptor. The term
Ec has the dimension of energy per unit area and is therefore referred to as energy fluence. Through experimental tests carried out with different explosives subjected to the square-wave shock produced by the impact of the flyer test, it was found that each explosive has a range of energy fluence in which a stable detonation is produced, called critical energy fluence [
12]. Additionally, for the evaluation of the initiation of an explosive under the action of the shock wave, the “Pop-plot” [
12] can be considered, which represents the graphic representation in logarithmic coordinates of the run distance as a function of pressure for the acceptor explosive.
The application of Equation (1) used to evaluate the initiation of detonation of an explosive charge requires the determination, by numerical analysis, of the amplitude and duration of the applied shock. In the absence of numerical analysis, the relationship developed by Yadav [
13] takes into account detonation parameters, which are easier to measure and can be used to determine the energy transmitted to the explosive charge. This relation is specified in Equation (2).
where
ρ0 is the initial density,
Dj is the velocity of detonation,
δ is the thickness of reaction,
r denotes the specific heat ratio of detonation products, and
ax and
bx are Hugoniot constants.
In line with the sympathetic detonation issue, yet in a less conventional manner, the current paper focuses on the investigation of the sympathetic detonation tendency of the blasting cap, containing pentaerythritol tetranitrate (PETN) charges. The main focus is targeted on investigating the applicability of critical energy fluence for a particular configuration with an air gap between donor and acceptor explosive charges.
For the assessment of the detonation initiation potential of a blasting cap, in this paper, we will use Equation (1) because, when using numerical analysis, the parameters in this equation are determined much faster. The relevance of the study is obvious when one considers the specific way in which the neutralization of suspicious packages is carried out. Basically, the disruption of such packages is performed by propelling a disrupting agent (metallic/plastic bolts or water) with the use of small explosive charges. The blast wave generated by the detonation of an explosive charge has the potential, in certain conditions, to lead to unwanted package detonation due to the initiation of explosive charge and/or blasting caps.
2. Experimental Investigation
In order to experimentally evaluate the sensitivity of blasting caps to blast waves, several tests have been performed. The experiments involved the use of 100 g of TNT as donor charge and ϕ7 × 69 mm blasting cap as an acceptor. TNT was chosen as a donor because it is considered a reference explosive. Although the amount of 100 g of explosive is not common for neutralization systems, it was used to better capture the influence that the detonation products and the shock wave can have on the sympathetic detonation of a blast initiator. The experimental setup illustrated in
Figure 1 aims to identify a critical distance, in terms of air thickness, between the acceptor and the donor that will end in a no-go reaction for the acceptor.
The blasting cap type used in these experiments is based on 0.6 g PETN charge with a density of 1.75 gm/cm3. The donor charge was detonated using the same type of blasting cap as the detonator as the one used as the acceptor.
The tests were performed in an open space configuration, imposing a higher y value (donor/ground distance) than the x value (donor/acceptor distance). Using this approach, the incident blast wave was allowed to arrive first at the acceptor position instead of a one reflected. The post-test recovery of target blasting caps, when possible, was the criterion for identifying a possible detonation of the acceptor. A witness plate was not used due to the chosen test setup (the TNT charge was parallel to the blasting caps in order to have a larger contact surface; this represents the most unfavorable situation in relation to the position that a disruption load can have towards an acceptor load from the components of an IED). In this situation, the presence of a witness plate could have influenced the initiation of the blast cap from the shock wave that is reflected from the plate.
Table 1 lists the experimental results regarding blasting cap sympathetic detonation tendency.
A fast image recording camera (Photron, FASTCAM SA-Z), set to an acquisition rate of 30,000 fps, was used as part of the testing setup. Thus, the blast wave position and fireball dimension during experimental tests were traced.
Table 2 contains the results that were extracted from image analysis, and the detonation of 100 g TNT is illustrated in
Figure 2.
3. Numerical Approach
While experimental testing is the most suitable method to evaluate sympathetic detonation, the numerical approach has proved to be a valuable tool in deciphering the process specifics. Thus, important aspects of the detonation propagation process (pressure level in the donor/acceptor charge or run distance for a stable detonation) can be investigated using a low-cost and reasonable-time scenario. For the proposed experimental tests, numerical models have been defined using Autodyn 2021
® software [
14].
3.1. Preprocessing
In order to corroborate the experimental results with the numerical ones, one simple approach was considered. The numerical model is based on a 2D planar symmetrical geometry and the use of multi-material Euler part.
Since the mesh sensitivity is a well-known characteristic of commercial software based on the Finite Element Method (FEM), special attention was given to this aspect. Considering Ko’s observation [
7] regarding the recommended mesh dimension as a function of the distance for the free air blast wave and also the distances involved in experimental tests, a graded mesh was imposed. The mesh dimension varies in both directions from 0.1 mm in the blasting cap region to 1 mm in the donor charge area, as shown in
Figure 3.
In addition to the above-mentioned aspects, it must be pointed out that two rows of six gauges, 1 mm apart on the X axis and 5 mm apart on the Y axis, were used for numerical calculus to record the peak pressure in the acceptor charge. The position of the gauges, the material location, and the edges on which boundary condition were imposed, as shown in
Figure 4. Additionally, in order to reduce the simulation time, the pressure contours generated by 100 g TNT detonation have been remapped in the current simulation using the fill option from a separate Autodyn 2021
® file.
3.2. Material Models
The basic properties of any substance, explosives included, are usually identified through a mathematical relation that correlates pressure, volume, and internal energy/temperature. The relation is called an equation of state (EOS).
In the process of numerical analysis of the sympathetic detonation, it was found that the choice of the equation of state that describes the behavior of the donor and acceptor charges plays a very important role.
Over time, numerous attempts to define an EOS that accurately predicts the behavior of explosive gas products have been made. In fact, the number of proposed equations was high enough to classify them into two distinct categories: one considers the chemistry explicitly and the other does not [
15].
Unfortunately, all of the above-mentioned equations have limited the applicability and variable accuracy. Despite this shortcut, their use in numerical calculus is extremely beneficial since different particular situations can be investigated in a reasonable time frame and an almost costless manner.
When explosive detonation applications are numerically investigated, one EOS is usually involved, namely Jones–Wilkins–Lee (JWL) [
16]. In fact, the use of the JWL EOS is so common that by now almost all hydrocodes have implemented it and several forms can be identified in the literature. However, the most known form of equation is the form of a family of isentropes [
17], which is illustrated in Equation (3).
where
p is the pressure;
S refers to the entropy per unit initial volume (
s/
v0);
V is the volume relative to the undetonated state (
v/
v0);
A,
B,
R1, and
R2 are constant fitting parameters;
ω is an assumed-constant material parameter (Grüneisen function); and
C*(
S) is a parameter dependent only upon the entropy
S.
Based on the previously mentioned JWL EOS and ideal gas EOS assumptions, the pressure in the front of a traveling blast wave can be accurately evaluated when hydrodynamic simulations are employed. Even though the equation’s versatility is impressive, the application of JWL EOS by itself cannot deliver crucial data regarding the initiation of the explosive when subjected to blast wave stimulus. Thus, in order to investigate the blasting cap sympathetic detonation susceptibility, a slightly different EOS was chosen, the Lee–Tarver equation of state [
18]. In fact, the Lee–Tarver EOS is basically a JWL EOS that has been upgraded with a supplementary equation, Equation (4), that allows the evaluation of the burning fraction based on the pressure level acting on/inside the explosive [
18].
where
F is the explosive burning fraction which has a value between 0 and 1.
The importance of JWL EOS and Lee–Tarver EOS for the current blast cap sympathetic detonation study is correlated with the Chapman–Jouguet pressure level that can be used as the Go/No-Go criterion.
The materials used in the numerical simulation are TNT for the donor charge, PETNJJ1 for the acceptor charge, aluminum for the blasting cap walls, and air for the space between the donor and the acceptor. All the equations of state (EOS) and strength models of the materials were adopted from the library of the Autodyn 2021® software.
3.3. Numerical Results
The obtained numerical results are presented in
Table 3. In
Figure 5, the pressure levels recorded by two different gauges located inside the acceptor charge are illustrated for two cases.
Figure 5a shows the pressure levels in the case of a 200 mm gap between the donor and acceptor, while
Figure 5b shows the results for a distance of 500 mm. The peak overpressure was directly measured from the gauges. The pressure wave speed was determined from graphs of pressure in time, for consecutive sensors. By dividing the distance between the sensors by the values of the times at which the maximum values of the pressures were obtained, the shock wave velocities were determined for each case of the acceptor–donor charge. The critical energy fluence was determined by using the maximum pressure value, speed, and the pulse duration of the shock wave. For the calculation of the shock wave pulse duration, the area under the pressure–time curve was numerically evaluated and then approximated with a square-shaped pulse (rectangle with a height given by the maximum pressure value and length given by the value of pressure-acting time that equals the previously calculated impulse).
4. Discussion
As the main goal of the present study is to evaluate the sympathetic detonation tendency of blasting caps, the main focus is on the correlation of experimental and numerical results.
If the experimental approach is a straight forward method that clearly points out the presence of acceptor detonation, the numerical approach is somehow trickier.
As previously mentioned, the numerical simulation is based on the use of Lee–Tarver EOS [
19]. The Lee–Tarver EOS points mainly at the Chapman–Jouguet [
19,
20] findings that were later included in von Neumann’s work [
21]. Basically, a stable detonation is achieved when the pressure level reaches a certain value that is specific to each explosive (0.327 Mbar for PETN). Considering this approach, the blasting cap will not be susceptible to sympathetic detonation (in a range of a 0.1 to 0.5 m clearance distance) as long as the pressure recorded by the gauges indicates significantly lower levels (see
Table 3). Nevertheless, as experimental tests have proved, the blasting cap detonation manifested at both 100 mm and 200 mm, where, according to numerical simulation, the peak overpressure is less than 0.327 Mbar.
Acknowledging the hypothesis involved in the critical energy fluence theory (step pulse shape and constant impedance, mainly) and the 1.5 × 10
5 J/m
2 threshold value for the energy fluence of PETN (1.75 gm/cm
3) [
22], the calculus based on the numerical data (
Figure 5) indicates a very good match with the experimental observation (see
Table 1 and
Table 3). Thus, it is found that for distances of 100 mm and 200 mm, the critical energy values are close to the threshold value for the initiation of the acceptor explosive. On the other hand, the recorded pressures are lower than those corresponding to the C-J state, which indicates a weak detonation. The values of the maximum pressure and the duration of the positive phase of the phenomenon shown in
Figure 5a fall within the values presented in the literature for the initiation of solid explosives [
23]. Moreover, the shape of the pressure–time curve in
Figure 5a is similar to the ones in Walker and Wasley’s work [
24] at the point that the initiation of the explosive occurs. Additionally, by analyzing
Figure 5, it can be observed that the pressure wave shape acting on the blasting cap has a much different profile from the ones usually recorded during a standard gap test.
Due to the mismatch between the shock wave’s front velocity and donor gas products’ front velocity, the first to act on the blast cap is the blast wave, and the gas products pressure shortly afterward, depending on the relative position between the donor and acceptor charges, as can be deduced from
Figure 6. The pressure wave profile is also shaped by the reflected blast wave, which is clearly indicated by the numerical simulation.
The same outcome can be underlined by theoretical means as well. Therefore, using far-field experimental data (images recorded when the blast wave has already traveled over a 0.6 m distance), the Sedov-Taylor model [
25,
26], and Gilev’s observations [
27], one can predict the distance between the incident blast wave and the gas products’ border. Useful data regarding the position of the blast wave and the gas products’ border can be extracted by solving Equations (5)–(10) [
25,
26,
27,
28,
29]. In
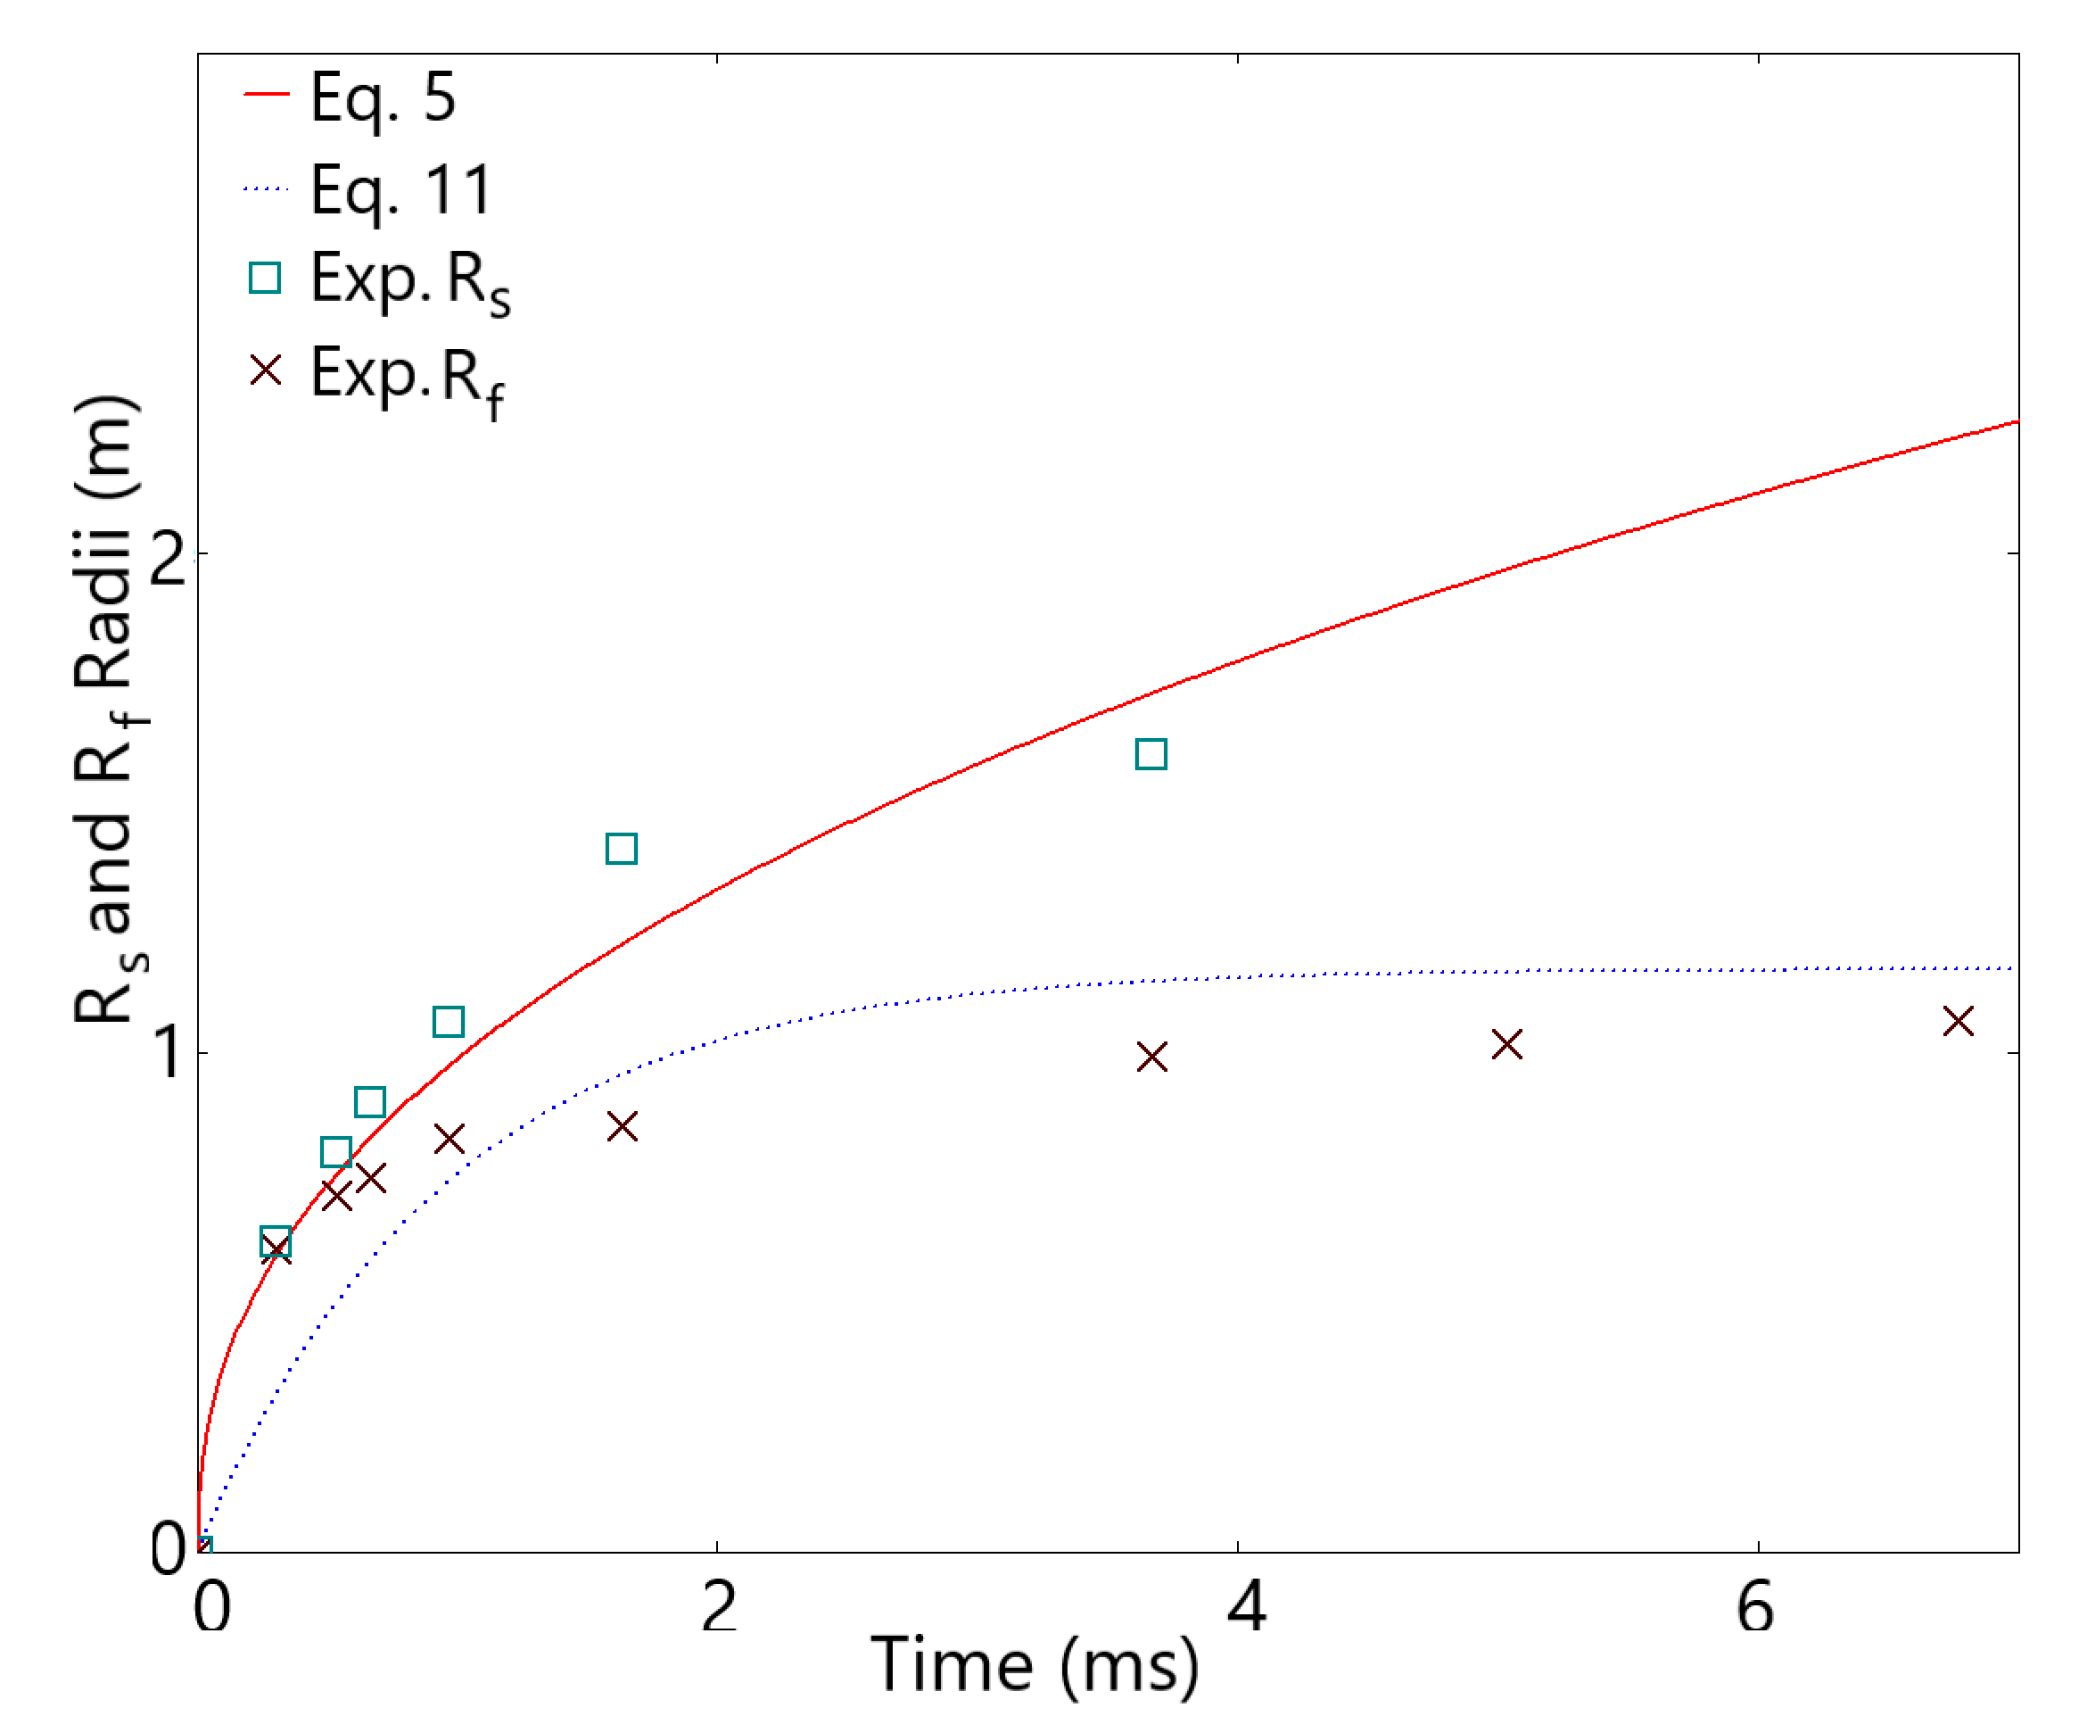
Figure 7, a comparison between experimental results and the application of Equations (5)–(10) for two values of the expansion dimensionality factor is presented.
where
Rs(
t) indicates the shock front radii;
a and
b are coefficients;
Ed is the TNT release energy during detonation (usually 4.1 MJ/kg);
l0 denotes a length scale;
τ0 denotes a time scale;
m is the TNT mass;
ρ is the TNT mass density;
vTNT denotes the TNT detonation velocity (6940 m/s);
s indicates a factor characterizing the rate of energy release: instantaneous energy release (s = 0) and constant-rate energy release (s = 1);
n is the expansion dimensionality: planar expansion (
n = 1), cylindrical expansion (
n = 2), and spherical expansion (
n = 3);
Rf(
t) indicates the fireball radii;
Rmax is the fireball stopping radii (0); and k denotes the drag coefficient.
It must be stated that the Sedov–Taylor equation can be applied only to the mid-field region according to Equation (11) [
28].
where Δ
Hd indicates the total energy released during detonation, afterburning included, (up to 10.1 MJ/kg [
30]), and
p denotes the ambient pressure.
Using high-speed camera imaging,
Rs radii can be identified for different time values. Since the TNT charge has a cylindrical shape, a factor
n = 2 was considered. Additionally, due to the fact that the distances between the TNT charge and the blasting cap are small (less than 0.5 m) for the experimental setup, an instantaneous energy release (s = 0) was set. However, the experimental results plotted against the results provided by Equation (5), which are presented in
Figure 7a, show some considerable differences.
By closely analyzing the footage in
Figure 8, it can be observed that the blast wave shape presents itself neither as a cylindrical shape nor as a spherical one. The mismatch is probably due to the ratio between the length and the diameter of the TNT blast charge, which has a value of 3.57, and also due to the overall small dimensions of the charge. Considering the experimental blast’s wave shape, which is more like an ellipsoid, a different value for
n factor was chosen, namely 2.7. A comparison between predicted and experimental results for the modified value of the
n factor is presented in
Figure 7b, and it is clear that the use of this value leads to a much better approximation of the experimental data.
The
Rf radii can also be calibrated with the use of the camera footage and finally plotted against
Rs values, as shown in
Figure 9. Predictions using Equation (11) are plotted in the same figure. With the use of
Figure 9, one can easily see that the blast wave gradually moves away from the fireball border, which is consistent with the data provided by the numerical simulation.
The analytical calculus based on Equations (5)–(10) is confirmed by a numerical approach, as shown in
Figure 10. According to
Figure 10, the blast wave front gradually speeds up, leaving behind the front of the donor gas products.
As mentioned in
Section 3.1, two rows of gauges (six gauges/row) were used for pressure recording in the acceptor charge. This particular choice was due to the close distance between the donor and acceptor charges which resulted in a curved shock wave front, as depicted in
Figure 10. As a result of the curved shock wave front, the first susceptible area to interact with the blast wave is the upper front of the acceptor charge. This can be clearly seen in
Figure 5, where the higher-pressure values are recorded by gauges no. 7 and 8.


