Article

An Array SPRi Biosensor for Simultaneous VEGF-A and FGF-2 Determination in Biological Samples

by
Lukasz Oldak
1,2,*,
Anna Leśniewska
1,
Beata Zelazowska-Rutkowska
3,
Eryk Latoch
4,
Zenon Lukaszewski
5,
Maryna Krawczuk-Rybak
4 and
Ewa Gorodkiewicz
1,*
1
Bioanalysis Laboratory, Faculty of Chemistry, University of Bialystok, Ciolkowskiego 1K, 15-245 Bialystok, Poland
2
Doctoral School of Exact and Natural Science, Faculty of Chemistry, University of Bialystok, Ciolkowskiego 1K, 15-245 Bialystok, Poland
3
Department of Pediatric Laboratory Diagnostics, Medical University of Bialystok, Waszyngtona 17, 15-274 Bialystok, Poland
4
Department of Pediatric Oncology and Hematology, Medical University of Bialystok, 15-274 Bialystok, Poland
5
Faculty of Chemical Technology, Poznan University of Technology, pl. Sklodowskiej-Curie 5, 60-965 Poznan, Poland
*
Authors to whom correspondence should be addressed.
Appl. Sci. 2022, 12(24), 12699; https://doi.org/10.3390/app122412699
Submission received: 9 November 2022 / Revised: 7 December 2022 / Accepted: 9 December 2022 / Published: 11 December 2022
(This article belongs to the Special Issue Recent Trends in Atherosclerosis and Related Diseases)

Abstract

:
A new method was developed for the simultaneous determination of vascular endothelial growth factor (VEGF-A) and fibroblast growth factor-2 (FGF-2) in blood serum, using biosensors with array Surface Plasmon Resonance imaging (SPRi) detection. It can be applied as a single method for simultaneous VEGF-A and FGF-2 determination or as two separate methods for testing only one selected protein in each case. Validation was carried out for each method. Limit of detection (LOD) and limit of quantification (LOQ) values were determined and were found not to differ significantly from the parameters obtained in comparisons with commercial enzyme-linked immunosorbent assay (ELISA) tests. Tests were carried out to check the robustness of the method. The results indicate a lack of robustness of the analytical method to elevated temperature and pH values other than those recommended by the manufacturers of the reagents (recommended pH = 7.40). The values of recoveries were determined and confirmed the reliability of the results obtained with the use of the newly developed method. The selectivity studies showed no negative influence of other proteins present in the matrix of the tested samples on the results of the VEGF-A and FGF-2 concentration measurements. The developed method is also characterized by high reproducibility of the results obtained and agreement with the VEGF-A and FGF-2 concentration values obtained with commercial ELISA tests. The proposed method offers fast, reproducible, and accurate simultaneous quantification of VEGF-A and FGF-2 in human body fluids. Only 4 µL of test sample are required for simultaneous analysis. The total time for simultaneous analysis of both biomarkers does not exceed 20 min. The developed analytical method is superior to ELISA in terms of analysis time and sample volume for analysis, and it offers lower LOD and LOQ values and allows for the simultaneous analysis of two biomarkers. There is also no need to collect a large number of samples. Standard ELISAs usually have 96 reaction wells. The proposed biosensor can be used to analyse only one sample, without the need to waste reagents on unused reaction sites. In addition, it is possible to regenerate the biosensor and reuse it.

1. Introduction

Angiogenesis is a biological process that leads to the formation of new capillaries from existing blood vessels. It is an integral part of physiological processes, such as embryonic development, wound healing, and ovulation. It is also present in disease and pathological conditions, which include, among others, cancer, arthritis, and diabetic retinopathy. Angiogenesis is significantly enhanced in cancer metastasis, which is the most severe stage of disease. It is regulated by various growth factors, including vascular endothelial growth factor (VEGF-A) and fibroblast growth factor-2 (FGF-2) [1].
VEGF-A is the main mediator of vascular hyperpermeability, as well as angiogenesis and inflammatory processes involved in tissue repair. A single human VEGF-A gene accounts for at least eight isoforms (VEGF-121, VEGF-145, VEGF-148, VEGF-165, VEGF-183, VEGF-189, and VEGF-206), which vary in quantity in tissues [2]. The concentration of VEGF-A in the serum of healthy human subjects has been reported as equal to 550 pg/mL [3], 155–310 pg/mL [4], 48–106 pg/mL [5], or 160 ± 126 pg/mL [6]. VEGF-A concentration in human plasma is significantly lower (32 ± 22 pg/mL) [6]. Considering the data from the studied groups in the cited articles, we believe that the concentration of VEGF-A in healthy donors should range from about 34 pg/mL to about 310 pg/mL. VEGF-A(165) is widely regarded as a potent vascular permeability enhancer that is dominant in physiological and pathological angiogenesis. It has the ability to interact with many VEGF receptors; therefore, this isoform is primarily involved in the induction of proliferation, migration, and cell survival. As a result, VEGF-A(165) is regarded as a protein that is probably able to regulate all stages of both physiological and pathological angiogenesis [7]. In haematological tumours, VEGF-A is responsible for the growth, survival, and migration of cells. Moreover, it positively influences the self-renewal of leukemic progenitor cells. A study found that the concentration of VEGF-A increased, in some cases by almost seven times, in children with ALL compared with the control group [8].
FGF-2 (bFGF) is one of 23 members of the group of fibroblast growth factors. Two isoforms of 18 and 24 kDa are mainly involved in biological processes. FGF-2 forms with masses of 22, 22.5, and 34 kDa have also been isolated. FGF-2 proteins are responsible for the most important biological functions, such as acquisition of the survival phenotype and regulation of gene expression [9]. FGF-2 also has alternative isoforms that result from appropriate mRNA translations. These include the cytoplasmic isoform with a mass of 17 kDa and two others with higher molecular weights of 21 and 23 kDa [10]. The concentration of FGF-2 in human serum is rarely reported, and no clear data concerning FGF-2 levels are available. Values of 275 ± 235 pg/mL [11] and 1.54 ± 1.98 pg/mL [6] are reported for healthy subjects; while taking into account the clinical description, we are more inclined to accept the value of 1.54 ± 1.98 pg/mL. For this reason, new and more reliable methods for its determination are desirable. Little is known about the role of FGF-2 (17 kDa) in leukaemias. However, it is known that this isoform is responsible for the proliferation of cells (astrocytes) which are crucial in cases of Alzheimer’s disease. The promotion of the proliferation of these cells has a positive influence in the form of a protective effect of FGF-2 (17 kDa) in Alzheimer’s disease [10]. On the other hand, rat prostate cancer cells were found to contain significant levels of FGF-2 (17 kDa), indicating that this isoform is associated with neoplastic transformation [12].
The fundamental role of angiogenesis is confirmed, first of all, in the growth and metastasis of solid tumours [13]. However, there are reports that suggest that angiogenesis may also play a role in the pathogenesis of haematological neoplasms. The observations concern the increased density of microvessels in bone marrow biopsies from children diagnosed with acute lymphoblastic leukaemia compared with control bone marrow biopsies [14]. Several abnormalities in the appearance of vessels were observed in the bone marrow biopsies with leukaemia, including abnormal three-dimensional structure and poorly shaped light. An increased density of abnormal blood vessels has also been reported in the case of multiple myeloma [15,16].
It is known that malignant cells responsible for blood cancers secrete proangiogenic growth factors, which include VEGF-A and FGF-2. The following table (Table 1) lists haematological tumours in which abnormalities in VEGF-A and FGF-2 levels have been observed.
Surface plasmon resonance (SPR) is a sensitive optical technique used in the study of the kinetics of bonds between biomolecules. It also offers real-time label-free quantification. SPR biosensors are divided into several types. These include biosensors based on the following measurements: changes in the reflectance coefficient, changes in the resonance angle, changes in the wavelength of light, changes in phase, and light polarization [27]. The formation of a thin organic layer on the metallic surface of the biosensor causes a change in the refractive index compared with the biosensor surface without the particles present [28]. In this work, a biosensor operating with an SPRi (surface plasmon resonance imaging) spectrometer is presented. SPRi, unlike conventional SPR, uses a constant resonance angle and wavelength of the incident light, with a CCD camera used to detect the reflected light.
The matrix SPRi technique is a variant of SPRi used in the determination of protein biomarkers. It offers a much higher capacity than standard SPR in the determination of such cancer biomarkers as CEA [29], HE 4 [30], CA 125 [31], aromatase [32], and podoplanin [33]. A comparison of matrix SPRi and standard SPR in the determination of cancer biomarkers is given in the review [34]. Matrix SPRi enables the testing of multiple analytes simultaneously.
In this article, we present the first SPRi immuno-sensor for the simultaneous determination of VEGF-A and FGF-2 in blood serum. The developed biosensor has a great advantage in that it can be used either as a single method for the simultaneous determination of two analytes or as two separate methods for VEGF-A and FGF-2 quantification, respectively.

2. Reagents, Materials and Methods

2.1. Reagents and Materials

The following reagents were used for the construction of the biosensor and validation of the analytical method: recombinant human VEGF-A (165) (Abcam, Cambridge, UK), monoclonal rabbit antibody against VEGF-A (165) (Abcam, Cambridge, UK), recombinant human FGF-2 (17 kDa) (R&D Systems, Minneapolis, MN, USA), monoclonal rabbit primary and secondary antibody against FGF-2 (17 kDa) (R&D Systems, Minneapolis, MN, USA), ELISA kit for VEGF-A analysis (165) (R&D Systems, Minneapolis, USA), ELISA kit for FGF-2 analysis (17 kDa) (R&D Systems, Minneapolis, MN, USA), cysteamine hydrochloride, EDC [N-ethyl-N’-(3-dimethylaminopropyl) carbodiimide], NHS [N-hydroxysuccinimide], absolute ethanol 99.8% (Sigma Aldrich, Saint Louis, Missouri, MO, USA), HBS-ES solution (pH = 7.40, 0.01 M HEPES, 0.15 M sodium chloride, 0.005% Tween-20, 3 mM EDTA) (all reagents from Sigma Aldrich, Saint Louis, Missouri, MO, USA), PBS (pH = 7.40, phosphate buffered saline) (BIOMED, Lublin, Poland), and L-glycine solution (pH = 2.40, L-glycine solution with HCl solution) (all reagents from Sigma Aldrich, Saint Louis, Missouri, MO, USA). The bases of the biosensors were glass plates with sputtered gold, 50 nm thick, purchased from SSeens, PR Enschede, The Netherlands (1-07-04-000, Lot. H418-063). For the construction of a biosensor with 12 active sites, the light-curing polymer Elpemer SD 2457 (Lackwerke Peters GmbH, Kempen, Germany) was used, which, after screen printing on a properly cleaned gold chip, was dried at 65 °C for 1 h and then cured with UV light for 5 min. The layer of this photopolymer prevented mixing of the tested solutions on the surface of the biosensor.

2.2. SPRi and ELISA Apparatus

During the construction and validation of the developed analytical method, an SPRi spectrometer was used, constructed in the Bioanalysis Laboratory of the University of Bialystok, in cooperation with Bialystok University of Technology and AC S.A.
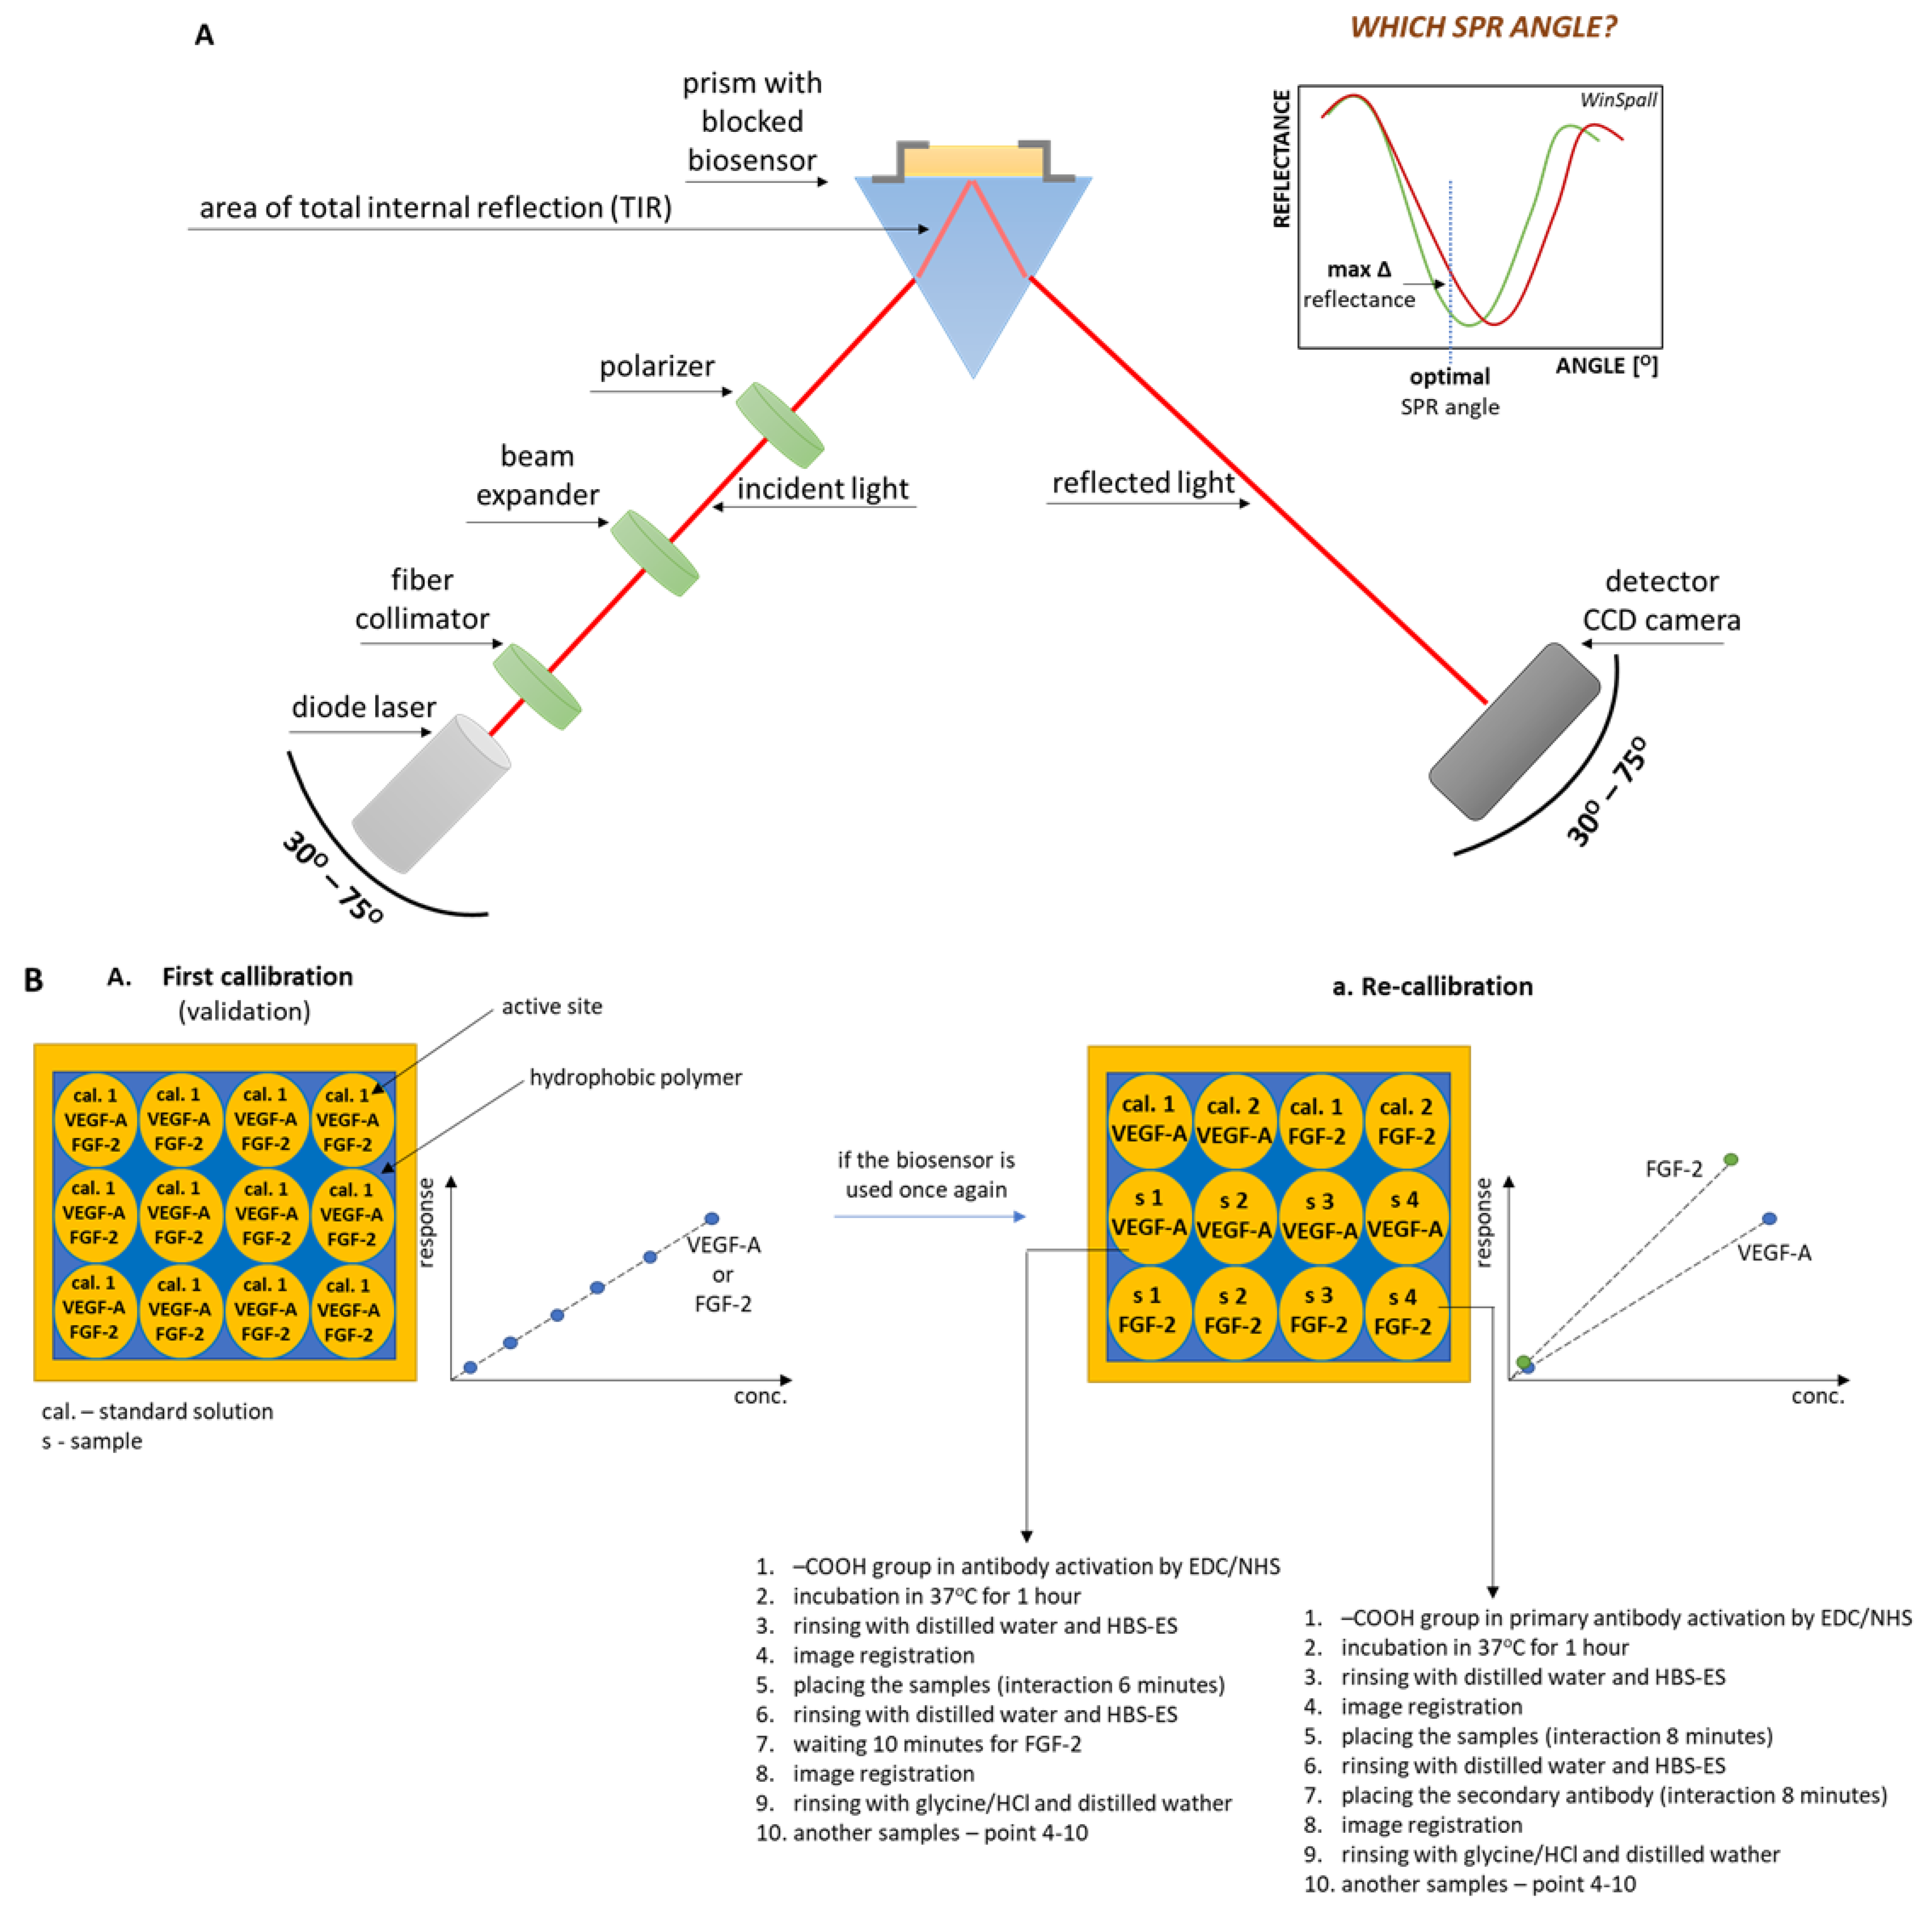
The device consists of, among other components, a diode laser emitting light with a wavelength of λ = 630 nm, which is then directed at a collimator and a system of lenses focusing the light beam and a polarizer, which is responsible for selecting p-polarization (which causes the SPR effect, used to observe interactions) or s-polarization (which causes extinction of the SPR effect, used to reduce the impact of small variations in the intensity of the incident light beam from the laser and the effect of heating of the detector, namely the passively cooled CCD camera). Then the light with the polarization set by the analyst falls on a glass equilateral prism on which the biosensor is placed with a specially constructed block that prevents the biosensor from moving during the analysis. The reflected light is collected by a 1.4 MP monochrome CCD camera. All elements of the optical system are located on two movable arms, which can move within an angular range of 30 to 75°. This solution makes it possible to select the optimal value of the SPR angle. This angle was selected during the validation of the analytical method for each biosensor—that is, each time a new gold-plated plate and a photopolymer layer were used—using SPR WinSpall curve modelling software. The selected SPR angle value was that at which the greatest change in reflectance relative to the base curve was recorded. Figure A1 in the Appendix A shows a diagram of the SPRi spectrometer used and a diagram of the biosensor and analytical procedure.
The Anthos ELISA Reader (Salzburg, Austria) was used for the ELISA tests and quantitation was performed according to the recommendations of the manufacturer’s protocol.

2.3. Biological Material

Validation of the analytical method was carried out using blood serum from children with diagnosed leukaemia (ALL type), which was obtained from the Department of Paediatric Oncology and Haematology, Medical University of Bialystok. The study also included control samples consisting of blood serum from subjects without diagnosed haematological neoplasms.

2.4. Chip Preparation

A diagram of the biosensor is shown in Figure 1. The base of the biosensor is a gold plate covered with a layer of separating polymer. This plate was immersed in a 20 mM alcoholic cysteamine solution for a minimum of 12 h to form a linker monolayer to enable binding of the ligand (receptor) antibody. After the required time, the plate was rinsed in anhydrous ethyl alcohol and water. The next step was the binding of the appropriate antibody (anti-VEGF-A or FGF-2) to the resulting cysteamine monolayer. For this purpose, drops of antibody solution with a volume of 2–3 µL were applied to the active sites, with concentrations appropriately selected by way of experiments, to be described in the following sections. The prepared plate was placed in an incubator for 1 h at 37 °C. After this time, the active sites of the biosensor were washed with distilled water and HBS-ES solution to remove excess unbound antibodies. The risk of non-specific adsorption was eliminated by applying a BSA solution (C = 1 mg/mL) to the surface of the biosensor and rinsing it again with distilled water. The above procedures prepared the biosensor to be capable of capturing the analytes of interest from a solution. As before, drops of the test solution with a volume of 2–3 µL were applied to the active sites of the biosensor, with the bound antibody against VEGF-A or FGF-2, accordingly. The ligand–analyte interaction time ranged from 6 to 8 min. After this time, the surface of the active sites of the biosensor was rinsed with distilled water and HBS-ES solution. Because of the low molecular weight of FGF-2, a secondary antibody with a concentration of 80 pg/mL was used to increase the analytical signal.
After the necessary time for the reaction, the biosensor surface was rinsed again with distilled water and HBS-ES solution. In the case of applying subsequent solutions, the previously bound analyte particles were removed with a glycine/HCl solution at pH = 2.40, and the active sites were rinsed with distilled water. As a result, the biosensor was again able to capture analyte molecules from the solution. The stage of construction and validation of the analytical method was carried out for each of the analytes on separate biosensors. All tests were carried out at pH = 7.40, in accordance with the recommendations of the safety data sheets for the reagents used.

2.5. Data Analysis

The device that was used for the research provides data in the form of images, which were recorded before and after the interaction of the ligand with the analyte, at a predetermined value of the SPR angle. The obtained images needed to be properly processed mathematically. ImageJ v.1.46 (NIH) and MS Excel software were used for this purpose. For each active site, a 12-site grid was drawn to allow for the reading of 12 replicates on each active site. The statistical processing of the results was performed using the PQStat Software (2022) (PQStat v.1.8.4. Poznan, Poland).

3. Results and Discussion of Biosensor Formation and Its Validation

3.1. Formation of Successive Layers of the Biosensor

The process of formation of successive layers of the biosensor was verified. For this purpose, successive layers were formed on one of the active sites of the biosensor: cysteamine, ligand (receptor), analyte, and secondary antibody for FGF-2. The obtained data were used to model the course of the SPR curves using the WinSpall software. The course of the SPR curves is shown in Figure 2.
The shifting of the minimum of the SPR curve towards increasing values of the SPR angle proves the formation of successive component layers of the biosensor. The smallest difference in angle is observed for the formation of the cysteamine monolayer, but this is due to its low molecular weight of 77.15 g/mol. In other cases, the changes range from 0.1 to 0.3 degrees.

3.2. Saturation of the Biosensor Surface with a Ligand (Receptor)

Determination of the optimal ligand (receptor) concentration is the first step in the construction of a biosensor. The biosensor was prepared for testing as described under ‘Chip preparation’. The antibody concentration values used were 1–25 ng/mL for VEGF-A and 1–60 ng/mL for FGF-2. The optimal concentrations were selected to ensure complete saturation of the biosensor surface; these were 20 ng/mL for VEGF-A and 40 ng/mL for FGF-2. The saturation curves are shown in Figure A2 in the Appendix A.

3.3. Method Calibration

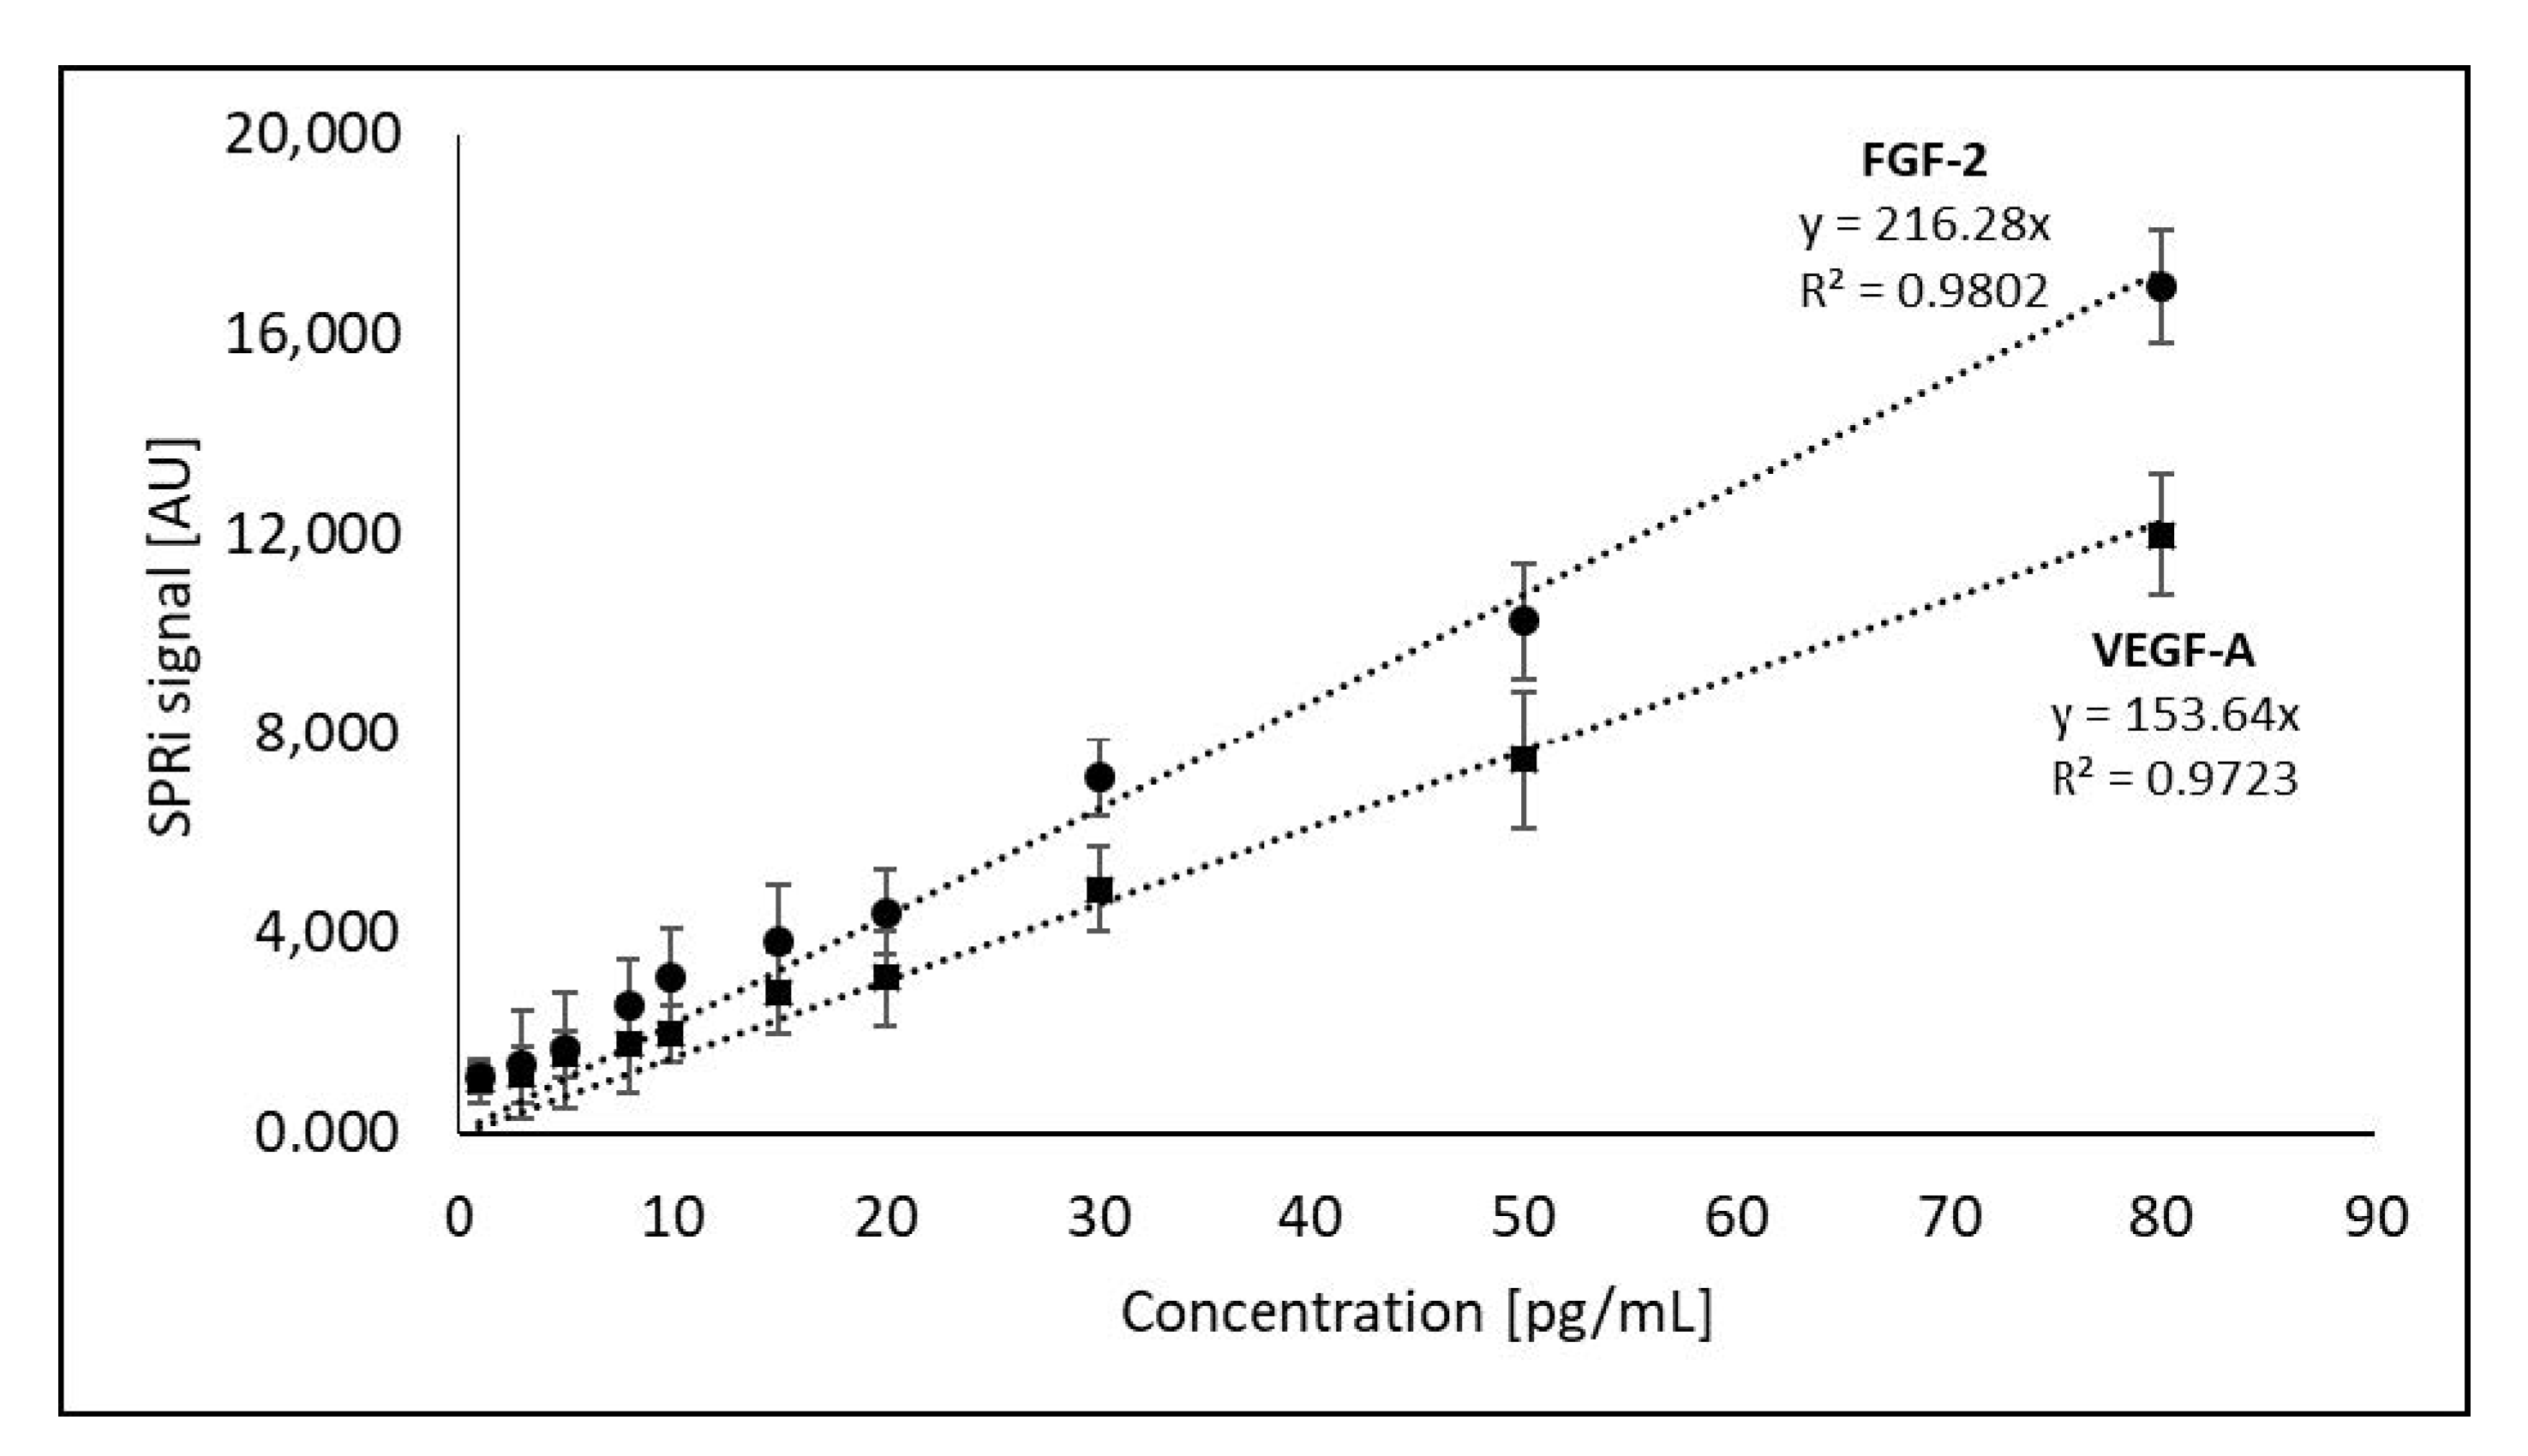
To calibrate the developed analytical method, standard solutions of VEGF-A and FGF-2 were prepared with concentrations in the range 1–80 pg/mL. The obtained calibration curves are shown in Figure 3. The rectilinear ranges of the calibration curves served as reference curves for subsequent calibrations.

3.4. Limit of detection (LOD) and Limit of Quantification (LOQ)

The LOD and LOQ were determined by measuring 10 replicates of the lowest concentration detectable by the device detector (1 pg/mL) for both proteins. Their standard deviation (SD) values were determined. LOD was taken as 3·SD and LOQ as 3·LOD. The values of the limits determined were as follows: for VEGF-A, LOD = 1.07 pg/mL, LOQ = 3.21 pg/mL; for FGF-2, LOD = 1.64 pg/mL, LOQ = 4.92 pg/mL.

3.5. Precision

To determine the consistency of the results of the measurement series for a given sample, a series of five quantitative determinations was carried out for the following concentration ranges: 4–80 pg/mL for VEGF-A and 5–80 pg/mL for FGF-2. These values were the cut-off points and midpoints of the rectilinear ranges of the calibration curves. The precision of these determinations was expressed as SD and CV. The results of the analysis are summarized in the table below (Table 2).
The low SD values suggest that the developed method is precise, regardless of the concentration of the analyte. Coefficients of variation (CV) did not exceed 12%. Their highest values were observed at concentrations close to the LOQ.

3.6. Robustness

The robustness of the method relates to the influence of slight changes in the analytical procedure on the stability of the results. Table 3 summarizes the changes in the analytical procedure and their influence on the quantification value.
Both developed analytical methods showed no robustness to elevated temperature and pH values different from 7.40. The time of sample preparation was not found to have a significant influence on the analysis result. Optimum antibody–analyte interaction times were 6 min for VEGF-A and 8 min for FGF-2.

3.7. Recovery

The recovery test consisted of adding a specific amount of the analyte (in our case, a known concentration of the standard solution, Cstandard) to a real sample. The concentration value was recorded for the sample without the addition of the analyte and for the sample with the addition of the analyte. Five repetitions of measurements were performed, and mean concentration values were determined. The concentration of the added analyte was determined from the difference in concentrations for the samples with and without the addition of the analyte. On this basis, the values of recoveries for individual measurements were calculated. Data are summarized in Table 4.
The recovery values obtained during the tests in the real matrix did not exceed 103% for both methods; therefore, both methods gave reliable measurement results.

3.8. Selectivity

Selectivity is characterized as the degree of interference of the analytical signal by other substances present in the sample (interferents). A series of [analyte: interferent] solutions in various concentration ratios was prepared. Subsequently, quantification of VEGF-A or FGF-2 was performed in the presence of potential interferents, and SD values were determined. Table A1 in the Appendix A presents detailed results for the selectivity of the analytical method.
The small values of the standard deviations, the similarity of the mean values of concentrations determined in the samples to the theoretical (real) concentrations, the fact that the recovery values did not exceed 112%, and the low CV testify to the good selectivity of the proposed method.

3.9. Repeatability

Repeatability refers to results obtained under the same analytical conditions, meaning analyte concentrations in samples determined in a given laboratory, by means of a specific analytical method and by one analyst. To determine the repeatability of the developed analytical method, using standard solutions, five repetitions of three selected analyte concentrations (CRM) were performed, and the mean value of the concentration (XC) was calculated, in addition to SD, recovery, and CV. Similarly, determinations were performed on a real sample, and XC, SD, and CV were calculated. The concentrations of the studied analytes in a sample with unknown concentrations were quantified five times. Table 5 summarizes the data obtained during these tests.
The facts that the coefficients of variation (CV) did not exceed 4%, the recovery values lay in the range 98.60–107.35, and the standard deviations were small for both methods confirm that they give reproducible results.

3.10. Comparison to ELISA

A necessary element of the verification of a newly developed analytical method is a comparison with a recognized standard method. We used commercially available ELISA tests as a standard method. These had the following LOD and LOQ parameters: for VEGF-A, LOD = 9 pg/mL, LOQ = 27 pg/mL; for FGF-2, LOD = 3 pg/mL, LOQ = 9 pg/mL. Using the newly developed method, simultaneous quantification of VEGF-A and FGF-2 was performed in the serum of children with diagnosed leukaemia (ALL type) and in the blood serum of the control group. A total of 10 samples (4 leukaemia samples [L] and 6 control samples [C]) were tested. The results were compared with those obtained with the commercial ELISA tests. The data are summarized in Table 6.
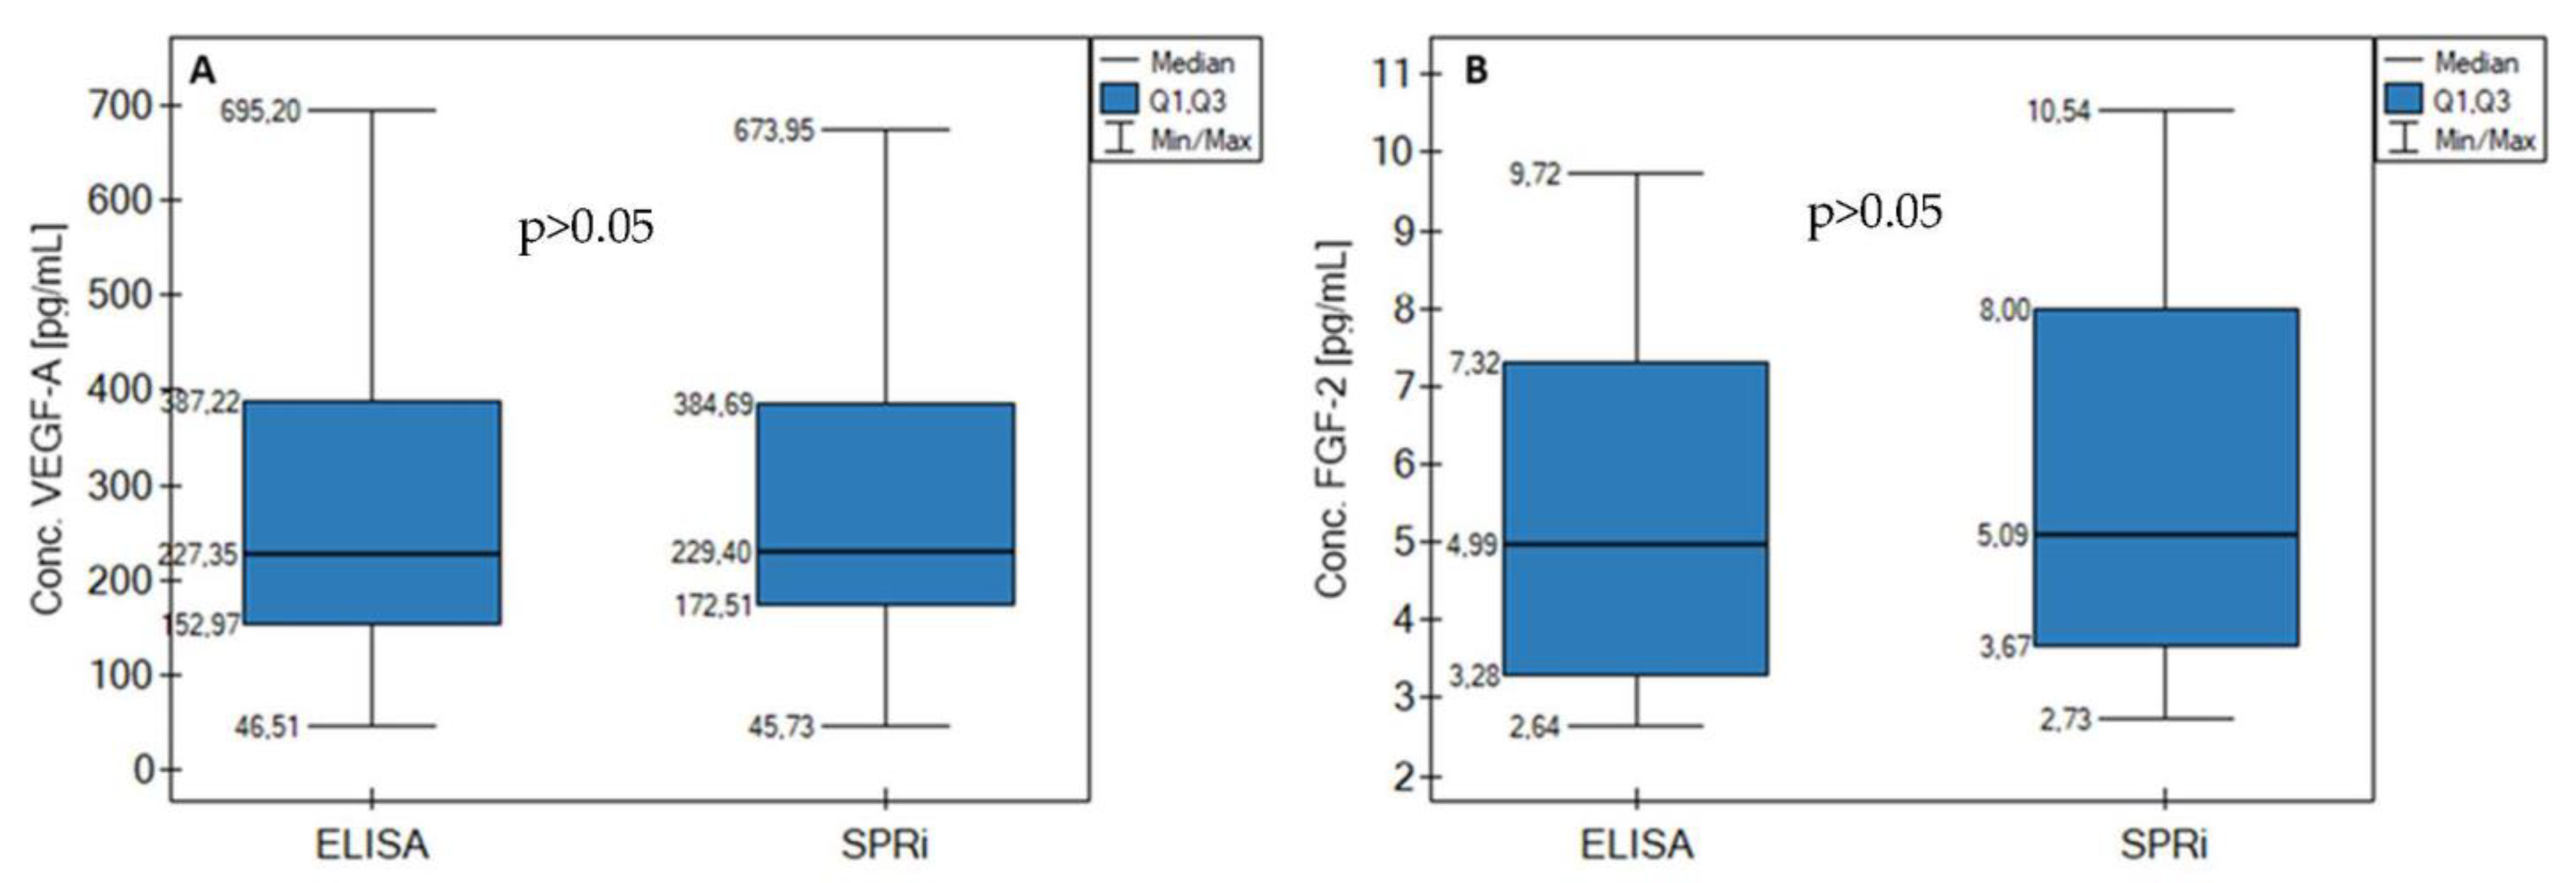
The Mann–Whitney U test was performed to characterize the differences in concentrations of the studied analytes between the developed analytical method and the ELISA test. The lack of statistical significance of the statistical test performed for the developed method in relation to the ELISA method proves the lack of significant differences between the concentrations obtained with the SPRi biosensors and ELISA. Figure A3 in the Appendix A shows graphs of the results of the Mann–Whitney U test.

4. Conclusions

A new label-free analytical method for the simultaneous determination of VEGF-A and FGF-2 in serum has been developed, based on SPRi biosensors. The formation of successive biosensor layers was confirmed by plotting SPR curves fitted to the experimental data. Shifts towards higher angle values confirmed that successive layers were formed on the surface of the biosensor. The method presented can also be applied as two separate and independent analytical methods, due to the validation and verification of each of them separately. As a result of the validation of the methods, LOD and LOQ values were determined for each of them. These values were: for VEGF-A, LOD = 1.07 pg/mL, LOQ = 3.21 pg/mL; and for FGF-2, LOD = 1.64 pg/mL, LOQ = 4.92 pg/mL. The proposed method is also precise, as evidenced by the small standard deviations of concentrations determined in samples of standard solutions of precisely known concentration and the CVs not exceeding 12%.
It has been shown that significant changes in the analytical procedure affect the stability of the results. Changes in the temperature and pH of the solutions had the greatest impact on the concentration values obtained. In the sample stored correctly, no changes in the concentration values were observed compared with a sample prepared just before the analysis. The optimal interaction time of the analyte with the ligand for the VEGF-A-sensitive biosensor was 6 min, and for the FGF-2-sensitive biosensor, it was 8 min. Above these values, no further changes in analyte concentrations were observed.
To control the accuracy and reliability of the results, recovery studies were performed. For this purpose, a known amount of standard solution of VEGF-A and FGF-2 was added to a real biological sample, namely a sample with a very complex matrix. Then, based on the difference in analyte concentrations between the samples with and without the standard addition, the added amounts of VEGF-A and FGF-2 were determined. The recovery results did not exceed 103%, which proves the high accuracy and reliability of the results obtained.
Since, as previously mentioned, biological samples have an extremely complex matrix, there is a high risk that other proteins contained in them will interfere with the correct measurement of the concentration of the protein selected by the analyst. Therefore, a necessary stage of validation was testing the selectivity of the proposed method. For this purpose, solutions of the studied analytes and the most important potential interferents, which were proteins with a similar structure and function, as well as human albumin, were prepared. The latter constitutes as much as 50% of all proteins circulating in the peripheral blood. The mean values of the concentrations were 51.52 ± 0.94 pg/mL for VEGF-A and 11.08 ± 0.67 pg/mL for FGF-2 and were close to the theoretical (real) concentrations in the samples (50.00 pg/mL VEGF-A; 10.00 pg/mL FGF-2). The recoveries and the CVs were calculated using the mean concentration values and standard deviations. The recoveries for both proteins did not exceed 112%, while the CVs ranged from 1.82% to 6.05%. The results obtained for the analytical parameters prove the high selectivity of the proposed method and suggest that the complexity of the biological sample matrix does not adversely affect the measurement result. The repeatability tests of the proposed method were based on five-fold determination of the analyte in a standard solution of precisely known concentration and in a real sample. The values of recoveries were calculated and lay in the range 98.60–107.35%, while the coefficients of variation (CV) were in the range 0.82–7.65%. The results confirm the high repeatability of the developed analytical method.
Finally, to verify the correctness and reliability of the obtained results, the results of the determinations obtained using the developed method were compared with those obtained using commercial ELISA tests. The results underwent an appropriate statistical analysis based on the Mann–Whitney U test. The lack of statistical significance (p > 0.05) of the above-mentioned test indicates the absence of differences between the median concentrations obtained with the use of the SPRi biosensor and the ELISA test. This confirms the correctness and reliability of the results obtained by means of the newly developed method.

Author Contributions

Conceptualization, L.O. and E.G.; methodology, L.O. and E.G.; validation, L.O., A.L., and B.Z.-R.; formal analysis, L.O., E.G., Z.L., and E.L.; investigation, L.O., A.L., and B.Z.-R.; resources, E.L. and M.K.-R.; data curation, L.O.; writing—original draft preparation, L.O.; writing—review and editing, E.G., Z.L., and M.K.-R.; visualization, L.O., A.L., B.Z.-R., and E.L.; supervision, E.G.; project administration, E.G. All authors have read and agreed to the published version of the manuscript.

Funding

This research was funded by the Dean of the Faculty of Chemistry at the University of Bialystok as part of a competition for small research projects.

Institutional Review Board Statement

The study was conducted in accordance with the Declaration of Helsinki and approved by the Institutional Review Board (or Ethics Committee) of the Medical University of Bialystok (protocol code APK.002.243.2022).

Informed Consent Statement

Informed consent was obtained from all subjects involved in the study.

Data Availability Statement

Not applicable.

Conflicts of Interest

The authors declare no conflict of interest.

Abbreviations

AMLacute myeloid leukaemia
CMLchronic myeloid leukaemia
HCLhairy-cell leukaemia
CLLchronic lymphocytic leukaemia
ALLlymphocytic leukaemia
MMmultiple myeloma
NHLnon-Hodgkin lymphoma
CMMLchronic myelomonocytic leukaemia
MDSmyelodysplastic syndromes
CRMCRM is the concentration of reference material obtained from standard solutions. It is not a certified reference material.
XCmean concentration of the analyte

Appendix A

Figure A1. Schematic diagram of SPRi spectrometer (A); diagram of the biosensor and analytical procedure (B).
Applsci 12 12699 g0a1
Figure A2. Graph of the saturation of the biosensor surface (A) VEGF-A and (B) FGF-2.
Applsci 12 12699 g0a2
Table A1. Details for determining the selectivity of the analytical method.
[analyte:interferent]Biomarker
Conc. theoret. VEGF-A
[pg/mL]
Conc. VEGF-A
[pg/mL]
SD [pg/mL]Conc. theoret. FGF-2
[pg/mL]
Conc. FGF-2
[pg/mL]
SD [pg/mL]
[1:1]
analyte:VEGF-R1
50.0050.650.1410.0010.980.35
[1:10]
analyte:VEGF-R1
52.050.5810.080.73
[1:100]
analyte:VEGF-R1
50.450.7010.930.65
[1:1]
analyte:VEGF-R2
52.530.6511.460.89
[1:10]
analyte:VEGF-R2
50.050.1311.540.69
[1:100]
analyte:VEGF-R2
52.780.1511.020.54
[1:1]
analyte:albumin
51.920.3611.950.53
[1:10]
analyte:albumin
52.150.2911.910.72
[1:100]
analyte:albumin
51.090.8611.820.53
[1:1]
analyte:FGF-2
50.410.18
[1:10]
analyte:FGF-2
52.300.92
[1:100]
analyte:FGF-2
51.830.70
[1:1]
analyte:VEGF-A
10.010.32
[1:10]
analyte:VEGF-A
10.840.54
[1:100]
analyte:VEGF-A
10.470.35
Caverage
[pg/mL]
VEGF-AFGF-2
51.52 ± 0.9411.08 ± 0.67
Recovery [%]103.04110.80
CV [%]1.826.05
redundant data
Figure A3. Comparison of the developed method with a commercial ELISA test.
Applsci 12 12699 g0a3

References

  1. Ribatti, D.; Vacca, A.; Presta, M. The Discovery of Angiogenic Factors: A Historical Review. Gen. Pharmacol. 2000, 35, 227–231. [Google Scholar] [CrossRef] [PubMed]
  2. Eming, S.A.; Krieg, T. Molecular Mechanisms of VEGF-A Action during Tissue Repair. J. Investig. Dermatol. Symp. Proc. 2006, 11, 79–86. [Google Scholar] [CrossRef] [PubMed] [Green Version]
  3. Li, Q.; Zhang, L.; Zhang, Z.; Wang, Y.; Zuo, C.; Bo, S. A Shorter-Bout of HIIT Is More Effective to Promote Serum BDNF and VEGF-A Levels and Improve Cognitive Function in Healthy Young Men. Front. Physiol. 2022, 13, 898603. [Google Scholar] [CrossRef] [PubMed]
  4. Yücel, Ç.; Sertoğlu, E.; Fırat Oğuz, E.; Hayran, Y.; Omma, A.; Özgürtaş, T. Serum VEGF-A and VEGFR-1 Levels in Patients with Adult Immunoglobulin A Vasculitis. Int. J. Rheum. Dis. 2021, 24, 789–794. [Google Scholar] [CrossRef]
  5. Yao, J.H.; Shao, Y.; Wang, J.J.; Li, Y.L.; Yang, H.Q.; Liu, J.; Yang, Y. Evaluation of Diagnostic and Predictive Values of the Serum VEGF-A Level and Systemic Immune-Inflammation Index in Small Cell Lung Cancer. J. Cancer 2021, 12, 1356–1364. [Google Scholar] [CrossRef]
  6. Larsson, A.; Sköldenberg, E.; Ericson, H. Serum and Plasma Levels of FGF-2 and VEGF in Healthy Blood Donors. Angiogenesis 2002, 5, 107–110. [Google Scholar] [CrossRef]
  7. Woolard, J.; Bevan, H.S.; Harper, S.J.; Bates, D.O. Molecular Diversity of VEGF-A as a Regulator of Its Biological Activity. Microcirculation 2009, 16, 572–592. [Google Scholar] [CrossRef]
  8. Badr, Z.; AL-Moosawi, W.; Ali, S. Evaluation of VEGF-A in Relation to Childhood Acute Lymphoblastic Leukemia (in Basrah/Iraq). Iraqi Natl. J. Med. 2021, 3, 39–44. [Google Scholar] [CrossRef]
  9. Delrieu, I. The High Molecular Weight Isoforms of Basic Fibroblast Growth Factor (FGF-2): An Insight into an Intracrine Mechanism. FEBS Lett. 2000, 468, 6–10. [Google Scholar] [CrossRef] [Green Version]
  10. Chen, X.; Li, Z.; Cheng, Y.; Kardami, E.; Loh, Y.P. Low and High Molecular Weight FGF-2 Have Differential Effects on Astrocyte Proliferation, but Are Both Protective against Aβ-Induced Cytotoxicity. Front. Mol. Neurosci. 2020, 12, 328. [Google Scholar] [CrossRef]
  11. Liu, X.; Zhang, T.; He, S.; Hong, B.; Chen, Z.; Peng, D.; Wu, Y.; Wen, H.; Lin, Z.; Fang, Y.; et al. Elevated Serum Levels of FGF-2, NGF and IGF-1 in Patients with Manic Episode of Bipolar Disorder. Psychiatry Res. 2014, 218, 54–60. [Google Scholar] [CrossRef] [PubMed]
  12. Shain, S.A.; Šarić, T.; Ke, L.D.; Nannen, D.; Yoas, S. Endogenous Fibroblast Growth Factor-1 or Fibroblast Growth Factor-2 Modulate Prostate Cancer Cell Proliferation. Cell Growth Differ. 1996, 7, 573–586. [Google Scholar] [PubMed]
  13. Folkman, J. Role of Angiogenesis in Tumor Growth and Metastasis. Semin. Oncol. 2002, 29, 15–18. [Google Scholar] [CrossRef] [PubMed]
  14. Perez-Atayde, A.R.; Sallan, S.E.; Tedrow, U.; Connors, S.; Allred, E.; Folkman, J. Spectrum of Tumor Angiogenesis in the Bone Marrow of Children with Acute Lymphoblastic Leukemia. Am. J. Pathol. 1997, 150, 815–821. [Google Scholar] [PubMed]
  15. Vacca, A.; Ribatti, D.; Roncali, L.; Ranieri, G.; Serio, G.; Silvestris, F.; Dammacco, F. Bone Marrow Angiogenesis and Progression in Multiple Myeloma. Br. J. Haematol. 1994, 87, 503–508. [Google Scholar] [CrossRef] [Green Version]
  16. Vacca, A.; Ribatti, D.; Presta, M.; Minischetti, M.; Iurlaro, M.; Ria, R.; Albini, A.; Bussolino, F.; Dammacco, F. Bone Marrow Neovascularization, Plasma Cell Angiogenic Potential, and Matrix Metalloproteinase-2 Secretion Parallel Progression of Human Multiple Myeloma. Blood 1999, 93, 3064–3073. [Google Scholar] [CrossRef]
  17. Aguayo, A.; Estey, E.; Kantarjian, H.; Mansouri, T.; Gidel, C.; Keating, M.; Giles, F.; Estrov, Z.; Barlogie, B.; Albitar, M. Cellular Vascular Endothelial Growth Factor Is a Predictor of Outcome in Patients with Acute Myeloid Leukemia. Blood 1999, 94, 3717–3721. [Google Scholar] [CrossRef]
  18. Bellamy, W.T. Expression of Vascular Endothelial Growth Factor and Its Receptors in Multiple Myeloma and Other Hematopoietic Malignancies. Semin. Oncol. 2001, 28, 551–559. [Google Scholar] [CrossRef]
  19. Fiedler, W.; Graeven, U.; Ergün, S.; Verago, S.; Kilic, N.; Stockschläder, M.; Hossfeld, D.K. Vascular Endothelial Growth Factor, a Possible Paracrine Growth Factor in Human Acute Myeloid Leukemia. Blood 1997, 89, 1870–1875. [Google Scholar] [CrossRef] [Green Version]
  20. Ratajczak, M.Z.; Ratajczak, J.; Machalinski, B.; Majka, M.; Marlicz, W.; Carter, A.; Pietrzkowski, Z.; Gewirtz, A.M. Role of Vascular Endothelial Growth Factor (VEGF) and Placenta-Derived Growth Factor (PlGF) in Regulating Human Haemopoietic Cell Growth. Br. J. Haematol. 1998, 103, 969–979. [Google Scholar] [CrossRef]
  21. Kim, J.G.; Sohn, S.K.; Kim, D.H.; Baek, J.H.; Lee, N.Y.; Suh, J.S.; Chae, S.C.; Lee, K.S.; Lee, K.B. Clinical Implications of Angiogenic Factors in Patients with Acute or Chronic Leukemia: Hepatocyte Growth Factor Levels Have Prognostic Impact, Especially in Patients with Acute Myeloid Leukemia. Leuk. Lymphoma 2005, 46, 885–891. [Google Scholar] [PubMed]
  22. Aguayo, A.; Kantarjian, H.; Manshouri, T.; Gidel, C.; Estey, E.; Thomas, D.; Koller, C.; Estrov, Z.; O’Brien, S.; Keating, M.; et al. Angiogenesis in Acute and Chronic Leukemias and Myelodysplastic Syndromes. Blood 2000, 96, 2240–2245. [Google Scholar] [CrossRef] [PubMed]
  23. Di Raimondo, F.; Azzaro, M.P.; Palumbo, G.A.; Bagnato, S.; Giustolisi, G.; Floridia, P.M.; Sortino, G.; Giustolisi, R. Angiogenic Factors in Multiple Myeloma: Higher Levels in Bone Marrow than in Peripheral Blood. Haematologica 2000, 85, 800–805. [Google Scholar] [PubMed]
  24. Salven, P.; Orpana, A.; Teerenhovi, L.; Joensuu, H. Simultaneous Elevation in the Serum Concentrations of the Angiogenic Growth Factors VEGF and BFGF Is an Independent Predictor of Poor Prognosis in Non-Hodgkin Lymphoma: A Single-Institution Study of 200 Patients. Blood 2000, 96, 3712–3718. [Google Scholar] [CrossRef]
  25. Aziz, K.A.; Till, K.J.; Chen, H.; Slupsky, J.R.; Campbell, F.; Cawley, J.C.; Zuzel, M. The Role of Autocrine FGF-2 in the Distinctive Bone Marrow Fibrosis of Hairy-Cell Leukemia (HCL). Blood 2003, 102, 1051–1056. [Google Scholar] [CrossRef] [PubMed] [Green Version]
  26. Krejčí, P.; Dvořáková, D.; Krahulcová, E.; Pacherník, J.; Mayer, J.; Hampl, A.; Dvořák, P. FGF-2 Abnormalities in B Cell Chronic Lymphocytic and Chronic Myeloid Leukemias. Leukemia 2001, 15, 228–237. [Google Scholar] [CrossRef] [PubMed] [Green Version]
  27. Wang, D.; Loo, J.F.C.; Chen, J.; Yam, Y.; Chen, S.C.; He, H.; Kong, S.K.; Ho, H.P. Recent Advances in Surface Plasmon Resonance Imaging Sensors. Sensors 2019, 19, 1266. [Google Scholar] [CrossRef] [Green Version]
  28. Huang, Y.H.; Ho, H.P.; Kong, S.K.; Kabashin, A. V Phase-Sensitive Surface Plasmon Resonance Biosensors: Methodology, Instrumentation and Applications. Ann. Phys. 2012, 524, 637–662. [Google Scholar] [CrossRef]
  29. Szymanska, B.; Lukaszewski, Z.; Hermanowicz-Szamatowicz, K.; Gorodkiewicz, E. An Immunosensor for the Determination of Carcinoembryonic Antigen by Surface Plasmon Resonance Imaging. Anal. Biochem. 2020, 609, 113964. [Google Scholar] [CrossRef]
  30. Szymanska, B.; Lukaszewski, Z.; Zelazowska-Rutkowska, B.; Hermanowicz-Szamatowicz, K.; Gorodkiewicz, E. An Spri Biosensor for Determination of the Ovarian Cancer Marker He4 in Human Plasma. Sensors 2021, 21, 3567. [Google Scholar] [CrossRef]
  31. Szymańska, B.; Lukaszewski, Z.; Hermanowicz-Szamatowicz, K.; Gorodkiewicz, E. A Biosensor for Determination of the Circulating Biomarker CA125/MUC16 by Surface Plasmon Resonance Imaging. Talanta 2020, 206, 120187. [Google Scholar] [CrossRef] [PubMed]
  32. Gorodkiewicz, E.; Sankiewicz, A.; Laudański, P. Surface Plasmon Resonance Imaging Biosensors for Aromatase Based on a Potent Inhibitor and a Specific Antibody: Sensor Development and Application for Biological Material. Cent. Eur. J. Chem. 2014, 12, 557–567. [Google Scholar] [CrossRef]
  33. Gorodkiewicz, E.; Charkiewicz, R.; Rakowska, A.; Bajko, P.; Chyczewski, L.; Niklinski, J. SPR Imaging Biosensor for Podoplanin: Sensor Development and Application to Biological Materials. Microchim. Acta 2012, 176, 337–343. [Google Scholar] [CrossRef]
  34. Gorodkiewicz, E.; Lukaszewski, Z. Recent Progress in Surface Plasmon Resonance Biosensors (2016 to Mid-2018). Biosensors 2018, 8, 132. [Google Scholar] [CrossRef] [PubMed]
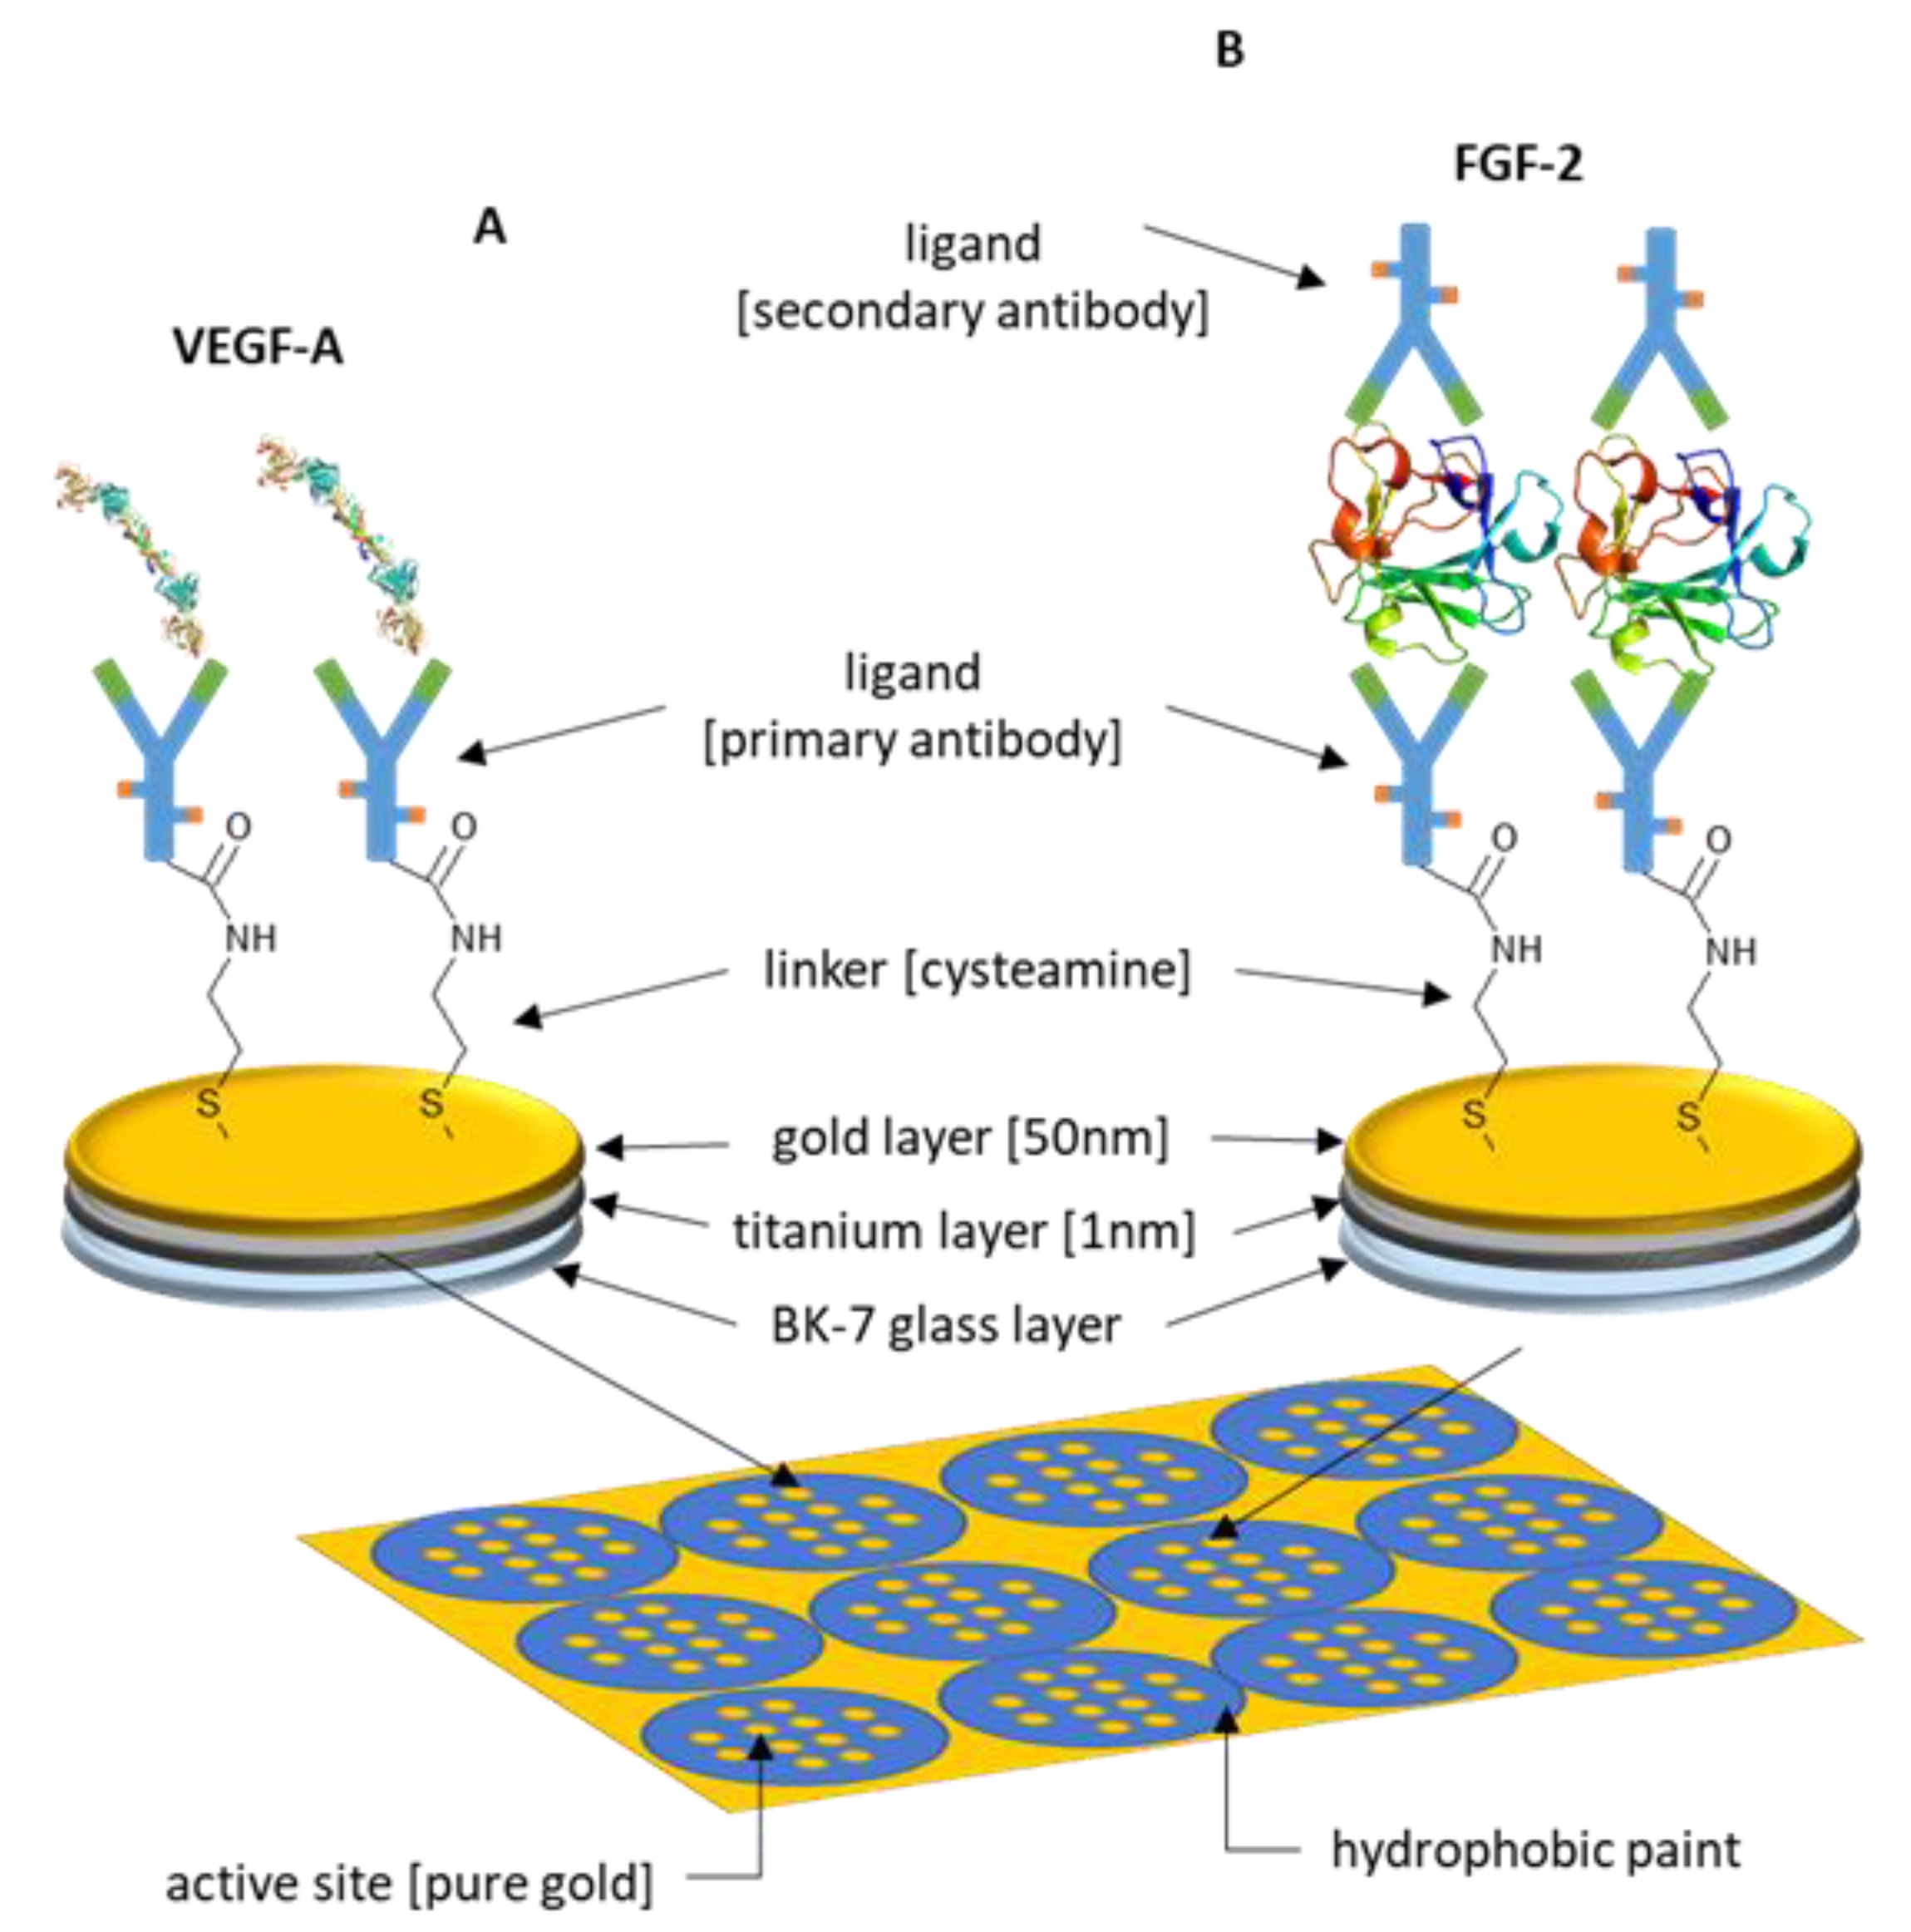
Figure 1. Diagram of the biosensor: (A) sensitive to VEGF-A and (B) sensitive to FGF-2.
Applsci 12 12699 g001
Figure 2. The course of model SPR (A) VEGF-A and (B) FGF-2 curves.
Applsci 12 12699 g002
Figure 3. VEGF-A and FGF-2 calibration curves.
Applsci 12 12699 g003
Table 1. Abnormalities in levels of VEGF-A and FGF-2 in haematological tumours.
BiomarkerDescriptionRef.
VEGF-AElevated levels in AML patients, worse overall prognosis.[17]
Secretion by all 12 cell lines representing the lymphoma, leukaemia, and multiple myeloma phenotypes.[18]
Increased expression in blast cells (20 out of 28 patients) with newly diagnosed AML.[19]
Secretion into the culture medium in leukaemia cell lines and cultured bone marrow cells from CML patients.[20]
Elevated levels in haematological cancers, such as MM, NHL, CML, CLL, CMML, MDS, and AML.[21,22,23,24]
FGF-2Increased mRNA expression in half of the 12 cell lines tested representing the phenotypes of lymphoma, leukaemia, and multiple myeloma.[18]
Elevated levels of FGF-2 in HCL correlated with elevated levels of fibronectin.[25]
Elevated levels of FGF-2 in CLL from B lymphocytes and increased levels of FGF-2 in CML.[26]
Increased FGF-2 levels in ALL and increased bone marrow microvessel density.[22]
Table 2. Precision of the developed analytical method.
ParameterBiomarker
VEGF-AFGF-2
CRM [pg/mL]CRM [pg/mL]
42050805205080
XC [pg/mL]3.9421.3652.0880.404.9722.7053.6080.07
SD0.471.192.360.800.521.741.750.87
CV [%]11.95.64.51.010.57.63.31.1
Table 3. Effect of changes in the analytical procedure on the quantification result.
Change in Analytical ProcedureDescription of the Change in the Analytical ProcedureBiomarker
VEGF-AFGF-2
XC
[pg/mL]
SD
[pg/mL]
XC
[pg/mL]
SD
[pg/mL]
-Real sample
(prepared earlier on the day of analysis)
45.740.825.670.84
T↑sample heated in an incubator for 2 h (40 °C)31.610.543.82 (<LOQ)0.39
T↓sample chilled in the refrigerator for 2 h (4 °C)44.750.295.721.05
pH < 7.40pH = 4.9938.070.983.02 (<LOQ)0.72
pH > 7.40pH = 9.5029.060.443.15 (<LOQ)0.47
shot and gunsample prepared immediately before the analysis45.300.715.650.53
Analysis time (interaction between ligand and analyte)30 s22.470.22<LOD-
2 min37.210.87<LOD-
6 min46.120.764.970.19
8 min45.090.695.630.46
T↑ - temperature increase; T↓ - temperature lowering
Table 4. Recovery test.
ParameterBiomarker
VEGF-AFGF-2
Creal sample [pg/mL]45.625.75
Cstandard [pg/mL]100.0010.00
Cquantified [pg/mL]147.3216.03
Cadd *
[pg/mL]
101.710.28
Recovery [%]101.7102.8
* Cquantified–Creal sample.
Table 5. Repeatability data.
ParameterBiomarker
VEGF-AFGF-2
CRM [pg/mL]Real SampleCRM [pg/mL]Real Sample
20305052050
XC [pg/mL]21.4730.6251.1945.734.9319.8851.465.62
SD [pg/mL]0.510.390.420.810.160.620.550.43
Recovery [%]107.35102.07102.98-98.6099.40102.92-
CV [%]2.381.270.821.773.253.121.077.65
Table 6. Comparison of concentration values obtained with the developed biosensor and with the ELISA test.
SampleBiomarker
VEGF-AFGF-2
SPRi Biosensor
[pg/mL]
ELISA
[pg/mL]
SPRi Biosensor
[pg/mL]
ELISA
[pg/mL]
L1673.95695.209.028.77
L2387.54394.126.156.09
L3376.12366.508.627.73
L4445.29434.3110.549.72
C1234.59227.353.453.23
C245.7346.515.295.67
C3135.71134.404.894.30
C4192.23174.523.963.43
C5165.93145.783.573.11
C6224.21227.352.732.64
Publisher’s Note: MDPI stays neutral with regard to jurisdictional claims in published maps and institutional affiliations.