Abstract
Atherosclerosis is a multifactorial disease that affects large arteries and causes much morbidity and mortality worldwide. Despite ongoing research for several decades, it is still a global health problem that cannot be stopped and cured completely. Furthermore, the development of this disease is contributed to by various processes, primarily disturbances in cholesterol metabolism, local low-grade inflammation, and oxidative stress, resulting in the formation of atherosclerotic plaques. In this work, a stochastic Petri net model was constructed and subsequently analyzed to examine the impact of these factors on the development and progression of atherosclerosis. The use of knockout- and simulation-based analysis allowed for a comprehensive investigation of the studied phenomena. Our research has demonstrated that while cholesterol is a contributing factor in atherosclerosis, blocking its impact alone is insufficient in halting the progression of this disorder. Inhibition of oxidative stress is also important when blocking the impact of phosphoprotein phosphatase inhibitor-1 (PPI-1), microsomal triglyceride transfer protein (MTTP), and 3-hydroxy-3-methyl-glutaryl coenzyme A reductase (HMGCR), as our model shows that this action reduces the number of foam cells underlying atherosclerosis. The results obtained further support the previous observations that the combined treatment is significantly effective in enhancing therapeutic efficacy against atherosclerosis.
1. Introduction
1.1. Cholesterol Significance
Cholesterol is steroid alcohol, an essential molecule that exerts pleiotropic actions, playing many essential functions in the human body. It is present in tissues and plasma, free or combined with a long-chain fatty acid to form a cholesterol ester. Both of these forms are transported in lipoproteins. As an amphipathic lipid, it is a key element in the structure of cell membranes and the outer layer of lipoproteins. Its presence allows for the maintenance of appropriate permeability and fluidity of cell membranes. Moreover, cholesterol is a precursor to all other steroids in the body, including sex hormones (estradiol, progesterone, androsterone, and testosterone), as well as adrenocortical hormones (aldosterone and cortisone), vitamin D, and bile acids [1,2]. Therefore, cells must receive a constant supply of cholesterol to function properly. This process is regulated via complex biosynthesis and transport mechanisms (see [3]). In the evolution of mammals, complex regulatory pathways maintaining cholesterol homeostasis and providing adequate cholesterol levels when needed have been created. However, it is known that too much cholesterol in the body can be toxic to the cells; therefore, the machinery regulating its level must be able to stop cholesterol synthesis and, along with excess sterols, quickly increase its outflow. Dysregulation of cholesterol homeostasis contributes to the emergence of various disease states, including atherosclerosis [4]. This is a life-threatening phenomenon that, together with local low-grade inflammatory processes and oxidative stress, contributes to endothelial damage [5], leading to the formation of atherosclerotic plaques and, consequently, an increased risk of cardiac events.
The cholesterol concentration in the cell results from the balance between its synthesis, delivery, removal, and esterification. Esterification is used by the body for cholesterol storage (in droplets) and transfer (in lipoproteins) and serves to avoid toxicity because, contrary to free cholesterol, esters are not toxic [6].
Cholesterol is synthesized in many tissues. Still, the liver, intestine, adrenal cortex, and reproductive tissues (ovaries or testis and placenta) significantly affect the body’s cholesterol pool. All the atoms of carbon in cholesterol are derived from acetyl-coenzyme A (acetyl-CoA), and the nicotinamide adenine dinucleotide phosphate (NADPH) reduced form provides the reducing equivalents. The cholesterol synthesis depends on the hydrolysis of the acetyl-CoA’s high-energy thioester bond and the powerful adenosine triphosphate (ATP) anhydride bond.
Cholesterol supply is directed to cellular demand. De novo cholesterol production is energetically expensive for the cell; therefore, obtaining finished cholesterol through lipoprotein uptake is the best option. Cholesterol synthesis is intended to supplement the exogenous supply based on demand. Hence, production decreases when the supply of exogenous cholesterol is adequate and increases when there is an increased demand for it. Since excessive cholesterol harms the cells, complex mechanisms have developed to regulate cholesterol levels via strict negative feedback mechanisms.
1.2. HMG-CoA and Mevalonate Synthesis
Initially, two acetyl-CoA molecules react in a reaction catalyzed by the cytosolic thiolase enzyme. As a result, acetoacetyl-CoA and free coenzyme A are formed.
Next, 3-hydroxy-3-methylglutaryl coenzyme A (HMG-CoA) is formed in the reaction of condensation between acetoacetyl-CoA and acetyl-CoA catalyzed by HMG-CoA synthase. This reaction takes place in the cytosol.
Then, in the smooth endoplasmic reticulum (SER), mevalonate is formed in a reaction catalyzed by an integral protein of the endoplasmic reticulum membrane—HMG-CoA reductase (HMGCR).
The carboxyl group of HMG in ester linkage to the thiol of CoA is first reduced to an aldehyde and then to an alcohol. Two NADPH molecules act here as reductants. At the same time, CoA is released, making this reaction irreversible.
1.3. Cholesterol Synthesis
Cholesterol synthesis requires cytosolic enzymes, SER, and peroxisomes. It starts from acetyl-CoA and takes place in the following successive steps (see Figure 1): (1) mevalonate is converted in two steps to 5-pyrophosphomevalonate (mevalonate 5-pyrophosphate) using ATP; (2) the five-carbon isoprene unit isopentyl pyrophosphate (IPP) is formed by the decarboxylation of 5-pyrophosphomevalonate (a process requiring ATP); (3) IPP is isomerized to 3,3-dimethylallyl pyrophosphate (DPP); (4) IPP and DPP condense and form 10-carbon geranyl pyrophosphate (GPP); (5) GPP can re-condense with an IPP molecule to create 15-carbon farnesyl pyrophosphate (FPP); (6) two FPPs combine to release pyrophosphate and are reduced forming squalene (a 30-carbon isoprenoid); and (7) squalene is then converted to lanosterol in two successive reactions catalyzed by the SER related enzyme using NADPH and oxygen. Linear squalene hydroxylation cyclizes this structure to lanosterol; followed by (8) conversion of lanosterol to cholesterol through many reactions of chain shortening, oxidative cleavage of methyl groups, reduction of double bonds, and repositioning these bonds.
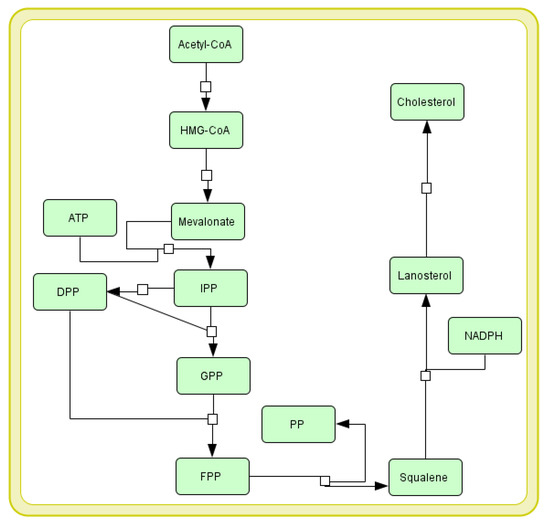
Figure 1.
Cholesterol biosynthesis pathway presented in Systems Biology Graphical Notation (SBGN) [7]. See Section 1.3 for more details. The explanation of abbreviations used in the diagram: HMG-CoA—3-hydroxy-3-methyl-glutaryl coenzyme A; ATP—adenosine triphosphate; IPP—isopentyl pyrophosphate; DPP—3,3-dimethylallyl pyrophosphate; GPP—geranyl pyrophosphate; FPP—farnesyl pyrophosphate; PP—pyrophosphate; NADPH—nicotinamide adenine dinucleotide phosphate.
1.4. Cholesterol Transport
The primary cholesterol transporter from the liver to other organs (kidneys, muscles, and adrenal cortex) is low-density lipoprotein (LDL), containing most plasma cholesterol. LDL particles, formed from very low-density lipoproteins (VLDL), retain apoB-100, but lose other apolipoproteins to HDL and contain fewer triglycerides (TAG) than VLDL, but more cholesterol esters (CE) and cholesterol. LDL particles function by depositing free cholesterol on the surface of cell membranes or by binding to a membrane receptor that recognizes apolipoprotein B-100 (apoB-100) [8].
Cholesterol is transported in the plasma mostly as cholesteryl esters associated with lipoproteins. Cholesterol from the diet is transported within chylomicrons (CM) from the small intestine to the liver. Cholesterol synthesized de novo and any dietary cholesterol in the liver exceeding the hepatic demand is transported in the serum within LDL particles. The liver synthesizes VLDL, which is then converted to LDL by endothelial lipoprotein lipase. Cholesterol in plasma membranes can be extracted by HDL and esterified by the HDL-linked LCAT enzyme. Cholesterol extracted from peripheral tissues by HDL can then be transferred to VLDL and LDL by LCAT—the HDL-associated protein that transfers cholesterol esters. Reverse cholesterol transport allows peripheral cholesterol to return to the liver in LDL. Finally, cholesterol is excreted in the bile as free cholesterol or bile salts after being converted to bile acids in the liver.
Three mechanisms counteract the accumulation of cholesterol in the cell:
- Cholesterol derived from the remnants of CM, HDL, and LDL particles inhibits the synthesis of endogenous cholesterol through the concentration and activity of HMG-CoA;
- Excess cholesterol exceeding the current metabolic needs of the cell causes it to be esterified by acyl-CoA: cholesterol acyltransferase (ACAT). The activity of this enzyme increases with increasing cholesterol content inside the cell. The ACAT transfers a fatty acid residue from the acyl-CoA to the -OH group of cholesterol, forming a cholesterol ester that can be stored in the cell.
- High cholesterol content in the cell causes a decrease in the synthesis of the LDL receptor (LDL-R) by reducing the transcription of the corresponding gene. This helps to reduce the uptake of LDL-C into the cell.
1.5. Regulation of Cholesterol Synthesis
There are many ways cholesterol synthesis can be regulated, including coordinate transcriptional control [9] of enzymes and targeted miRNA degradation of the enzymes. Review articles on microRNAs regulating cholesterol metabolism homeostasis can be found in [10,11]. In this study, we have focused on the main control point of cholesterol biosynthesis: the reaction catalyzed by HMGCR.
Cholesterol levels are regulated dynamically. This regulation depends on the following factors:
- (a)
- Expression of the sterol-dependent gene, such as sterol-regulatory element-binding protein (SREBP-2). When there is a low cholesterol level, the reductase gene is upregulated by a mechanism involving the transcription factor SREBP-2 protein [12]. The combination of SREBP-2 in response to the DNA’s sterol regulatory element (SRE) leads to an increase in enzyme levels and, thus, to enhanced cholesterol synthesis;
- (b)
- Degradation of the enzyme intensified by sterols (if the concentration of sterols in the SER is high—the reductase is transferred to the cytosol and undergoes ubiquitination and degradation in proteasomes);
- (c)
- Covalent modification catalyzed by AMP-activated protein kinase (AMPK), an enzyme sensitive to the AMP: ATP ratio, and protein phosphatase; a phosphorylated form of AMPK, converts HMGCR to its phosphorylated and inactive form, whereas HMGCR phosphatase reverses this process and produces a dephosphorylated and an active form of HMGCR;
- (d)
- HMGCR activity hormonal control via phosphorylation-dephosphorylation mechanisms —on the one hand, an increase in insulin concentration or in thyroid hormones promotes reductase dephosphorylation (activation). On the other hand, an increase in glucagon, epinephrine, or glucocorticosteroid concentration causes the opposite effect. Moreover, HMGCR can be ubiquitylated by the intermediates of mevalonate and cholesterol derivatives, such as lanosterol, 24,25-dihydro-lanosterol, and 25- and 27-hydroxycholesterol;
- (e)
- Drugs inhibiting selected pathways (statins) are structural HMG-CoA analogs; they are reversible and competitive inhibitors of HMGCR.
1.6. Cholesterol Degradation
The ring structure of human cholesterol cannot be metabolized into carbon monoxide IV and water. It is therefore cleared from the body by conversion to bile acids and bile salts, a small percentage of which is excreted in the feces and into the bile.
Bile acid synthesis is one of the key ways to remove excess cholesterol; however, this method may not compensate for the excessive supply of cholesterol in the diet. In addition to dissolving cholesterol, bile acids are important for fat-soluble vitamins and other essential nutrients, promoting their delivery to the liver. Synthesis of the full complement of bile acids requires 17 individual enzymes and occurs in many intracellular compartments. The genes encoding several bile acid synthesis enzymes are under tight regulatory control to coordinate bile acid production to changing metabolic conditions. Since many bile acid metabolites are cytotoxic, their synthesis should be carefully controlled.
Intestinal bacteria, before excretion, modify some of the cholesterol in the intestine. The main compounds produced are the coprostanol and cholestanol isomers.
1.7. Cholesterol and Atherosclerosis
Since atherosclerosis is an immuno-metabolic disorder involving chronic inflammation, oxidative stress, epigenetics, metabolic dysfunction, neovascularization, vascular proliferation, apoptosis, matrix degradation, and thrombosis, atherosclerotic plaque formation involves many metabolic pathways.
The process of atherosclerotic plaque formation begins with the recruitment of monocytes. They are taken up and migrate across the endothelium by selectins, mainly P-selectin [13]. By binding integrins to the vascular cell adhesion molecule (VCAM-1) and the intercellular adhesion molecule (ICAM-1) in the endothelium, monocytes remain firmly attached to the endothelium. additionally, while rolling over the endothelial cells, chemokines derived from the endothelium, mostly CXCL1, CXCL2, CXCL4, and CCL5, activate monocytes [14]. The monocytes then migrate to the internal space; previously secreted chemokines maintain this process in response to signals that promote the inflammatory process. Monocyte chemoattractant protein-1 (MCP-1), produced mostly by endothelium, monocytes, macrophages, and smooth muscle cells, is the most involved in monocyte recruitment and transmigration [15]. Its expression increases after a pro-inflammatory stimulus or tissue damage [16,17].
In the intima, depending on the microenvironment’s nature, monocytes differentiate into macrophages with pro-inflammatory (M1) or anti-inflammatory (M2) phenotypes [18,19]. M1 macrophages secrete inflammatory cytokines, chemokines, nitric oxide (NO), and reactive oxygen species (ROS), promote monocyte recruitment, and propagate inflammation. Additionally, macrophages are responsible for mediating both modified and unmodified LDL particles internalization.
Lipoproteins retained in the intima are susceptible to modification, mostly oxidation, due to the inflammatory environment, which allows them to be internalized by the scavenger receptors CD36, type A scavenger receptor 1 (SRA-1), and low-density lipoprotein receptor-1 (LOX-1) [20]. It should be emphasized that the expression of these receptors does not depend on cholesterol uptake. Hence, in the atherosclerotic plaque, where oxidized LDL (oxLDL) concentration is greatly increased, cells internalize more significant oxLDL amounts [21]. In cells, oxLDL is broken down in lysosomes, and ACAT esterifies lipoprotein cholesterol in the ER. Hydrolysis of cholesterol esters stored as droplets generates free cholesterol, which is transferred from macrophages into apoA1 or HDL particles. This process is mediated by the ATP-binding cassettes A1 (ABCA1) and G1 (ABCG1) and type B scavenger receptor 1 (SR-B1), cholesterol transporters that play an essential role in mediating the efflux of cholesterol from cells and preventing the formation of foam cells [22].
The microenvironment of pro-inflammatory atherosclerotic lesions impairs the ABCA1 efflux system in M1 and M2 macrophages, favoring foam cell accumulation.
Additionally, hyper uptake of lipids by macrophages sustains the inflammatory response, and oxLDL induce signaling cascades that activate NF-kB targets, promoting endothelial activation, monocytes recruitment, and formation of foam cells [23].
The differentiation of monocytes into macrophages enhances foam cell formations and enlarges the atherosclerotic lesion [24]. The accumulation of cholesterol in the subendothelial compartment promotes, inside and outside the cells, the cholesterol crystals formation and contributes to the development of atherosclerotic plaque. The plaque cholesterol crystals activate the NLRP3 inflammasome in macrophages, promoting proinflammatory pathways [25]. Although NLRP3 activation and assembly are not completely understood, its activation is known to lead to the activation of caspase-1, which cleaves the pro-inflammatory cytokine family interleukin 1 (IL-1) into their bioactive forms, contributing to inflammation, see [26]. CD36 receptor-mediated oxLDL uptake is believed to be responsible for NLRP3 activation. The CD36 receptor and toll-like receptors (TLR4-TLR6) capture oxLDL, resulting in intracellular cholesterol crystals [27].
Additionally, vascular smooth muscle cells (VSMC), see [28], present in the intima, can internalize oxLDL independently of scavenger receptors. Notably, at least 50% of the foam cells in human coronary intima are derived from VSMCs rather than monocytes, underlying the role of VSMCs in the propagation of atherosclerosis. miRNAs regulate VMSC proliferation and are also related to endothelial dysfunction [20,29]. One way miRNAs affect endothelial dysfunction is through their role in exacerbating endothelial cell senescence, a cellular condition that has been implicated as making atherogenesis more likely. Several miRNAs, including miR-34a, miR-217, and miR-146a, have been associated with regulating mechanisms involved in endothelial dysfunction; for a better review, see [30].
One of the key miRNAs involved in lipid phagocytosis is miR-33, downregulating key transcription effectors and activators, reducing phagocytosis and lysosomal activity in macrophages. In addition, miR-33 also targets ABCA1, which reduces lipid residues’ metabolism and cholesterol efflux from macrophages, potentially affecting the growth of atherosclerotic plaques [31,32].
The mentioned complexity is the answer to why it has not been possible to treat atherosclerosis effectively so far. This is a crucial issue since CVD is still the number one cause of death worldwide.
It is well recognized that plasma cholesterol concentration increases the risk of a cardiovascular (CV) event, especially on cumulative prior exposure to LDL-C [33]. Therefore, elevated LDL-C levels are considered the main therapeutic target. Statins competitively inhibiting HMGCR have been developed to lower plasma LDL-C levels and reduce the risk of CV events. Many clinical trials have shown that statins can reduce the number of new adverse CV events and CV mortality by 35%. It turns out, however, that even aggressive statin therapy cannot wholly eliminate CV risk. Approximately 65% of statin patients continue to experience adverse cardiovascular events. Hence, additional therapeutic interventions besides statins are needed to reduce CV risk.
The scheme of the crucial metabolic pathways of the cholesterol involvement in atherosclerosis development is shown in (see Figure 2).
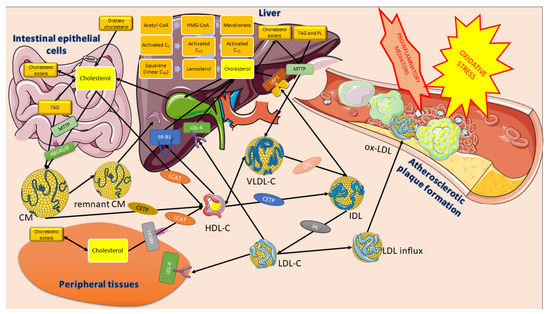
Figure 2.
The role of cholesterol in atherosclerotic plaque formation. Parts of the figure were created using images from Servier Medical Art. Servier Medical Art by Servier is licensed under a Creative Commons Attribution 3.0 Unported License accessed on 2 April 2023 (https://creativecommons.org/licenses/by/3.0/).
1.8. Aim of the Study
Based on regulating cholesterol homeostasis, many interventions have been developed to lower cholesterol by inhibiting its biosynthesis and uptake or increasing its utilization and excretion. Using a systems approach to better understand this phenomenon seems to be one of the important options more and more often considered in the search for new therapeutic strategies.
Using simulation-based analyses of the created cholesterol metabolism model, our study aimed to check how the system behaves in the face of the proposed scenarios where critical issues have been considered. For this purpose, the following scenarios have been created and analyzed:
Scenario 1: Targeting of the lipid metabolism process: (1A) Inhibition of HMGCR activity, (1B) inhibition of oxidative stress together with HMGCR activity, and (1C) modulating the activity of phosphoprotein phosphatase inhibitor-1 (PPI-1); Scenario 2: Targeting microsomal triglyceride transfer protein (MTTP); Scenario 3: Modulating reverse cholesterol transport; and Scenario 4: Modulating the activity of the apical sodium-dependent bile acid transporter (ASBT).
2. Materials and Methods
2.1. Petri Nets and Stochastic Petri Nets
Among various methods used for modeling and simulating biological systems are those based on Petri nets. These nets are mathematical objects with a directed weighted bipartite graph structure. In other words, they consist of two disjoint subsets of vertices connected by arcs in such a way that an arc cannot connect vertices from the same subset. In the case of Petri nets, vertices belonging to one of the subsets are called places, while those being elements of the other subset are transitions. The former usually represent passive components of the modeled system (e.g., chemical compounds), while the latter are counterparts of its active components (e.g., chemical reactions or other elementary processes). Arcs represent causal relationships between components of these two types. Moreover, there is another type of element of Petri nets, i.e., tokens. They are located in places and can flow between places via transitions. The flow of tokens represents a flow of substances, signals, information, etc., in the modeled system. A distribution of tokens in places is called a marking and represents a current state of the system modeled by the net [34,35].
A Petri net is a mathematical object formally defined in the following way. It is 5-tuple , where: denotes a finite set of places, denotes a finite set of transitions, denotes a set of arcs, denotes a weight function, and is an initial marking, [36].
Petri nets have a graphical representation, which is intuitive and thus very helpful in understanding the structure of the model. Places are represented as circles, transitions as rectangles or bars, and arcs as arrows. Tokens, on the other hand, are either dots or integer numbers located in places. Even though the graphical representation is intuitive, it is not well-suited for a formal net analysis. For this purpose, another representation is used, called an incidence matrix. In such a matrix A, rows correspond to places while columns correspond to transitions. Element of matrix A (being an integer number) is equal to a difference between the numbers of tokens present in place after and before firing transition [35,37].
Based on matrix A, t-invariants can be calculated. Such an invariant is vector , so equation is satisfied. While transitions correspond to elementary processes in the modeled system, t-invariants are counterparts of more complex subprocesses. For every t-invariant there is a set of transitions which is called a support of this t-invariant. Elements of support of t-invariant x are those transitions that correspond to positive entries in vector x, i.e., . When every transition from fires times, then the distribution of tokens in places remains unchanged. It means that subprocesses corresponding to t-invariants do not change the state of the analyzed system. This makes t-invariants a basis of various methods of analysis of Petri-net-based models of biological systems [35,37].
These invariants are a basis for grouping transitions into some sets corresponding to functional blocks of the modeled system. The sets are called Maximal Common Transition sets (MCT sets), and each of them contains transitions that belong to the supports of exactly the same t-invariants [37,38].
Petri nets are suitable for designing qualitative models, i.e., the ones where the modeled system’s structure is mainly described. In many cases, such models are very helpful in the analysis of the properties of the system. However, sometimes they are insufficient, and some quantitative aspects of the system should be considered. It is possible since there are many extensions of Petri nets, which allow for including quantitative properties of various types into the model [34,35]. Among such properties are those related to time dependencies existing in the modeled system. They can be described using time Petri nets or stochastic Petri nets. In this paper, the latter will be used.
A stochastic Petri net is an extension of a classical Petri net (i.e., the one described above), which possesses all the properties of the latter. In this extension, probabilistic firing rates are associated with each transition. Formally, a stochastic Petri net is 6-tuple , where have the same meanings as in a classical Petri net, while is a vector of marking dependent firing rates, which are associated with every transition [39]. Transition firing times are exponentially distributed, and the distribution of random variable of transition firing time is described by [40]. In Figure 3, a simple diagram is given, summarizing all the steps from model creation to the results.
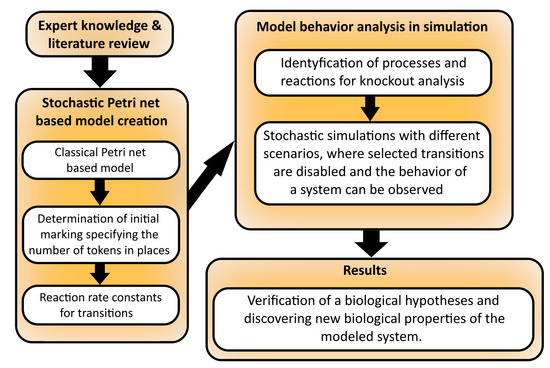
Figure 3.
The comprehensive operational framework outlines the necessary procedures for constructing a model based on stochastic Petri nets, conducting an analysis of the model, and obtaining the desired outcomes.
In a stochastic Petri net, the firing of transitions follows mass-action kinetics. The necessary transition stochastic rates were computed using the heuristic devised in [41]. Six various constant times approximating the actual values have been used (“very, very short”—seconds; “very short”—seconds to a minute; “short”—up to a minute; “medium”—approximately half as long as the synthesis and expression; “long”—minutes to hours; “very long”—days), similarly as in [42]. This comes from the fact that the exact dependencies of time values between the components of the processes are not known. To determine those values for our model, first we had to determine the processes with the longest and shortest durations. Next, a time scale has been developed with values ranging from 1 to 500, using knowledge about the processes from the literature and experts. The rate constants of stochastic transitions have been calculated as a reciprocal of those values (see [41]).
The model includes various molecules, complexes, and receptors, and their exact concentrations are not precisely known. To address this issue, three different values were used to approximate their actual amounts, following a similar approach as in [41]. These values represent high concentration (100), medium concentration (10), and low concentration or absence (0). The distribution of these values over the places constitutes the initial marking of the system, which defines the physiologically normal state.
The stochastic Petri net model was analyzed using the Gillespie stochastic simulation algorithm (SSA) [43] implemented in the Snoopy software [44]. By executing a step-by-step simulation of the potential transitions within the stochastic Petri net, the SSA algorithm ensures that the resulting output consistently represents a valid state of the underlying stochastic process throughout the entire simulation. A detailed description of the algorithm can be found in [44].
To ensure the accuracy of the simulation results, the number of steps for the algorithm was determined based on previous analyses [41,45]. In order to obtain meaningful results, a considerable number of simulation runs were performed to explore different traces of state changes over time [44]. To improve the reliability of the results, the traces of multiple simulation runs were averaged.
2.2. Knockout Analysis
An essential type of a Petri net model of biological systems is based on disabling selected parts of an analyzed model and examining the behavior of its remaining parts (cf. [45,46]). It is called a knockout analysis, and two types of such an analysis can be distinguished, i.e., a t-invariant-based knockout and a simulation knockout. In the case of the former, selected transitions are disabled, which results in the disappearance of some t-invariants. The remaining t-invariants are then analyzed. In this type of analysis, subprocesses affected by disabling the chosen elementary processes (i.e., transitions) can be identified. In the simulation knockout, selected transitions are knocked-out, and token distribution over a set of places is examined using the net simulation. Knocking out a transition means that it is not fired during the whole simulation. In the analysis of this type, a series of simulations starting from the same initial token distribution is performed. Each of these simulations ends after a specified number of steps. The influence of selected elementary processes (represented by a transition or some subset of transitions) on the net’s behavior can be investigated using knockout analysis.
3. Results and Discussion
3.1. Stochastic Petri Net-Based Model
This article presents a stochastic Petri net-based model that explores the relationship between the cholesterol metabolism pathway and atherosclerosis development and progression, particularly how disruptions in cellular cholesterol homeostasis can influence this process. The model utilizes a classical Petri net, which was originally presented in [47] and was analyzed using t-invariants. It is composed of 91 places and 122 transitions, and Table A1 and Table A2 provide descriptions of their biological significance. Figure 4 presents a graphical representation of the model, including the initial marking and names of places and transitions. Table 1 indicates the initial marking, which specifies the number of tokens in each place based on calculations from [41,48,49,50].
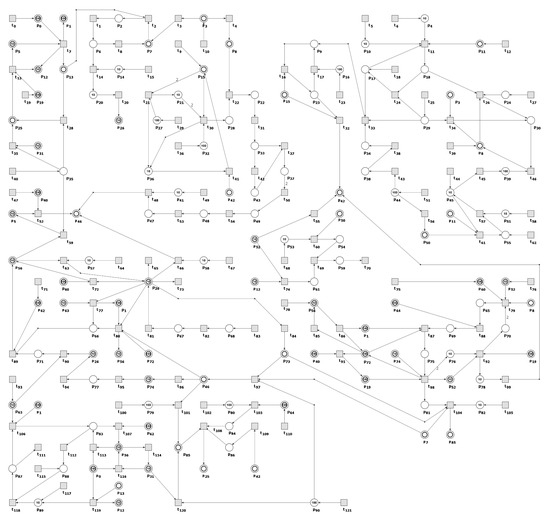
Figure 4.
The Petri net, modeling cholesterol metabolism and the influence of cellular cholesterol homeostasis disturbances on atherosclerosis development and progression. Transitions are represented by squares, and places by circles. The places depicted as two concentric circles are called logical places, representing the same place in the model that exists in multiple copies in the net. The names of the places and transitions can be found in Table A1 and Table A2, respectively.

Table 1.
The following list provides the names of the places and their initial token numbers. These token numbers have been assigned three different values that closely approximate the actual concentrations of molecules, complexes, and receptors within the net [41,49,51,52,53,54]. These values represent high (100), medium (10), or low (0) concentrations or absence, with concentrations given in units.
The net presented in [47] focuses primarily on describing the structure of the modeled system and is, therefore, qualitative. However, to understand the nature of biological systems, quantitative properties such as time dependencies and reaction rates are crucial. The extended model presented in this paper includes time-related properties, and all stochastic transitions follow mass-action kinetics. The calculation of the kinetic parameters (rate constants) was accomplished through the application of a straightforward heuristic developed in [41] that is biologically intuitive. First, six different time constants were assigned to the reactions, as shown in Table 2. Then, a time scale was developed based on literature and expert knowledge, with values ranging from 1 to 500 (see Table 2). In conclusion, the rate constants for the stochastic transitions were determined by taking the reciprocals of the respective values. The resulting rate constants can be found in Table 3.

Table 2.
To capture the interdependencies of time between the model’s components, we had to assign approximate time values to the modeled processes. Unfortunately, the available literature only provided rough estimates of these values (as indicated in the "Time data derived from the literature sources" and "Time interval" columns). Therefore, we recalculated the duration of each process using a scale of 1 to 500 (as indicated in the "Duration" column).

Table 3.
The following is a list of rate functions for the analyzed model, where represents the mass action function [60] and c is a kinetic parameter (rate constant) presented in . In Snoopy [44], the function is readily available and serves to create the rate function for a transition. This function considers the transition’s input places and accepts the kinetic parameter as an input.
3.2. Stochastic Simulation and Knockout Based Analysis
We employed the Gillespie stochastic simulation algorithm (SSA) [43] implemented in Snoopy [44] to conduct a simulation-based analysis of the system and answer important biological questions. Each simulation experiment consisted of 5000 runs, with each run comprising 80,000 steps. In addition, we conducted a knockout simulation of the model to study its behavior when certain transitions were excluded. In our case, these transitions were assigned a firing rate of zero. This allowed us to analyze the network’s response and observe any changes in its dynamics. During stochastic simulations, we observed places: (foamy cells), (squalene), and (HDL-3 cholesterol CE in blood).
Scenario 1.
Targeting of the lipid metabolism process.
Scenario 1A.
Inhibition of HMG-CoA reductase (HMGCR) activity.
Since cholesterol in LDL is one of the critical drivers of atherosclerosis, a great effort has been made to reduce its levels. The main strategy for lowering its serum cholesterol levels involves statins, which inhibit the HMGCR) [61,62] and stabilize atherosclerotic plaque by affecting oxidative stress and low-grade local inflammation [63]. Therefore, in order to investigate the impact of inhibiting HMGCR, we removed the transitions (HMGCR activation), (reaction catalyzed by HMGCR phosphatase), and (increasing activity by SREBP-2) from the network. We decided to begin by observing the place (squalene) since it reflects the changes in cholesterol biosynthesis. Looking at Figure 5B, it is visible that the mevalonate pathway is affected.
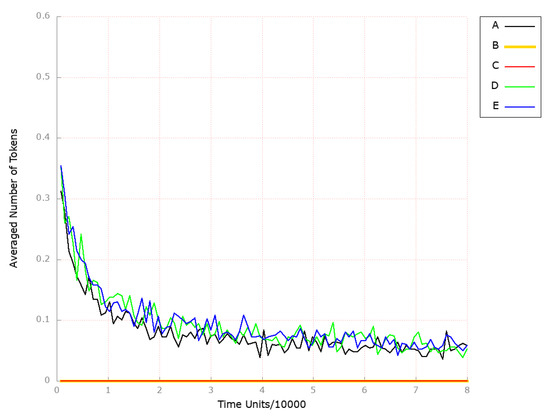
Figure 5.
The outcomes of the in silico knockout analysis performed under Scenario 1, for place (squalene). (A) The model has been simulated without anything knocked out. (B) The effect of excluding the following transitions: , , and (Scenario 1A). (C) The effect of excluding the following transitions: , , , and (Scenario 1B). (D) The effect of excluding the following transitions: , , and (Scenario 1C). (E) The effect of excluding the following transitions: , , , and (Scenario 1C).
Next, we observed the place (foamy cells) since it corresponds to the changes in atherosclerosis development and progression. As shown in Figure 6B, atherosclerosis is strongly attenuated over time if HMGCR is inhibited.
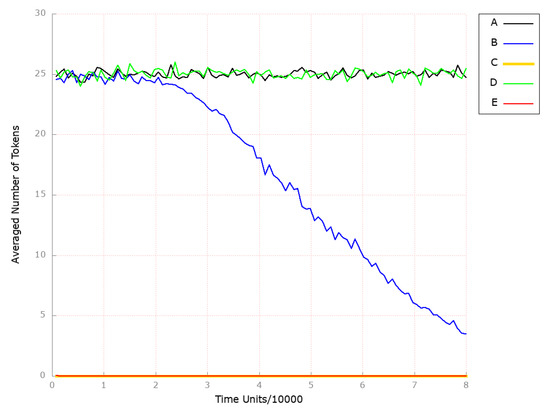
Figure 6.
The outcomes of the in silico knockout analysis performed under Scenario 1, for place (foamy cells). (A) The model has been simulated without anything knocked out. (B) The effect of excluding the following transitions: , , and (Scenario 1A). (C) The effect of excluding the following transitions: , , , and (Scenario 1B). (D) The effect of excluding the following transitions: , , and (Scenario 1C). (E) The effect of excluding the following transitions: , , , and (Scenario 1C).
Finally, we also looked at the place (HDL-3 cholesterol CE in the blood), which represents a molecule that is significantly and inversely associated with arterial stiffness [64]. The findings are depicted in Figure 7B, and it is evident that the HDL-related mechanisms remained unaltered.
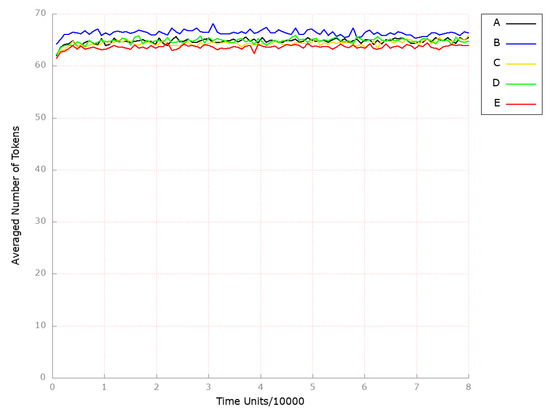
Figure 7.
The outcomes of the in silico knockout analysis performed under Scenario 1, for place (HDL-3 cholesterol CE in blood). (A) The model has been simulated without anything knocked out. (B) The effect of excluding the following transitions: , , and (Scenario 1A). (C) The effect of excluding the following transitions: , , , and (Scenario 1B). (D) The effect of excluding the following transitions: , , and (Scenario 1C). (E) The effect of excluding the following transitions: , , , and (Scenario 1C).
Scenario 1B.
Inhibition of oxidative stress together with HMG-CoA reductase activity.
Understanding the pathophysiology of atherosclerosis can give rise to new strategies dedicated to preventing and treating patients with this common disease. Clinical research has recognized oxidative stress as a significant element that contributes to the advancement and progression of atherosclerosis [65,66,67].
To analyze the combination of anti-oxidant treatments together with HMGCR inhibition being a key player in cholesterol synthesis, we excluded from the studied model the following transitions: (HMGCR activation), (reaction catalyzed by HMGCR phosphatase), (increasing activity by SREBP-2), and (oxidation). As a result, we could observe the atherosclerosis restraint (see Figure 6C). At the same time, the processes mediated by HDL remained unaffected (see Figure 7C).
Scenario 1C.
Modulating the activity of phosphoprotein phosphatase inhibitor-1 (PPI-1).
When phosphorylated by PKA, PPI-1 (phosphoprotein phosphatase inhibitor-1) can act as an inhibitor for various phosphatases. In the context of HMGCR regulation, it inhibits PP-2A (also known as HMGCR phosphatase), which removes phosphates from AMPK and HMGCR, and thus maintains HMGCR in the inactive state [68,69].
To examine the effect of PPI-1 inhibition, the transitions (dephosphorylation), (PPI 1 OH activation), and (processes increasing PPI1 activity) were removed from the analyzed model. Upon analyzing the results obtained, we observed that the level of foamy cell formation was only slightly affected (see Figure 6D). In contrast, the level of HDL-3 remained unchanged (see Figure 7D).
Therefore, the anti-oxidation treatment was combined with PPI-1 inhibition through additionally blocking transition (oxidation), which led to complete atherosclerosis development attenuation (see Figure 6E). At the same time, HDL-mediated processes stayed unaffected (see Figure 7E).
Scenario 2.
Targeting microsomal triglyceride transfer protein (MTTP).
Microsomal triglyceride transfer protein (MTTP) is a crucial protein involved in the formation and release of apolipoprotein B lipoproteins. It is responsible for the transfer of lipids from the site of their synthesis into the lumen during the assembly of VLDLs. Its inhibition is associated with decreased TAG and LDL-C and can be used as a plasma lipid-lowering drug [70,71].
In order to assess the impact of MTTP knockout on the progression and development of atherosclerosis, transition (MTTP synthesis) was excluded from the studied system. As depicted in Figure 8B, the foamy cell formation process was not influenced in a significant way, and as in previous scenarios, the HDL-3 levels stayed intact (see Figure 9B). The endogenous biosynthesis of cholesterol also remained unaltered (see Figure 10B).
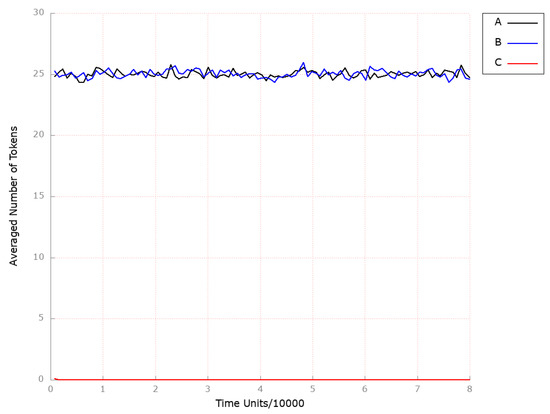
Figure 8.
The outcomes of the in silico knockout analysis performed under Scenario 2, for place (foamy cells). (A) The model has been simulated without anything knocked out. (B) The effect of excluding the following transition: . (C) The effect of excluding the following transitions: , and .
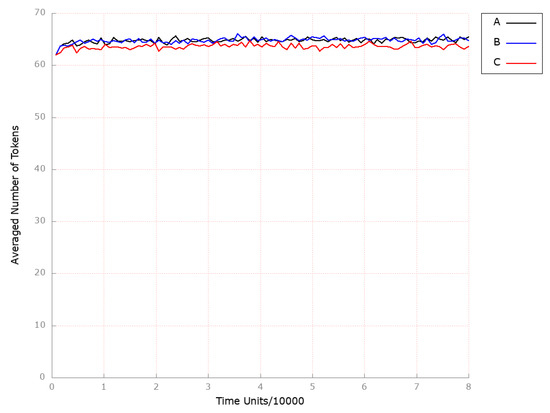
Figure 9.
The outcomes of the in silico knockout analysis performed under Scenario 2, for place (HDL-3 cholesterol CE in blood). (A) The model has been simulated without anything knocked out. (B) The effect of excluding the following transition: . (C) The effect of excluding the following transitions: and .
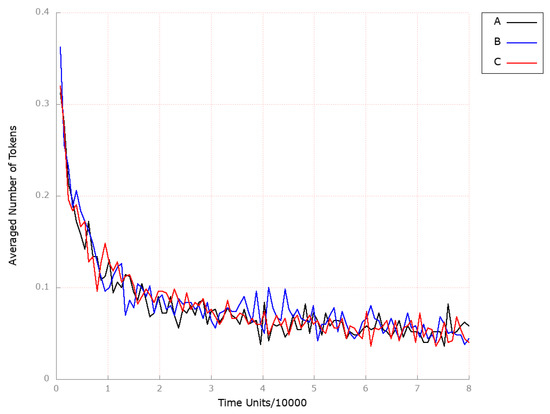
Figure 10.
The outcomes of the in silico knockout analysis performed under Scenario 2, for place (squalene). (A) The model has been simulated without anything knocked out. (B) The effect of excluding the following transition: . (C) The effect of excluding the following transitions: , and .
Thus, the anti-oxidation treatment was combined with MTTP inhibition by additionally blocking transition (oxidation). It resulted in complete atherosclerosis development attenuation (see Figure 8C), while endogenous cholesterol biosynthesis (see Figure 10C and HDL-mediated processes remained unaffected (see Figure 9C).
Scenario 3.
Modulating reverse cholesterol transport.
In this simulation experiment, we decided to examine the role of ATP-binding cassette protein A1 (ABCA1) in the development of atherosclerosis. ABCA1 plays a crucial role in maintaining cholesterol homeostasis and facilitating reverse cholesterol transport. It helps to prevent the buildup of excess cholesterol within cells and is critical for the formation of nascent HDL particles by mediating cholesterol efflux to the lipid-poor apolipoprotein AI (apoA-I) [22,72].
Moreover, it was demonstrated that mutations in the ABCA1 gene result in the autosomal recessive genetic disorder Tangier disease, which is characterized by significantly reduced levels of HDL in the blood and an elevated risk for atherosclerosis [73]. Evidence also shows that overexpression of ABCA1 can increase HDL-C and protect against atherosclerosis [22,74]. Thus, the boosted activity of ABCA1 can possibly remove the excess cholesterol accumulated in the peripheral cells and reduce the cholesterol burden.
To confirm this and observe the effect of the reverse cholesterol transport stimulation, we assigned the value to the kinetic constant of the transition (ABCA1 synthesis). We decided to monitor the following locations: (foamy cells), (squalene), and (HDL-3 cholesterol CE in the blood) for the same reasons set out in Scenario 1A above. As depicted in Figure 11C, the level of foamy cells formation is highly attenuated as compared to the results shown in Figure 11A (model without any knockout). Next, to mimic the significant increase (up-regulation) in ABCA1-mediated cholesterol efflux, we assigned the kinetic constant of 1 to the transition (ABCA1 synthesis). The results are presented in Figure 11D, and it is evident that the formation of the foamy cell is inhibited. Thereby, atherosclerosis progression is halted. Therefore, if the reverse cholesterol transport is activated, it may be possible to eliminate excess cholesterol that has accumulated in peripheral cells, thereby preventing the development of atherosclerosis.
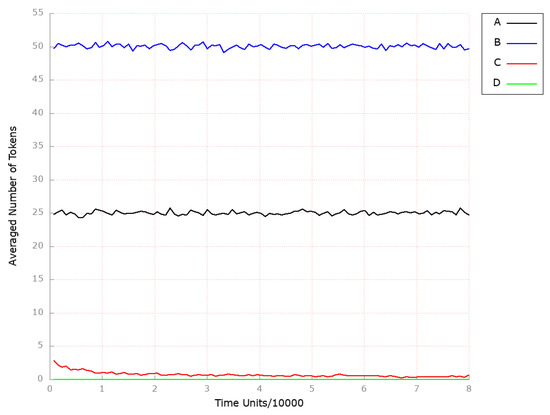
Figure 11.
The outcomes of the in silico knockout analysis performed under Scenario 3, for place (foamy cells). (A) The model has been simulated without anything knocked out. (B) The effect of excluding the following transition: . (C) The impact of transition , where the reverse cholesterol transport is stimulated. (D) The impact of transition , where the reverse cholesterol transport is up-regulated.
Finally, we excluded transition (ABCA1 synthesis) from the model to analyze the influence of reverse cholesterol transport restraint on atherosclerosis development and progression. As a result, the level of foamy cells increased significantly (see Figure 11B in comparison to the model without any knockout presented in Figure 11A).
In all the above-mentioned simulation experiments, both the HDL-3 level (see Figure 12B–D as compared to the results depicted in Figure 12A) and endogenous cholesterol biosynthesis (see Figure 13B,C as compared to the results depicted in Figure 13A) remained unaffected.
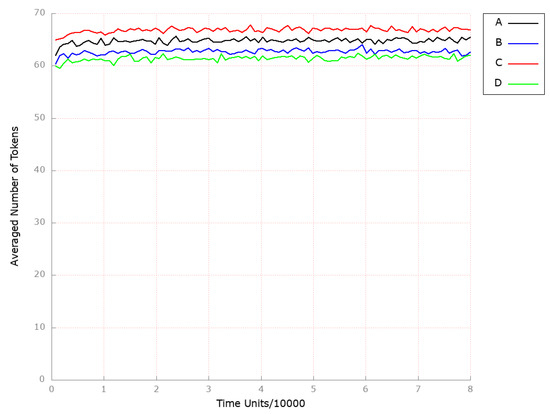
Figure 12.
The outcomes of the in silico knockout analysis performed under Scenario 3, for place (HDL-3 cholesterol CE in blood). (A) The model has been simulated without anything knocked out. (B) The effect of excluding the following transition: . (C) The impact of transition , where the reverse cholesterol transport is stimulated. (D) The impact of transition , where the reverse cholesterol transport is up-regulated.
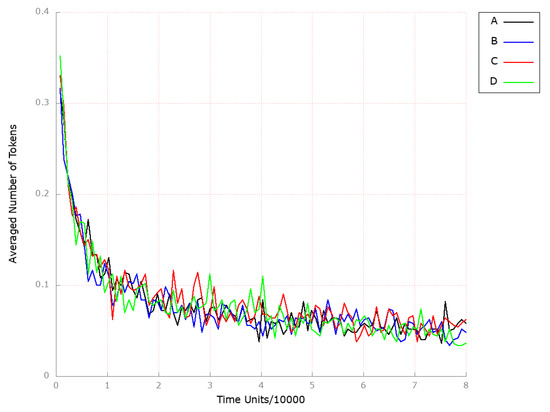
Figure 13.
The outcomes of the in silico knockout analysis performed under Scenario 3, for place (squalene). (A) The model has been simulated without anything knocked out. (B) The effect of excluding the following transition: . (C) The impact of the transition , where the reverse cholesterol transport is stimulated. (D) The impact of transition , where reverse cholesterol transport is up-regulated.
Scenario 4.
Modulating the activity of the apical sodium-dependent bile acid transporter (ASBT).
ASBT plays a significant role in bile acid intestinal uptake and enterohepatic circulation. It is also crucial for cholesterol homeostasis, and since metabolic-related diseases may indirectly affect ASBT, it is a promising and novel target for atherosclerosis intervention. Unfortunately, the studies concerning ASBT performed so far are relatively insufficient, and it is important to pay closer attention to its function and regulation [75,76].
To investigate the impact of inhibiting ASBT on the model, we removed transition (ASBT activation) from the network. We have chosen to observe the following locations: (foamy cells) and (HDL-3 cholesterol CE in the blood) due to similar reasons as explained in Scenario 1A above. Thus, the inhibition of ASBT did not show any significant effect on the development and progression of atherosclerosis, as observed from the results obtained (see Figure 14B) and endogenous cholesterol synthesis (see Figure 15B) compared to the model where the above-mentioned transition was not knocked out (see Figure 14A and Figure 15A, respectively). Since the inhibition of the ASBT is expected to prevent bile acids from returning to the liver, thereby an elevation in both the synthesis of cholesterol from scratch and the expression of LDL receptors on the cell surface, leading to increased hepatic uptake of LDL-C and decreased serum LDL-C levels, should potentially be noticed [77]. However, the mechanism of decreased cholesterol reabsorption in response to ASBT inhibition is not so clear [78].
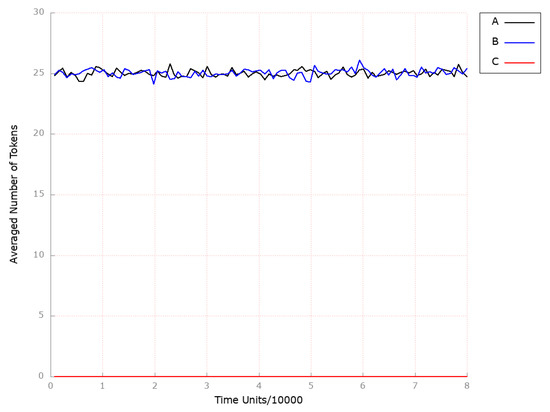
Figure 14.
The outcomes of the in silico knockout analysis performed under Scenario 4, for place (foamy cells). (A) The model has been simulated without anything knocked out. (B) The effect of excluding the following transition: . (C) The impact of knocking out the following transitions: and .
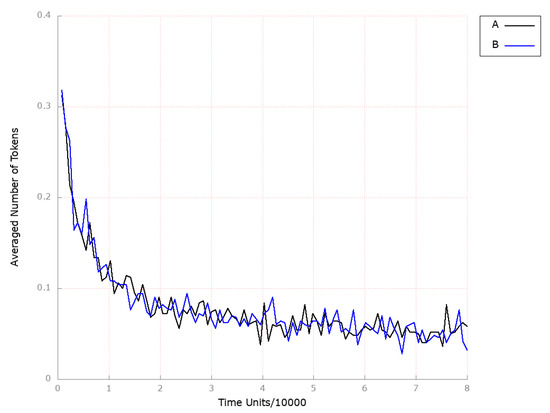
Figure 15.
The outcomes of the in silico knockout analysis performed under Scenario 4, for place (squalene). (A) The model has been simulated without anything knocked out. (B) The effect of excluding the following transition: .
At the same time, it can be easily noticed that the inactivation of the ASBT protein significantly influenced HDL-3 molecule levels (place ; see Figure 16B), which is consistent with the results presented in [79], where, among treatment groups, trends toward increased levels of HDL-C were observed.
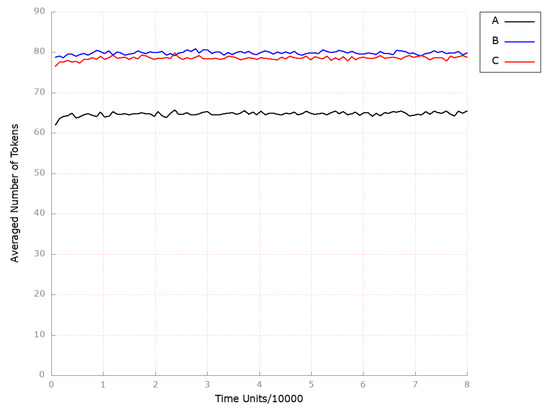
Figure 16.
The outcomes of the in silico knockout analysis performed under Scenario 4, for place (HDL-3 cholesterol CE in blood). (A) The model has been simulated without anything knocked out. (B) The effect of excluding the following transition: . (C) The impact of knocking out the following transitions: and .
Furthermore, given the evidence suggesting the involvement of inflammation in the development of atherosclerosis, we investigated the impact of drugs that specifically target local inflammation. It was demonstrated that if, in addition to the transition (ASBT activation), transition (influx of macrophages) is deactivated, atherosclerosis does not develop (see Figure 14C). Similar to the scenario described above, ASBT inhibition was found to significantly elevate HDL-3 subfraction levels (see Figure 16C).
It confirms the earlier observations indicating that the combined treatment significantly enhances therapeutic efficacy against atherosclerosis [47].
3.3. Limitations of the Study
It is widely recognized that stochastic Petri-net-based models and stochastic simulations are powerful tools for modeling and analyzing complex biological systems, such as the atherosclerosis process influenced by disturbances in cholesterol metabolism. However, it is important to acknowledge that these approaches have their limitations. One notable limitation is associated with parameter uncertainty. The accuracy of a Petri-net-based model relies on the accuracy of the parameters used, including rate constants and initial concentrations, which are typically derived from experimental data. Given that the exact values of these parameters are often not precisely known, approximations are made, introducing potential sources of uncertainty. Other limitations may arise from factors such as model simplifications or assumptions of homogeneity. Furthermore, the validation of the model against experimental data is crucial. However, obtaining comprehensive experimental data for all elements of a complex, long-term disease such as atherosclerosis may not always be feasible.
These limitations should not undermine the utility of stochastic Petri-net-based models or stochastic simulations. Instead, they emphasize the need for researchers to exercise caution when interpreting results and addressing the challenge of creating adequate models for specific aspects of complex diseases such as atherosclerosis.
4. Conclusions
Our study’s results show beyond a doubt that the role of cholesterol is significant in the intricate process of atherosclerosis; however, reducing its synthesis is not enough to stop the progression of atherosclerosis.
Using stochastic analyses, we have shown that the simultaneous inhibition of cholesterol synthesis and oxidative stress is very effective. However, this blockade did not affect HDL-C. We have observed that sometimes, as in the case of HMGCR, the reduction in the number of foam cells was higher if we simultaneously affected oxidative stress.
In turn, by blocking both PPI-1 and MTTP, we did not observe an impact on the foam cells formation until we simultaneously blocked the effects of oxidative stress in the model. Adding the latter blockage significantly reduced the number of foam cells formed.
In turn, modulation of ASBT activity showed that the ASBT blockade did not affect the number of foam cells formed. On the other hand, it had a significant influence on HDL.
Our results showed that a complex process could not be understood, fully controlled, or cured without a comprehensive approach. The systems approach seems to be an interesting proposal to find key places and processes in the modeled phenomenon that should be blocked while remembering that the system has to "survive" and continue to function after such a blockade.
Author Contributions
D.F. and A.R. created the model; D.F., P.F., A.R. and M.R. carried out the systems analysis; D.F. and A.R. drew biological conclusions; D.F., P.F., A.R. and M.R. wrote the manuscript; D.F. acquired the funds; D.F. and P.F. supervised the research. All authors have read and agreed to the published version of the manuscript.
Funding
This work was partially supported by statutory funds of Poznan University of Technology and by statutory funds of Poznan University of Medical Sciences.
Institutional Review Board Statement
Not applicable.
Informed Consent Statement
Not applicable.
Data Availability Statement
All necessary data are included in the paper.
Conflicts of Interest
The authors declare no conflict of interest.
Appendix A

Table A1.
The list of places and their biological meaning.
Table A1.
The list of places and their biological meaning.
| Place | Biological Meaning | Place | Biological Meaning |
|---|---|---|---|
| LIPC (hepatic triacylglycerol lipase) | high unesterified cholesterol pool in the liver | ||
| ApoE | lanosterol | ||
| LDL-R-LDL complex | 2,3 oxidosqualene | ||
| low free cholesterol pool in intestine and the peripheral tissues | squalene | ||
| CaMKKbeta | cAMP-PKA activated | ||
| intermediate density lipoprotein (IDL) | phosphoprotein phosphatase with an increased activity | ||
| LDL-C as CE in endosome | free fatty acids (FFA) in intestinal lumen in micelles | ||
| high expression of LDL-R on cell membrane | hormone-sensitive lipase (HSL) | ||
| HMG-CoA reductase (HMGCR) active | hormone-sensitive lipase (HSL) phosphorylated | ||
| acetyl-CoA carboxylase (ACC) activated | phosphoprotein phosphatase inhibitor 1 (PPI-1) with an increase activity | ||
| serine-threonine kinase 1 (LKB1) | HDL-3 CE in blood | ||
| phosphoprotein phosphatase with a decrease activity | hydrolase of cholesterol esters | ||
| free fatty acids (FFA) | apical sodium bile acid transporter (ASBT) | ||
| LDL-C in serum | free fatty acids (FFA) in adipose tissues | ||
| lysosomal lipases | ACAT in the intestinum | ||
| acetyl-CoA | stored TAG | ||
| malonyl-CoA decarboxylase (MCD) | LCAT | ||
| AMP-activated protein kinase (AMPK-OH) inactive | ABCA1 cholesterol efflux regulatory protein CERP | ||
| AMP-activated protein kinase (AMPK) active | microsomal triglyceride transfer protein (MTTP) | ||
| lipoprotein lipase (LPL) | nascent chylomicrons (CM) with ApoB-48 | ||
| free cholesterol in endosome in intestine | HDL cholesterol non-CE | ||
| acetoacetyl CoA | Niemann–Pick C1-Like 1 (NPC1L1) | ||
| mevalonate | low cholesterol in diet | ||
| malonyl-CoA increase | nascent CM in the blood | ||
| HMGCR phosphatase with a decrease activity | TAG in enterocytes | ||
| nascent VLDL reach in TAG secreted from the liver into the blood | cholesterol from enterocytes and peripheral tissues transported to the blood | ||
| high free cholesterol pool in intestine | ApoC-II | ||
| thiolase | remnant CM receptors in the liver | ||
| HMG-CoA | bile acids | ||
| 2C protein phosphatase with an increase activity | mature CM with ApoB-48, ApoC-II and ApoE | ||
| HMGCR phosphorylated inactive | MAG in intestinal lumen in micelles | ||
| HDL-2 | biliary cholesterol | ||
| HMG-CoA synthase | free fatty acids (FFA) and monoglyceride (MAG) in enterocytes | ||
| isopentenyl PP | ACAT in the liver | ||
| cAMP-PKA low activate AMP-activated | ApoB-100 | ||
| CE transfer protein CETP in blood | remnant CM with ApoB-48 and ApoE | ||
| CoA | LDL receptor-related protein | ||
| farnesyl PP | nascent HDL | ||
| low cAMP | MTTP-ApoB-100 complex | ||
| HMGCR phosphatase | cholesterol stored as cholesteryl esters in the liver | ||
| LRP1 | TAG synthesized in the liver | ||
| enzymes in ER membranes | foamy cells | ||
| increased FA in the liver | macrophages | ||
| geranyl PP | small dense LDL | ||
| cAMP | SRB1 | ||
| inorganic pyrophosphate (PPI)1 OH |

Table A2.
The list of transitions and their biological meaning.
Table A2.
The list of transitions and their biological meaning.
| Transition | Biological Meaning | Transition | Biological Meaning |
|---|---|---|---|
| Hepatic lipase (LIPC) activation | high inorganic pyrophosphate (PPI) OH phosphorylation | ||
| endocytosis via RME | processes increasing inorganic pyrophosphate (PPI) 1 activity | ||
| binding LDL and LDL-R | conversion from CE found in HDL into free cholesterol pool | ||
| LDL-R expression on cell membrane | hydrolase of cholesterol esters activation | ||
| increasing activity by SREBP2 | remaining cholesterol removed by fecal sterols | ||
| LKB1 activation | reabsorption in the intestine and return to the liver | ||
| processes increasing intracellular calcium | apical sodium-dependent bile acid transporter (ASBT) activation | ||
| conversion into LDL | HSL activation | ||
| receptor being returned stimulated by lower pH | hydrolysation of stored TAG | ||
| acetyl CoA synthesis from glucose in the liver | free fatty acids (FFA) pool in adipose tissue increases | ||
| processes lowering free cholesterol pool in the intestine and the peripheral tissues | LCAT activation in serum | ||
| AMP-activated protein kinase AMPK phosphorylation | processes catalyzed by ACAT | ||
| processes decreasing phosphoprotein phosphatase | steroid synthesis | ||
| conversion VLDL into IDL, TAG hydrolysis | TAG storage in adipocytes | ||
| CE hydrolysis | ACAT activation in the intestine | ||
| lysosomal lipases activation | diet and hypertension | ||
| carboxylation catalysed by acetyl CoA carboxylase (ACC) | efflux of cholesterol to ApoA-1 and ApoE catalysed by ABCA1 | ||
| decarboxylation | HDL synthesis in the Liver | ||
| processes increasing AMP-activated protein kinase (AMPK-OH) inactive | nascent CM synthesis in enterocytes | ||
| pancreatic synthesis | HDL secreted by enterocytes and by the liver | ||
| free cholesterol effluxes endosome | cholesterol transport from the lumen to the intestinum | ||
| reaction catalysed by thiolase | NPC1L1 activtion | ||
| mevalonate synthesis | processes lowering cholesterol | ||
| malonyl CoA decarboxylase (MCD) activation | expression remnant CE receptors in the liver when the intestinal pool is high | ||
| dephosphorylation by protein phosphatase 2C | ApoC-2 returned to HDL cholesterol | ||
| protein phosphatase activation | exchanging HDL components in blood | ||
| HMGCR inactivation by phosphorylation | nascent CM exchange components with HDL | ||
| processes decreasing HMGCR phosphatase activity | transport mainly TAG within nascent chylomicrons from the intestine to the blood | ||
| CE transfer from LDL | conversion cholesterol into CE | ||
| thiolase activation | transport by ABCA1 | ||
| acetyl-CoAs conversion | LPL activation | ||
| reaction phosphorylation catalysed by ATP | FFA absorption in enterocyte | ||
| fatty acids (FA) synthesis in the liver | ABCA1 synthesis | ||
| dephosphorylation of ACC and its activation | cholesterol pool increases in the intestine because of biliary cholesterol | ||
| dephosphorylation | formation of the biliary cholesterol | ||
| CE transfer from HDL-2 | bile acids synthesis | ||
| HMG-CoA synthase activation in cytoplasm | reaction increasing cholesterol pool in the liver via RME | ||
| reaction forming farnesyl PP | TG distribution from CM | ||
| decreased PKA activation | binding with glycerol albumins | ||
| HMGCR activation | ACAT activation in the liver | ||
| CETP secretion from the liver | re-esterification of cholesterol by ACAT in the liver | ||
| beta oxidation | APOB100 synthesis in the liver and secreted into circulation | ||
| reaction condensation | forming complex | ||
| processes decreasing cAMP | CM endocytosis in the liver | ||
| PPI 1 OH activation | LDL-R synthesis | ||
| HMGCR phosphatase activation | efflux of free cholesterol from peripheral tissues | ||
| reaction catalyzed by HMG-CoA reductase phosphatase | conversion nascent HDL into HDL-3 | ||
| LRP1 synthesis | reaction forming nascent VLDL reach in TAG in the liver | ||
| reactions 19 leading to cholesterol synthesis in liver | TAG synthesis in the liver | ||
| enzymes activation | MTTP synthesis | ||
| reaction catalysed by squalene synthase | atherosclerosis | ||
| hormonal processes increasing cAMP | transport into peripheral tissue | ||
| activation by LRP1 | conversion HDL-3 into nascent LDL | ||
| reaction catalysed by squalene epoxidase | conversion HDL-3 into HDL-2 | ||
| reaction catalysed by squalene monooxygenase | influx of macrophages | ||
| internalized from blood by the liver | conversion HDL-2 into HDL-3 | ||
| increased PKA activation | oxidation | ||
| reaction catalysed by phosphoprotein phosphatase | binding with macrophage scavenger receptor type A (SRA) I and II | ||
| phosphoprotein phosphatase activation | degradation | ||
| conversion HDL into IDL | cholesterol CE transport to the liver | ||
| phosphorylation by PKA | SRB1 expression |
References
- Wang, Y.; Yutuc, E.; Griffiths, W.J. Cholesterol metabolism pathways—Are the intermediates more important than the products? FEBS J. 2021, 288, 3727–3745. [Google Scholar] [CrossRef] [PubMed]
- Bivona, G.; Gambino, C.M.; Lo Sasso, B.; Scazzone, C.; Giglio, R.V.; Agnello, L.; Ciaccio, M. Serum Vitamin D as a Biomarker in Autoimmune, Psychiatric and Neurodegenerative Diseases. Diagnostics 2022, 12, 130. [Google Scholar] [CrossRef]
- Afonso, M.S.; Machado, R.M.; Lavrador, M.S.; Quintao, E.C.R.; Moore, K.J.; Lottenberg, A.M. Molecular Pathways Underlying Cholesterol Homeostasis. Nutrients 2018, 10, 760. [Google Scholar] [CrossRef]
- Howe, V.; Sharpe, L.J.; Alexopoulos, S.J.; Kunze, S.V.; Chua, K.N.; Li, D.; Brown, A.J. Cholesterol homeostasis: How do cells sense sterol excess? Chem. Phys. Lipids 2016, 199, 170–178. [Google Scholar] [CrossRef] [PubMed]
- Formanowicz, D.; Kozak, A.; Formanowicz, P. A Petri net based model of oxidative stress in atherosclerosis. Found. Comput. Decis. Sci. 2012, 37, 59–78. [Google Scholar] [CrossRef]
- Luo, J.; Yang, H.; Song, B. Mechanisms and regulation of cholesterol homeostasis. Nat. Rev. Mol. Cell Biol. 2020, 21, 225–245. [Google Scholar] [CrossRef] [PubMed]
- Le Novere, N.; Hucka, M.; Mi, H.; Moodie, S.; Schreiber, F.; Sorokin, A.; Demir, E.; Wegner, K.; Aladjem, M.; Wimalaratne, S.; et al. The Systems Biology Graphical Notation. Nat. Biotechnol. 2009, 27, 735–741. [Google Scholar] [CrossRef]
- Caponio, G.R.; Wang, D.Q.H.; Di Ciaula, A.; De Angelis, M.; Portincasa, P. Regulation of Cholesterol Metabolism by Bioactive Components of Soy Proteins: Novel Translational Evidence. Int. J. Mol. Sci. 2021, 22, 227. [Google Scholar] [CrossRef]
- Desvergne, B.; Michalik, L.; Wahli, W. Transcriptional Regulation of Metabolism. Physiol. Rev. 2006, 86, 465–514. [Google Scholar] [CrossRef]
- Citrin, K.M.; Fernández-Hernando, C.; Suárez, Y. MicroRNA regulation of cholesterol metabolism. Ann. N. Y. Acad. Sci. 2021, 1495, 55–77. [Google Scholar] [CrossRef]
- Asmita, B.; Eviania, M.L.; Crystal, M.W.; Girish, C.S. Regulation of cholesterol biosynthesis and lipid metabolism: A microRNA management perspective. Steroids 2021, 173, 108878. [Google Scholar] [CrossRef]
- Jun, I.; Ryuichiro, S. New insights into the activation of sterol regulatory element-binding proteins by proteolytic processing. Biomol. Concepts 2013, 4, 417–423. [Google Scholar] [CrossRef]
- Woollard, K.J.; Lumsden, N.G.; Andrews, K.L.; Aprico, A.; Harris, E.; Irvine, J.C.; Jefferis, A.m.; Fang, L.; Kanellakis, P.; Bobik, A.; et al. Raised Soluble P-Selectin Moderately Accelerates Atherosclerotic Plaque Progression. PLoS ONE 2014, 9, e97422. [Google Scholar] [CrossRef] [PubMed]
- Márquez, A.B.; van der Vorst, E.P.C.; Maas, S.L. Key Chemokine Pathways in Atherosclerosis and Their Therapeutic Potential. J. Clin. Med. 2021, 10, 3825. [Google Scholar] [CrossRef] [PubMed]
- Harrington, J.R. The Role of MCP-1 in Atherosclerosis. Stem Cells 2000, 18, 65–66. [Google Scholar] [CrossRef]
- Jebari-Benslaiman, S.; Galicia-García, U.; Larrea-Sebal, A.; Olaetxea, J.R.; Alloza, I.; Vandenbroeck, K.; Benito-Vicente, A.; Martín, C. Pathophysiology of Atherosclerosis. Int. J. Mol. Sci. 2022, 23, 3346. [Google Scholar] [CrossRef]
- Mudau, M.; Genis, A.; Lochner, A.; Strijdom, H. Endothelial dysfunction: The early predictor of atherosclerosis: Review article. Cardiovasc. J. Afr. 2012, 23, 222–231. [Google Scholar] [CrossRef]
- Rżosińska, K.; Formanowicz, D.; Formanowicz, P. The study of the influence of micro-environmental signals on macrophage differentiation using a quantitative Petri net based model. Arch. Control Sci. 2017, 27, 331–349. [Google Scholar] [CrossRef]
- Yao, Y.; Xu, X.H.; Jin, L. Macrophage Polarization in Physiological and Pathological Pregnancy. Front. Immunol. 2019, 10, 792. [Google Scholar] [CrossRef]
- Pokhrel, S.; Gudneppanavar, R.; Teegala, L.R.; Duah, E.; Thodeti, C.K.; Paruchuri, S. Leukotriene D4 Upregulates Oxidized Low-Density Lipoprotein Receptor 1 and CD36 to Enhance Oxidized LDL Uptake and Phagocytosis in Macrophages Through Cysteinyl Leukotriene Receptor 1. Front. Physiol. 2021, 12, 756450. [Google Scholar] [CrossRef]
- Poznyak, A.V.; Nikiforov, N.G.; Markin, A.M.; Kashirskikh, D.A.; Myasoedova, V.A.; Gerasimova, E.V.; Orekhov, A.N. Overview of OxLDL and Its Impact on Cardiovascular Health: Focus on Atherosclerosis. Front. Pharmacol. 2021, 11, 613780. [Google Scholar] [CrossRef] [PubMed]
- Matsuo, M. ABCA1 and ABCG1 as potential therapeutic targets for the prevention of atherosclerosis. J. Pharmacol. Sci. 2022, 148, 197–203. [Google Scholar] [CrossRef] [PubMed]
- Yu, X.H.; Zheng, X.L.; Tang, C.K. Chapter One—Nuclear Factor-κB Activation as a Pathological Mechanism of Lipid Metabolism and Atherosclerosis. In Advances in Clinical Chemistry; Elsevier: Amsterdam, The Netherlands, 2015; Volume 70, pp. 1–30. [Google Scholar] [CrossRef]
- Chistiakov, D.A.; Bobryshev, Y.V.; Orekhov, A.N. Macrophage-mediated cholesterol handling in atherosclerosis. J. Cell. Mol. Med. 2016, 20, 17–28. [Google Scholar] [CrossRef]
- Kelley, N.; Jeltema, D.; Duan, Y.; He, Y. The NLRP3 Inflammasome: An Overview of Mechanisms of Activation and Regulation. Int. J. Mol. Sci. 2019, 20, 3328. [Google Scholar] [CrossRef] [PubMed]
- Sun, Q.; Scott, M.J. Caspase-1 as a multifunctional inflammatory mediator: Noncytokine maturation roles. J. Leukoc. Biol. 2016, 100, 961–967. [Google Scholar] [CrossRef] [PubMed]
- Mundi, S.; Massaro, M.; Scoditti, E.; Carluccio, M.A.; van Hinsbergh, V.W.M.; Iruela-Arispe, M.L.; De Caterina, R. Endothelial permeability, LDL deposition, and cardiovascular risk factors—A review. Cardiovasc. Res. 2017, 114, 35–52. [Google Scholar] [CrossRef] [PubMed]
- Hu, D.; Yin, C.; Luo, S.; Habenicht, A.J.R.; Mohanta, S.K. Vascular Smooth Muscle Cells Contribute to Atherosclerosis Immunity. Front. Immunol. 2019, 10, 1101. [Google Scholar] [CrossRef]
- Churov, A.; Summerhill, V.; Grechko, A.; Orekhova, V.; Orekhov, A. MicroRNAs as Potential Biomarkers in Atherosclerosis. Int. J. Mol. Sci. 2019, 20, 5547. [Google Scholar] [CrossRef]
- Yao, L.; Tanuja, T.; Wenduo, G.; Jingjing, C.; Qingbo, X. Impact of miRNA in Atherosclerosis. Arterioscler. Thromb. Vasc. Biol. 2018, 38, e159–e170. [Google Scholar] [CrossRef]
- Mireille, O.; Elizabeth, J.H.; Coen, V.S.; Graeme, J.K.; Maryem, A.H.; Bhama, R.; Rayner, K.J.; Ryan, E.T.; Ljubica, P.; Ulf, H.; et al. miRNA Targeting of Oxysterol-Binding Protein-Like 6 Regulates Cholesterol Trafficking and Efflux. Arterioscler. Thromb. Vasc. Biol. 2016, 36, 942–951. [Google Scholar] [CrossRef]
- Bargieł, W.; Cierpiszewska, K.; Maruszczak, K.; Pakuła, A.; Szwankowska, D.; Wrzesińska, A.; Gutowski, Ł.; Formanowicz, D. Recognized and Potentially New Biomarkers—Their Role in Diagnosis and Prognosis of Cardiovascular Disease. Medicina 2021, 57, 701. [Google Scholar] [CrossRef] [PubMed]
- Domanski, M.J.; Tian, X.; Wu, C.O.; Reis, J.P.; Dey, A.K.; Gu, Y.; Zhao, L.; Bae, S.; Liu, K.; Hasan, A.A.; et al. Time Course of LDL Cholesterol Exposure and Cardiovascular Disease Event Risk. J. Am. Coll. Cardiol. 2020, 76, 1507–1516. [Google Scholar] [CrossRef]
- David, R.; Alla, H. Discrete, Continuous and Hybrid Petri Nets; Springer: Berlin/Heidelberg, Germany, 2010. [Google Scholar]
- Koch, I.; Reisig, W.; Schreiber, F. (Eds.) Modeling in Systems Biology. The Petri Net Approach; Springer: London, UK, 2011. [Google Scholar]
- Murata, T. Petri nets: Properties, analysis and applications. Proc. IEEE 1989, 77, 541–580. [Google Scholar] [CrossRef]
- Formanowicz, D.; Kozak, A.; Głowacki, T.; Radom, M.; Formanowicz, P. Hemojuvelin–hepcidin axis modeled and analyzed using Petri nets. J. Biomed. Inform. 2013, 46, 1030–1043. [Google Scholar] [CrossRef] [PubMed]
- Sackmann, A.; Heiner, M.; Koch, I. Application of Petri net based analysis techniques to signal transduction pathway. BMC Bioinform. 2006, 7, 482. [Google Scholar] [CrossRef] [PubMed]
- Marsan, M. Stochastic Petri nets: An elementary introduction. Lect. Notes Comput. Sci. 1989, 424, 1–29. [Google Scholar]
- Bause, F.; Kritzinger, P. Stochastic Petri Nets—An Introduction to the Theory; Vieveg: Berlin/Heidelberg, Germany, 2013. [Google Scholar]
- Formanowicz, D.; Rybarczyk, A.; Formanowicz, P. Factors influencing essential hypertension and cardiovascular disease modeled and analyzed using stochastic Petri nets. Fundam. Informaticae 2018, 160, 143–165. [Google Scholar] [CrossRef]
- Blazewicz, J.; Formanowicz, D.; Formanowicz, P.; Sackmann, A.; Sajkowski, M. Modeling the process of human body iron homeostasis using a variant of timed Petri nets. Discret. Appl. Math. 2009, 157, 2221–2231. [Google Scholar] [CrossRef]
- Gillespie, D. Exact stochastic simulation of coupled chemical reactions. J. Phys. Chem. 1977, 81, 2340–2361. [Google Scholar] [CrossRef]
- Heiner, M.; Herajy, M.; Liu, F.; Rohr, C.; Schwarick, M. Snoopy—A unifying Petri net tool. Lect. Notes Comput. Sci. 2012, 7347, 398–407. [Google Scholar]
- Formanowicz, D.; Rybarczyk, A.; Radom, M.; Formanowicz, P. A role of inflammation and immunity in essential hypertension—Modeled and analyzed using Petri nets. Int. J. Mol. Sci. 2020, 21, 3348. [Google Scholar] [CrossRef] [PubMed]
- Grunwald, S.; Speer, A.; Ackermann, J.; Koch, I. Petri net modelling of gene regulation of the Duchenne muscular dystrophy. Biosystems 2008, 92, 189–205. [Google Scholar] [CrossRef] [PubMed]
- Formanowicz, D.; Radom, M.; Rybarczyk, A.; Tanas, K.; Formanowicz, P. Control of Cholesterol Metabolism Using a Systems Approach. Biology 2022, 11, 430. [Google Scholar] [CrossRef] [PubMed]
- Atluri, P.; Karakousis, G.; Porrett, P.; Kaiser, L. The Surgical Review: An Integrated Basic and Clinical Science Study Guide, 2nd ed.; Lippincott Williams & Wilkins: Philadelphia, PA, USA, 2006. [Google Scholar]
- Scheidel, J.; Lindauer, K.; Ackermann, J.; Koch, I. Quasi-Steady-State Analysis based on Structural Modules and Timed Petri Net Predict System’s Dynamics: The Life Cycle of the Insulin Receptor. Metabolites 2015, 5, 766–793. [Google Scholar] [CrossRef]
- Formanowicz, D.; Rybarczyk, A.; Radom, M.; Tanas, K.; Formanowicz, P. A Stochastic Petri Net-Based Model of the Involvement of Interleukin 18 in Atherosclerosis. Int. J. Mol. Sci. 2020, 21, 8574. [Google Scholar] [CrossRef]
- Paul, G.; Marchelletta, R.; McCole, D.; Barrett, K. Interferon-γ alters downstream signaling originating from epidermal growth factor receptor in intestinal epithelial cells: Functional consequences for ion transport. J. Biol. Chem. 2012, 287, 2144–2155. [Google Scholar] [CrossRef]
- Watson, R. DHEA in Human Health and Aging; CRC Press: Boca Raton, FL, USA, 2011. [Google Scholar] [CrossRef]
- Janeway, C.; Travers, J.; Walport, M.; Shlomchik, M. Immunobiology: The Immune System in Health and Disease, 5th ed.; Garland Science: New York, NY, USA, 2001. [Google Scholar]
- Palsson, S.; Hickling, T.; Bradshaw-Pierce, E.; Zager, M.; Jooss, K.; Brien, P.; Spilker, M.; Palsson, B.; Vicini, P. The development of a fully-integrated immune response model (FIRM) simulator of the immune response through integration of multiple subset models. BMC Syst. Biol. 2013, 7, 95. [Google Scholar] [CrossRef]
- MacEwan, D. TNF ligands and receptors—A matter of life and death. Br. J. Pharmacol. 2002, 135, 855–875. [Google Scholar] [CrossRef]
- Sungjin, P.; Krist, D.; Statsyuk, A. Protein ubiquitination and formation of polyubiquitin chains without ATP, E1 and E2 enzymes. Chem. Sci. 2015, 6, 1770–1779. [Google Scholar] [CrossRef]
- Takahashi, K.; Takeya, M.; Sakashita, N. Multifunctional roles of macrophages in the development and progression of atherosclerosis in humans and experimental animals. Med. Electron Microsc. 2002, 35, 179–203. [Google Scholar] [CrossRef]
- Martin-Valmaseda, E.; Sanchez-Yague, J.; Rodriguez, M.; Gomez, F.; Llanillo, M. Comparison between in vitro lipid peroxidation in fresh sheep platelets and peroxidative processes during sheep platelet ageing under storage at 4 °C. J. Leukoc. Biol. 2010, 87, 779–789. [Google Scholar] [CrossRef] [PubMed]
- Jin, R.; Yang, G.; Li, G. Inflammatory mechanisms in ischemic stroke: Role of inflammatory cells. J. Leukoc. Biol. 2010, 87, 779–789. [Google Scholar] [CrossRef] [PubMed]
- Heiner, M.; Lehrack, S.; Gilbert, D.; Marwan, W. Extended Stochastic Petri Nets for Model-Based Design of Wetlab Experiments. Trans. Comput. Syst. Biol. XI 2009, 5750, 138–163. [Google Scholar]
- Memon, S.; Ganga, H.; Masrur, S.; Thompson, P. The Effect of HMG CoA Reductase Inhibitors on the Progression of Aortic Sclerosis: Review Article. Conn. Med. 2016, 80, 169–174. [Google Scholar]
- Bjorkegren, J.; Lusis, A. Atherosclerosis: Recent developments. Cell 2022, 185, 1630–1645. [Google Scholar] [CrossRef]
- Formanowicz, D.; Krawczyk, J. Controlling the thickness of the atherosclerotic plaque by statin medication. PLoS ONE 2020, 10, e0239953. [Google Scholar] [CrossRef]
- Wang, F.; Wang, X.; Ye, P.; Cao, R.; Zhang, Y.; Qi, Y.; Zhao, D. High-density lipoprotein 3 cholesterol is a predictive factor for arterial stiffness: A community-based 4.8-year prospective study. Lipids Health Dis. 2018, 17, 5. [Google Scholar] [CrossRef]
- Schulze, P.; Lee, R. Oxidative stress and atherosclerosis. Curr. Atheroscler. Rep. 2005, 7, 242–248. [Google Scholar] [CrossRef]
- Jiang, F.; Qian, J.; Chen, S.; Zhang, W.; Liu, C. Ligustrazine improves atherosclerosis in rat via attenuation of oxidative stress. Pharm. Biol. 2011, 49, 856–863. [Google Scholar] [CrossRef]
- Kozak, A.; Formanowicz, D.; Formanowicz, P. Structural analysis of a Petri net model of oxidative stress in atherosclerosis. IET Syst. Biol. 2018, 12, 108–117. [Google Scholar] [CrossRef]
- Kim, T. Protein phosphatase inhibitor-1 (PPI-1) has protective activities in stress conditions in E. coli. Int. J. Biol. Macromol. 2006, 38, 70–76. [Google Scholar] [CrossRef] [PubMed]
- Eto, M. Regulation of cellular protein phosphatase-1 (PP1) by phosphorylation of the CPI-17 family, C-kinase-activated PP1 inhibitors. J. Biol. Chem. 2009, 284, 35273–35277. [Google Scholar] [CrossRef] [PubMed]
- Hussain, M.; Bakillah, A. New approaches to target microsomal triglyceride transfer protein. Curr. Opin. Lipidol. 2008, 19, 572–578. [Google Scholar] [CrossRef] [PubMed]
- Hewing, B.; Parathath, S.; Mai, C.; Fiel, M.; Guo, L.; Fisher, E. Rapid regression of atherosclerosis with MTP inhibitor treatment. Atherosclerosis 2013, 227, 125–129. [Google Scholar] [CrossRef] [PubMed]
- Lee, J.; Parks, J. ATP-binding cassette transporter AI and its role in HDL formation. Curr. Opin. Lipidol. 2005, 16, 19–25. [Google Scholar] [CrossRef]
- Rust, S.; Rosier, M.; Funke, H.; Real, J.; Amoura, Z.; Piette, J.; Deleuze, J.; Brewer, H.; Duverger, N.; Denefle, P.; et al. Tangier disease is caused by mutations in the gene encoding ATP-binding cassette transporter 1. Nat. Genet. 1999, 22, 352–355. [Google Scholar] [CrossRef]
- Münch, G.; Bültmann, A.; Li, Z.; Holthoff, H.; Ullrich, J.; Wagner, S.; Ungerer, M. Overexpression of ABCG1 protein attenuates arteriosclerosis and endothelial dysfunction in atherosclerotic rabbits. Heart Int. 2012, 7, e12. [Google Scholar] [CrossRef]
- Yang, N.; Dong, Y.Q.; Jia, G.X.; Fan, S.M.; Li, S.Z.; Yang, S.S.; Li, Y.B. ASBT(SLC10A2): A promising target for treatment of diseases and drug discovery. Biomed. Pharmacother. 2020, 132, 110835. [Google Scholar] [CrossRef]
- Li, M.; Wang, Q.; Li, Y.; Cao, S.; Zhang, Y.; Wang, Z.; Liu, G.; Li, J.; Gu, B. Apical sodium-dependent bile acid transporter, drug target for bile acid related diseases and delivery target for prodrugs: Current and future challenges. Pharmacol. Ther. 2020, 212, 107539. [Google Scholar] [CrossRef]
- Bhat, B.; Rapp, S.; Beaudry, J.; Napawan, N.; Butteiger, D.; Hall, K.; Null, C.; Luo, Y.; Keller, B. Inhibition of ileal bile acid transport and reduced atherosclerosis in apoE-/- mice by SC-435. J. Lipid Res. 2003, 44, 1614–1621. [Google Scholar] [CrossRef]
- van de Peppel, I.; Bertolini, A.; van Dijk, T.; Groen, A.; Jonker, J.; Verkade, H. Efficient reabsorption of transintestinally excreted cholesterol is a strong determinant for cholesterol disposal in mice. J. Lipid Res. 2019, 60, 1562–1572. [Google Scholar] [CrossRef] [PubMed]
- Tiessen, R.; Kennedy, C.; Keller, B.; Levin, N.; Acevedo, L.; Gedulin, B.; van Vliet, A.; Dorenbaum, A.; Palmer, M. Safety, tolerability and pharmacodynamics of apical sodium-dependent bile acid transporter inhibition with volixibat in healthy adults and patients with type 2 diabetes mellitus: A randomised placebo-controlled trial. BMC Gastroenterol. 2018, 18, 3. [Google Scholar] [CrossRef] [PubMed]
Disclaimer/Publisher’s Note: The statements, opinions and data contained in all publications are solely those of the individual author(s) and contributor(s) and not of MDPI and/or the editor(s). MDPI and/or the editor(s) disclaim responsibility for any injury to people or property resulting from any ideas, methods, instructions or products referred to in the content. |
© 2023 by the authors. Licensee MDPI, Basel, Switzerland. This article is an open access article distributed under the terms and conditions of the Creative Commons Attribution (CC BY) license (https://creativecommons.org/licenses/by/4.0/).