1. Introduction
Aviation’s contribution to anthropogenic radiative forcing is estimated at around 3.5%, and therefore significantly contributes to climate change [
1]. In comparison with other transport sectors, it is the second largest contributor following road transportation [
2]. Although the COVID-19 pandemic has led to a significant reduction in air transport in the short term, a quick recovery to previous levels is expected. Hence, a broad set of measures is required to achieve compliance with the ambitious goals that have been defined, for example, in the context of the Paris agreement [
3]. In contrast to technological improvements, operational approaches require shorter implementation times and are able to realise mitigation potentials faster [
4]. Thus, these measures are expected to play an important role in the near future. In addition to well-investigated climate effects from carbon dioxide (CO
), direct and indirect effects induced by non-CO
emissions, such as water vapour (H
O), nitrogen oxides (NO
x), and contrail cirrus, contribute to about two thirds of the total net-radiative forcing in aviation [
1]. These non-CO
effects do not only depend on the fuel consumption, but also on emission location, time, and meteorological boundary conditions [
1,
5,
6]. Hence, a sole focus on fuel efficiency and resulting reduction in CO
emissions does not necessarily reduce the total climate impact. A comparison of these approaches either aiming for minimal fuel consumption or a minimal climate impact is subject to this study.
The goal of intermediate stop operations (ISO, also referred to as staging or multi-step operations) is to increase fuel efficiency by shortening the stage length of a mission by performing one or more intermediate stops for refuelling. Shorter stage lengths allow to reduce the amount of fuel that is needed to carry the required fuel on the respective mission, which reduces the aircraft mass. As a result, kerosene can be saved compared to the non-stop flight. ISO has been subject to a variety of research studies aiming for fuel efficiency [
7,
8,
9,
10,
11,
12,
13]: depending on the different boundary conditions of the studies, e.g., considered mission length, wind conditions, and aircraft type, fuel saving potentials between 5% and 20% are identified on a single mission basis, whereas the maximum global potential is estimated at around 5% to 10% for missions with distances of 2500 nautical miles (NM) and more. With a re-design of the aircraft, i.e., targeting shorter design ranges, up to 30% of fuel can be saved [
13,
14]. Although ISO enhances fuel efficiency for a large share of long-haul flights, cost savings strongly depend on further mission parameters, such as the connected city pair, fuel prices, wind conditions, and crew composition as the resulting longer travel times negatively influence operating cost [
9,
10]. This effect is enhanced for concepts with more than one refuelling stop, which only achieve marginal additional improvements in comparison to the one-stop set ups [
11].
A reduction in fuel consumption through reduced aircraft weight leads to higher flight altitudes if maximum fuel efficiency is targeted [
15,
16,
17]. Thus, engine emissions are generally released in higher altitudes, which can result in an increase in the climate impact caused by non-CO
effects, such as NO
x and contrails [
18,
19]. Therefore, a reduction in climate impact from fuel-proportional CO
emissions can be overcompensated by effects induced by other species. Linke et al. [
8] confirmed this for a global ISO scenario, where a fuel-optimal implementation was found to be associated with a rise in climate impact by 2.3%, given as the average change of the Earth’s surface temperature over a period of 100 years. In this context, climate impact from these species can be reduced with lower cruise altitudes [
18,
20,
21]. Existing studies focusing on individual missions [
22] or a selected airline network [
23] showed the climate mitigation potential of ISO with dependence on the set boundary conditions. However, this has not yet been analysed comprehensively on a broader scale. Furthermore, a systematic variation of cruise flight levels and location of intermediate stops as characteristics of the respective ISO missions has not been performed so far. The same holds true for an analysis of the trade-off between cost-increase and climate-impact changes in this concept, referred to as eco-efficient operations [
24].
On this basis, the objective of this study is to assess the climate mitigation potential of ISO. For this purpose, adjustments to the concept aiming for fuel efficiency are twofold:
The intermediate stop airport is not selected according to fuel-optimal criteria, but based on minimal climate impact.
Cruise flight levels are reduced and step climbs are avoided if this reduces the climate impact.
Consequently, we assess characteristics such as flight time, detour, fuel consumption and climate impact as well as the location of selected intermediate stop airports and preferred flight level. Our analysis contributes to the current state of research by (1) providing a methodology to characterise climate-optimised ISO, (2) assessing the climate mitigation potential of implementing ISO on long-haul flights departing from or landing in Europe, and (3) comparing this to a fuel-optimised set-up of ISO in terms of climate and non-climate metrics.
The structure of this paper is as follows: After this introduction, the applied data as well as the developed methodology are explained in
Section 2.
Section 3.1 presents the results in terms of the climate-mitigation potential of ISO and the characteristics of climate-optimised operations, followed by a comparison of fuel-optimised and climate-optimised operating methods in
Section 3.2, and a combination of both in an eco-efficient set-up in
Section 3.3. In
Section 4, we critically reflect on the achieved results and their impact on aviation industry’s stakeholders before we summarise the study in a final conclusion.
2. Materials and Methods
Figure 1 illustrates the applied workflow. Based on the reference case of all European long-haul flights in 2018, an implementation of ISO is modelled. In this context, we consider all flights that either depart or arrive in a member state of the European Civil Aviation Conference (ECAC) as well as exceed 2500 NM in flight length. For this purpose, a pre-selected set of possible refuelling airports per mission is created to limit computational efforts. Furthermore, different flight levels are considered for every mission to incorporate the previously discussed aspect of reduced climate impact by avoiding high flight altitudes. These different input parameters determine the calculation of trajectories by applying the base of aircraft data version 4.2 (BADA4) flight performance data [
25] with the trajectory calculation model (TCM) developed at DLR Air Transportation Systems [
26,
27]. Emission quantities and locations are calculated with the DLR Global Air Traffic Emission Distribution Laboratory (GRIDLAB) [
26] based on the fuel flow along the calculated four dimensional trajectories. The DLR fuel flow correlation method and emission indices obtained from the ICAO Engine Emission Databank are applied [
28,
29]. These serve as an input to calculate the climate impact of every single mission with the DLR climate chemistry response model AirClim [
30,
31]. All results are combined in a joint look-up table that aggregates information on fuel burn, flight time, flight distance, emission quantities and climate metrics in terms of average temperature response over 20 years (ATR20) and over 100 years (ATR100) for all selected combinations of origin, destination, aircraft type, flight level and refuelling airport or direct mission. On this basis, characteristics of the non-stop reference case, climate-optimised and fuel-optimised ISO, can be compared, and mitigation potentials can be assessed.
2.1. Input Data and Definition of Reference Case
A global flight plan of the year 2018 as derived from Sabre Market Intelligence Data Base (
www.sabre.com/products/market-intelligence, accessed on 15 June 2021) is the basis for all following calculations. This flight plan contains information on origin and destination airports, aircraft type, airline information, seats capacities, and frequencies of the different flights. The missions to be investigated are derived in a pre-processing step. As this study is performed in the context of the European research project ClimOP, we limit our analysis to flights with either origin or destination airport in a member state of ECAC [
32]. Moreover, only long-range flights with a great circle distance of more than 2500 NM are selected in accordance with previous studies, which do not show the benefits of ISO for shorter missions [
7,
8]. We restrict the study to the most relevant aircraft types in terms of available seat kilometres (ASK). This allows a coverage of 97.7% of the ASK of all long-range flights to or from the ECAC area and ensures high representativeness of the results for the focused region. All in all, we investigate a set of approximately 811,000 flights that cover 18% of all global ASK.
In the following, we define the reference case as the sample of all non-stop connections along the great circle between origin and destination. Flight altitudes are characterised by fuel-optimal step climbs.
2.2. Preselection of ISO Candidate Airports
Appropriate intermediate stop airports are chosen from a global set of airports as provided by OpenFlights (
OpenFlights.org, accessed on 11 August 2021). They are selected along the great circle routes based on the corresponding detour and their eccentricity from the fuel-optimal position in the middle between origin and destination, in accordance with Langhans et al. [
33]. For this purpose, we limit our considerations to those refuelling airports resulting in a detour below additional 20%. The eccentricity of the ISO airport is limited to an offset factor of 75%. Therefore, a possible intermediate stop airport at point S is considered for a mission from A to B, if
is satisfied. We exclude airport specific criteria such as runway length, available infrastructure and possible capacity limitations.
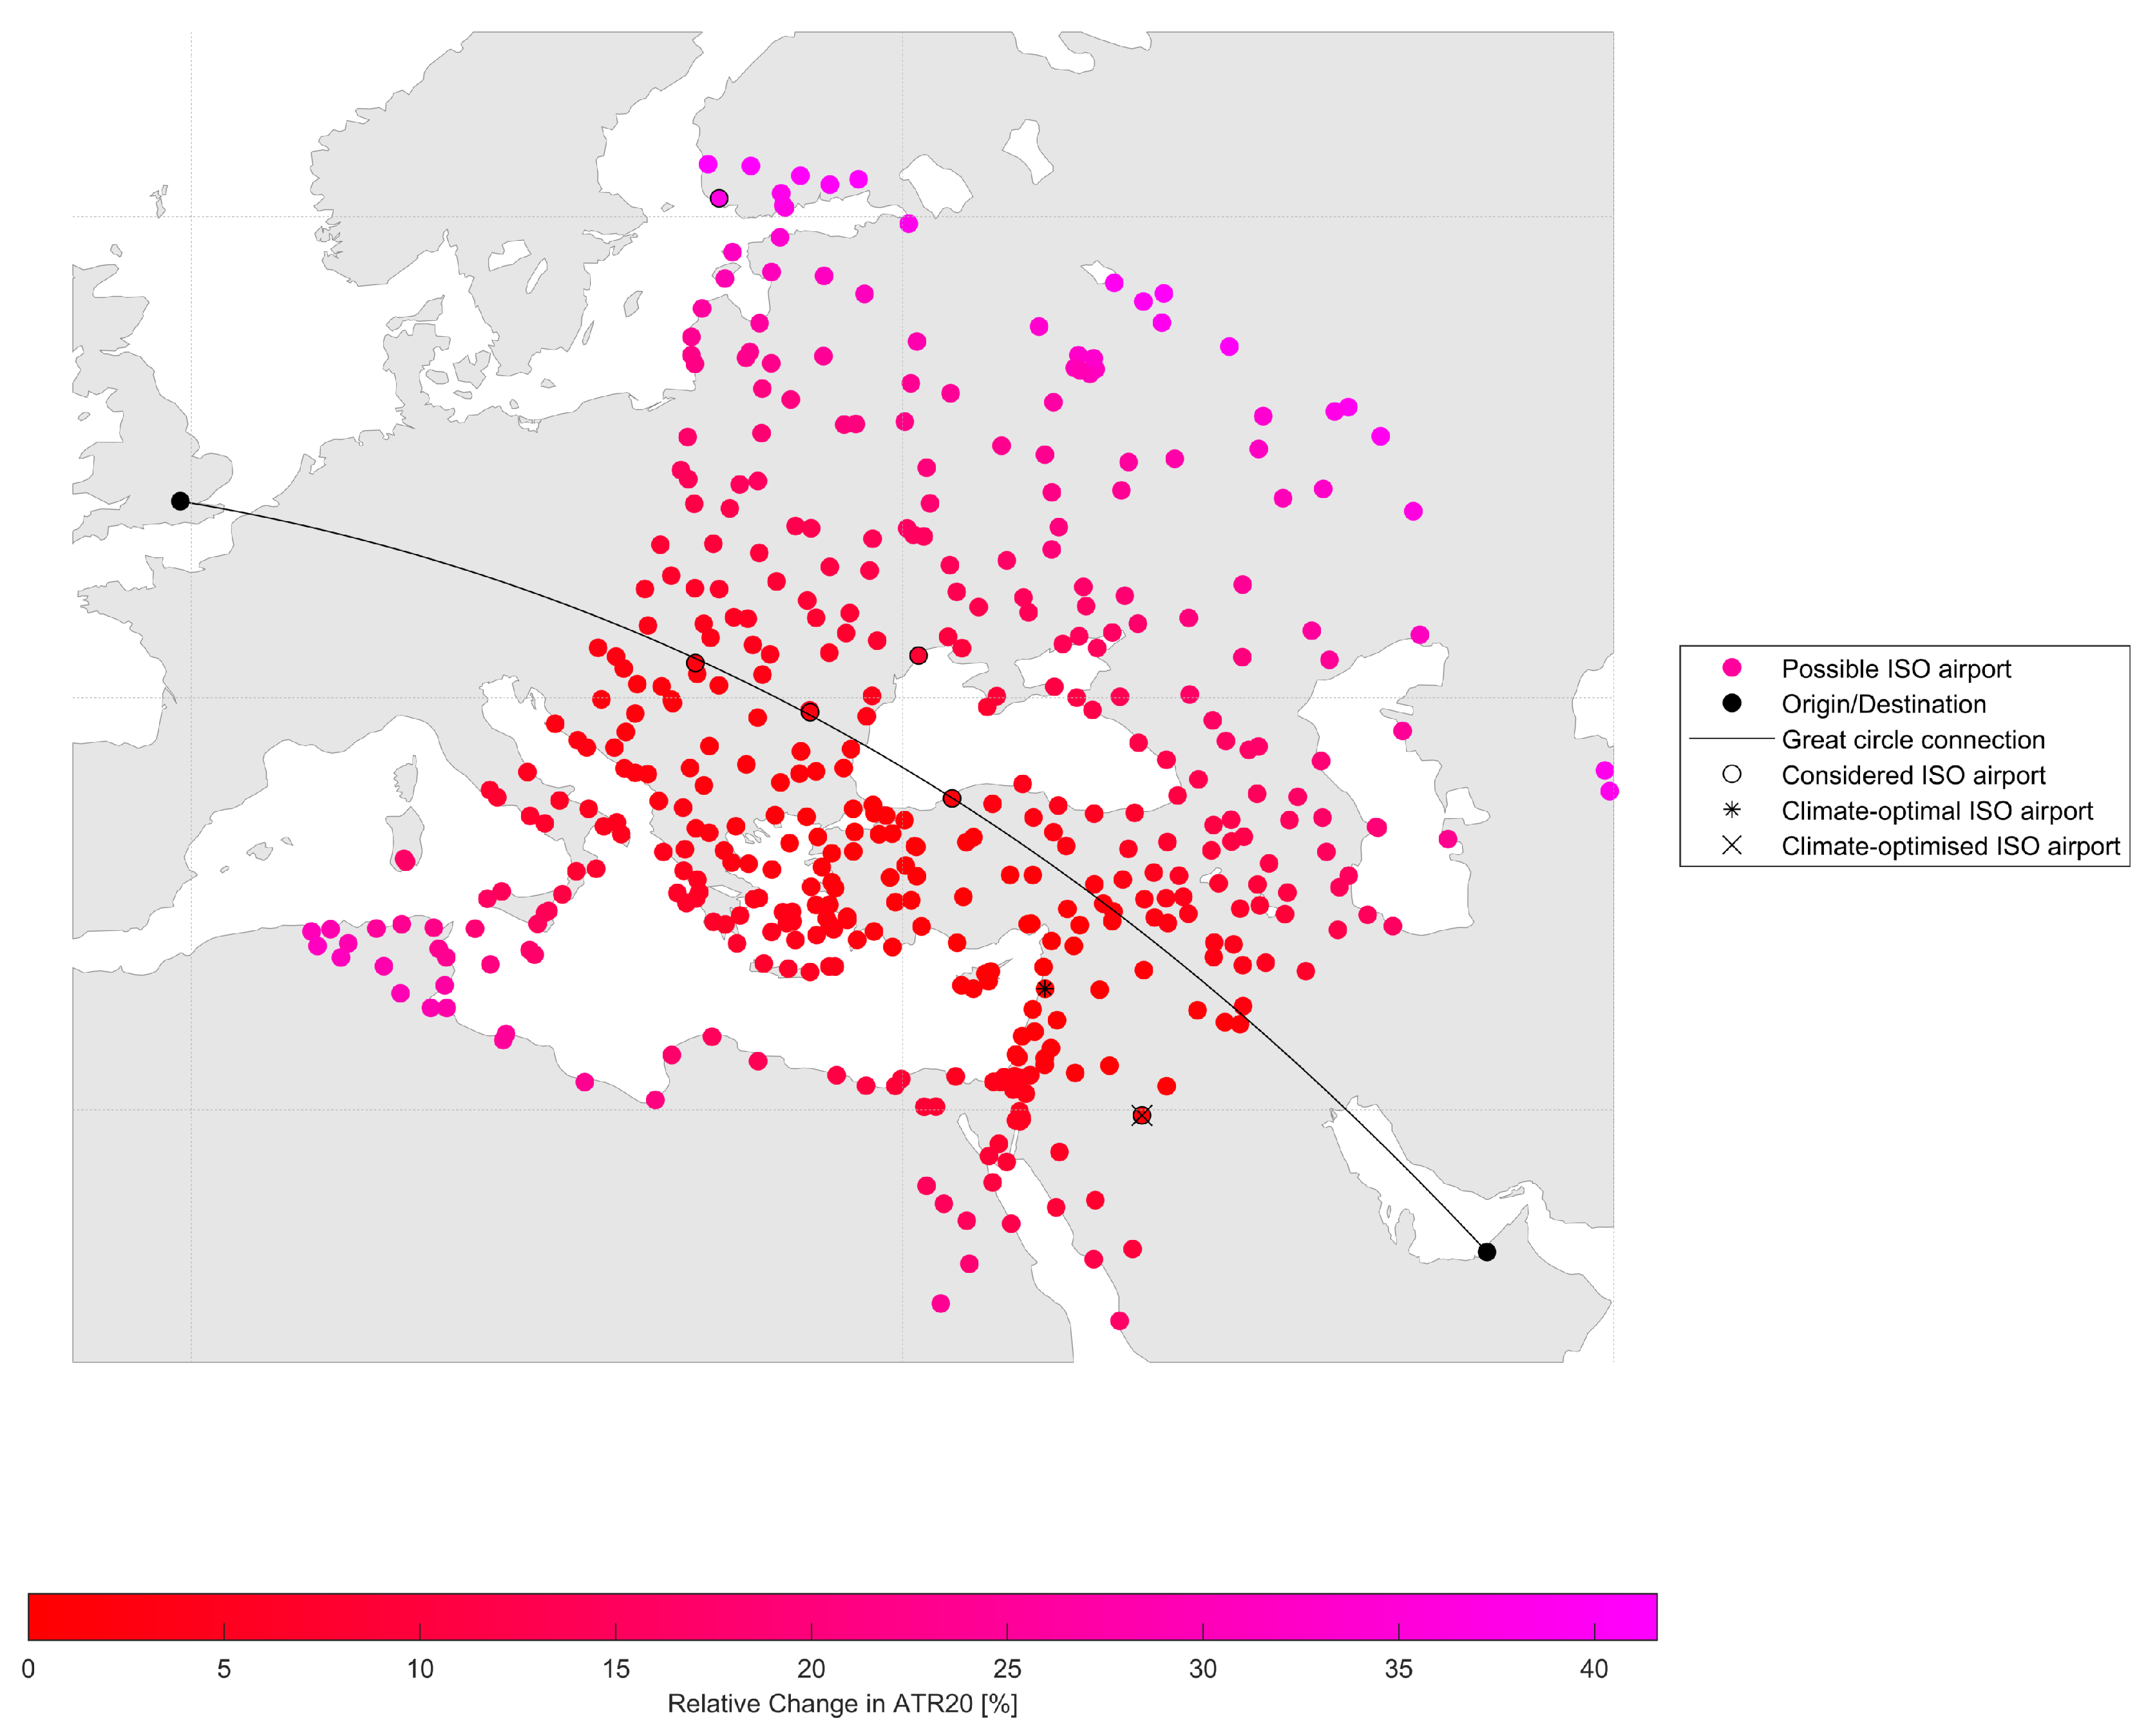
Due to the large number of missions and set of possible refuelling airports, we require to further reduce the amount of considered airports to improve calculation performance. For this purpose, we assign all possible airports to 30 × 30° grid cells, with an exemption in the Northern Hemisphere, where two grid cells are set between 30° and 60° North so that a higher resolution of 15° can be provided. From each grid cell, the airport candidate with the smallest detour related to the great circle is selected. By doing so, we may restrict mitigation potentials. It cannot be assured that the overall optimal airport is selected in every case. Therefore, we refer to the outcomes as optimised solutions instead of optimal solutions. By doing so, we consider 9.5 possible ISO connections per origin and destination combination on average. All considered airports are as displayed in
Figure 2. Due to the selection with regards to the predefined grid cells, we observe a distortion of considered airports towards the boarders of these grid cells. Nevertheless, the resulting deviation between optimal and optimised solution is estimated to be below 10%. Further details in that regard can be found in
Appendix A.
2.3. Trajectory Modelling
Flight performance characteristics are modelled along the individual trajectories of the flight samples with the DLR TCM [
26,
27]. Besides different considered refuelling airport candidates, we incorporate different flight levels to model the climate benefits from reduced cruise altitudes. The results build the basis for assessing emissions and climate impact metrics in the following.
Within the TCM, a set of simplified equations of motions (total energy model) is applied to model the aircraft’s speeds, accelerations, and altitude changes along the different flight phases from start to landing. With aircraft and engine performance data obtained from BADA4 as provided by EUROCONTROL [
25], trajectory characteristics, such as thrust and fuel flow as well as changes in aircraft state, can be modelled over discrete time intervals. Computationally efficient calculations for a large set of flights can be achieved by applying so-called reduced emission profiles: in this course, one-dimensional and non-georeferenced trajectories are calculated for every possible combination from a predefined set of aircraft type, payload, flight level and flight length. The resulting standardised trajectories in terms of altitude and fuel flow over flight distance and time are stored into a database and can be adjusted in the following to match every pair of origin and destination.
As we investigate an annual flight plan, specific airspace restrictions and meteorological conditions are excluded from the study. Instead, we apply average atmosphere conditions in terms of the international standard atmosphere (ISA) and exclude wind effects. Furthermore, we assume an average European load factor of 84% for the considered year of 2018 [
34].
2.4. Calculation and Gridding of Emissions
Emissions along the trajectories are estimated and converted to a numerical grid with GRIDLAB by DLR. Based on the reduced emission profiles resulting from the TCM, three-dimensional emission inventories are generated for each flight of the described traffic sample defined by origin, destination, aircraft type, flight level and intermediate stop airport candidate. For this purpose, the best-fitting reduced emission profile in terms of mission length is picked from the before-mentioned trajectory database for every flight. Afterwards, every trajectory is adjusted to the exact great circle distance between the two connected airports by extending or truncating the trajectory in the cruise phase. Airport elevation is also regarded by modifying the respective climb and descent profile within its phases with speed curtailments.
Emissions from taxiing and take-off are calculated following the standardised ICAO landing take-off cycle, assuming reference emission indices from the ICAO engine emission database in both idle and take-off mode and the respective reference fuel flow from the same database [
29]. Before take-off, on-ground emissions of engine running in idle mode for 19 min are added for taxiing out, followed by 42 s in engine take-off mode. After landing, emissions of 7 min in idle mode are attached, representing taxiing in.
In-flight emissions are calculated as follows before they are projected on the great circle between the connected airports and distributed spatially on a numerical grid:
CO
and H
O emissions are assumed to be linear to fuel burn [
28].
NO
x emissions are simulated with the non-proportional fuel flow correlation method by DLR [
28] with the reference emission indices for engines obtained from the ICAO engine emission database [
29].
The sulphur dioxides (SO
) emission index varies regionally according to fuel sulphur content [
35].
Hydrocarbons (HC) and carbon monoxide (CO) emissions are derived with the Boeing fuel flow correlation method [
36] with reference emission indices for engines as provided by ICAO engine emission database [
29].
Soot emission calculations are based on the ICAO smoke number using reference values from the engine emission database [
29], applying a method by DLR [
37] to derive the soot emission index. An extrapolation beyond the landing take-off cycle to the cruise phase is performed with the P3-T3 correlation [
38].
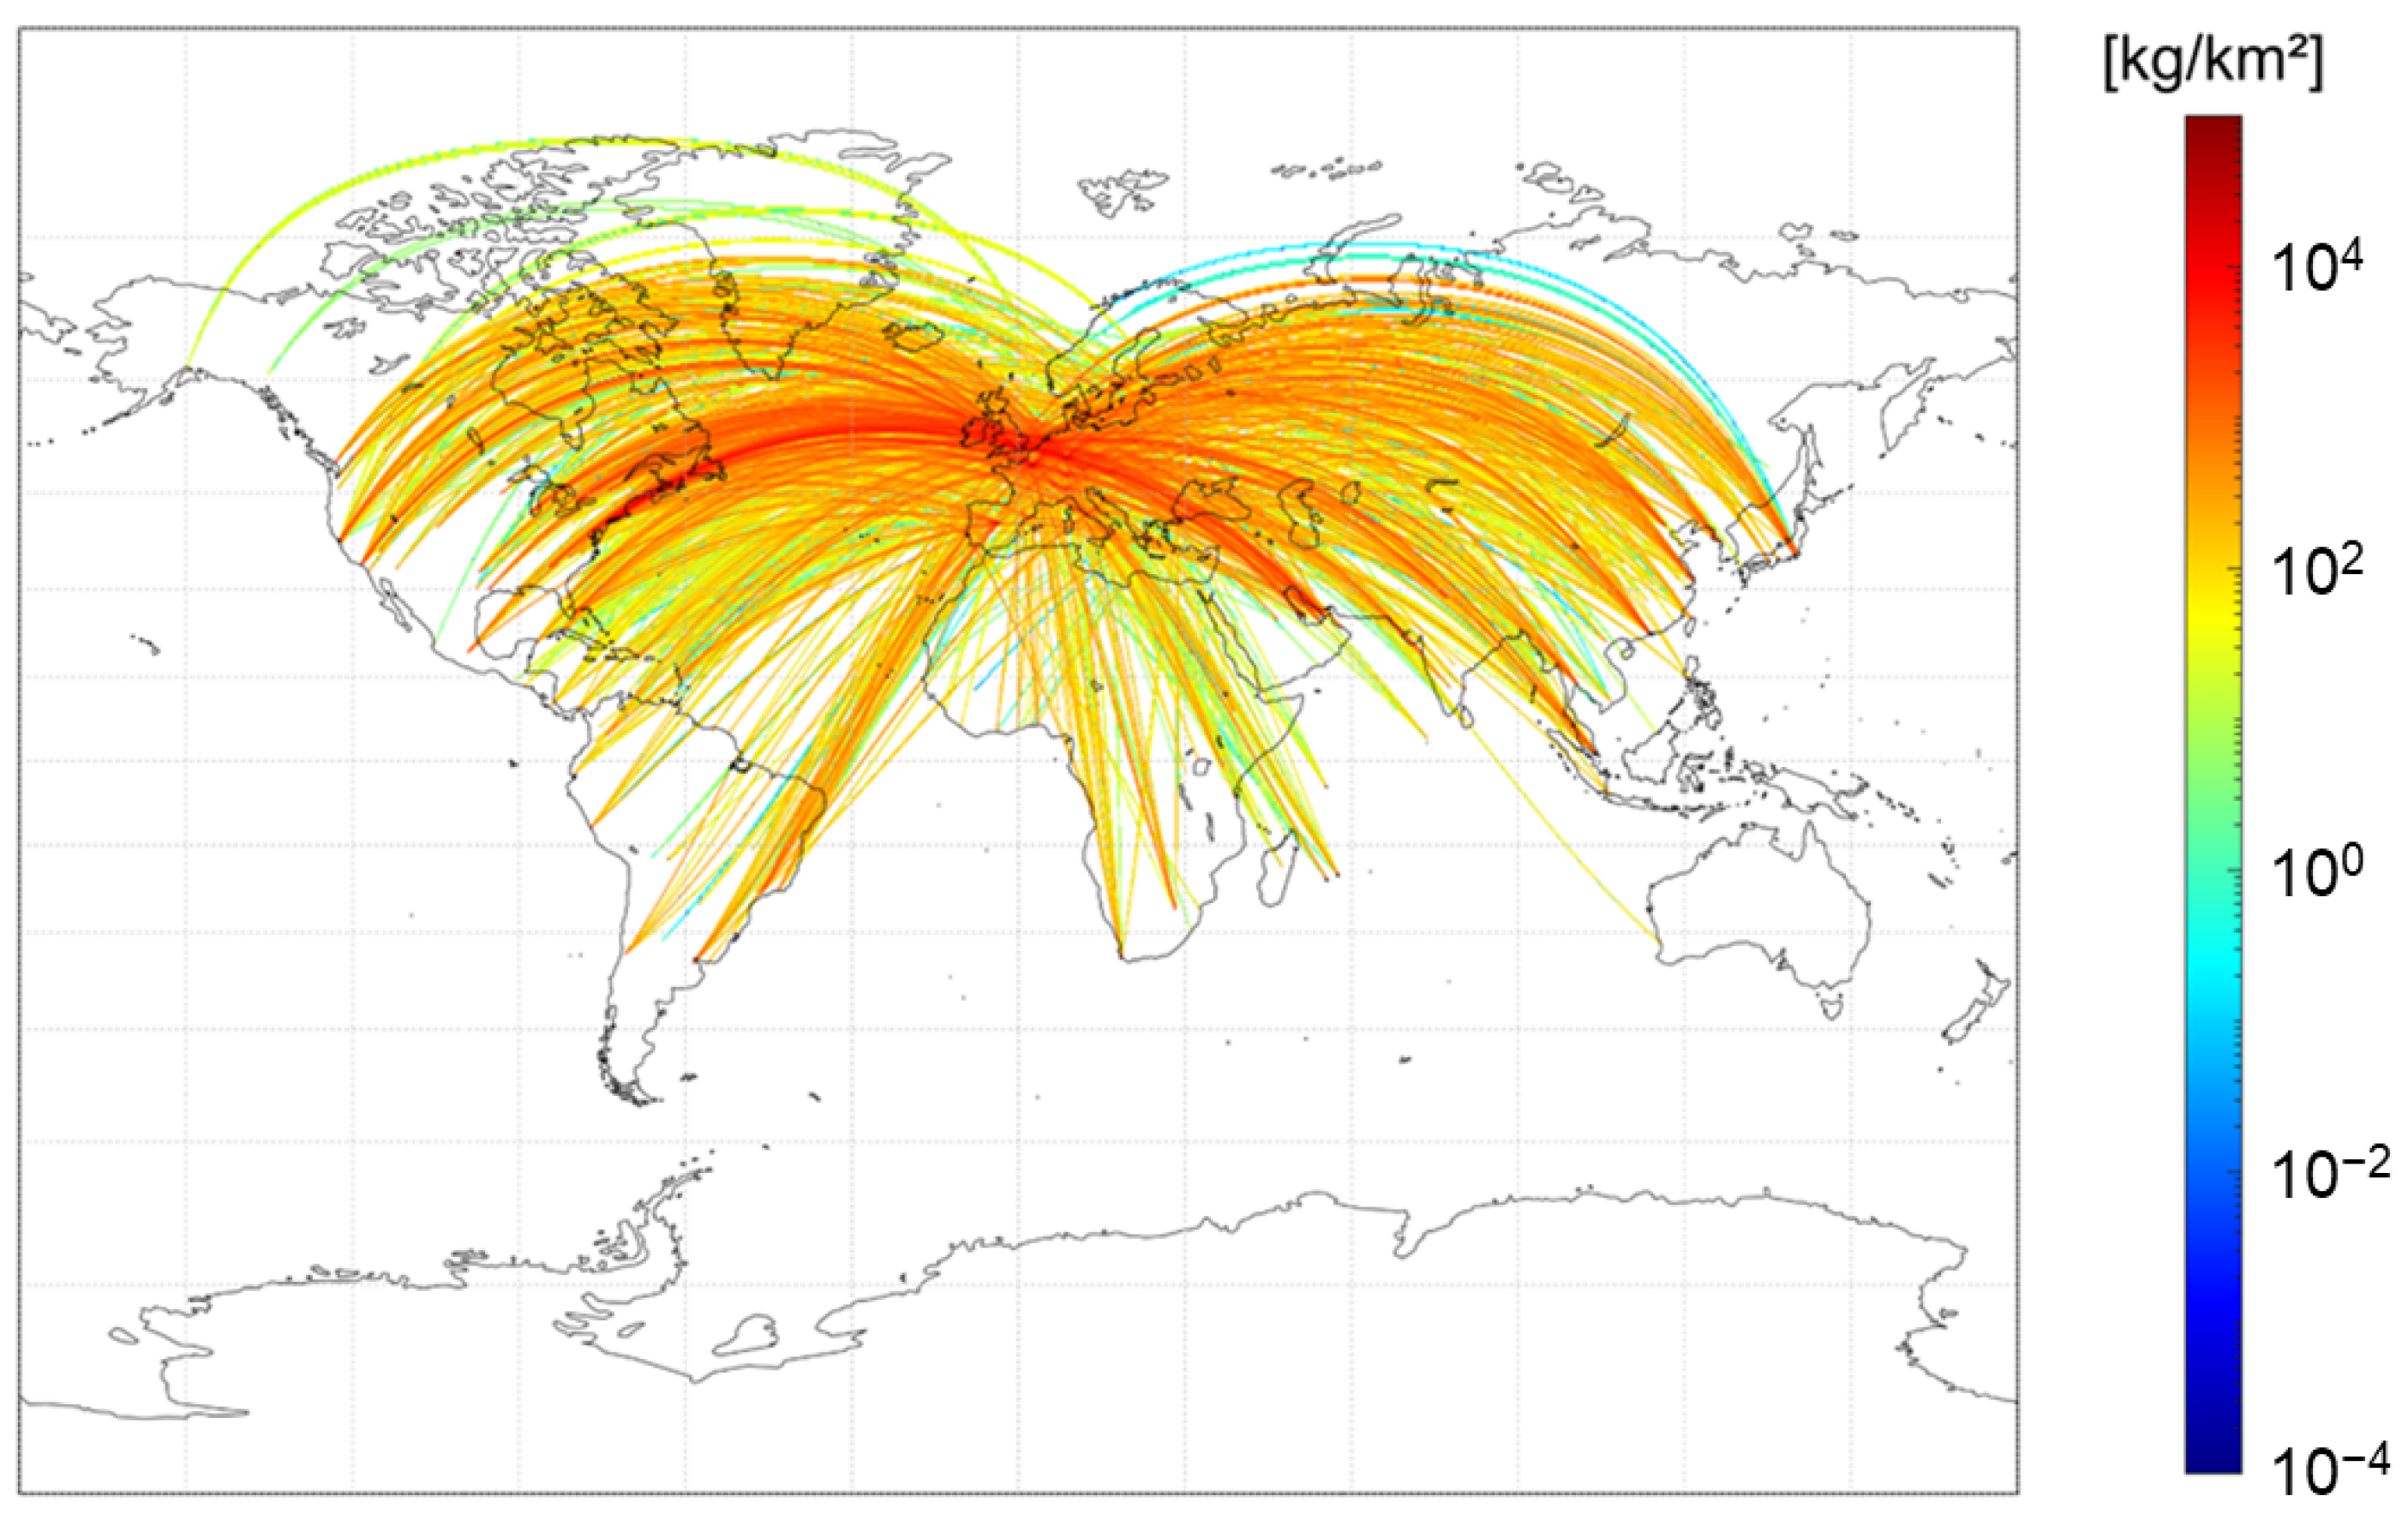
Resolution of the resulting grid per mission is 0.25° both latitudinally and longitudinally and 1000 ft vertically. An exemplary resulting fuel consumption inventory of this study’s reference case and the fuel-optimised ISO scenario is displayed in
Figure 3.
2.5. Climate Impact Simulation
Based on the spatial distribution of emissions, the climate metrics are calculated with AirClim [
30,
31]. AirClim is a non-linear climate-chemistry response model to simulate the climate impact resulting from flight emissions. In this context, changes in radiative forcing (RF) directly caused by CO
and H
O as well as indirect effects from contrail cirrus and changes in methane (CH
) and ozone (O
) induced by NO
x emissions are considered. These are described as a function of latitude and altitude as well as longitude for contrail cirrus and were pre-calculated for normalised emissions. In this context, a climatological approach is chosen, i.e., the climate impact is calculated for an average weather situation. This is in line with the assumptions taken above, such as an exclusion of day-specific weather patterns with the consideration of ISA and an aggregation of the results for the full year of 2018.
We aim to address the question of how the climate impact of long-haul flights can be reduced in the long-run with an implementation of the ISO concept. Therefore, we focus our analysis on ATR20 and ATR100, representing the average near surface temperature change over 20 and 100 years. This climate metric reduces the dependence of the time horizon by, at the same time, incorporating the dynamics of the Earth climate system [
39,
40,
41]. We apply a future-emission-scenario-based ATR that incorporates future traffic and technology developments [
39]. To do so, we include up-to-date background emissions from aviation as described by the business-as-usual scenario in Grewe et al. [
3]. An annual fuel efficiency gain due to technology improvements is included, while carbon offsetting efforts and additional specific aims regarding the climate impact are not considered. For the development of background emissions in terms of CO
and CH
, we apply Representative Concentration Pathway 4.5 that describes an intermediate scenario with a resulting RF of 4.5 Wm
in the year 2100 [
42].
In a first step, the GRIDLAB results in terms of longitude, latitude, altitude, fuel burn, NOx emissions, and the aggregated distance for the derivation of contrail effects are fed into AirClim for every individual flight mission to simulate ATR20 and ATR100. We assume an implementation of ISO in 2025, which marks the start of the simulations. Hence, ATR100 is modelled over the period of 100 years until 2125. Subsequently, we identify the optimal combination of flight level and refuelling airport for the different scenarios. In a second step, emissions of the aggregated reference scenario and the climate-optimised ISO flight plan are analysed with AirClim. In doing so, the saturation effects can be considered, and the full potential of this operational measure can be calculated more realistically compared to a linearisation of effects.
3. Results
The results of this study are presented as follows: the full climate mitigation potential of ISO is evaluated (
Section 3.1) before a comparison to its fuel-optimised counterpart is performed (
Section 3.2). In this context, the effect of intermediate stop airport location (
Section 3.2.1) as well as different flight levels are investigated (
Section 3.2.2). Finally, both optimisation set-ups are coupled to analyse eco-efficient operations in
Section 3.3.
3.1. Climate-Optimised Intermediate Stop Operations
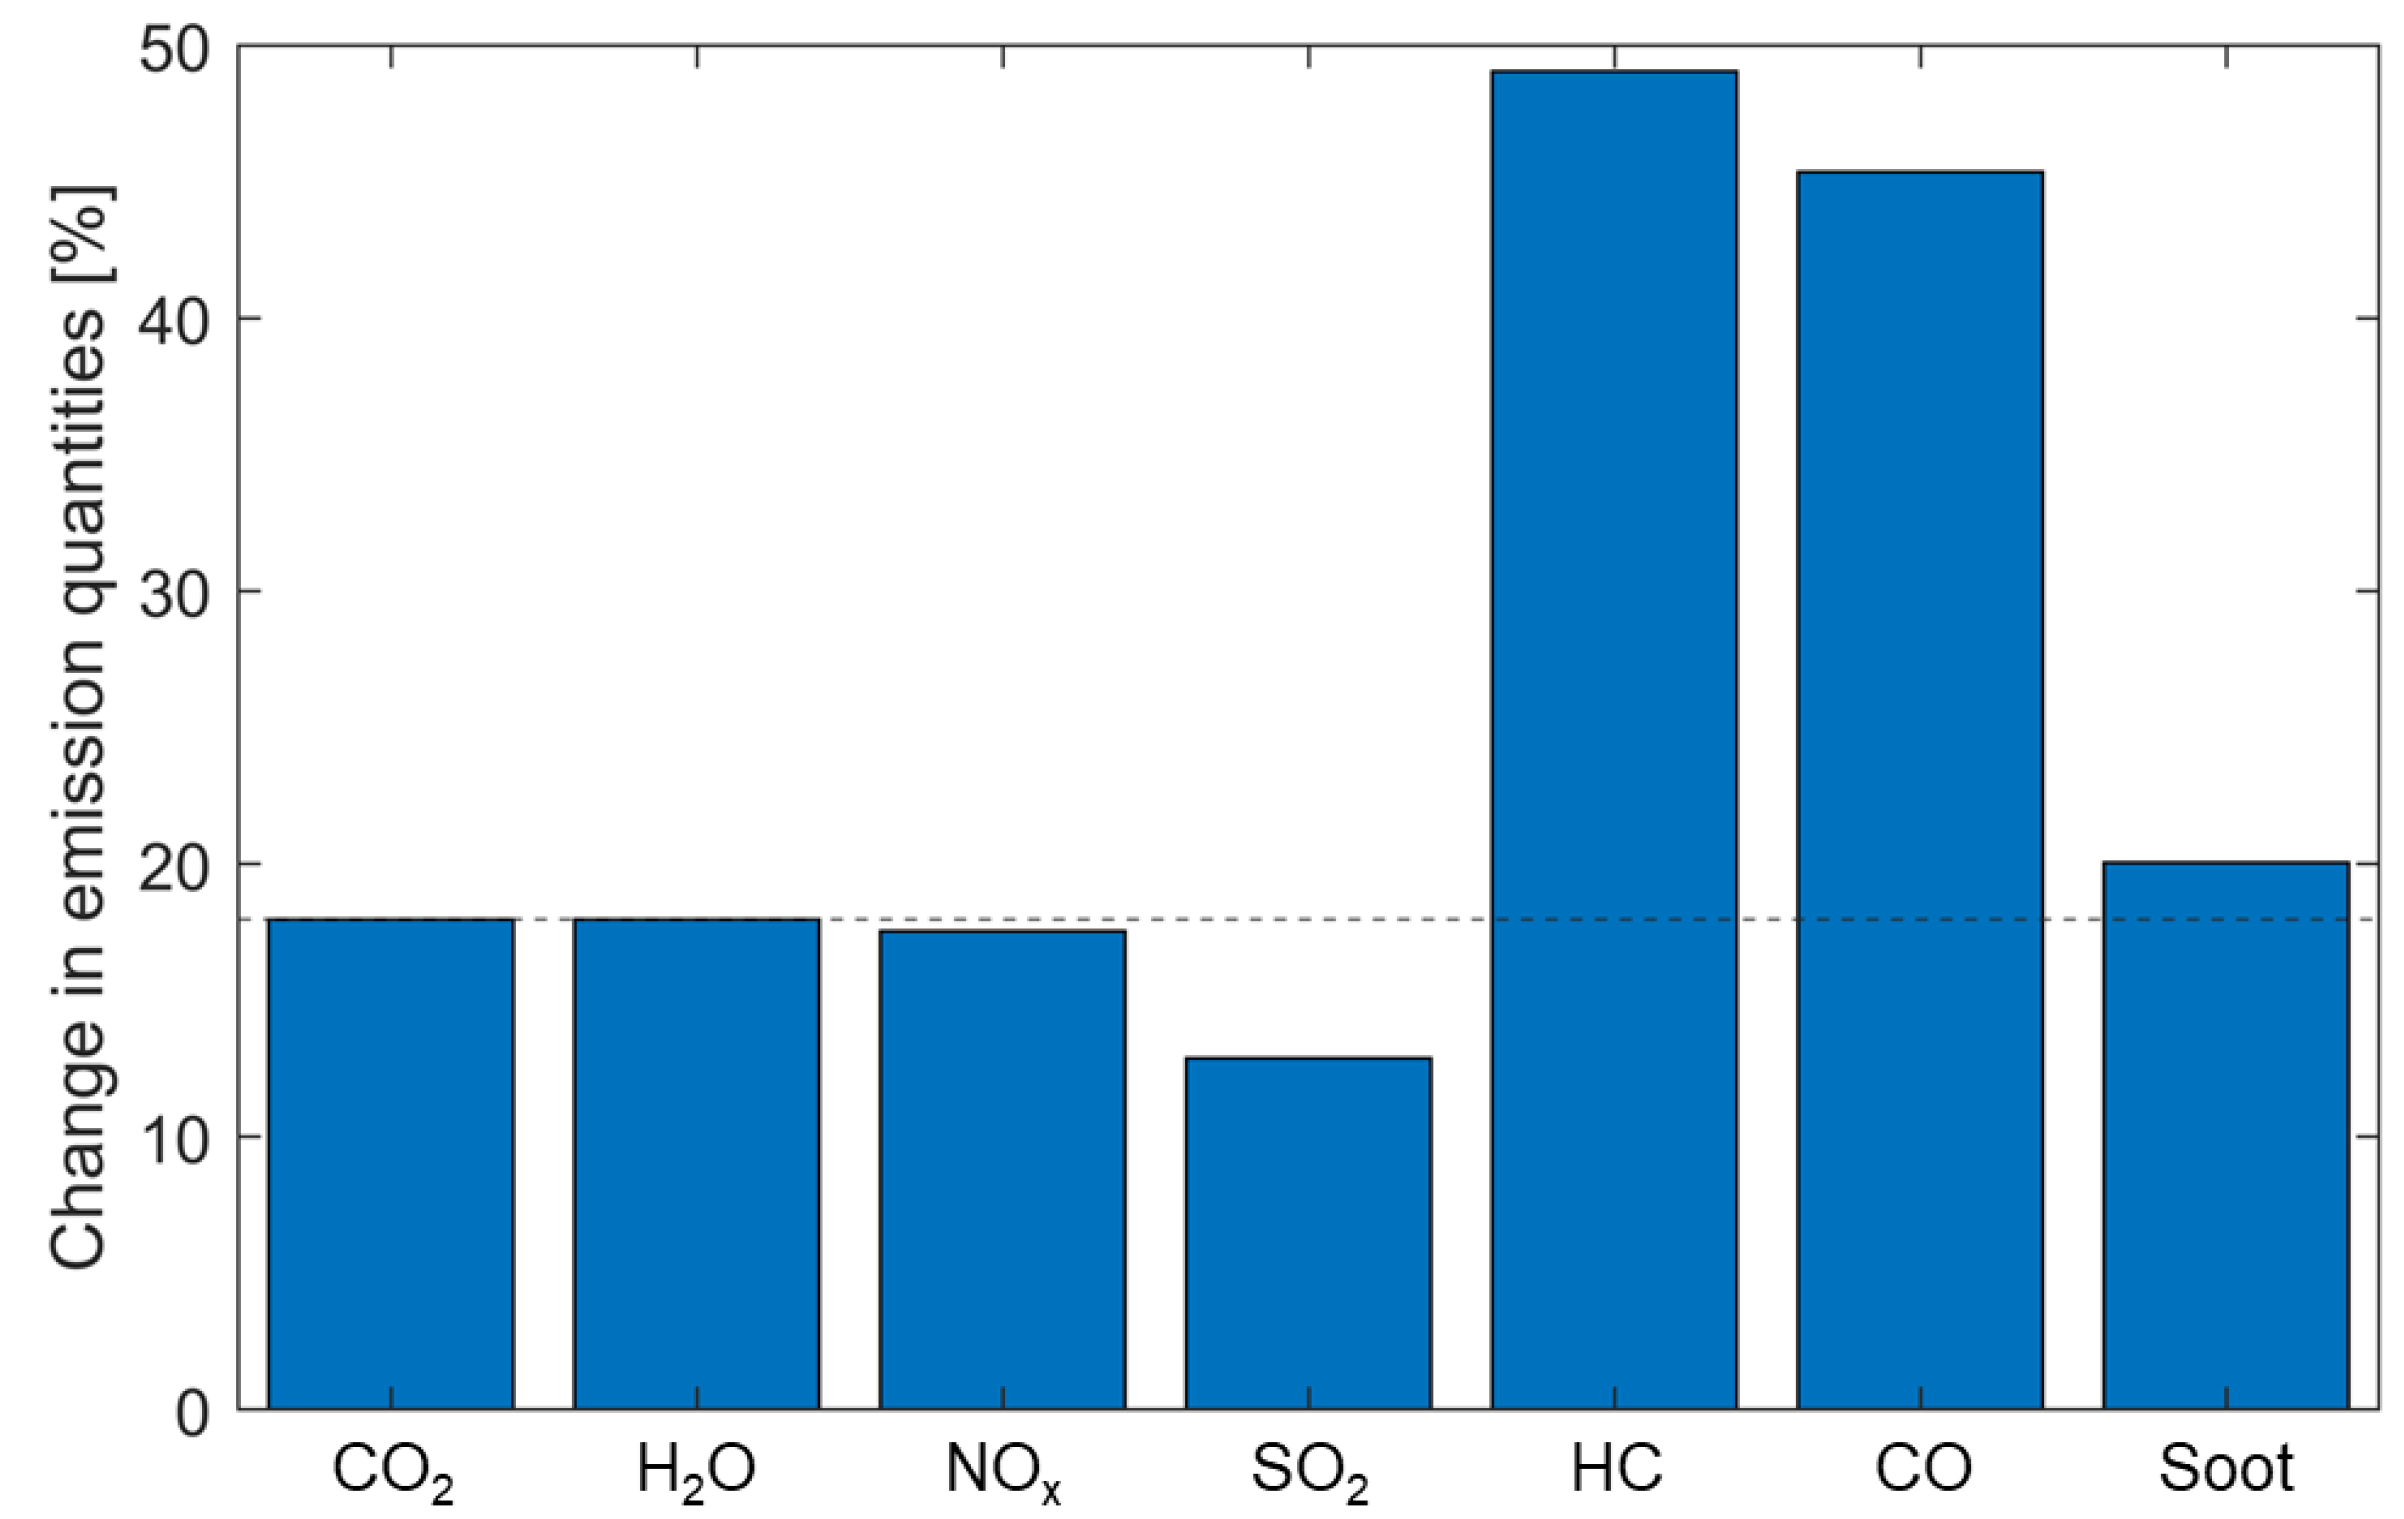
A minimisation of the climate impact was performed by selecting the optimal combination of ISO airport and flight level from the available set of simulated configurations. For almost all of the flights (99.98%), an improvement of the climate impact can be achieved by introducing the ISO concept. In this course, the average flight length of a mission increases moderately (+3.58%), while the duration of the average mission is extended by almost 10% (+9.57%). The amount of required fuel also rises significantly by 17.96%. Emission quantities change as displayed in
Figure 4. CO
and H
O emissions rise proportionally with the additional fuel consumption (+17.96%) compared to the reference case, but NO
x and SO
increase to a lesser extent. While NO
x emission indices vary with the different flight phases and altitudes, SO
emissions mainly depend on the sulphur content of the fuel, which varies geographically and is influenced by re-locating refuelling locations through ISO. HC and CO emissions quantities rise disproportionally due to the additional on-ground times caused by the refuelling stop.
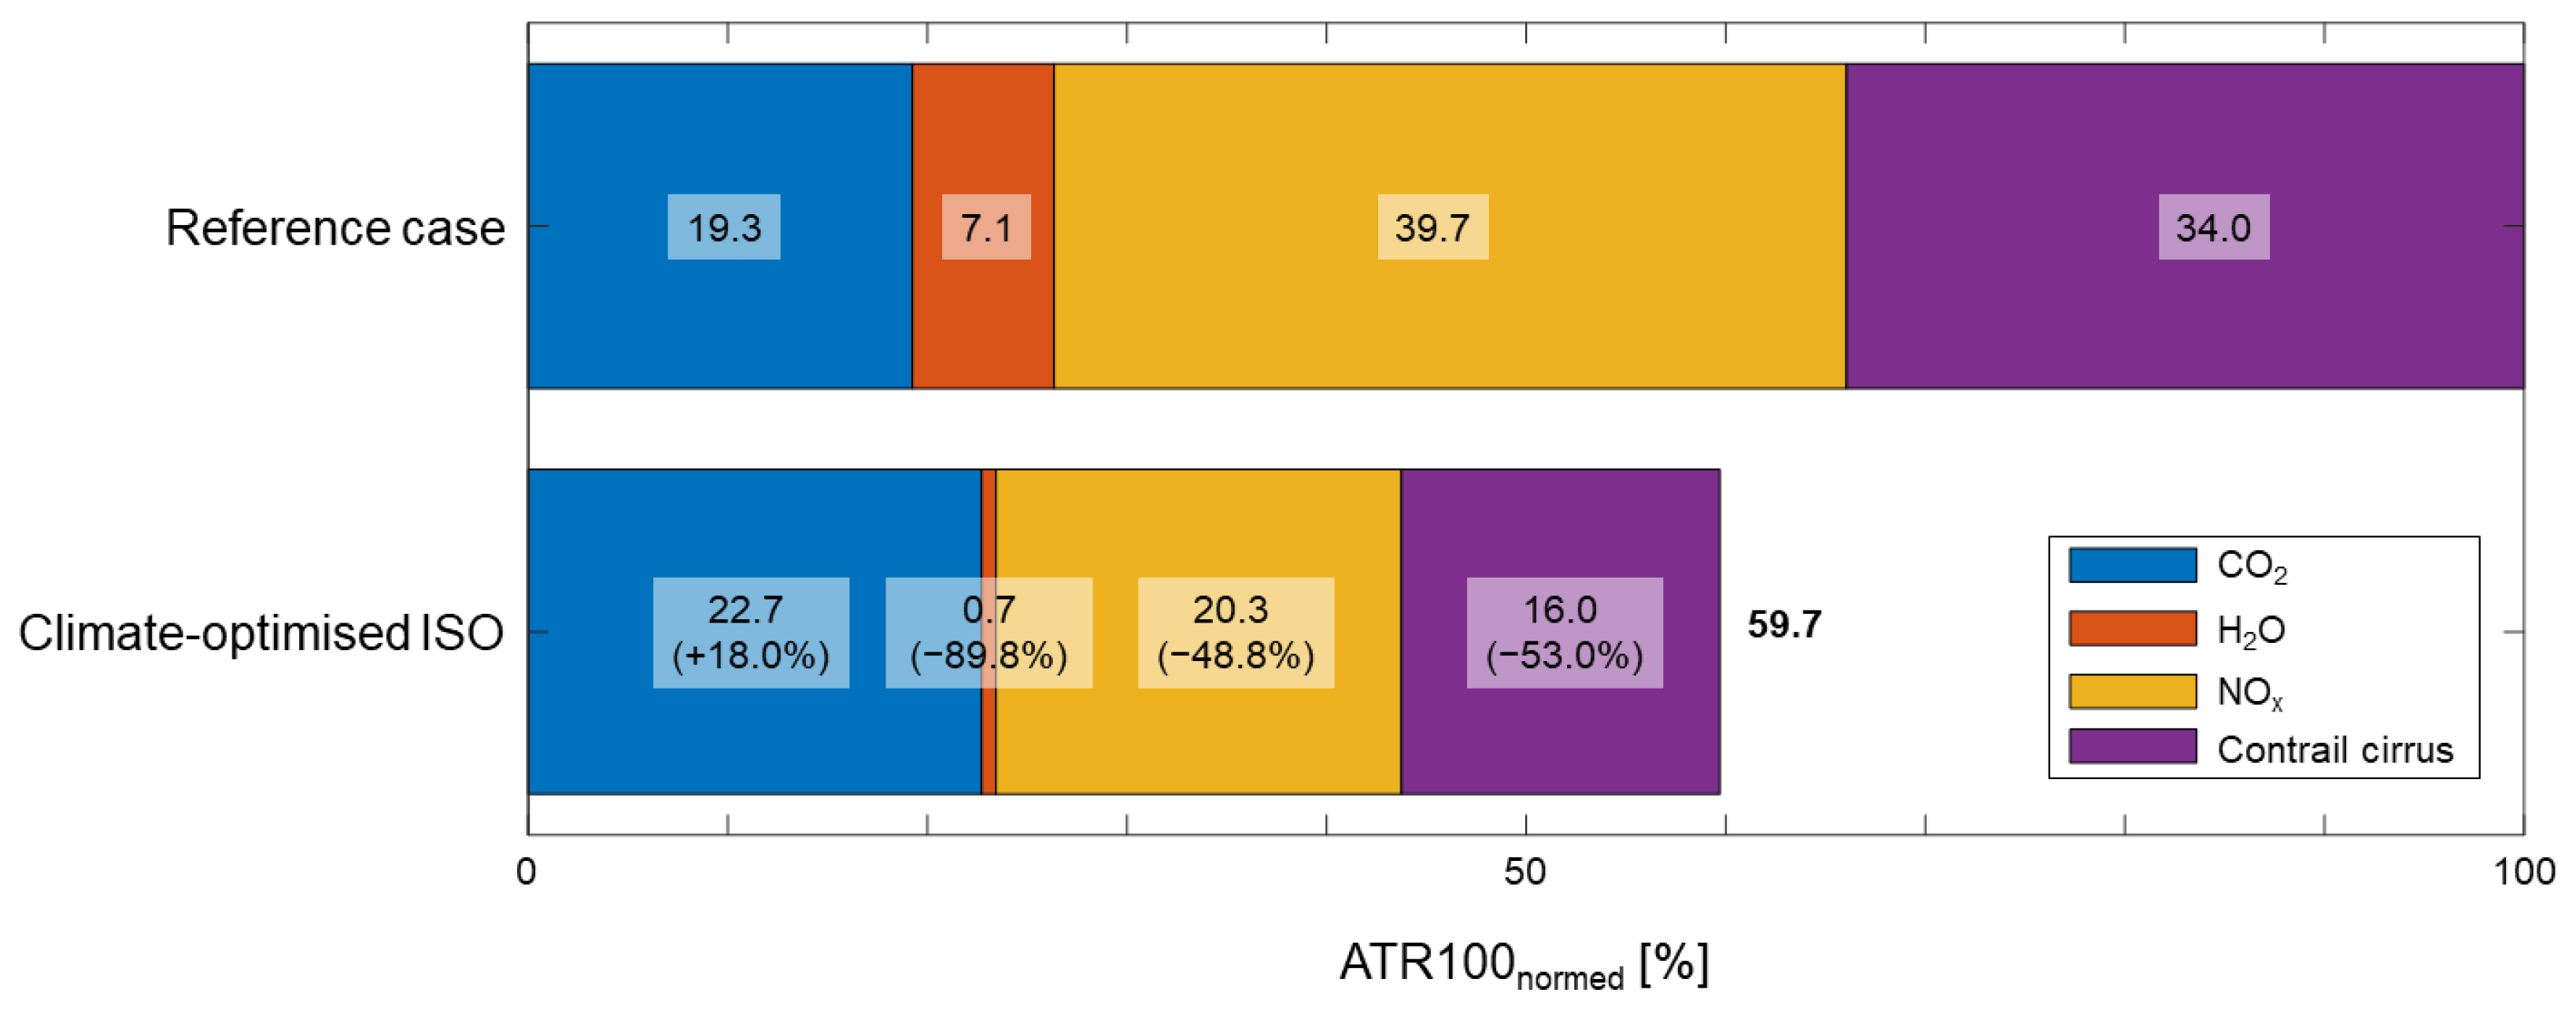
Despite the changes in emissions, a mitigation potential of up to 40.3% in ATR100 (38.9% in ATR20) can be achieved with the climate-optimised ISO concept in comparison to the reference case for an average flight of the investigated sample.
Figure 5 illustrates changes in ATR100 caused by the implementation of climate-optimised ISO. We confirm that the resulting increase in ATR100 caused by additional CO
emissions proportional to the rise in fuel consumption is overcompensated by the reduction in the impact of all non-CO
effects. This is caused by changed emission locations both horizontally and vertically. Consequently, the climate impact of contrail cirrus is reduced by 53.0%, and the aggregated impact induced by emissions of NO
x is reduced by 48.8%. The small contribution of H
O decreases by almost 90%.
Generalising the analysis from individual flights to an investigation of the full flight sample, we incorporate changes in background emissions and saturation effects with regards to contrail cirrus. By doing so, we confirm significant mitigation potentials if ISO is implemented where it reduces ATR. The mitigation potential is estimated to be between 38.3 and 42.0% for ATR100 (36.9 to 40.3% for ATR20).
3.2. Comparison of Climate- and Fuel-Optimised Configurations
Table 1 summarises the major differences between the fuel-optimised and the climate-optimised set-up of ISO compared to the non-stop reference. The comparison reveals the following major differences with regards to the share of beneficial ISO missions, distance and flight time as well as fuel consumption and emissions. An implementation of the ISO concept with the set boundary conditions in terms of possible flight level and airports is beneficial for approximately half of all missions from a fuel-optimising perspective (48.23%), while climate impact can be reduced for almost all missions (99.98%). Fuel-optimised ISO starts to come into effect at stage lengths of 6300 km and above, while it can be beneficial from a climate-perspective for all observed flight lengths. Moreover, it has to be noted that this is not only due to an implementation of the ISO concept itself, but also due to the considered reduction in flight altitudes in the climate-optimised set-up.
In the fuel-optimised context, we observe small additional flight distances due to a preference of intermediate stop airports associated with minimum detour and eccentricity. An intermediate refuelling stop is only performed in those cases where an airport with a small detour is available, so that we see an average detour of 0.04%. By contrast, the climate-optimised set-up accepts higher detour (on average + 3.58%) and eccentricity parameters associated with the selected intermediate stop airports if, in turn, climate-sensitive areas can be avoided. While in the fuel optimised set-up, approximately two thirds (63.5%) of all ISO missions are associated with an offset factor below 0.575, we observe a broader distribution for the climate-optimised ISO flights (22.5% below 0.575 offset factor). Consequently, we observe longer flight times in the climate-optimised case due to larger detours as well the higher share of intermediate landings and the associated on-ground times.
With ISO, fuel consumption can be reduced by 1.9% for the sample of this study. This also reduces total emission quantities for CO, HO, and NOx. Restricting the analysis to missions where ISO is beneficial from a fuel-efficiency perspective, fuel consumption can be decreased by 3.2%. Conversely, the required fuel and emission quantities increase for the climate-optimised scenario caused by longer flight distances and reduced cruise altitudes.
The climate impact in terms of ATR100 increases by 0.64% in the fuel-optimised case, although overall emission quantities decrease. ATR20 changes equivalently (+0.61%). This can be explained with higher emission altitudes. Therefore, climate impact from non-CO emissions rises in comparison to the non-stop reference case: in particular, climate impact induced by nitrogen oxides rises (+2.8% in ATR100) as well as water vapour, (+11.7%) and this overcompensates the reduction caused by decreased CO emissions (−1.9%) and contrail cirrus (−2.7%).
In addition to the above-mentioned points, the location of intermediate stop airports as well as the selected cruise flight level vary significantly between the fuel-optimised and climate-optimised scenarios. This impacts the resulting mitigation potentials.
Figure 6 shows the zonal and vertical distributions of CO
emissions for both cases. A shift to lower altitudes and latitudes by the climate optimisation is hypothesised and further analysed in the following.
3.2.1. Location of Intermediate Stop Airport
Climate and fuel-optimised refuelling airports per mission are identical for a small share of all investigated missions (6.9% of all flights, 14.3% of all flights with fuel efficiency gains through ISO). Besides the detour and offset factors associated, also the absolute position of the selected airport varies between both cases. A more detailed analysis of the resulting routes and their locations in
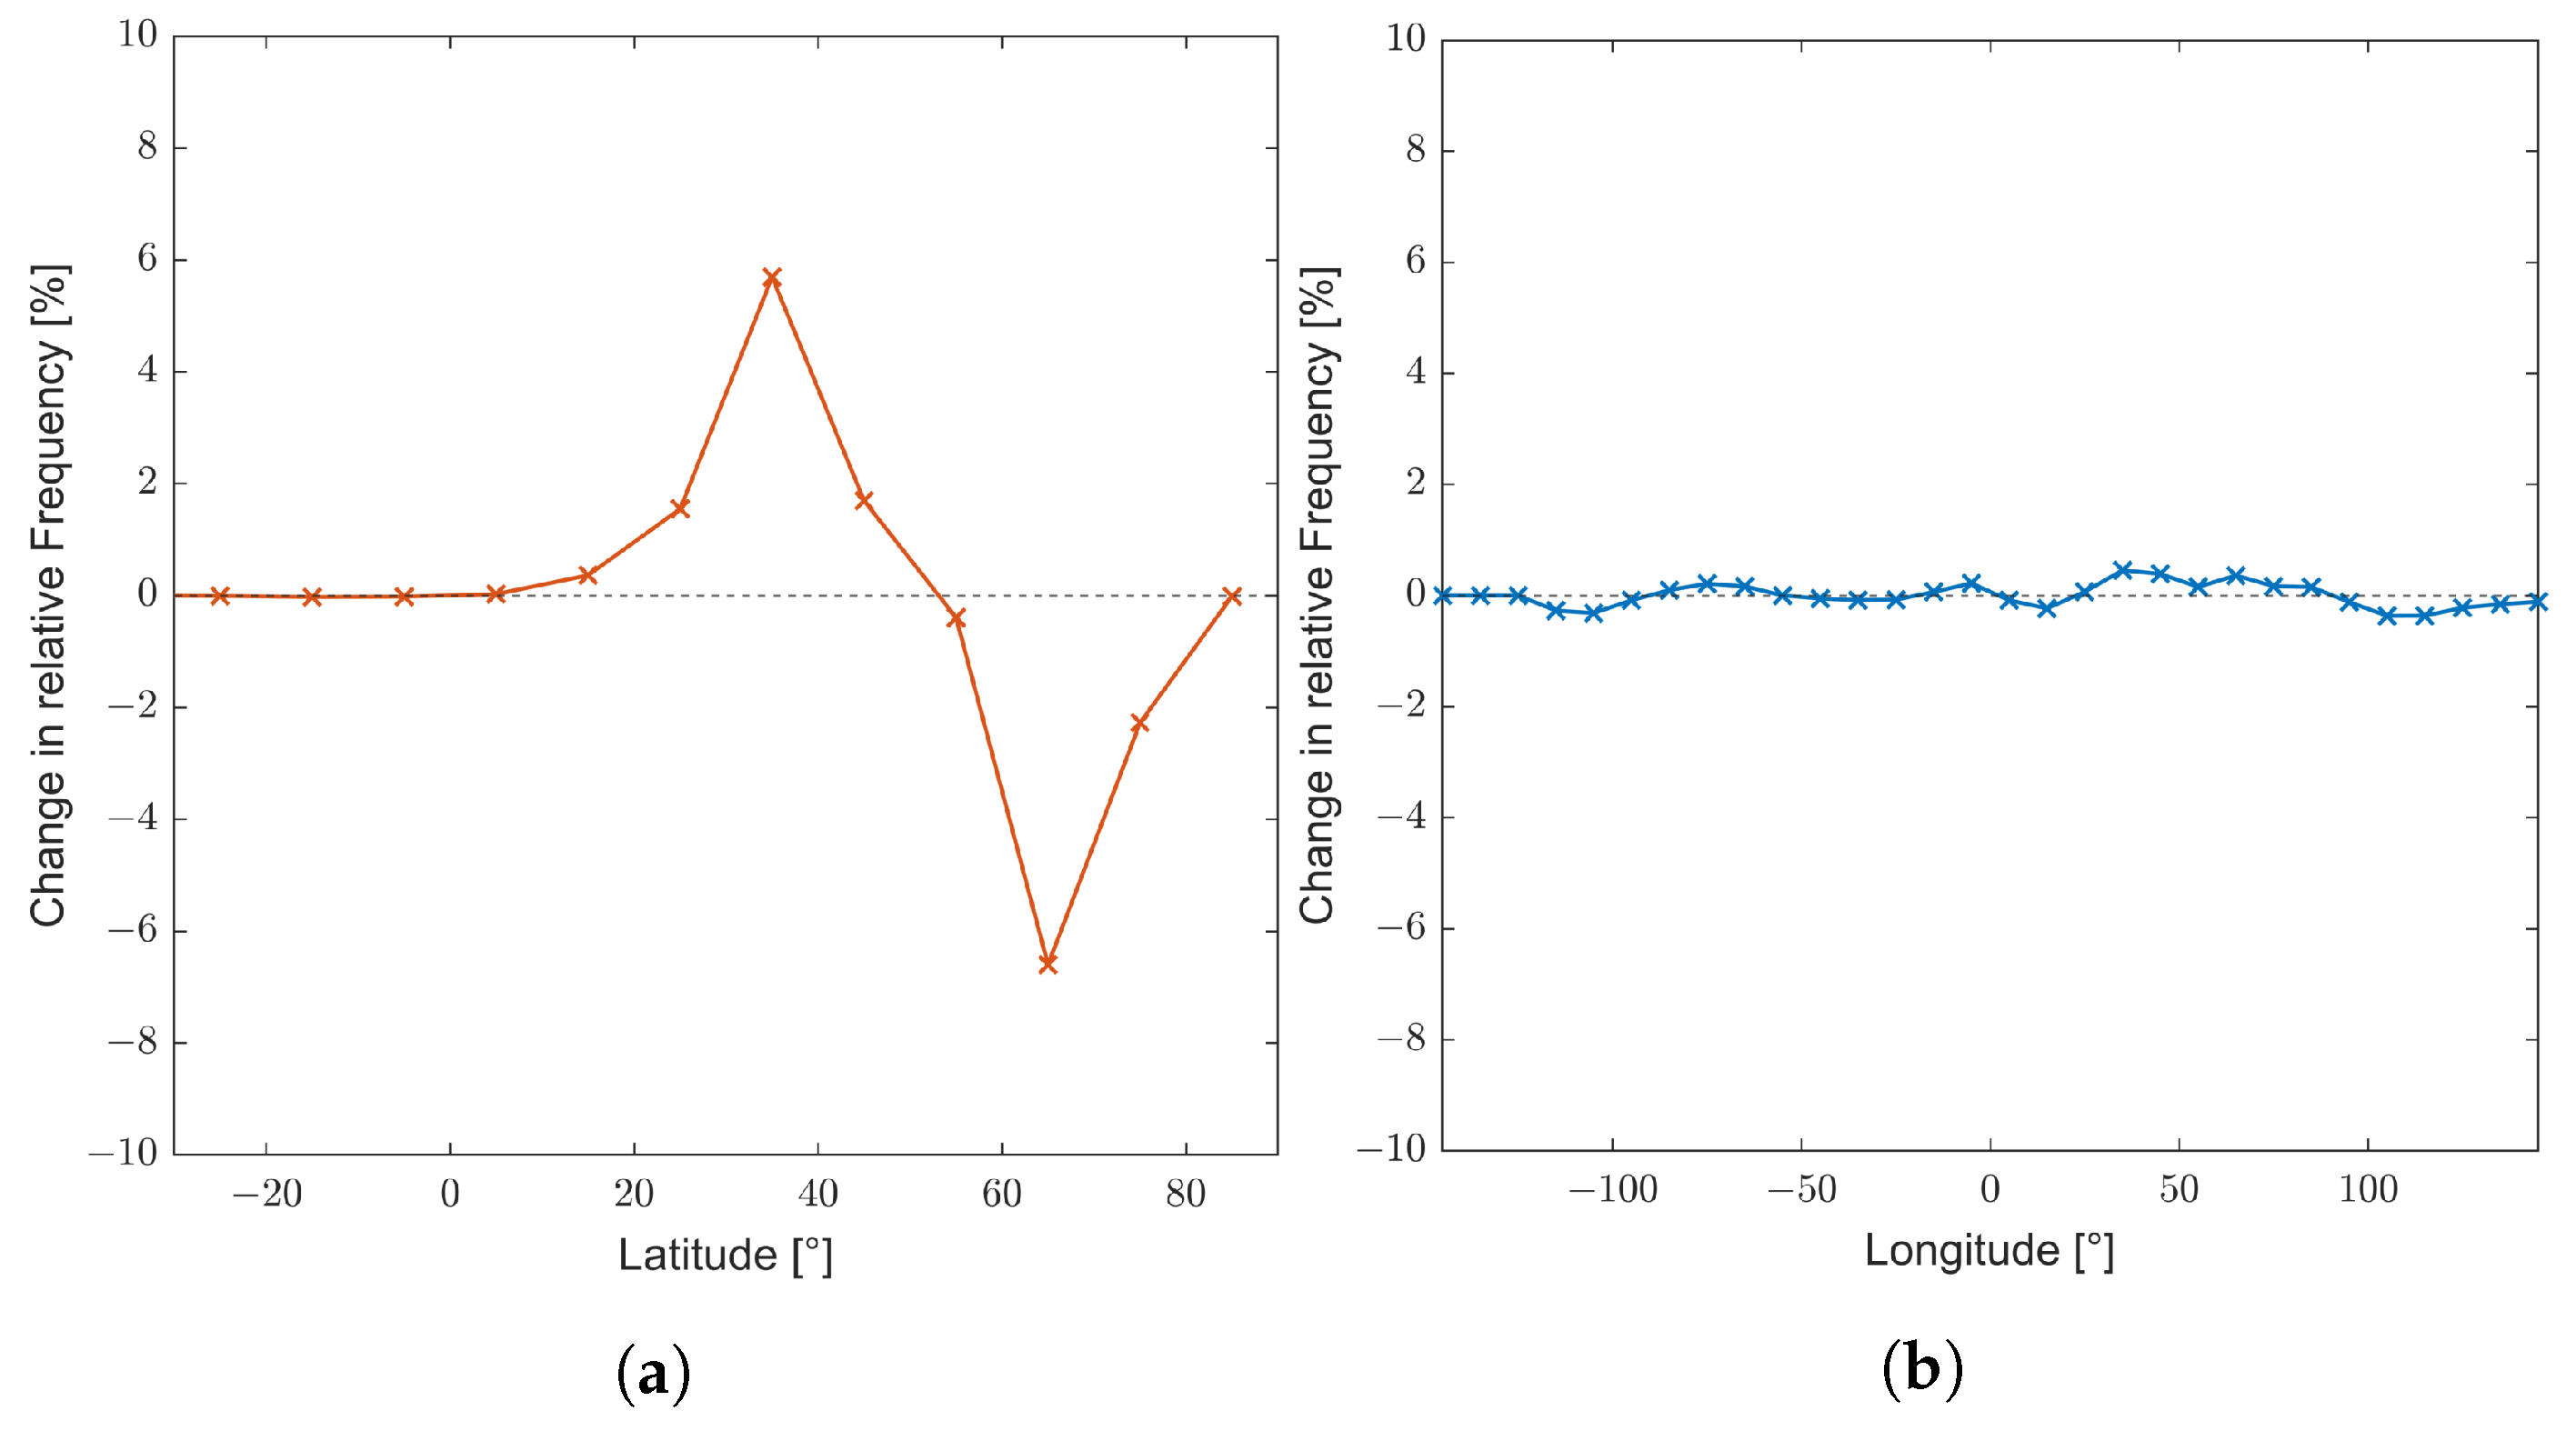
Figure 7 confirms the hypothesised relation: the latitudes of the fuel-optimised ISO set-up are generally shifted towards the northern polar region, while mid-latitudes are preferred in the climate-optimised case. On a longitudinal scale, in general, smaller and fluctuating changes can be observed.
Figure 8 illustrates the location of preferred refuelling airports for the fuel-optimised and the climate-optimised ISO scenario. Refuelling airports in the climate-optimised context are more broadly distributed, and the additional number of take-offs and landings is below additional 20% per grid cell in most cases. For instance, we observe a large number of additional stops on the Arabian peninsula (126,211 additional take-offs and landings in this grid cell), which is associated with a relative increase of 5.8% in the grid cell. Furthermore, a high load is identified in the Newfoundland area caused by North Atlantic flights as well as in the Middle East region from South-East Asian flights. The two grid cells with the largest relative additional utilisation are located between 30 and 60° N latitudinally and between 30 and 60° E longitudinally. In these cases, take-offs and landings in these cells are more than doubled. In contrast to the climate-optimised case, we find higher peaks in individual grid cells relative to the current number of take-offs and landings for the fuel-optimised scenario. Consequently, adjustments in infrastructure would be required to make these regions capable of handling the additional amount of flights, independent of the selected ISO set-up.
3.2.2. Impact of Reduced Cruise Altitudes
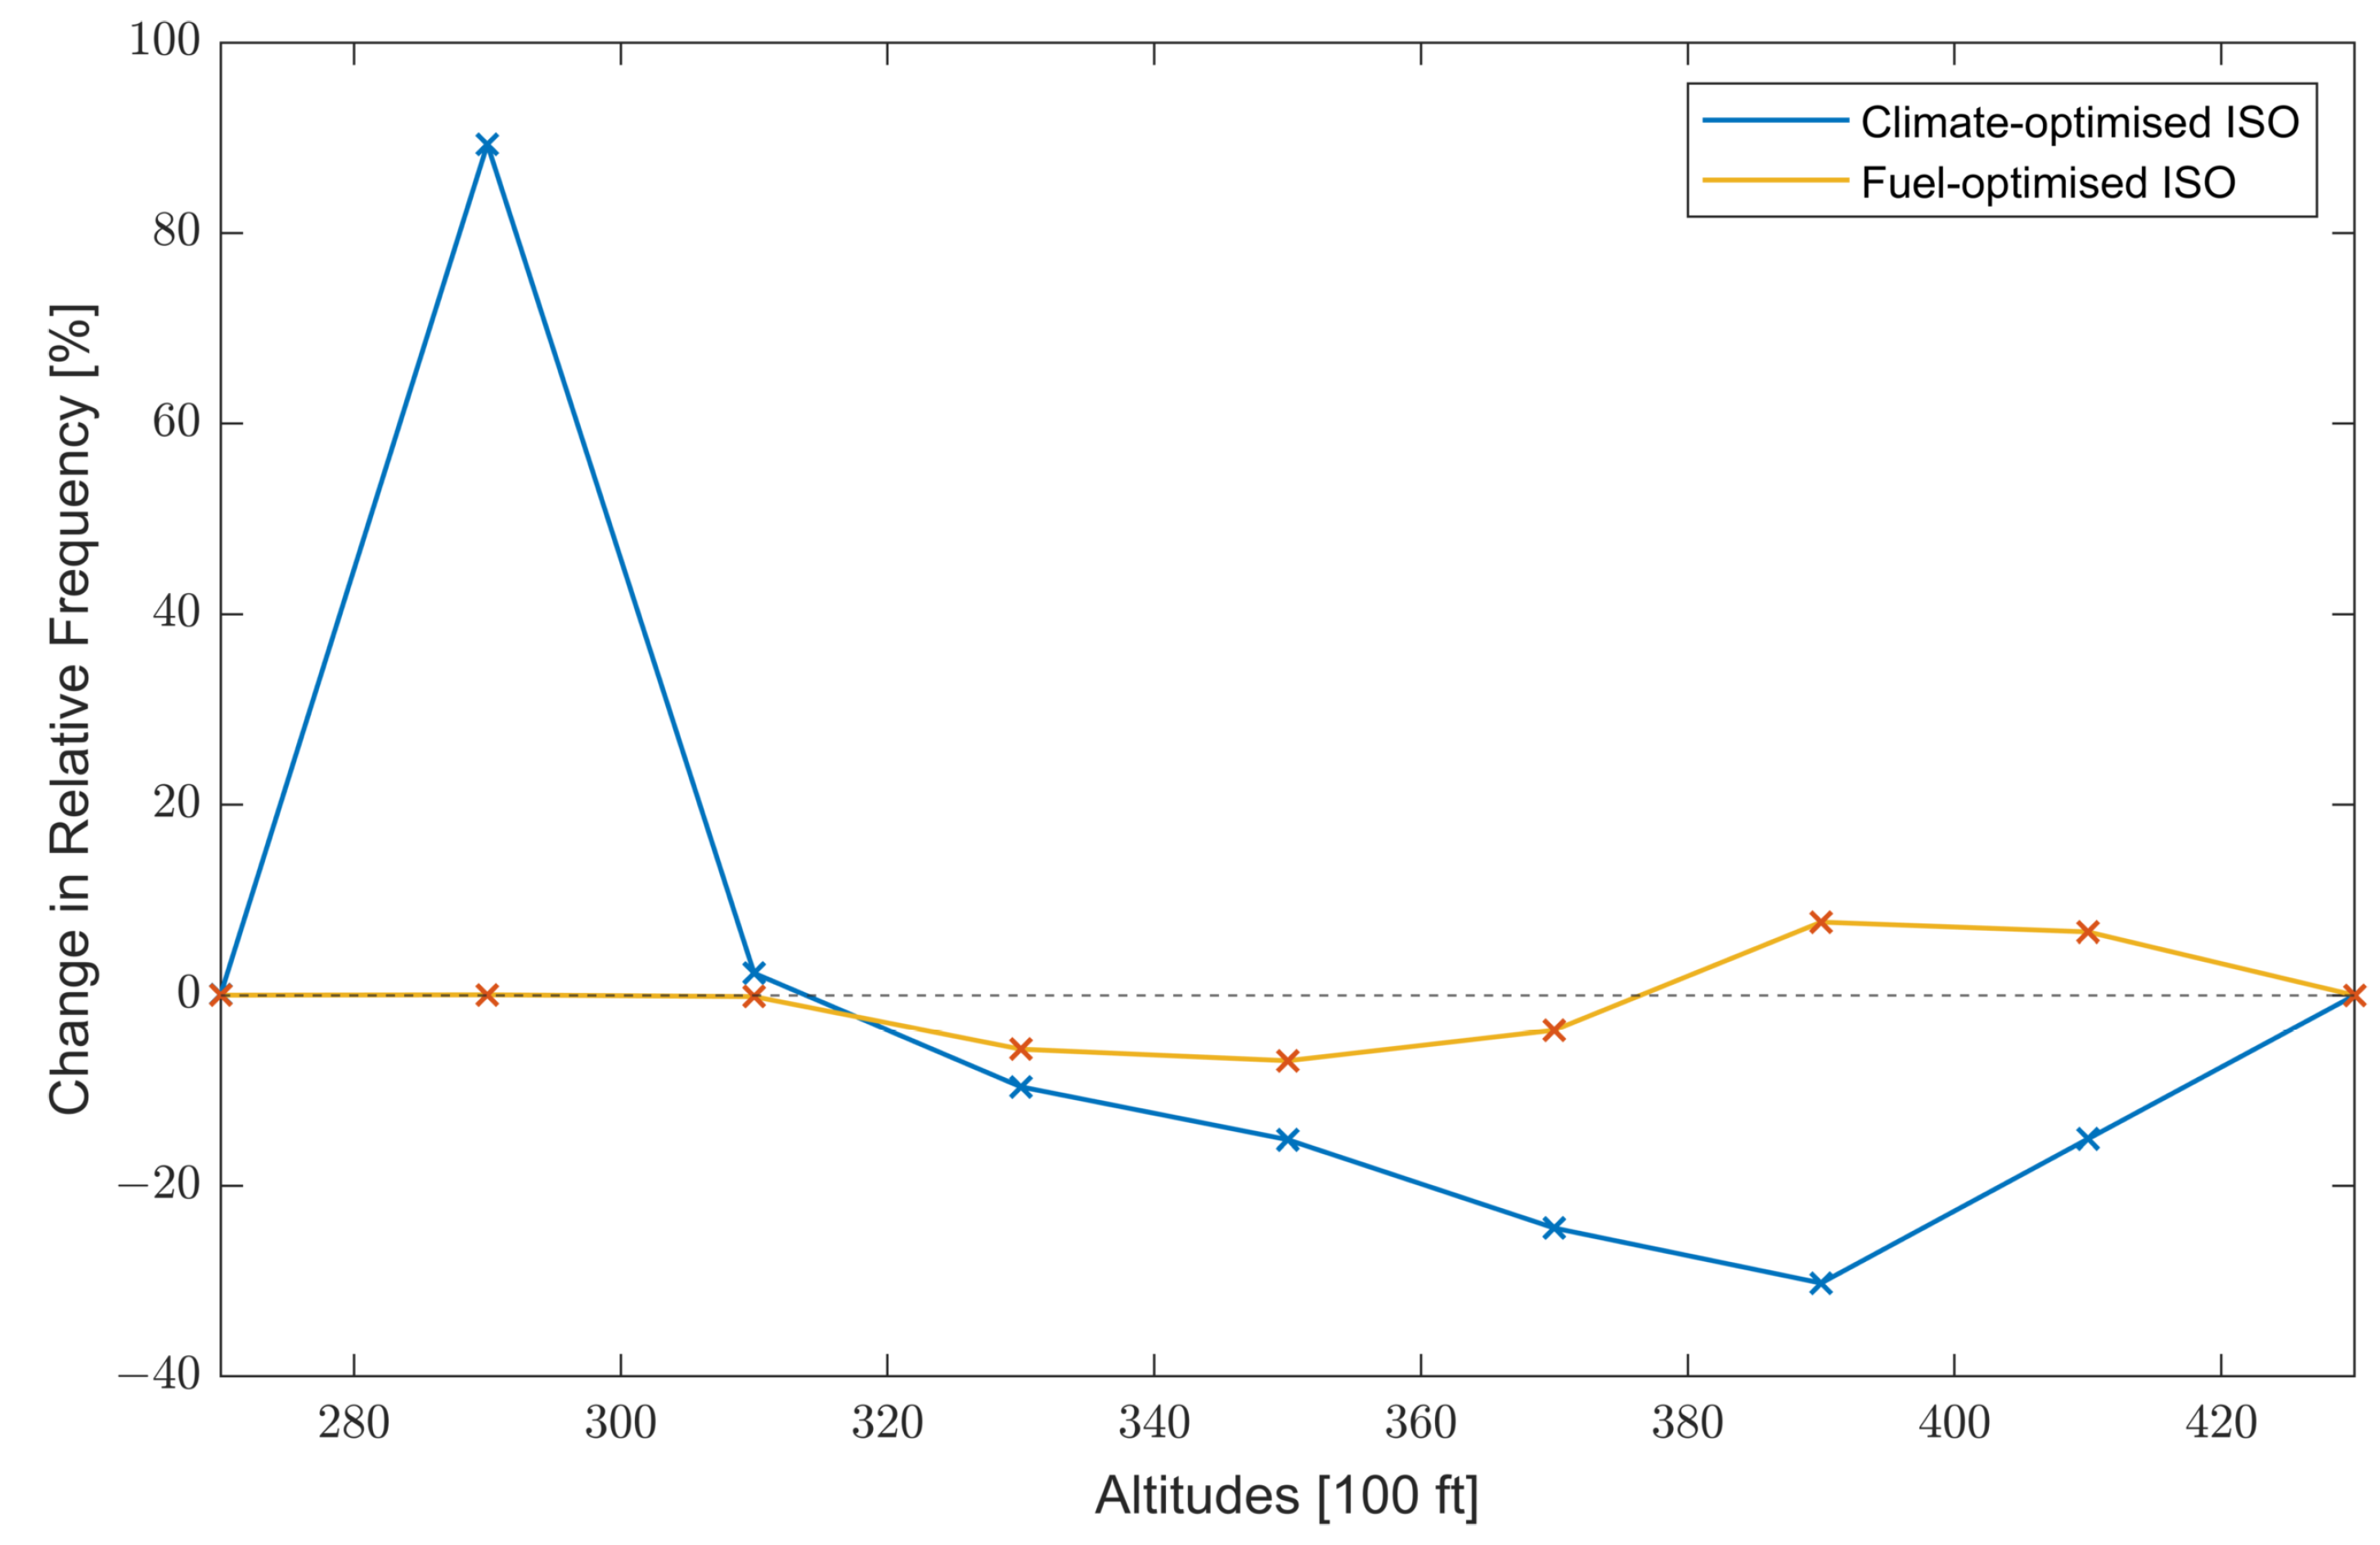
Selected cruise altitudes of both scenarios differ significantly: in the fuel-optimised case, step climbs are performed in a way that the absolute fuel consumption along the trajectories is minimised. By contrast, the constant climate-optimised flight level is selected from the defined set so that in most cases, the lowest possible flight level of 29,000 ft is chosen. On average, we identify a shift to higher flight altitudes in the fuel-optimised ISO case (+0.2%) compared to the non-stop reference missions and to lower altitudes in the climate optimised case (−23.8%). This is also influenced by additional on-ground time through the refuelling stop.
Figure 9 shows the relative frequency change per flight level compared to the reference case. One can derive that emission altitudes in the fuel-optimised case are generally higher. More fuel is consumed above 38,000 ft compared to the reference case and less below. The climate optimised case conversely is significantly more frequent at the lowest considered cruise flight level of 29,000 ft.
However, the significant mitigation potential of climate-optimised ISO and the preference of lower flight altitudes is not only due to the ISO concept itself. We observe an overlay of ATR reduction potentials through optimised refuelling location and reduced aircraft weights by the ISO concepts with a reduction in flight level in general. Consequently, we aim to differentiate both effects caused by a sole reduction of the cruise altitude on the one hand and by the impact of intermediate stops on the other hand. The effect of different cruise altitudes can be eliminated from the ISO effect by assuming constant cruise altitudes so that the impact from changing flight levels is excluded: higher cruise flight altitudes are not considered for the fuel-optimised case, as step-climbs are avoided and effects through a reduction of cruise flight levels are also excluded from the selection in the climate-optimised scenario.
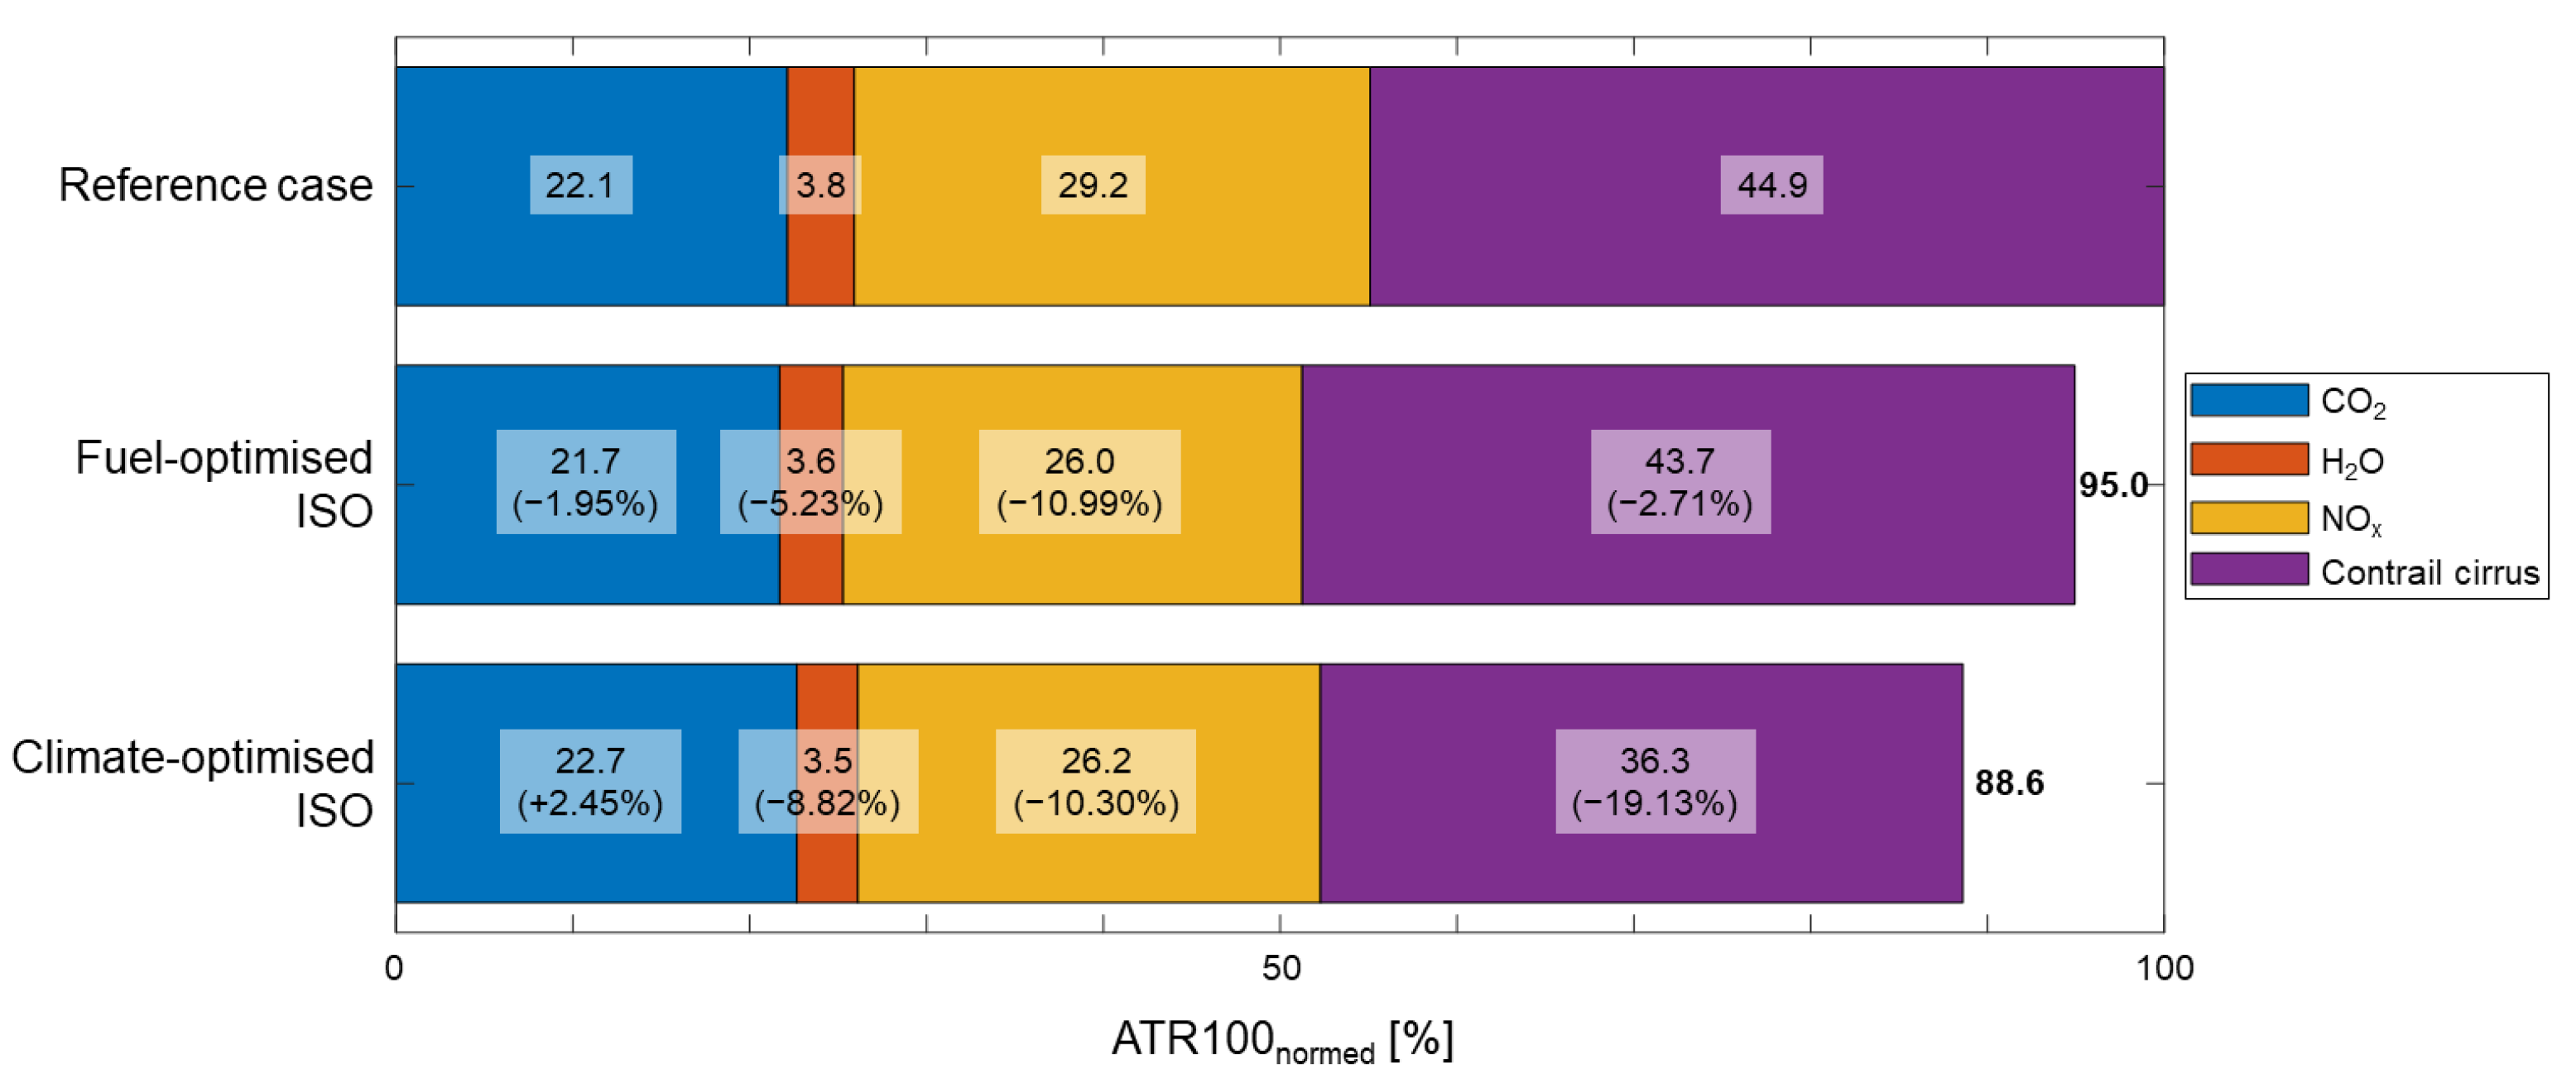
Figure 10 shows the climate mitigation potential of fuel-optimised and climate-optimised ISO for a constant flight level of 35,000 ft in comparison and normalised to the non-stop reference case at the same cruise altitude. In the fuel-optimised case, fuel efficiency enhances by approximately 2% and ATR100 decreases by 5%. By contrast, fuel consumption increases in the climate-optimised case (+2.5%). Mainly, the additional reduction in contrail-cirrus-induced ATR leads to the higher mitigation potential of that scenario. We also see that mitigation potentials in the climate-optimised case are significantly below the combined case of ISO with reduced flight levels. Furthermore, it can be confirmed that a reduction in climate impact caused by non-CO
effects overcompensates the rise in fuel consumption and resulting CO
emissions in this case. Additionally, this shows that climate mitigation potentials can be increased by a climate-optimised selection of intermediate stop airports. In accordance with the results in
Table 1, climate-optimised ISO is beneficial for nearly all selected long-range flights while (99.4%), whereas it is only beneficial for 44.0% of all flights to improve fuel efficiency.
3.3. Eco-Efficient Operations
Our analysis shows that an implementation of the ISO concept can achieve significant reductions in ATR. However, results in
Table 1 indicate that this has a major impact on operations and the stakeholders of the air transport system. On the one hand, longer flight times and higher fuel consumption lead to higher direct operating cost and thus limit an implementation of this concept from an operator’s perspective in the climate-optimised set-up. On the other hand, the fuel-optimised concept reduces fuel consumptions and limits detours as well as additional flight times implicitly. Subsequently, a combination of both effects is expected to combine benefits both ecologically and economically. For this purpose, we investigate the maximum climate mitigation potential for defined limits of additional fuel consumption (
fuel penalty) per individual flight. Results are displayed in
Table 2.
If additional fuel burn is limited to 0.5% per flight relative to the non-stop reference mission, ATR100 can still be reduced by more than 6%. By doing so, total fuel consumption is still reduced (−0.4%), and flight time increase is limited to 3.1%. An analysis of this eco-efficient set-up shows that longer missions are preferred for an implementation of ISO, as shorter distances might not include fuel efficiency gains. The same holds true for detour and eccentricity caused by the selection of refuelling airports. A majority of the flights is associated with detours below 2.5% (97.3% of the ISO missions), and the maximum detour is approximately 5.2% (1.8% in the fuel-optimised set-up). Regarding the flight level, we find that a majority of the flights include step climbs (54.5%) or a cruise altitude of 35,000 ft (19.7%) so that the trade-off of reduced cruise altitudes with higher fuel consumption is mitigated.
For more than one third of all flights (37.2%), fuel consumption and ATR100 can be reduced at the same time with an implementation of the ISO concept. If the climate-optimised solution is selected for all these win–win constellations, ATR100 could be reduced by approximately 5.7%, while fuel burn is reduced by 0.5%. Conversely, if the most fuel-efficient set-up is selected, as long as it is not associated with a higher climate impact, fuel consumption can be reduced by 1.3% and ATR100 by 2.1% in comparison to the reference case. Furthermore, we find that even accepting an individual fuel penalty of 1.5%, an implementation of ISO does not increase overall fuel consumption and still reduces the climate impact (−7.9% in ATR100).
4. Discussion and Conclusions
This study shows the climate mitigation potential of ISO as well as how configurations differ from a fuel-optimised set-up. In general, our results are consistent with what has been presented in previous research: in accordance with Linke et al. [
8], we confirm that fuel-optimised ISO increases fuel efficiency and decreases emission quantities but in turn leads to higher ATR through a rise in emission altitudes. We find that this effect can be mitigated by a reduction in flight level, e.g., as shown by Matthes et al. [
18]. If ISO airports are additionally selected based on the minimum climate impact, high mitigation potentials can be achieved.
Nevertheless, the quality of results depends on the made assumptions in the course of the simulation process and limitations to the modelling workflow itself. This includes pre-selection of missions and candidate airports, trajectory and emissions modelling as well as simulation of the climate impact.
The selection of considered routes is limited to flights to or from the ECAC area with a great circle distance of more than 2500 NM. By doing so, we ensure to cover a significant share of all global missions (18% in terms of ASK). When transferring the achieved results to the global scale, different regional distributions in terms of routes but also regarding atmospheric boundary conditions need to be considered. Furthermore, the preselection of candidate airports does not ensure that the overall optimal refuelling airport is selected. Due to this approach, the results in terms of fuel efficiency and climate mitigation potential deviate moderately from the absolute optimum, which can be achieved (see
Appendix A). From an operational perspective, we did not take available infrastructure and capacities, such as runway lengths or equipment availability as well as the geopolitical situation at the selected intermediate refuelling airports, into account. Consideration of these effects can influence availability of suitable airport candidates and thus the mitigation potential. Nevertheless, this study is capable of reliably indicating the significant potentials of ISO as an operational improvement to reduce the climate impact.
Further inaccuracies may result from the trajectory and emissions modelling: simplifying assumptions in terms of an average load factor and the resulting aircraft mass, great circle connections instead of actual routes, exclusion of wind effects and consideration of ISA as well as optimised flight altitudes and speeds influence fuel consumption and resulting emission quantities on the considered missions. On this basis, we hypothesise that fuel consumption and emission quantities are slightly underestimated. For instance, the impact of wind on a set of global long-haul routes is expected to increase fuel consumption by approximately 1–2% [
26]. However, the overall effect is expected to be minor due to the fact that results are generally presented in relation to the reference case. Application of aircraft performance data as provided by BADA4 further influences fuel burn and thus emission quantities. However, BADA4 enhances reliability and improves realism compared to the previous version 3 [
43], and a comparison with more detailed models and flight data showed mean errors in fuel consumption below 5% [
25]. The applied simplified emission modelling techniques in terms of Boeing and DLR fuel flow correlation methods as well as the standardised ICAO landing take-off cycle further lead to uncertainties. Inaccuracies of NO
x emission quantities during cruise flight for example are estimated at, on average, around 10–12% [
28,
44].
With regards to the climate impact modelling, the choice of the climate metric as well as the assessment approach have an important impact on the study. ATR is the selected as the preferred climate metric. It is well-suitable for describing the long-term temperature reduction potential through an implementation of the ISO concept [
40]. Our decision to investigate future-emission based scenarios is reasoned by the aggregated analysis of the flight plan and the focus on long-term impact of an introduction of the ISO concept. By doing so, we can also incorporate the forecasted developments of the air transport sector [
3,
40]. It needs to be considered that the estimation of climate response, especially for non-CO
-emission-induced effects in terms of RF and the resulting ATR, underlie large uncertainties [
1,
5]. However, it has been shown that an assessment of mitigation options including variation in cruise altitudes can reliably be assessed with AirClim when referring to relative differences of the climate impact [
30].
Moreover, we focused on an investigation of the general potentials of the climate-optimised ISO concept by providing the methodology and investigated the differences between fuel and climate-optimised set-ups. In this context, we concentrated our quantitative analysis on the parameters fuel consumption, emission quantities, route configurations and climate impact. Hence, a comprehensive analysis of the ISO concept’s impact on the stakeholders of the air transport system is excluded. This comprises an investigation of changes in direct operating costs for the airlines operating on long-haul routes. Through higher fuel consumption and longer flight times in the climate-optimised case, these costs are expected to rise as well as CO compensation expenses and possibly higher navigation and landing fees through intermediate stops. In addition, ISO is also expected to affect passengers’ acceptance, as longer flight times increase travel duration and additional take-offs and landings reduce travel comfort. Additionally, local air quality and noise pollution are expected to deteriorate at selected refuelling airports. Besides these disadvantages, increasing the number of cycles can raise stress for flight crew and accident rates with the higher number of required take-offs and landings. Furthermore, lateral and vertical shifts of routes leads to increased traffic densities in certain areas and thus higher efforts for air-traffic management.
The resulting implications for the stakeholders, such as airlines, airports, air traffic management, and passengers, require further investigation. The same holds true for a comparison of the achieved results with other measures, such as a sole adjustment of flight levels, to reduce the climate impact or climate-optimised trajectories. Furthermore, an optimisation of the concept considering economic implications as well as airline networks and expanding the concept with a replacement of aircraft optimised for shorter routes should be subject to further research following this study.
All in all, we confirm the climate mitigation potential of ISO if the right set-up is selected. We contribute to current state of research by first, providing a methodology to characterise climate-optimised ISO, including selection of intermediate refuelling airport and flight altitudes that significantly contribute to a reduction in the climate impact. Second, we estimate the climate mitigation potential of ISO in terms of ATR100 reduction of up to 40% for long-haul flights compared to the non-stop reference case. Third, we compare the results from the climate-optimised ISO set-up with its fuel-optimised counterpart. In this course we find that climate-optimised ISO routes are on average conducted at lower latitudes and altitudes. Furthermore, climate-optimised ISO severely impacts non-climate parameters, such as fuel burn and flight time so that stakeholder interests are affected in course of implementation. To address this, eco-efficient operation set-ups can be derived that reduce fuel consumption and ATR at the same time.
