Abstract
This study investigated the impact of subcritical water extraction parameters on the polyphenols and flavonoids content in extracts made of the bark of walnut (Juglans regia L.), as well as antioxidant activity measured using the DPPH and FRAP methods. The total polyphenols (TPC) and flavonoid (TFC) were determined using the spectrophotometric (UV-Vis) method. The response surface methodology (RSM) was employed to optimize the yield of bioactive compounds. On the basis of developed model, the highest polyphenols (192.2 mg (GAE)/100 g (dry mass)) (GAE—gallic acid equivalent), flavonoids (88.3 mg(QE)/100 g (dry mass)) (QE—quercetin equivalent) contents and antioxidant activity (21.3 × 10⁻⁶ MTE/1 g (dry mass)) (TE-Trolox equivalent) were obtained under the following extraction conditions: temperature 131.6 °C, raw material fraction size 0.9 mm and process time 10 min. The greatest impact on the extraction yield was observed in the case of the temperature, whereas the raw material fraction size and the process time had a secondary impact. Obtained results indicate that a smaller particle size and a shorter time may improve the process; however, a reduction in particle size can be challenging for a pressure cell filtration system and consequently increase the cost of the raw material pretreatment process. With the reduction in the process time, a lower cost of extract production can be achieved. This study confirmed the importance of a proper selection of extraction parameters to obtain the demanded extract composition.
1. Introduction
Phenolic compounds are secondary metabolites present in various parts of plants [1,2]. They belong to the group of biologically active compounds and their production depends on various enzymes participating in metabolic reactions [3]. The metabolism of these compounds is integrated with the biochemical and morphological regulatory patterns of plants [4]. Phenolic compounds in plants are used as protective substances against various types of stress that can be caused by environmental conditions, pathogens and injuries [1]. They have a key role in plant defense mechanisms [5,6]. Green walnut, shell, husk, kernel, bark, root and leaves of Juglans regia L. are widely used in the pharmaceutical and cosmetic industries [7]. The research carried out showed that walnuts have a higher antioxidant activity than pistachios and hazelnuts [8]. Walnuts are considered a good source of tocopherols and essential fatty acids [9,10]. Moreover, walnuts contain other compounds that may be beneficial in promoting human health, including polyphenols, tannins, folate [11], dietary fiber, protein, melatonin [12] and sterols [9,13]. The leaves and bark of walnuts are used as a natural dye for wool colorization [14]. Extracts prepared with different parts of the walnut have anti-inflammatory, blood purifying, anticancer, cleansing and detergent properties [15]. The water extract made with walnut bark protects mice against biochemical toxicity caused by cyclophosphamide [16]. It contains several therapeutically active ingredients, especially polyphenols [17,18]. The bark of Juglans regia L. contains chemical components such as β-sitosterol, ascorbic acid, juglone, folic acid, gallic acid, regiolone, and quercetin-3-O-α-l-arabinoside [19]. The results of several other studies demonstrated that in most cases the extracts obtained from different parts of the walnut using alcohols, water or a mixture of them demonstrated a higher content of phenols than the extracts of other non-polar solvents such as petroleum ether, chloroform, n-butanol, benzene and cyclohexane. Polar solvents such as methanol, ethanol, water, acetone and ethyl acetate are believed to be the best solvents for polyphenols extraction [20]. The dried bark of walnut contains significant amounts of polyphenols. The extraction of Juglans regia L. bark using ethyl acetate allowed us to obtain polyphenols in the amount of 34.83 mg GAE/g (dry mass) [21]. Other studies indicated the possibility of obtaining 138.5 mg GAE/g (dry mass) (using ethyl acetate as a solvent), 311.5 mg GAE/g (dry mass) (using diluted acetone), 172.5 mg GAE/g (dry mass) (using methanol extract), 182 mg GAE/g (dry mass) (using water extract) [22].
Subcritical water extraction is one of the most promising, scalable to industrial capacity and environmentally friendly isolation methods of biologically active compounds from plant raw materials [23,24,25]. The unique properties of water in a subcritical state are mainly due to a relatively high boiling point, high dielectric constant and high polarity [26]. With the increase in the water temperature, its electric permittivity decreases, diffusion rate increases and viscosity together with surface tension decreases. Consequently, materials with a high polarity and high solubility in water under normal conditions are extracted more efficiently at low temperatures, while low-polar and non-polar compounds require less polar medium to be present at elevated temperatures [1,27,28]. Nastić et al. [28] described the correlation of an increase in the phenols content in the extract with an increase in the temperature, as a result of the water polarity decrease. An increase in the water temperature increases the diffusion rate and desorption kinetics, and increases the dissociation of compounds. A reduction in viscosity and the surface tension of water, as a result of a temperature increase, improves the quality of contact between the solvent and the raw material. A combination of the above-mentioned changes in the properties of water as a solvent increases mass transfer coefficients, resulting in a higher process rate and efficiency.
Study of the subcritical extraction process indicates a higher antioxidant activity of extracts obtained by this method compared to other extraction methods, emphasizing at the same time the strong influence of the process temperature on antioxidant activity [28,29,30,31,32,33].
Knowledge about the influence of process parameters such as temperature, raw material fraction size and process time on the composition and bioactivity of obtained extracts for selected parts and plant species is a key factor for the development of the optimal design of devices for the extraction process, allowing us to increase the process efficiency and reduce the production cost.
The available literature data describe in detail the bioactivity of individual parts of the walnut, such as the green walnut, shell, husk, kernel, and leaves, but do not contain information on the flavonoid content and antioxidant activity of bark extracts. There are also no studies available on the influence of the parameters of the water extraction process under subcritical conditions on the biological activity of the obtained extracts. For this reason, the aim of this study was to investigate the effect of process parameters on the content of polyphenols, flavonoids, and antioxidant activity of obtained extracts as well as the determination of optimal parameters.
2. Materials and Methods
2.1. Raw Material
The bark of a walnut (Juglans regia L. variety Resovia) for research was obtained from an organic farm, “Leśne zacisze”, located in Puławy, Poland. The bark for the study was taken from branches of 20-year-old trees. The raw material was pre-dried for 24 h using a Memmert ULM 500 dryer at 45 °C. The pre-dried raw material was crashed in a RETSCH SM100 cutting mill with a rotor diameter of 129.5 mm and a cutting blade speed of 9.4 m/s, then using a laboratory shaker MULTISERV LPzE-2e sieved for 20 min, with an amplitude of vibration of 2.5 mm and frequency of 50 Hz. Selected fractions 0.9, 1.4 and 1.9 mm were subjected to a further drying process until the moisture content reached 8.99%. The raw material after the pre-drying process is presented in Figure 1.
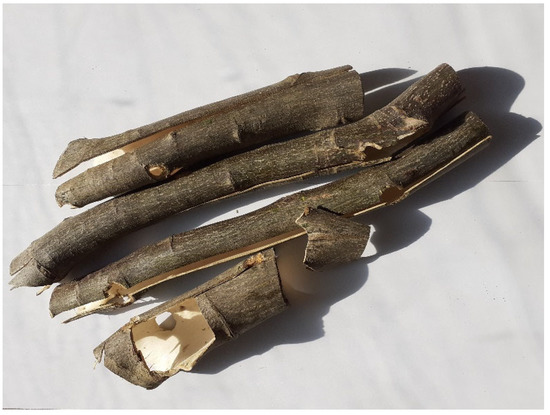
Figure 1.
The raw material for testing after pre-drying process.
2.2. Reagents
The following chemical reagents were used for spectrophotometrical tests: Folin-Ciocalteu reagent (AKTYN, Suchy Las, Poland), methanol (≥99%, Stanlab, Lublin, Poland), sodium carbonate (≥99%, Stanlab, Lublin, Poland), gallic acid (≥98%, Sigma Aldrich, Merck, Germany), 2,2-diphentyl-1-picrylhydrazyl (DPPH, Sigma Aldrich, Merck, Germany), 2,3,5-Triphenyltetrazolium chloride (TPTZ, Sigma Aldrich, Merck, Germany), 6-hydroxy-2,5,7,8-tetramethyl-chromane-2-carboxylic acid (Trolox, >98%, Sigma Aldrich, Merck, Germany), quercetin (≥95%, Sigma Aldrich, Merck, Germany), aluminum chloride (>98%, Sigma Aldrich, Merck, Germany).
2.3. Methods
2.3.1. Box-Behnken Experimental Design and Statistical Analyses
The investigation was performed on the basis of the Box-Behnken experiment design in the Design-Expert v13. A three-level, three-factor design of experiment (DoE) was used to determine the best combination of subcritical water extraction parameters for Juglans regia L. Three levels were defined as the lowest analyzed value of the process parameter, the average and the highest value. The process temperature (F1), fraction size (F2), and process time (F3) were independent variables (three DoE factors), whereas the dependent variables were the total polyphenols content, the total flavonoids content, antioxidant activity (DPPH), and antioxidant activity (FRAP).
The experiment consists of 15 combinations, including three center points to estimate the pure error, and was carried out in randomized order. Coded and real values of process parameters of each set of variables according to the design of experiment are presented in Table 1. Coded values represent the minimum value of a variable (coded value −1), average (coded value 0) and maximum (coded value 1).

Table 1.
Design of Experiment (DoE)—coded and real values of process parameters.
The experimental data were assessed via analysis of variance (ANOVA). The statistical significations of the regression coefficients were verified with an F-test, and p-values of less than 0.05 were assumed as significant.
The optimal extraction conditions were estimated through Derringer’s desirability prediction tool, aiming at a maximum attainable response for each independent factor. The validity of the developed model was assessed by comparing the experimental with predicted values.
2.3.2. Subcritical Water Extraction
Subcritical water extraction was performed with the use of an automatic extraction system Dionex ASE350 (accelerated solvent extractor) equipped with a 100 mL volume pressure cell protected by the use of fiberglass filters at the inlet and outlet sections. The extraction process was carried out using 10 g of plant raw material with the specified in DoE fraction size for each set of process parameters. During the extraction process, the pressure cell was filled with ultrapure water for analytical applications with a conductivity of 0.09 μS/cm, heated to the required temperature, for the time specified in the DoE. At the end of the process, water with dissolved compounds was released into a laboratory vessel. Obtained aqueous extract was dried using a vacuum evaporator under a temperature of 40 °C. Obtained extracts were stored in a refrigerator (2 °C) and collected for further chemical analysis.
2.3.3. Total Polyphenols Content (TPC)
TPC was determined with spectrophotometry using gallic acid as the reference standard. The total polyphenol content was measured according to the method described by Sahin et al. [28]. The results are expressed as mg(GAE)/100 g DM(dry mass) of raw material. The following calibration curve was used to determine the total polyphenols content.
where: TPC—total polyphenols content [10−6 g(GAE)/mL], A—absorbance [dim].
2.3.4. Total Flavonoid Content (TFC)
TFC was determined with spectrophotometry using quercetin as the reference standard, described by Aryal et al. [34] with some modifications [35]. The extract sample (1.0 mL) was mixed with 1 mL of a 2% AlCl3∙6H2O solution (in methanol). The mixture was made up to 10 mL with distilled water. After 10 min of incubation of the mixture at room temperature in the dark, the absorbance was measured at 430 nm. A calibration curve was created based on the quercetin and the results were expressed as mg quercetin equivalent per 100 g of dry mass (mg QE/100 g dry mass) [35]. The following calibration curve was used to determine the total flavonoids content.
where: TFC—total flavonoids content [10−6 g(QE)/mL], A—absorbance [dim].
2.3.5. Antioxidant Activity
- DPPH assay
The antioxidant activity of the obtained extracts was assessed using the DPPH (2,2-diphenyl-1-picrylhydrazyl) assay described by Blois [36] with modifications [35]. For this analysis, 0.2 mL of the extract was mixed with an aliquot of 5.8 mL of freshly prepared 6·10−5 M DPPH radical in methanol. The mixture was stored for 30 min at room temperature and then the spectrophotometric absorbance was measured at 516 nm using methanol as a blank. Three replicates of the measurement were performed for each sample. Antioxidant activity was expressed as a Trolox equivalent: 10−6 MTE/1 g (dry mass) [35]. The following calibration curve was used to determine antioxidant activity using the DPPH method.
where: AC—Trolox equivalent antioxidant activity [10−6 MTE/mL]; A—absorbance [dim].
- FRAP assay
The ferric-reducing antioxidant power of the obtained extract was evaluated according to the method described by Benzie [37] with modifications [35]. The working reagent was prepared as a mixture of 20 mM FeCl3, 300 mM acetic acid, and 10 mM of TPTZ in 10:1:1 (v/v/v) proportion in 40 mM HCl. Subsequently, 30 μL of the evaluated extracts was mixed with 5 mL of the FRAP solution. After a 10 min incubation period at 37 °C, absorbance of the mixture was measured at 593 nm. The FRAP values of the evaluated extracts were expressed as a Trolox equivalent: 10−6 MTE/1 g (dry mass) [35]. The following calibration curve was used to determine antioxidant activity using the FRAP method.
where: AC—Trolox equivalent antioxidant activity [10−6 MTE/mL]; A—absorbance [dim].
2.3.6. Optimization of Subcritical Water Extraction Parameters
Based on the experimental data, a multi-criterial optimization of the process parameters was carried out. Process variables were selected as (independent variables): temperature, raw material fraction size and process time. Whereas optimization parameters were defined as (dependent variables): total polyphenols, total flavonoids, antioxidant activity measured by DPPH and FRAP methods. Optimization goals and limits are presented in Table 2.
Table 2.
Optimization goals and limits.
3. Results and Discussion
3.1. Extraction Yield and Results of Chemical Analysis
Efficiency of the subcritical water extraction process of walnut (Juglans regia L.) bark expressed as a percentage relation between the mass of dry extract and the mass of dry raw material ranged from 15.3 to 31.8%, varying according to the experimental conditions. Results obtained for each DoE set are presented in Table 3, whereas Table 4 presents the obtained response for dependent variables such as total polyphenols, total flavonoids, antioxidant activity (DPPH), and antioxidant activity (FRAP).
Table 3.
The extraction yield in relation to dry mass of raw material.
Table 4.
Results of chemical analysis.
3.2. Total Polyphenols Content (TPC)
The total polyphenols content extracted from the bark of the walnut (Juglans regia L.) ranged from 128.3 to 192.1 mg(GAE)/100 g (DM), varying according to the experimental conditions. Polyphenols contents as a function of extraction temperature, raw material fraction size and process time are presented in Figure 2.
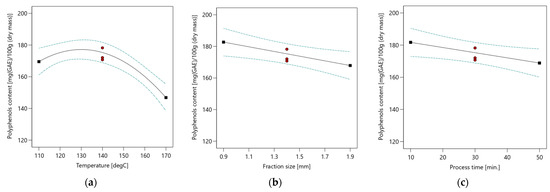
Figure 2.
Polyphenols content for different subcritical extraction parameters (a) Polyphenols content as a function of extraction temperature; (b) Polyphenols content as a function of raw material fraction size; (c) Polyphenols content as a function of process time.
Multivariable analysis of variance (ANOVA) performed with the use of the analytical results of total polyphenols content shows that the total polyphenols were influenced by: process temperature, raw material fraction size and process time. As mentioned above, the influence of the temperature can be represented by a second-order equation. The content of polyphenols increases with the increasing temperature value up to 131.6 °C and then decreases. The impact of the raw material fraction size and process time changes is linear. Details of ANOVA analysis are presented in Table 5.
Table 5.
The analysis of variance for polyphenols content.
An F-value of 12.53 indicates that the model is significant. There is only a 0.07% chance that an F-value this large could occur due to noise. p-values less than 0.05 indicate the significance of the model terms. Significant model terms are A, B, C, A2. The lack of fit F-value of 4.25 implies the lack of fit is not significant relative to the pure error. The predicted R2 (0.5864) and adjusted R2 (0.7672) are in reasonable agreement. The signal-to-noise ratio is referred as Adeq Precision. A ratio of 11.3318 indicates an adequate signal. The obtained model is statistically significant and can be used to navigate the analyzed space.
The total polyphenols content can be determined using Equation (5).
where: TPC—total polyphenols content [mg(GAE)/100 g (dry mass)]; T—temperature [°C]; Fs—fraction size of raw material [mm]; t—process time [min].
There are no studies available on the polyphenols content in the subcritical water extracts of Juglans regia L. bark. The available data indicate that extraction of Juglans regia L. bark using ethyl acetate allowed us to obtain polyphenols in the amount of 34.83 mg GAE/g (dry mass) [21]. Other studies indicated the possibility of obtaining 138.5 mg GAE/g (DM) (using ethyl acetate as solvent), 311.5 mg GAE/g (DM) (using diluted acetone), 172.5 mg GAE/g (DM) (using methanol extract), 182 mg GAE/g (DM) (using water extract) [22]. During the research conducted as part of this study, the total polyphenols content extracted from the bark of walnut (Juglans regia L.) ranged from 128.3 to 192.2 mg(GAE)/100 g (DM). Differences in the content of polyphenols can be caused by factors such as: different extraction method, process parameters, type of solvent, collection time of material for research and raw material pretreatment method. The chemical composition of phytonutrients varies with changes in geographic location, climatic conditions and the nature of the soil [38]. It should also be emphasized that the aim of this study was to investigate the effect of process parameters on the total polyphenols, flavonoids and antioxidant activity of obtained extracts and the determination of optimal parameters for subcritical water extraction, not to study the maximum yield of polyphenols extraction.
3.3. Total Flavonoids Content (TFC)
The total flavonoids content in extracts from the bark of walnut (Juglans regia L.) ranged from 28.0 to 88.3 mg(QE)/100 g (DM), varying according to the experimental conditions. Flavonoids contents as a function of the extraction temperature, raw material fraction size and process time are presented in Figure 3.
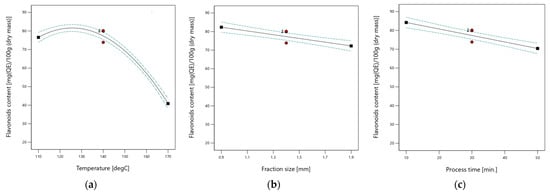
Figure 3.
Flavonoids content for different subcritical extraction parameters (a) Flavonoids content as a function of extraction temperature; (b) Flavonoids content as a function of raw material fraction size; (c) Flavonoids content as a function of process time.
Multivariable analysis of variance (ANOVA) performed based on analytical data shows that the flavonoids content in subcritical water extracts strictly depends on the temperature, raw material fraction size and process time. The relationship between the temperature and flavonoids content was described by a second-order equation. The content of flavonoids increases with an increasing temperature value up to 131.6 °C and then decreases. The impact of raw material fraction size and process time changes is linear. Details of ANOVA analysis are presented in Table 6.
Table 6.
The analysis of variance for total flavonoids.
An F-value of 162.42 indicates that the model is significant. There is only a 0.01% chance that an F-value this large could occur due to noise. p-values less than 0.05 indicate the significance of the model terms. The significant model terms are A, B, C, AC, A2. The lack of fit F-value of 0.2831 implies the lack of fit is not significant relative to the pure error. The predicted R2 (0.9744) and adjusted R2 (0.9829) are in reasonable agreement. The signal-to-noise ratio is referred as Adeq Precision. A ratio of 40.916 indicates an adequate signal. The obtained model is statistically significant and can be used to navigate the analyzed space.
The total flavonoids content can be determined using Equation (6).
where: TFC—total flavonoids content [mg(QE)/100 g (dry mass)]; T—temperature [°C]; Fs—fraction size of raw material [mm]; t—process time [min].
There are no studies available on the flavonoids content in the subcritical water extracts of Juglans regia L. bark. Taking into account the main goal of this study, that is to investigate the effect of process parameters on the chemical composition and antioxidant activity of obtained extracts, changes in flavonoids and polyphenols contents in relation to process parameters were compared. Flavonoids content varies with a temperature change in a similar manner to polyphenols. In the temperature range from 110 to 131.6 °C, both flavonoids and polyphenols contents increase; with a further temperature increase, both flavonoids and polyphenols contents decrease. Similar trends in both flavonoids and polyphenols contents were observed in relation to the raw material fraction size and process duration. An increase in the raw material size and process duration negatively affects both the polyphenols and flavonoid contents. This phenomenon can be caused by the worst contact of the solvent with desired compounds in the case of a larger raw material size, whereas a longer process duration at elevated temperatures may be the reason for the occurrence of thermal degradation of the extract.
3.4. The Antioxidant Activity
The antioxidant activity of obtained extracts ranged from 11.5 to 21.3 × 10⁻⁶ MTE/1 g (DM) while tested by use of the DPPH method and from 16.9 to 29.7 × 10⁻⁶ MTE/1 g (DM) using the FRAP method, varying according to the experimental conditions. The obtained antioxidant activity is more than 100 times lower than the antioxidant activity of the extract from Juglans regia L. flowers. The antioxidant activity of the extract obtained from Juglans regia L. flowers was 3.33 × 10⁻³ MTE/1 g (DM) [39]. Antioxidant activities as a function of extraction temperatures are presented in Figure 4.
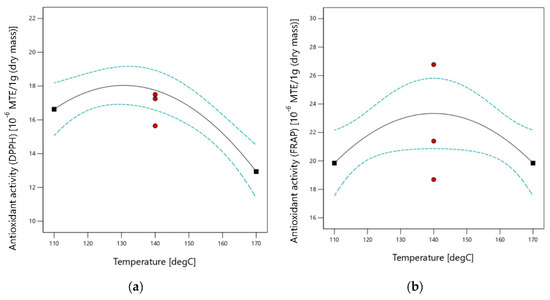
Figure 4.
Antioxidant activity as a function of extraction temperature (a) Analyzed using DPPH method; (b) Analyzed using FRAP method.
Multivariable analysis of variance (ANOVA) performed with use of the results of antioxidant activity assessment using DPPH and FRAP methods shows that the antioxidant activity is strictly dependent on the temperature only. The influence of temperature mentioned above can be represented by a second-order equation. With the DPPH method, antioxidant activity increases with an increasing temperature value up to 131.6 °C and then decreases, whereas with the FRAP method the maximum point was observed at 134.7 °C. Details of ANOVA analysis are presented in Table 7 for the DPPH method and Table 8 for the FRAP method.
Table 7.
Analysis of variance for antioxidant activity measured using DPPH method.
Table 8.
Analysis of variance for antioxidant activity measured using FRAP method.
The F-value of 14.66 indicates that the model is significant. There is only a 0.06% chance that an F-value this large could occur due to noise. p-values less than 0.05 indicate significance of the model terms. Significant model terms are A and A2. The lack of fit F-value of 2.23 implies the lack of fit is not significant relative to the pure error. The predicted R2 (0.5762) and adjusted R2 (0.6611) are in reasonable agreement. The signal-to-noise ratio is referred as Adeq Precision. A ratio of 7.516 indicates an adequate signal. The obtained model is statistically significant and can be used to navigate the analyzed space.
An F-value of 4.96 indicates that the model is significant. There is only a 4.43% chance that an F-value this large could occur due to noise. p-values less than 0.05 indicate significance of the model terms. A significant model term is A2. The lack of fit F-value of 0.46 implies the lack of fit is not significant relative to the pure error. The predicted R2 (0.0244) and adjusted R2 (0.2203) are in reasonable agreement.
The mathematical relation between the extraction temperature and antioxidant activity can be presented in the form of Equation (7) for the DPPH method and Equation (8) for the FRAP method.
where: AC—Trolox equivalent antioxidant activity [10−6 MTE/1 g (DM)]; T—temperature [°C].
When we compare the antioxidant activity determined by both methods with the total polyphenols content obtained in previous evaluations, a similar trend of changes in the reference to the change in process temperature can be observed. Antioxidant activity assessed by use of the DPPH method increases with a temperature increase up to 131.6 °C, then decreases. The same trend was observed with polyphenols and flavonoid contents. A slight deviation with respect to this behavior was observed in relation to the FRAP method. The antioxidant activity determined by the FRAP method increases with an increase in temperature up to 134.7 °C, then decreases. The discrepancy in the temperature of occurrence of the maximum content of polyphenols and antioxidant activity measured by the FRAP method is 2.3%. Statistical data (e.g., coefficient of determination R2) for both analyses of antioxidant activity indicate a better adjustment of the regression curve in the case of the DPPH method (R2DPPH = 0.7095 vs. R2FRAP = 0.2760). Due to the uncertainty of the mathematical model build based on FRAP method, this model was used for qualitative assessment only.
3.5. Optimization of the Extraction Conditions
The optimization of subcritical water extraction parameters us to determine values of the process temperature, raw material fraction size and time (process duration) at which polyphenols and flavonoids content together with the antioxidant activity measured using the DPPH and FRAP methods reached maximum value. The highest polyphenols and flavonoids contents together with the antioxidant activity were reached at a temperature of 131.6 °C, a raw material fraction size of 0.9 mm and a process duration of 10 min. Table 9 shows the values of the maximum content of polyphenols, flavonoids and the maximum antioxidant activity of the extracts obtained, together with the corresponding extraction parameters.
Table 9.
Maximum test values with corresponding process parameters.
The strength of the conducted research work is the determination of the optimal parameters of the walnut bark extraction process using water under subcritical conditions. Walnut bark has never been researched in this respect before. Subsequent research work should determine the variability of the chemical composition of the obtained extracts by examining selected bioactive compounds using chromatographic methods.
4. Conclusions
This study investigated the effect of subcritical water extraction parameters on the total polyphenols, flavonoids content and antioxidant activity of walnut (Juglans regia L.) bark extract using the Box-Behnken methodology. The total polyphenols and flavonoids extracted from walnut (Juglans regia L.) bark using a subcritical water extraction process are dependent on the temperature of the process, raw material fraction size and process duration. The optimal conditions (on the basis of the model) for the extraction of polyphenols and flavonoids from walnut (Juglans regia L.) bark were as follows: process temperature of 131.6 °C, particle size of 0.9 mm, extraction time of 10 min.
The antioxidant activity was affected by the extraction temperature only. The highest antioxidant activity was achieved at a process temperature of 131.6 °C.
The results obtained indicate how important is the optimal selection of subcritical water extraction parameters with regard to the quality of the extract. Obtained results indicate that a smaller particle size and shorter time may improve the process, but a reduction in the particle size can be challenging for a pressure cell filtration system and increase the cost of raw material pretreatment. By reducing the process time a lower cost of extract production can be achieved; additionally, a longer process time under elevated temperatures may lead to thermal degradation of the extract.
Author Contributions
Conceptualization, P.K. and Z.K.; methodology, P.K.; validation, P.K. and K.T.; formal analysis, P.K.; investigation, P.K., Z.K., Z.F. and M.G.; resources, K.T.; data curation, P.K.; writing—original draft preparation, P.K.; writing—review and editing, P.K., Z.K. and K.T.; visualization, P.K.; supervision, Z.K., P.K. and K.T.; project administration, P.K.; funding acquisition, P.K. and Z.K. All authors have read and agreed to the published version of the manuscript.
Funding
This research was supported by project No. SD/46/IM/2022 provided by the University of Life Sciences in Lublin, Poland.
Institutional Review Board Statement
Not applicable.
Informed Consent Statement
Not applicable.
Data Availability Statement
Not applicable.
Conflicts of Interest
The authors declare no conflict of interest.
References
- Treutter, D. Biosynthesis of phenolic compounds and its regulation in apple. Plant Growth Regul. 2001, 34, 71–89. [Google Scholar] [CrossRef]
- Ruhmann, S.; Leser, C.; Bannert, M.; Treutter, D. Relationship between growth, secondary metabolism and resistance of apple. Plant Biol. 2002, 4, 137–143. [Google Scholar] [CrossRef]
- Bravo, L. Polyphenols: Chemistry, dietary sources, metabolism, and nutritional significance. Nutr. Rev. 1998, 56, 317–333. [Google Scholar]
- Aherne, S.A.; O’Brien, N.M. Dietary flavonols: Chemistry, food content, and metabolism. Nutrition 2002, 18, 75–81. [Google Scholar] [CrossRef]
- Bennett, R.N.; Wallsgrove, R.M. Secondary metabolites in plant defense mechanisms. New Phytol. 1994, 127, 617–633. [Google Scholar] [CrossRef] [PubMed]
- Dixon, R.A.; Paiva, N.L. Stress-induced phenylpropanoid metabolism. Plant Cell 1995, 7, 1085–1097. [Google Scholar] [CrossRef] [PubMed]
- Britton, M.; Leslie, C.A.; Dandekar, A.M.; McGranahan, G.H.; Caboni, E. Persian Walnut. In Compendium of Transgenic Crop Plants; Kole, C., Hall, T.C., Eds.; Wiley: Hoboken, NJ, USA, 2009; Volume 4, pp. 285–300. [Google Scholar]
- Arcan, I.; Yemenicoglu, A. Antioxidant activity and phenolic content of fresh and dry nuts with or without the seed coat. J. Food Compos. Anal. 2009, 22, 184–188. [Google Scholar] [CrossRef]
- Amaral, J.S.; Casal, S.; Pareira, J.A.; Seabra, R.M.; Oliveira, B.P. Determination of sterol and fatty acid compositions, oxidative stability, and nutritional value of six walnut (Juglans regia L.) cultivars grown in Portugal. J. Agric. Food Chem. 2003, 51, 7698–7702. [Google Scholar] [PubMed]
- Amaral, J.S.; Alves, M.R.; Seabra, R.M.; Oliveira, B.P. Vitamin E composition of walnuts (Juglans regia L.): A 3-year comparative study of different cultivars. J. Agric. Food Chem. 2005, 53, 5467–5472. [Google Scholar]
- Li, L.; Yang, R.; Liu, C.; Zhu, H.; Young, J.C. Polyphenolic profiles and antioxidant activities of heartnut (Juglans ailanthifolia var. cordiformis) and Persian walnut (Juglans regia L.). J. Agric. Food Chem. 2006, 54, 8033–8040. [Google Scholar] [CrossRef]
- Reiter, R.J.; Manchester, L.; Tan, D. Melatonin in walnuts: Influence on levels of melatonin and total antioxidant capacity of blood. Nutrition 2005, 21, 920–924. [Google Scholar] [CrossRef] [PubMed]
- Bou Abdallah, I.; Tlili, N.; Martinez-Force, E.; Rubio, A.G.P.; Perez-Camino, M.C.; Albouchi, A.; Boukhchina, S. Content of carotenoids, tocopherols, sterols, triterpenic and aliphatic alcohols, and volatile compounds in six walnuts (Juglans regia L.) varieties. Food Chem. 2015, 173, 972–978. [Google Scholar] [CrossRef]
- Kale, A.; Shah, S.; Gaikwad, S.; Mundhe, K.; Deshpande, N.; Salvekar, J. Elements from Stem Bark of Orchard Tree—Juglans regia. Int. J. Chemtech Res. 2010, 2, 548–550. [Google Scholar]
- Noumi, E.; Snoussi, M.; Hajlaoui, H.; Valentin, E.; Bakhrouf, A. Antifungal properties of Salvadora persica and Juglans regia L. extracts against oral Candida strains. Eur. J. Clin. Microbiol. Infect. Dis. 2010, 29, 81–88. [Google Scholar]
- Haque, R.; Bin-Hafeez, B.; Parvez, S.; Pandey, S.; Sayeed, I.; Ali, M.; Raisuddin, S. Aqueous extract of walnut (Juglans regia L.) protects mice against cyclophosphamide-induced biochemical toxicity. Hum. Exp. Toxicol. 2003, 22, 473–480. [Google Scholar]
- Bhatia, K.; Rahman, S.; Ali, M.; Raisuddin, S. In vitro antioxidant activity of Juglans regia L. bark extract and its protective effect on cyclophosphamide-induced urotoxicity in mice. Redox Rep. 2006, 11, 273–279. [Google Scholar] [CrossRef]
- Nirmla Devi, T.; Apraj, V.; Bhagwat, A.; Mallya, R.; Sawant, L.; Pandita, N. Pharmacognostic and Phytochemical Investigation of Juglans regia Linn. Bark. Pharm. J. 2011, 3, 39–43. [Google Scholar]
- Zakavi, F.; Golpasand Hagh, L.; Daraeighadikolaei, A.; Farajzadech Sheikh, A.; Leilavi Shooshtari, Z. Antibacterial effect of Juglans regia bark against oral pathologic bacteria. Int. J. Dent. 2013, 2013, 854765. [Google Scholar] [PubMed]
- Jahanban-Esfahlan, A.; Ostadrahimi, A.; Tabibiazar, M.; Amarowicz, R. A Comparative Review on the Extraction, Antioxidant Content and Antioxidant Potential of Different Parts of Walnut (Juglans regia L.) Fruit and Tree. Molecules 2019, 24, 2133. [Google Scholar]
- Noumi, E.; Snoussi, M.; Trabelsi, N.; Hajlaoui, H.; Ksouri, R.; Valentin, E. Antibacterial, anticandidal and antioxidant activities of Salvadora persica and Juglans regia L. extracts. J. Med. Plants Res. 2011, 5, 4138–4146. [Google Scholar]
- Noumi, E.; Snoussi, M.; Noumi, I.; Valentin, E.; Aouni, M.; Al-sieni, A. Comparative study on the antifungal and antioxidant properties of natural and colored Juglans regia L. barks: A high activity against vaginal Candida strains. Life Sci. J. 2014, 11, 327–335. [Google Scholar]
- Vardanega, R.; Carvalho, P.I.N.; Santos, D.T.; Angela, M.; Meireles, A. Obtaining prebiotic carbohydrates and beta-ecdysone from Brazilian ginseng by subcritical water extraction. Innov. Food Sci. Emerg. Technol. 2017, 42, 73–82. [Google Scholar] [CrossRef]
- Nastić, N.; Svarc-Gajić, J.; Delerue-Matos, C.; Fatima Barroso, M.; Soares, C.; Moreira, M.M.; Morais, S.; Masković, P.; Gaurina Srcek, V.; Slivac, I.; et al. Subcritical water extraction as an environmentally—Friendly technique to recover bioactive compounds from traditional Serbian medicinal plants. Ind. Crops Prod. 2018, 111, 579. [Google Scholar] [CrossRef]
- Awaluddin, S.A.; Thiruvenkadam, S.; Izhar, S.; Hiroyuki, Y.; Danquah, M.K.; Harun, R. Subcritical water technology of enhanced extraction of biochemical compounds from Chlorella vulgaris. BioMed Res. Int. 2016, 2016, 5816974. [Google Scholar] [CrossRef]
- King, J.W.; Grabiel, R.D. Isolation of Polyphenolic Compounds from Fruits or Vegetables Utilizing Sub-Critical Water Extraction. U.S. Patent 7208181B1, 24 April 2007. [Google Scholar]
- Smith, R.M. Superheated water: The ultimate green solvent for separation science. Anal. Bioanal. Chem. 2006, 385, 419–421. [Google Scholar]
- Sahin, H.; Topuz, A.; Pischetsrieder, M.; Ozdemir, F. Effect of roasting process on phenolic, antioxidant and browning properties of carob powder. Eur. Food Res. Technol. 2009, 230, 155–161. [Google Scholar] [CrossRef]
- Nastić, N.; Svatc-Gajić, J.; Delerue-Matos, C.; Morais, S.; Fatima Barroso, M.; Moreira, M.M. Subcritical water extraction of antioxidants from mountain germander (Teucrium montanum L.). J. Supercrit. Fluids 2018, 138, 200–206. [Google Scholar] [CrossRef]
- Rodriguez-Meizoso, I.; Jaime, L.; Santoyo, S.; Senorans, F.J.; Cifuentes, A.; Ibanez, E. Subcritical water extraction and characterization of bioactive compounds from Haematococcus pluvialis microalga. J. Pharm. Biomed. Anal. 2010, 51, 456–463. [Google Scholar] [CrossRef]
- Zakaria, S.M.; Kamal, S.M.M. Subcritical water extraction of bioactive compounds from plants and algae: Applications in pharmaceutical and food ingredients. Food Eng. Rev. 2016, 8, 23–34. [Google Scholar]
- Cvetanovic, A.; Svarc-Gajic, J.; Zekovic, Z.; Jerkocic, J.; Zengin, G.; Gasić, U.; Tesić, Z.; Masković, P.; Soares, C.; Fatima Barroso, M.; et al. The Influence of the extraction temperature on polyphenolic profiles and bioactivity of chamomile (Matricaria chamomilla L.) subcritical water extracts. Food Chem. 2019, 271, 328–337. [Google Scholar] [PubMed]
- Plaza, M.; Amigo-Benavent, M.; Del Castillo, M.D.; Ibanez, E.; Herrero, M. Facts about the formation of new antioxidants in natural samples after subcritical water extraction. Food Res. Int. 2010, 43, 2341–2348. [Google Scholar] [CrossRef]
- Aryal, S.; Baniya, M.K.; Danekhu, K.; Kunwar, P.; Gurung, R. Total Phenolic Content, Flavonoid Content and Antioxidant Potential of Wild Vegetables from Western Nepal. Plants 2019, 8, 96. [Google Scholar] [CrossRef] [PubMed]
- Kobus, Z.; Krzywicka, M.; Starek-Wójcicka, A.; Sagan, A. Effect of the duty cycle of the ultrasonic processor on the efficiency of extraction of phenolic compounds from Sorbus intermedia. Sci. Rep. 2022, 12, 8311. [Google Scholar] [CrossRef] [PubMed]
- Blois, M.S. Antioxidant determinations by the use of a stable free radical. Nature 1958, 181, 1199–1200. [Google Scholar] [CrossRef]
- Benzie, I.F.; Strain, J.J. The ferric reducing ability of plasma (FRAP) as a measure of “Antioxidant Power”: The FRAP Assay. Anal. Biochem. 1996, 239, 70–76. [Google Scholar]
- Gupta, A.; Behl, T. Pharkphoom Panichayupakaranan, A review of phytochemistry and pharmacology profile of Juglans regia. Obes. Med. 2019, 16, 100142. [Google Scholar] [CrossRef]
- Żurek, N.; Pawłowska, A.; Pycia, K.; Grabek-Lejko, D.; Kapusta, I.T. Phenolic Profile and Antioxidant, Antibacterial, and Antiproliferative Activity of Juglans regia L. Male Flowers. Molecules 2022, 27, 2762. [Google Scholar]
Publisher’s Note: MDPI stays neutral with regard to jurisdictional claims in published maps and institutional affiliations. |
© 2022 by the authors. Licensee MDPI, Basel, Switzerland. This article is an open access article distributed under the terms and conditions of the Creative Commons Attribution (CC BY) license (https://creativecommons.org/licenses/by/4.0/).