1. Introduction
Before 2000, denial-of-service (DoS) attacks targeting specific locations were launched in a fairly simple fashion, such as flooding, ping of death, tear drop, smurf, land attack, and so on [
1]. Since then, however, malicious actors have been used to make the most of distributed DoS (DDoS) attacks targeting DNS route servers to sabotage URLs and IP addresses over the internet [
2]. Companies rushed to build cyber defenses in the wake of such a type of cybercrime, but after the year 2005, distributed reflected denial of service (DRDoS) attacks emerged, using multiple botnets that overwhelm the defense infrastructure [
3].
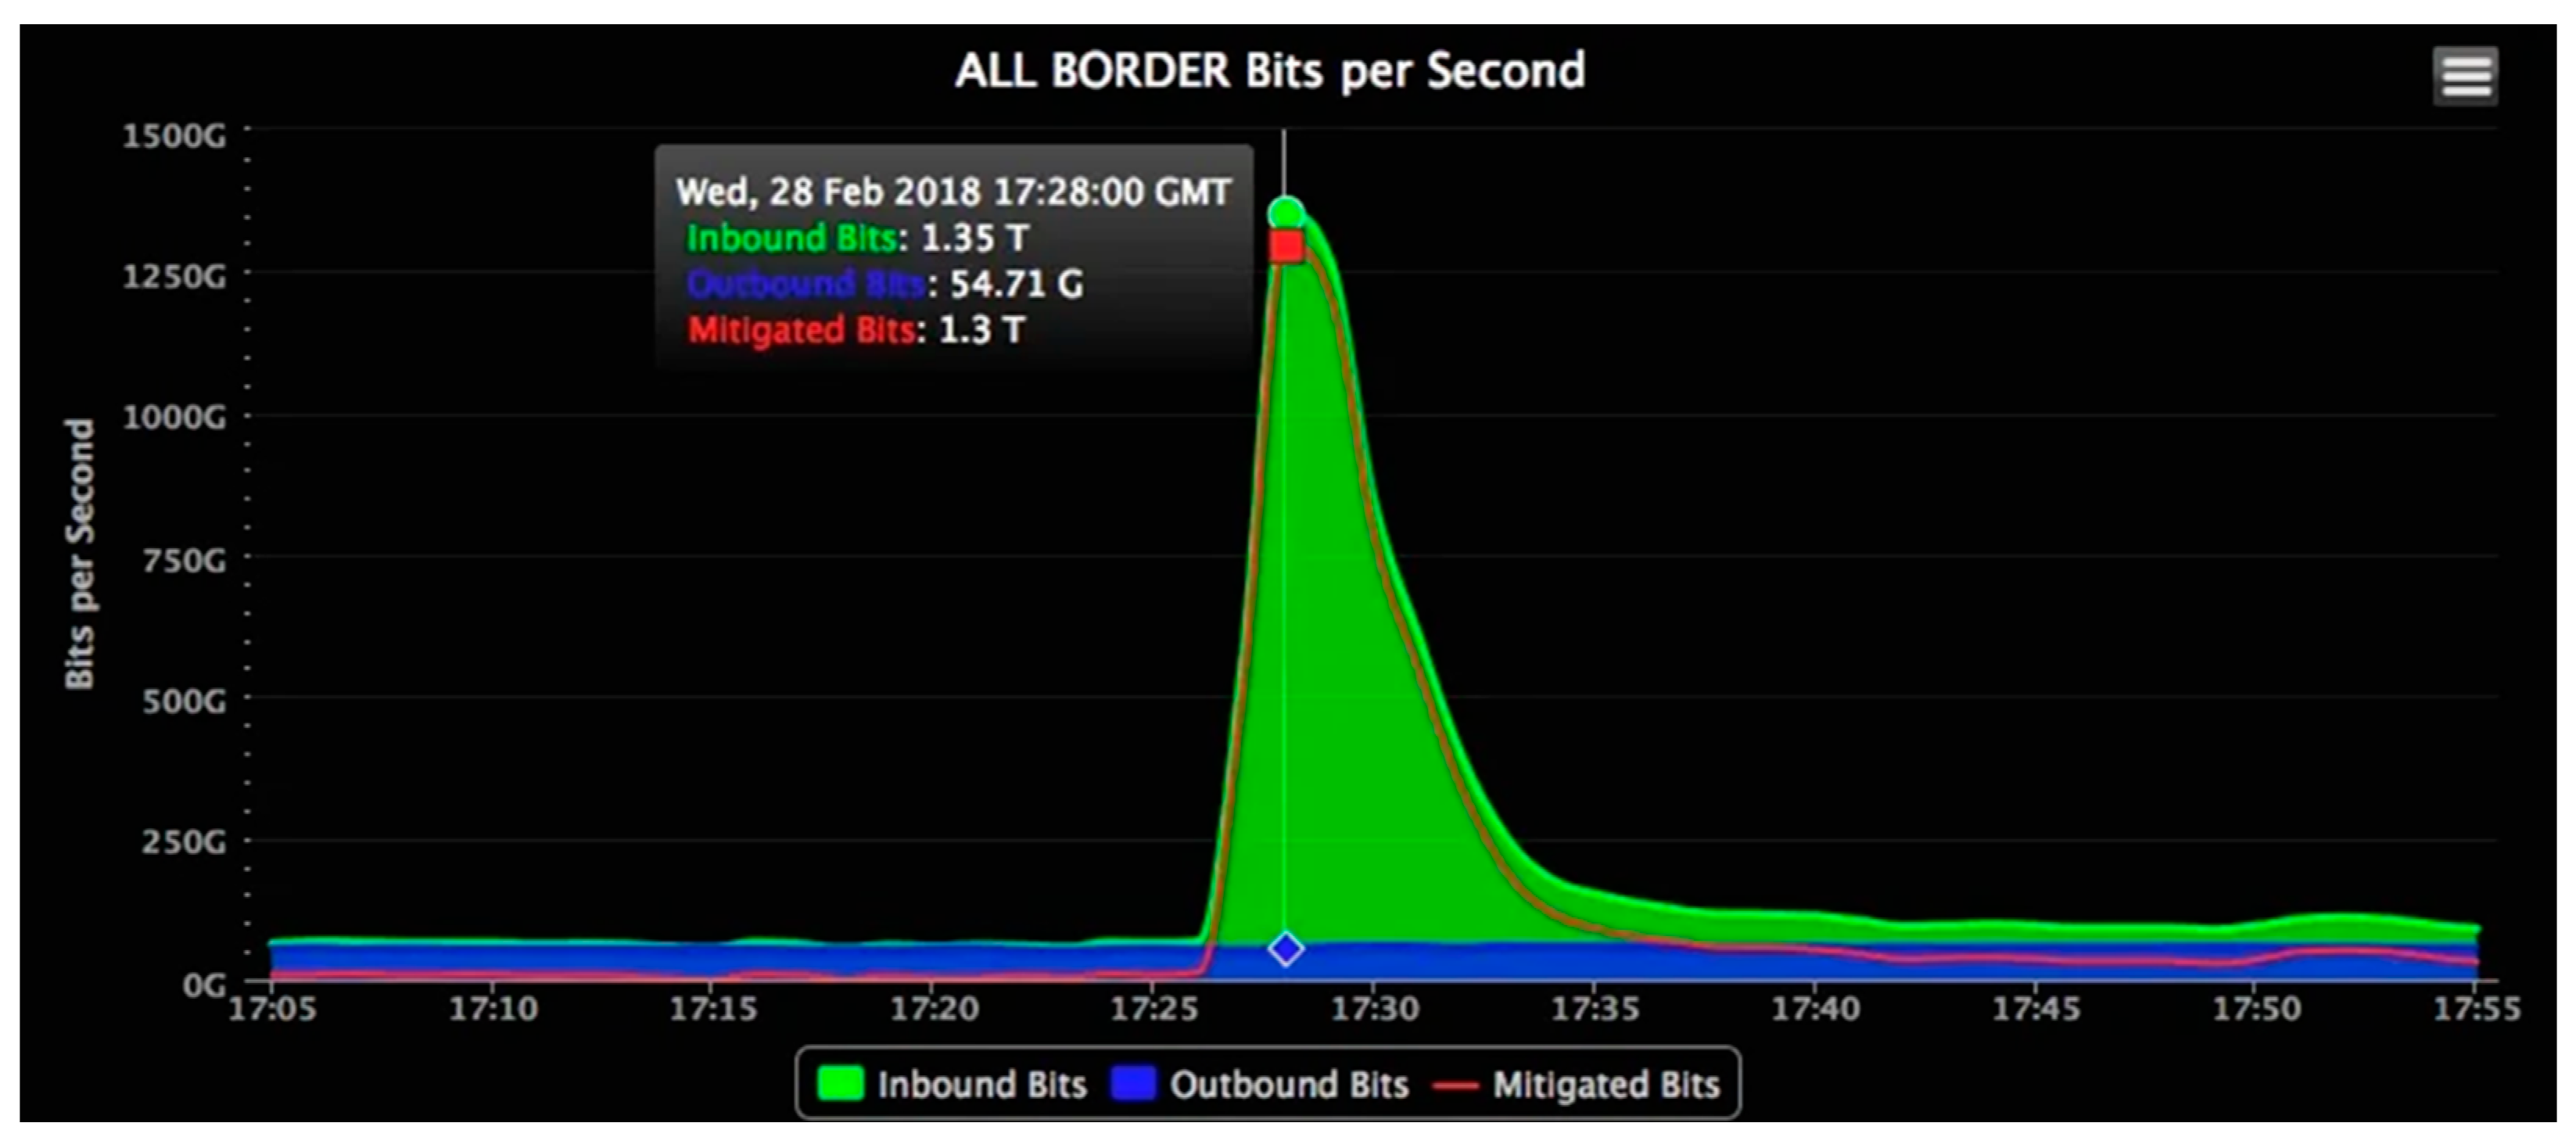
These days, hackers use more sophisticated and more advanced DDoS methodologies such as Smart Attack, to achieve nefarious goals. This ever-evolving vector of cyber raids typically includes ransom DDoS that is a tactic to demand money from companies in exchange for ending a significant intrusion, and Memcached Reflection that is an attack aimed at the Memcached server by exploiting it by sending forged requests for cashing data stored therein, using a spoofed IP address to make the victim server trigger massive responses. As shown in
Figure 1, Github was hit in February 2018 by a DDoS attack utilizing cached data. It was the largest ever recorded Memcached reflection DDoS attack, peaking at 1.35 Tbps, with the amplification power by a factor of 51,000 [
4]. More recently, a new variant of cyberattacks, called carpet bombing, emerged. Most of the ransom DDoS attacks sporadically seen from October 2020 have been in the form of carpet bombing. Carpet bomb attacks are very hard to detect an attack or identify the targeted subject as they can slide right below a baseline that DDoS mitigation solutions rely on by simultaneously dispersing traffic to multiple IPs, not one, at the same bandwidth [
5].
Initiating a DDoS attack requires multiple servers, PCs, or terminals. A botmaster builds a botnet by spreading malware targeting vulnerable applications and making use of a group of devices which have been infected via drive-by-download and come under his/her control. Once prepared, the botmaster-attacker issues commands to the botnet to trigger large-scale traffic. Therefore, all of DDoS attacks are proportional, in terms of their consequential severity, to the scale of the botnet mobilized, where most DDoS attacks use multivector attacks often combined with other types of attack vectors. For example, if a GET flooding attack, which causes the target (e.g., web or DB) to be overloaded, is used in combination with a UDP flooding attack, which saturates bandwidth by overwhelming the target, it becomes harder to differentiate attack traffic from normal traffic, making it difficult to make timely countermeasures. The success of the volumetric DDoS attack is proportional to the size of a given botnet.
Since IoT services became popularized, malicious actors began to make the most of numerous IoT devices for their DDoS attacks, appearing to be even a few Tbps in size [
6]. A typical example of a DDoS attack enslaving IoT devices was OVH, a French hosting company, which suffered a 1 Tbps DDoS attack in September 2016, where the attacker was known to take use of 145,000 CCTVs for the attack [
7]. Moreover, in the case of Dyn, a U.S. hosting company, which was the victim of a 1.2 Tbps DDoS attack occurring in October 2016, where all of Dyn’s service centers around the world were attacked, causing thousands of DNS servers to be interrupted, thereby crippling the internet across the U.S. East Coast. It was later found that the attacker had mobilized hundreds of thousands of connected devices for the attack [
8]. While 5G accelerates a new wave of IoT applications, 5G-networking IoT adoption tends to proliferate in the fields of medicine, smart home, smart factory, and smart farming, covering almost all sectors, whereby DDoS attacks naturally turn their eyes to the realm of 5G service networks. According to Gartner, the development of private deployments, vertical applications, cloud architecture, and enormous IoT connections in 5G offer new risks and problems, such as potential DDoS attack routes and access points, making 5G network security a concern for cloud solution providers (CSPs) and companies [
9].
As shown in
Figure 2, the environment to provide 5G services can be categorized broadly into four surface (plane) domains: firstly, user equipment (UE) surface; secondly, radio access ntwork (RAN) surface; thirdly, core network (CN) surface; and fourthly, service surface. Therefore, 5G infrastructure-involved DDoS attacks may target the RAN surface, CN surface, and service surface. Attacks in the service surface are usually targeted on voice service that is the most basic service that mobile service providers offer. In the 5G mobile communication network, voice services use Session Initiation Protocol (SIP), the vulnerability of which is often exploited by DDoS attackers with a final target being the IP Multimedia Subsystem (IMS).
Prior research on DDoS mitigation methods, simply put, include those studies focused on attacks abusing radio resource control (RRC) protocol, and those focused on attacks abusing the SIP used for voice and SMS services [
10,
11]. Nevertheless, to the best of our knowledge, there is little or no research focused on DDoS attacks targeting the CN. Unlike the RAN, the CN is a central conduit acting as the backbone network, so once crashed by a DDoS attack, the consequence is disastrous, with far greater ripple effect, in contrast with the base station whose impact arising from failure is limited to its geographical coverage. DDoS attacks targeting the CN usually use techniques called signaling DoS. Since it can be hard to differentiate malicious traffic from legitimate traffic, signature generation techniques are insufficient to detect them [
12].
To detect signaling DDoS attacks in 5G, it is inevitably required to analyze 5G network traffic. As defined by the International Telecommunication Union (ITU), one of the leading international standards organizations, the minimum requirement for the download peak data rate in 5G mobile communication technology is 20 Gbps per user [
13]. It connotes that the 5G network must shoulder traffic in the Tbps level even when there are only 50 users in an independent network. According to the Ericsson Mobility Report, mobile data traffic has increased almost 300-fold since 2011 [
14]. To deal with the large volume of traffic, it is crucial to facilitate statistical analysis methods, not relying on a single network packet. Efficient analysis tools are further required, such as machine learning (ML)-based algorithms capable of analyzing huge amounts of data as quickly as possible.
There are a lot of studies attempting to detect signaling DoS using conventional ML-based algorithms, which are, however, not applicable for signaling DoS attacks targeting the CN in 5G. What is worse, those prior studies reveal the very low efficiency, with a detection rate of between 50% and 60% [
15,
16,
17]. Under a situation such as that, the present study proposes a signaling DDoS detection method for security inside the CN infrastructure in 5G, which utilizes ML-based algorithms incorporating entropy-based analysis (EBA) and statistics-based analysis (SBA) techniques. How to evaluate the proposed method is also provided in this paper. The contribution of this article is summarized as follows:
We proposed, for the first time in the relevant field, a method to mitigate signaling DDoS attacks and a detection system utilizing that method, with respect to CN protocol (HTTP/2, PFCP) in the 5G SA environment.
We presented a statistical- and probabilistic-based analysis technique capable of more precisely detecting signaling DDoS attacks in the 5G SA environment in which large-volume traffic flows.
We verified the excellence in performance of the detection method proposed herein, by creating raw network traffic for the 5G SA CN protocol and utilizing it in validating the feasible applicability of the proposed method to defend against signaling DDoS attacks.
The following is how this paper is structured:
Section 2 includes background information with reference to the existing literature and also describes elements of the 5G SA CN and the key characteristics of signaling DDoS.
Section 3 describes relevant and prior research, and
Section 4 details the method proposed herein.
Section 5 describes the result of its validation,
Section 6 discusses the analysis resulting from the validation, and finally,
Section 7 makes a conclusion.
2. Preliminary
2.1. 5G SA Structure
The 3rd Generation Partnership Project (3gpp) is a de facto standard for 5G, which defines the architecture of a 5G network and its components [
18]. The 3GPP defines the 5G standard as having two different operating modes: non-standalone (NSA) and standalone (SA). In addition, the architecture is separated into user plane and control plane, each functioning independently. The user plane, also referred to as the data plane, enables data transfer to and from users when using services in the network. The control plane securely opens a communication channel to provide services, performs functions such as user authentication, and conveys “signal messages between network components including user equipment (UE)” to enable communication service.
Network components encompass UE, base station, and CN functions including the Access and Mobility Management Function (AMF). The air (wireless) interface between the UE and base station is called the radio access network (RAN) in which the CN includes the base station, the AMF through the wireless link, the User Plane Function (UPF), the Session Management Function (SMF), and so forth.
As a base station is an intermediary node serving as an only-one gateway between wireless and wired domains in the 5G network, it uses RRC and Next Generation Application Protocol (NGAP) for signaling messages in the control plane. The RRC protocol is used to control radio bearers between terminals and a base station, and NGAP is used to carry non-access stratum (NAS) between a base station and the AMF. Moreover, next-generation NodeB (gNB) is a 5G base station that has a radio coverage that geographically reaches 20 km
2 or below [
19]. Therefore, a few tens of gNBs are required to cover the service area of one metropolitan city such as Seoul.
As far as those defined by 3GPP are concerned, there are at least nine CN functions such as AMF, as shown in
Table 1 [
18].
They use service-based architecture (SBA)-based HTTP/2 protocol with JSON, and use Packet Forwarding Control Protocol (PFCP) only between the Session Management Function (SMF) and the User Plane Function (UPF) to connect the user plane and the control plane. Unlike the base stations that must be installed in the vicinity of their neighboring base stations, with a specific distance between them observed, to form the wireless cells that cover a region of interest, CN functions, located in the internal network constructed by a mobile network operator, provide services from centralized servers and operate using this small number of high-performance systems.
Whereas many base stations (although varied in number depending on the size of the service area) must be densely placed in the cell to provide 5G services, CN functions require a small number of servers, the fact of which conveys multifaceted implications from the security perspective. One of them, inter alia, is that, although it is far harder for attackers to gain access or attack CN functions, the consequential impact from any CN function, once assaulted or abused, is often much severe, incomparably so, than as in the case of a base station.
2.2. 5G SA CN Protocol Message
When it comes to 5G CN protocols, the NSA architecture uses lower-layer UDP and upper-layer GTP-C protocol stacks and lower-layer SCTP and upper-layer diameter protocol stacks [
20]. On the other hand, the SA structure allows CN functions to use HTTP/2 protocols with JSON, based on SBA. As the protocol dedicated to sending and receiving messages between CN functions was changed to HTTP/2, the burden of data transmission weighs heavier than in the use of traditional GTP-C protocol since individual transfer size is bigger and the messages to create a session are larger in number.
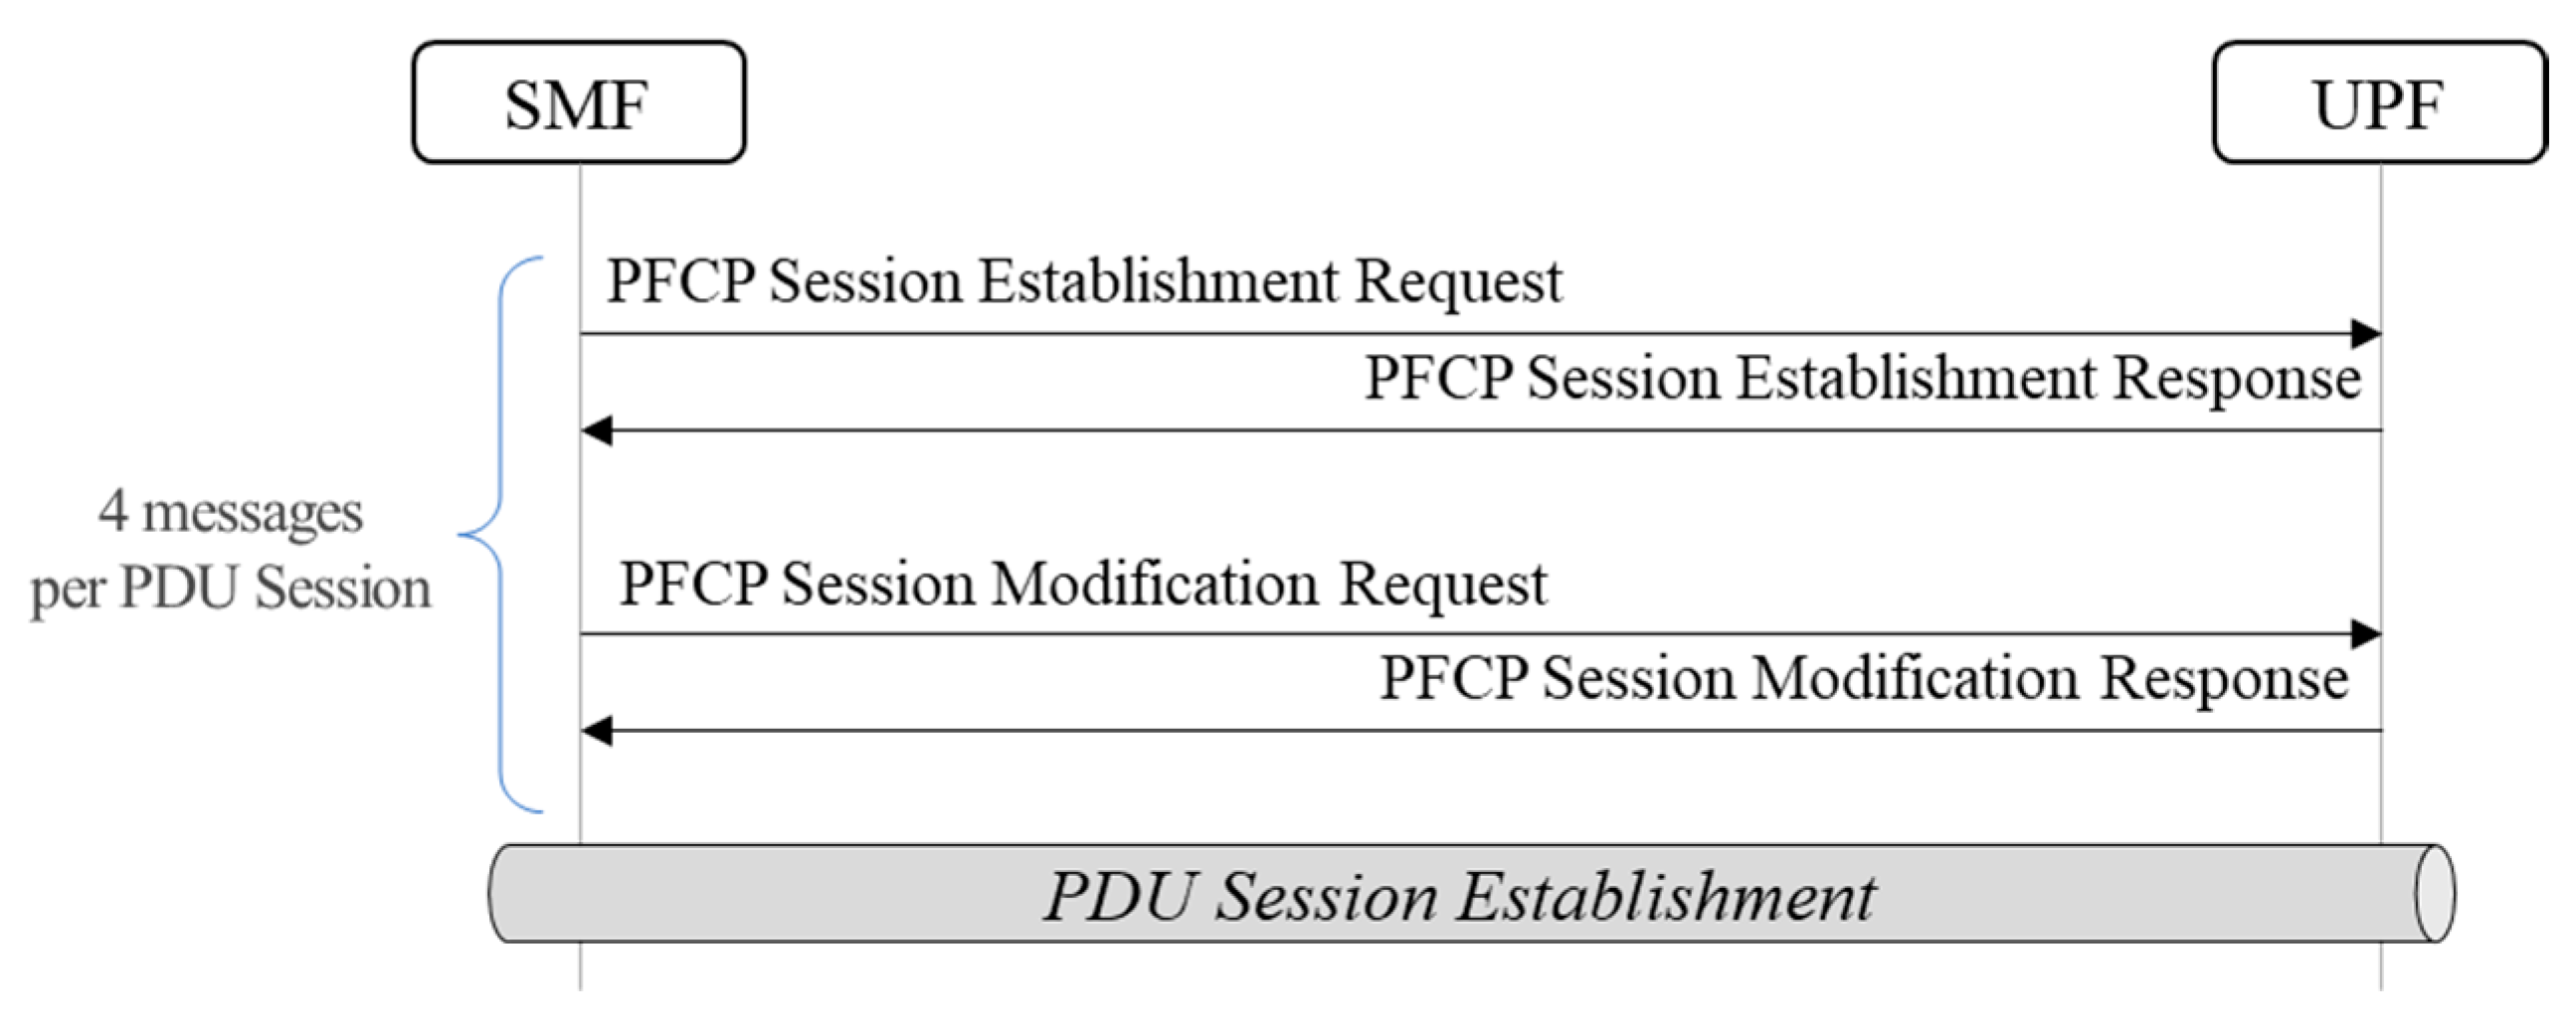
When UE registers with the 5G CN, HTTP/2 and PFCP messages are sent as shown in
Figure 3 and
Figure 4. In this regard, we counted the number of messages in protocols HTTP/2 and PFCP being generated when registering one UE in the 5G SA architecture. As a result, it was found that a total of 4 HTTP/2 messages are generated during the authentication procedure on the registration flow. Moreover, when assuming that a user generally uses the internet, voice call, and text messaging services, a total of 3 packet data units (PDUs) per service are activated. n HTTP/2 message for the establishment of 3 PDU sessions generates a total of 24 messages made up of 8 messages per PDU session. Additional messages exist for the PFCP. It generates a total of 12 messages, with each PDU session composed of 4 messages. To put together both HTTP/2 and PFCP, one UE triggers 40 CN protocol messages in total.
As for the de-registration procedure, on the contrary, HTTP/2 generates a total of 18 messages made up of 6 messages per PDU session, to remove the PDU session. Meanwhile, PFCP generates a total of 6 messages made up of 2 per PDU session.
2.3. Signaling DDoS Attack and the Degree of Impact
Signaling DDoS has been one of security threats addressed even in the era of 3G or LTE [
21]. When the 5G era emerged, CN functions evolved into the SBA, making the protocol size bigger and the messages necessary for creating a single session larger in number. The underlying meaning is that signaling DDoS has a far greater impact on the CN than ever before.
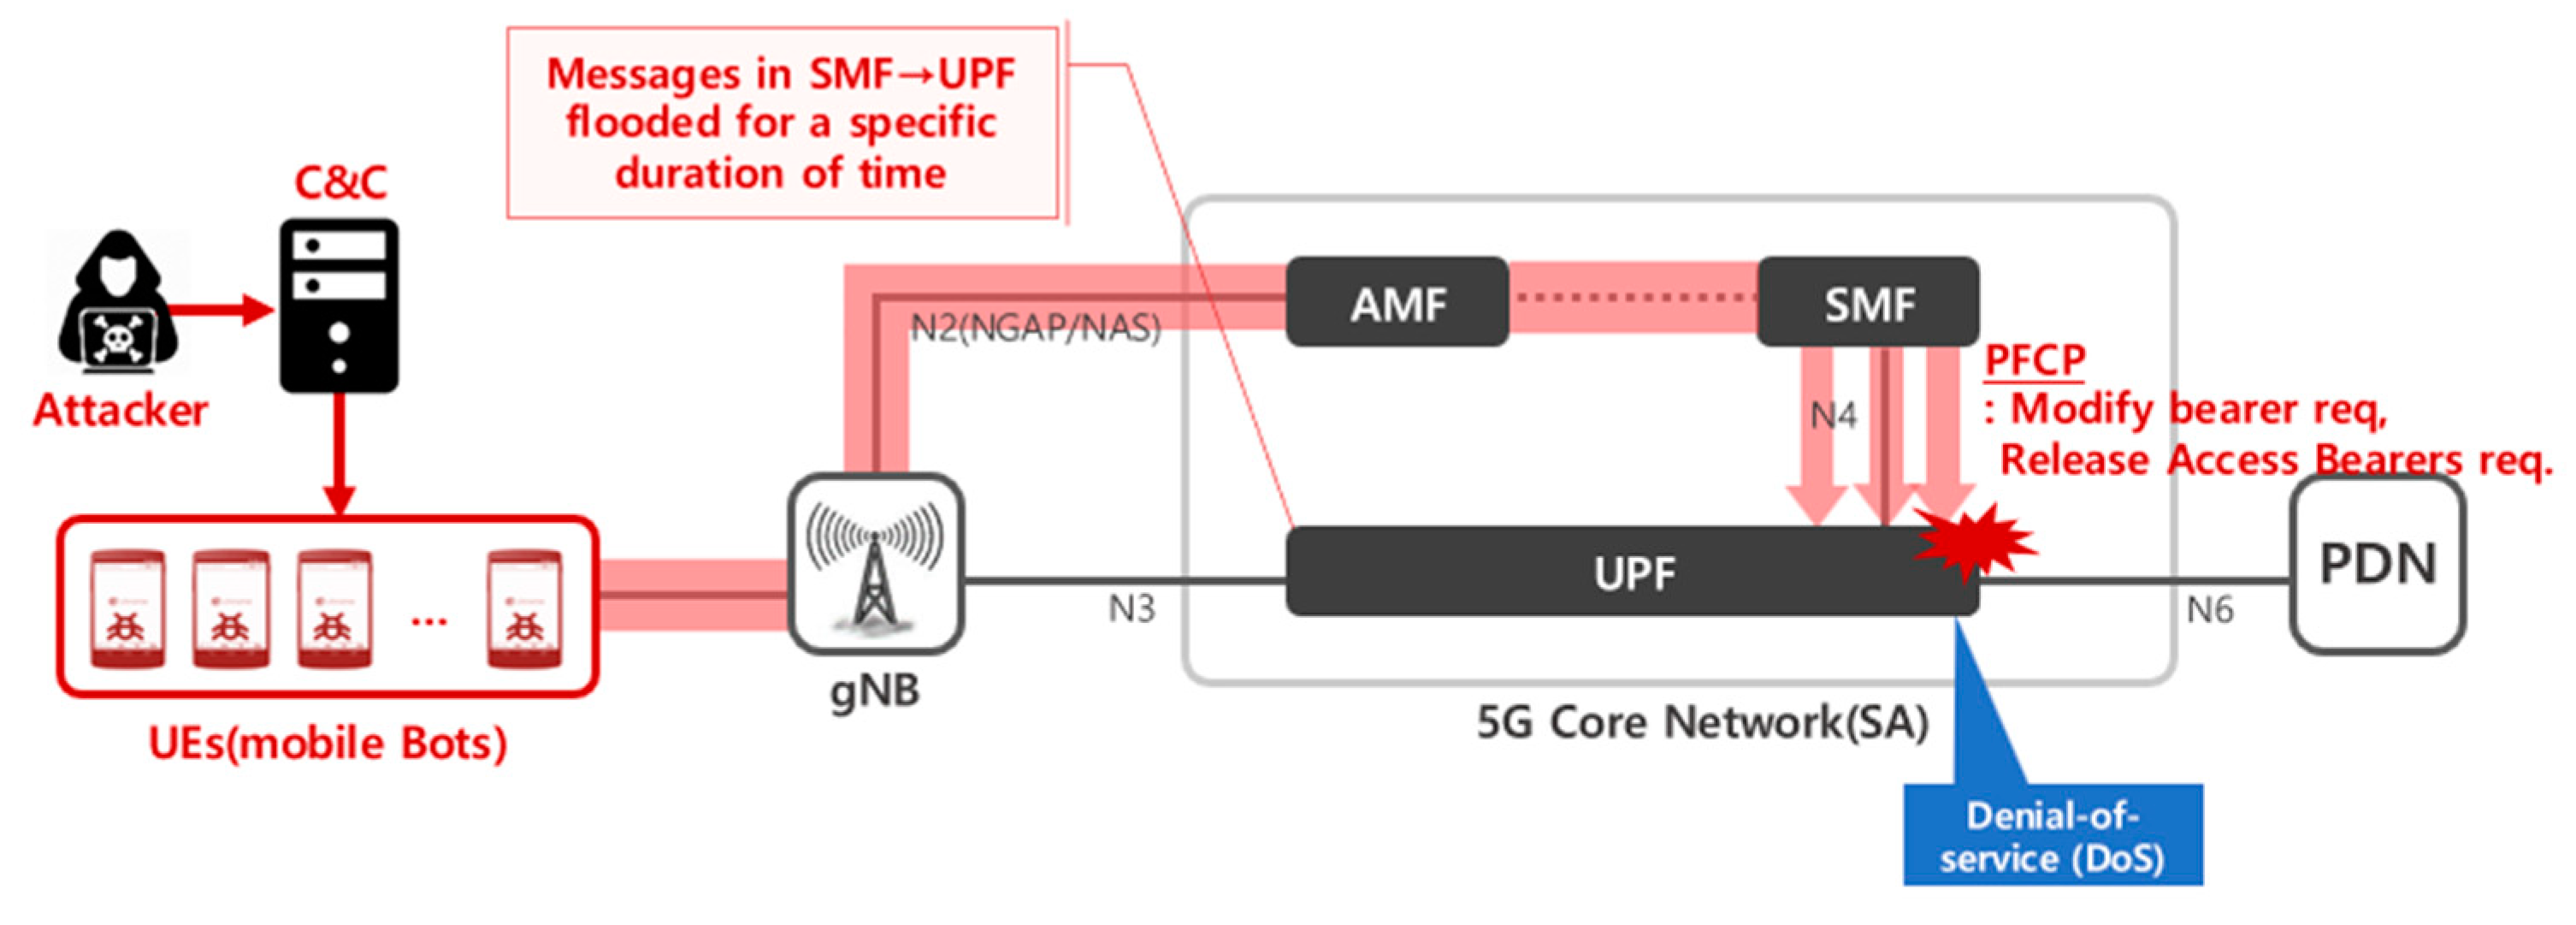
To complete re-registration for one UE, the required messages in protocols PFCP and HTTP/2 are approx. 40 in number. As shown in
Figure 5, provided multiple connected devices are utilized for signaling DDoS attacks in the mobile network environment, CN functions could fall into an overloaded state and the services the corresponding CN function provides could be disrupted or come to a standstill in the whole affected region.
3. Related Works
Initial research on signaling DDoS was undertaken in the general wired network environment rather than the mobile network environment. David et al. [
22] proposed a technique of detecting general types of DDoS attacks targeting, e.g., ICMP protocol based on the fast entropy method using flow-based analysis. Kati et al. [
12] dove into algorithms capable of detecting DDoS attacks utilizing machine learning (ML) in the cloud computing environment.
Since then, signaling DDoS-focused research in the mobile network environment has also been performed. Jang et al. [
21] introduced a threshold-based detection algorithm utilizing sessions to infer signaling DoS events in the CN of the LTE environment. However, the threshold-based detection technique makes it difficult to trace back the locations of trackers in the case of a subtle attack where the attacker uses one terminal, out of a multiple of legitimate terminals, so that peak of attack traffic does not exceed the detection threshold set by network administrators.
To cope with this drawback, Gupta et al. [
15] proposed an SVM-based detection method utilizing EBA featuring, with respect to signaling DDoS attacks exploiting wake-up packets in 3G/4G. This ML-based algorithm was trained to quantify its detection performance, using one week of TCP, UDP, and ICMP packets as datasets generated by 62 different smartphones. The experimental result showed a detection rate of 53.8%, indicating that the performance was not worth being applicable in the real field.
Research on dealing with signaling DDoS attacks in the 5G environment has been focused mainly on attacks trying to take advantage of weaknesses within RRC protocols generally used in the RAN. Ettiane et al. [
16] proposed a randomization-based technique utilizing RRC protocols in the 5G MTC environment, being designed to mitigate the impact of signaling DDoS attacks. In addition, they proposed a robust defense algorithm that can reduce false positives without being affected by exceptional traffic data when a signaling DDoS attacks by abusing the RRC protocol in the 4G/5G MTC environment [
10]. They recently also proposed the robust, randomization-based response scheme against signal DoS attacks to disrupt RRC protocols in the 5G MTC environment. However, the result of the performance validation test for the detection rate revealed that detection accuracy was merely 59.8% [
17].
Recently, strategies that adopt deep learning-based detection algorithms have been introduced to defend against signaling DDoS leveraging the RRC protocol, VoLTE Call attack, and SMS flooding attack. Hussain et al. [
11] proposed the detection method based on DRC (deep rudimentary CNN) and ResNet (residual network)-50 algorithms to combat three types of DDoS attacks (VoLTE Call attack, RRC signaling attack, and SMS flooding attack) in the 5G CPS environment. The detection algorithm with the DRC (deep rudimentary CNN) algorithm applied exhibited a detection rate of at least 91%, and the algorithm with the ResNet (Residual Network)-50 algorithm applied exhibited a detection rate of at least 97%, both being deemed to be very effective. However, they skipped studies on signaling DDoS attacks in the CN.
4. Proposed Machine Learning Technique for Detection System
This paper proposes an ML-based detection technique that employs EBA and SBA to protect 5G CN functions from signaling DDoS attacks. In general, an ML-based detection algorithm is validated using a procedure consisting of five steps, as follows:
- ①
Data collection;
- ②
Data preprocessing;
- ③
Feature engineering (feature selection);
- ④
ML algorithm;
- ⑤
Evaluation.
Hereunder is the description thereof, in order of the concept of EBA and SBA, data collection utilizing 5G CN protocol traffic, data preprocessing, feature engineering, ML algorithm, and the evaluation method. After that, the structure of the signaling DDoS attack detection system with the detection scheme employed, as well as ways of its operation, will be discussed.
4.1. The Concept of EBA and SBA
EBA is an entropy-based analysis that detects abnormal traffic by determining whether the probability distribution of the data is uniform. In this case, the time interval of the specific criterion (XDR, Bearer or XDR plus Bearer) learning data is measured, and whether this interval is equal is indicated by entropy. The amount of entropy information is calculated by measuring the interval of time frames that follow a uniform distribution for each data and are successful in generating a signaling session.
SBA is a statistics-based analysis that statistically compares the size of the distribution of the data. The abnormal traffic data uses the fact that the transmission interval is shorter than normal data and the probability distribution is concentrated. After extracting the time interval of the specific criterion (XDR, Bearer or XDR plus Bearer) learning data, the intervals with other data are made into statistical distributions such as mean or variance and compared using three statistical test models (chi square, anova, and mutual information).
4.2. Data Collection Utilizing 5G CN Protocol Traffic
Traffic data collection on a 5G CN is carried out using a dedicated collection system that is discrete to a detection system. The collection system mirrors traffic on the network switch connected with the N2 interface (gNB-AMF), the N3 interface (gNB-UPF), and the N11 interface (AMF-SMF). The number of fields on the collection system being collected through 5G CN protocol traffic is 79, among which the number of fields utilizable to detect signaling DDoS attacks are 6 in total, as shown in
Table 2, viz: User IMSI, SMF IP, AMF IP, UPF IP, gNB IP, and Bearer created time. We constructed datasets using a traffic emulator by injecting traffic into a 5G CN environment and then recreated them based on traffic data collected from a real-world 5G network via the collection system.
4.3. EBA and SBA Based Data Preprocessing
For the purpose of signaling DDoS attack detection, we defined new features based on the EBA and the SBA, performed data preprocessing, created data having new features as shown in
Table 3 by utilizing EBA and SBA, and completed feature selection using a variety of statistical-based test methods.
- (1)
Statistical-based Features
First of all, we performed preprocessing utilizing the SBA with respect to time value and the number of users.
① As depicted in
Figure 6, we performed preprocessing as given below, for the total time value (
t_total_time). The interval in time between the first traffic and the last travel of one user (identified by IMSI) for a duration of 1 min of unit time (S is a bearer or session create time):
In this case, the value of total time is (a) 0 if the number of the traffic for 1 min as unit of measure is less than 2, or (b) 60 or less if the number of traffic for the same duration is 2 or greater.
② As depicted in
Figure 7, preprocessing was performed as given below, with respect to mean time value (
t_mean_time), variance time value (
t_var_time), and standard deviation time value (
t_std_time). These variables of feature give us an insight that a DDoS attack is characterized by generating attack traffic in a periodic time-interval. Traffic-to-traffic time interval as to a single user (identified by IMSI) for 1 min as unit of measure:
where X = {
x1,
x2,
x3, …,
xn} and (
xn =
Sn −
Sn−1).
③ As depicted in
Figure 8, preprocessing was performed as given below, with respect to the single IMSI count (
t_imsi_count) and total IMSI counts (
total_count). These variables of feature give us an insight that a DDoS attack is characterized by generating large amounts of fake traffic for a short period of time. The IMSI number as to a single user and whole users (identified by IMSI) for 1 min as unit of measure:
- (2)
Probability-based features
① As depicted in
Figure 9, preprocessing was performed as given below, with respect to the amount of information (entropy) per IMSI-based user identifier (
imsi_entropy). This feature allows us to calculate entropy based on the probability that attack traffic is generated by a single 5G subscriber (identified by IMSI) for 1 min as unit of measure.
where
P(
xi) = the probability that the
i-th user (identified by IMSI) generates attack traffic for a duration of unit time
② As depicted in
Figure 10, preprocessing was performed as given below, with respect to the entropy of a single IMSI (
imsi_smf_entropy,
imsi_amf_entropy,
imsi_upf_entropy,
imsi_gnb_entropy) per equipment IP (smf, amf, upf, gnb). This feature allows us to calculate the entropy at the time when a single 5G user (identified by IMSI) is mapped with main functions within the CN and base station (gNB) IP.
③ As depicted in
Figure 11, preprocessing was performed as given below, with respect to the entropy of all relevant IMSI identifiers per equipment IP (
smf_entropy,
amf_entropy,
upf_entropy,
gnb_entropy). This feature allows us to calculate entropy of 5G users (identified by IMSI) triggered by main functions within the CN and base station (gNB) IPs.
4.4. Feature Engineering
Subsequently, features newly defined via data preprocessing were classified using a method of feature selection. Based on this statistical approach, we employed univariate feature selection that is a technique of, when classifying independent variables through feature selection using a predictive model, selecting those variables which contribute most to the model performance and predominant correlation. In this study, three statistical models are used, as follows:
- ①
Chi square test;
- ②
Analysis of variance (Anova) F test;
- ③
Mutual information test.
As for each statistical model, 2 to 15 features were selected from the preprocessed data and then feature transformation and scaling were undertaken based on each feature selected. When performing feature transformation, the mean, variance, and standard deviation of the traffic generation time interval were calculated, and the number of traffic generated by the user during the unit time was scaled. In addition, when performing feature selection, statistical tests were used to preferentially select the most correlated feature (if two are selected, t_mean_time and total_count).
4.5. ML Algorithms
After the process of feature selection, we selected ML algorithms for feature classification (ML classifier). A set of the three traditionally well-proven ML classifiers used herein are ① Bayesian classification, ② support vector machine (SVM), and ③ random forest. Hereunder is a description on the basic characteristics of each of those three ML classifiers.
- (1)
Bayesian Classification Algorithm
The Bayesian classification algorithm is based on Bayes’ theorem assuming attributes are independent given the class, where Bayesian classifiers are the probabilistic classifiers. It is an algorithm using the condition between the prior probability (likelihood of an event occurring before taking new information) and the posterior probability (likelihood of an event occurring after taking new information) of two random variables [
23]. The Gaussian Naive Bayes algorithm is typically used in ML.
- (2)
Support Vector Machine Algorithm
SVM is a classifier that is based on the non-probabilistic binary linear classification algorithm, seeking the best decision boundary to be as wide as possible, in the feature space with boundaries [
24]. With the margin being as large as possible, it tries to make a decision boundary that best represents two categories and identifies true and false from the outcome.
- (3)
Random Forest Algorithm
The random forest algorithm, an ML algorithm developed by Breiman [
25], is a kind of ensemble learning method for classification, regression analysis, and other tasks. It operates by constructing a multitude of decision trees at training time, where the output of the random forest is the class selected by most decision trees or the mean prediction of the individual trees is returned. Random forest is a form that combines the output of multiple decision trees, generally having high accuracy but somewhat low speed.
The selected ML algorithms were tested, assessed, and validated in terms of accuracy. In this study, features were set to be 4 or less in number based on the statistics result in the course of feature selection, and then applied to the individual ML algorithms. The following chapter briefly describes the method of evaluating the algorithm performance.
4.6. Evaluation
The method of evaluating the signaling DDoS attack detection algorithm using ML classifiers is described below, together with the evaluation matrix.
- (1)
Evaluation matrix: Confusion Matrix and Accuracy
When evaluating the performance of an ML algorithm, to measure the predictive accuracy of our model, we used a confusion matrix that is the most-intuitive model performance measurement, where individual predictions in a model can be true or false as to the actual that is correct or incorrect. Terms used in the matrix are outlined in
Table 4.
Accuracy for the matrix can be calculated by taking averages of values, i.e.,
Meanwhile, the
F1 score that tells how precise an attack traffic detection algorithm is can be defined as:
- (2)
K-fold Cross Validation
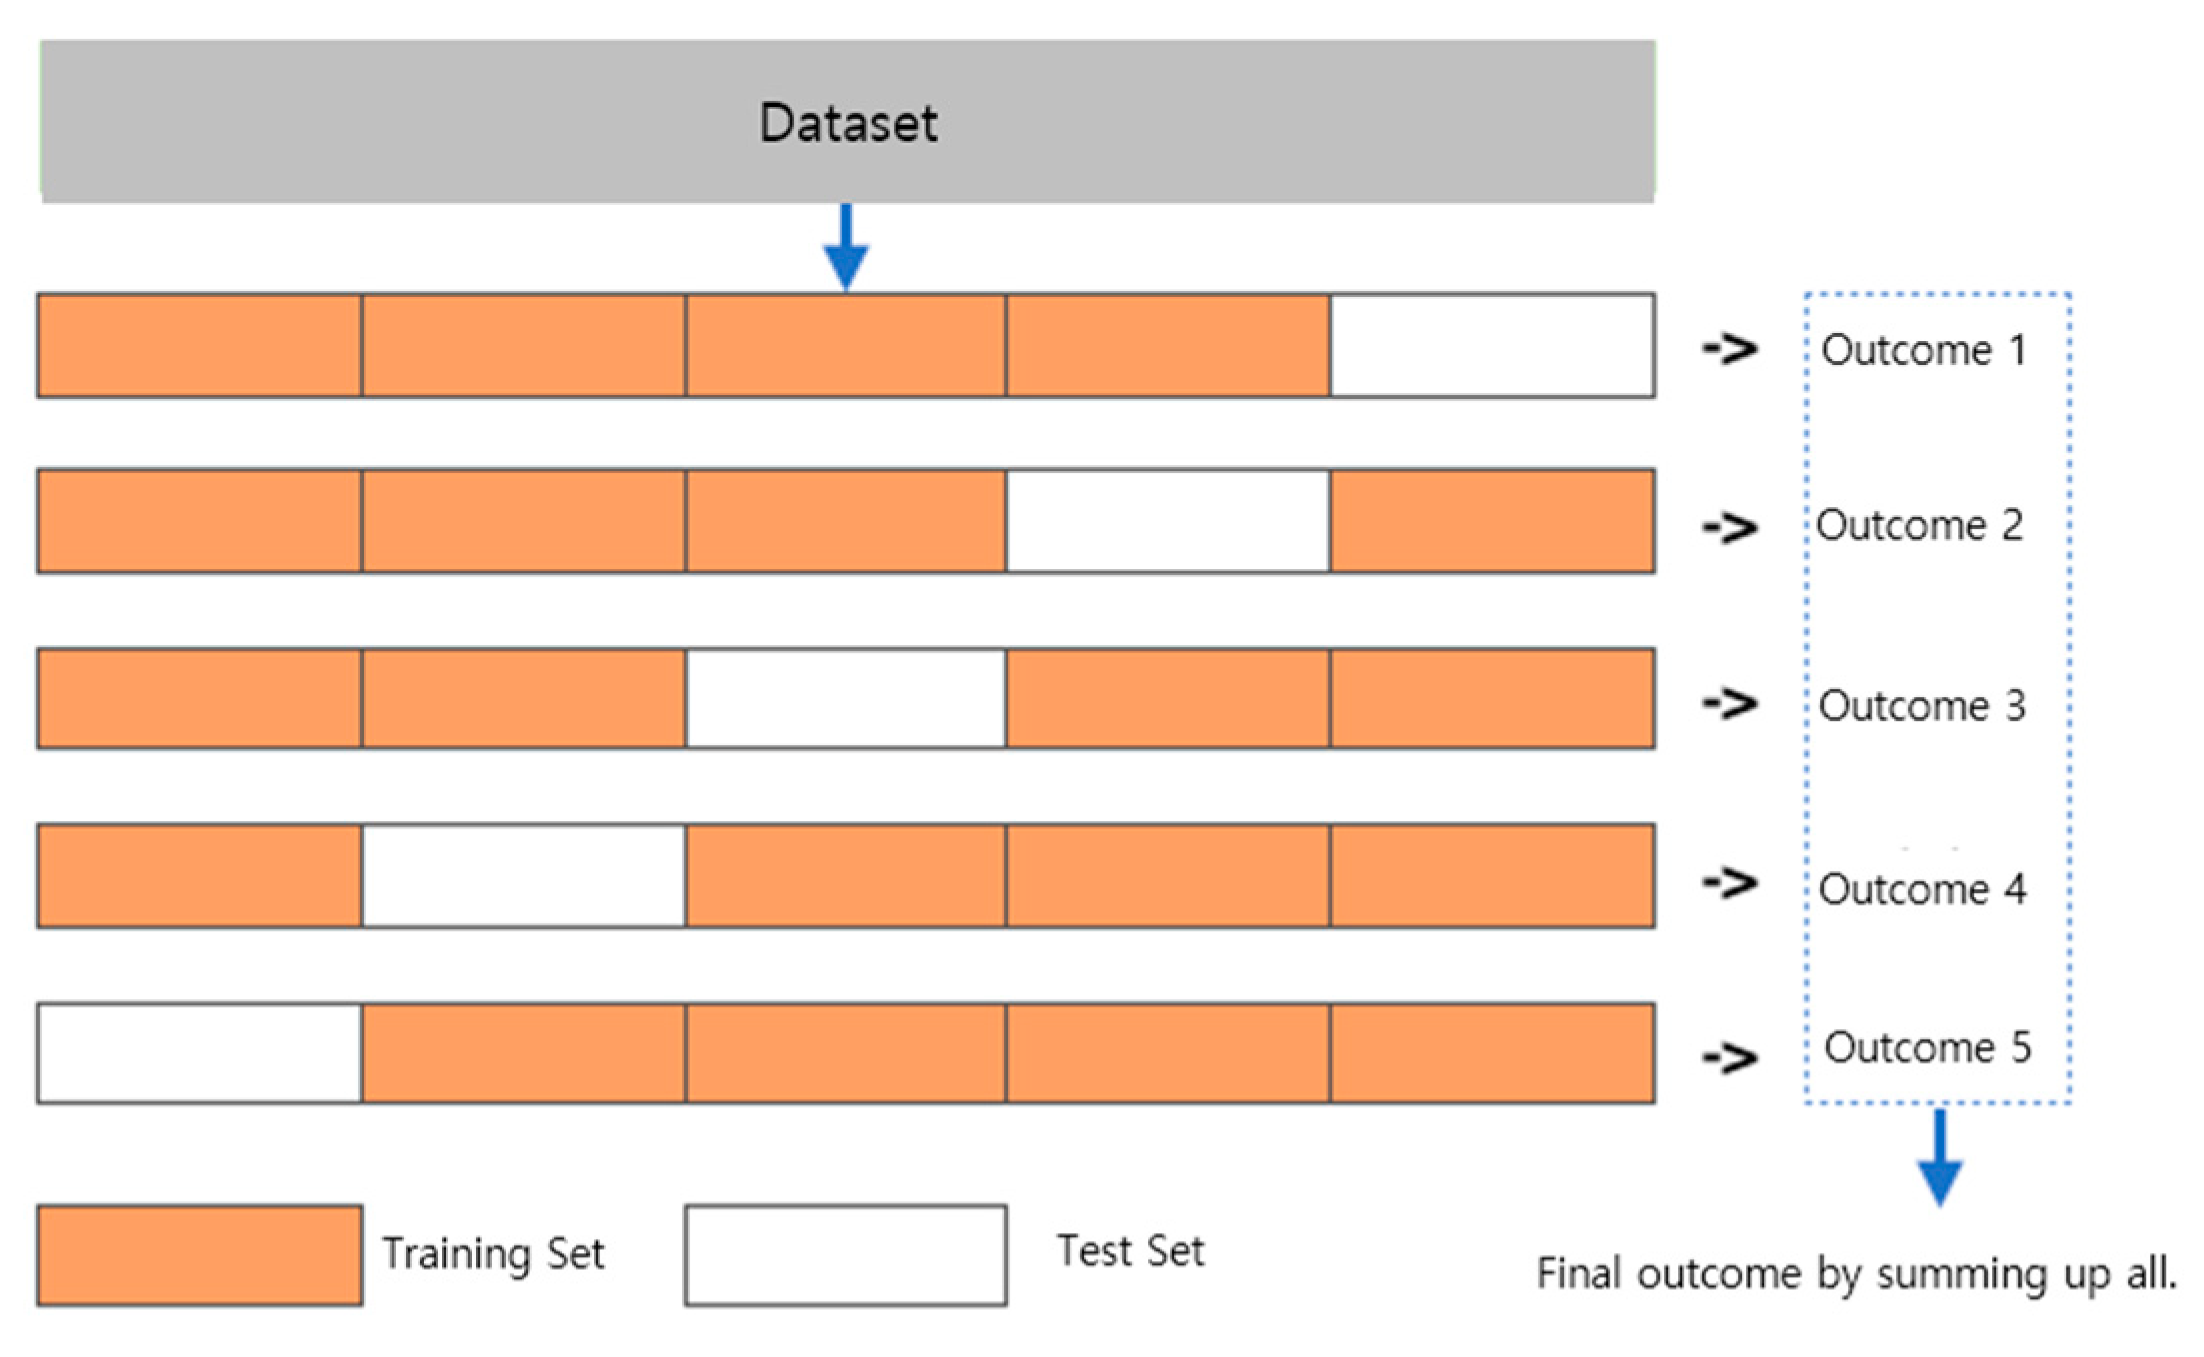
To evaluate and validate the signaling DDoS attack detection model proposed herein, cross-validation was undertaken, as shown in
Figure 12, by splitting the shuffled dataset into k groups (k = 5), taking the groups as training data and test data, and fitting the model using them, where a supervised learning technique was applied to teach the model on the well-labeled training dataset.
4.7. Design of Intrusion Detection System and Its Operation
As can be seen in
Figure 13, the intrusion detection system consists largely of three modules: ① Apache Kafka [
26] and the traffic data preprocessing module making use of Redis [
27] memory DB, ② the data training module making the most of ML, and ③ the data detection module making the most of ML. Collection systems are required to collect packets transmitted through diverse interfaces in 5G CN as a basic function and to identify and track users from the packet data collected [
28].
The system has six file items (elements), as listed in
Table 5. It can be divided into: ① configuration, ② data, ③ training model, ④ connection module (Apache Kafka and Redis), ⑤ machine learning (common) module, and ⑥ signaling DDoS detection process.
The “⑥ signaling DDoS detection process” has three submodules, i.e., machine learning preprocessing module, machine learning training module, and machine learning detecting module.
- (1)
Machine Learning Preprocessing module
Figure 14 shows the workflow of how a submodule (a part of the overall solution) records/saves the processing time that represents to what extent of data from Redis (memory DB) is taken and processed. It plays the role of flags on postprocessed data informing from what portion the system needs to start processing.
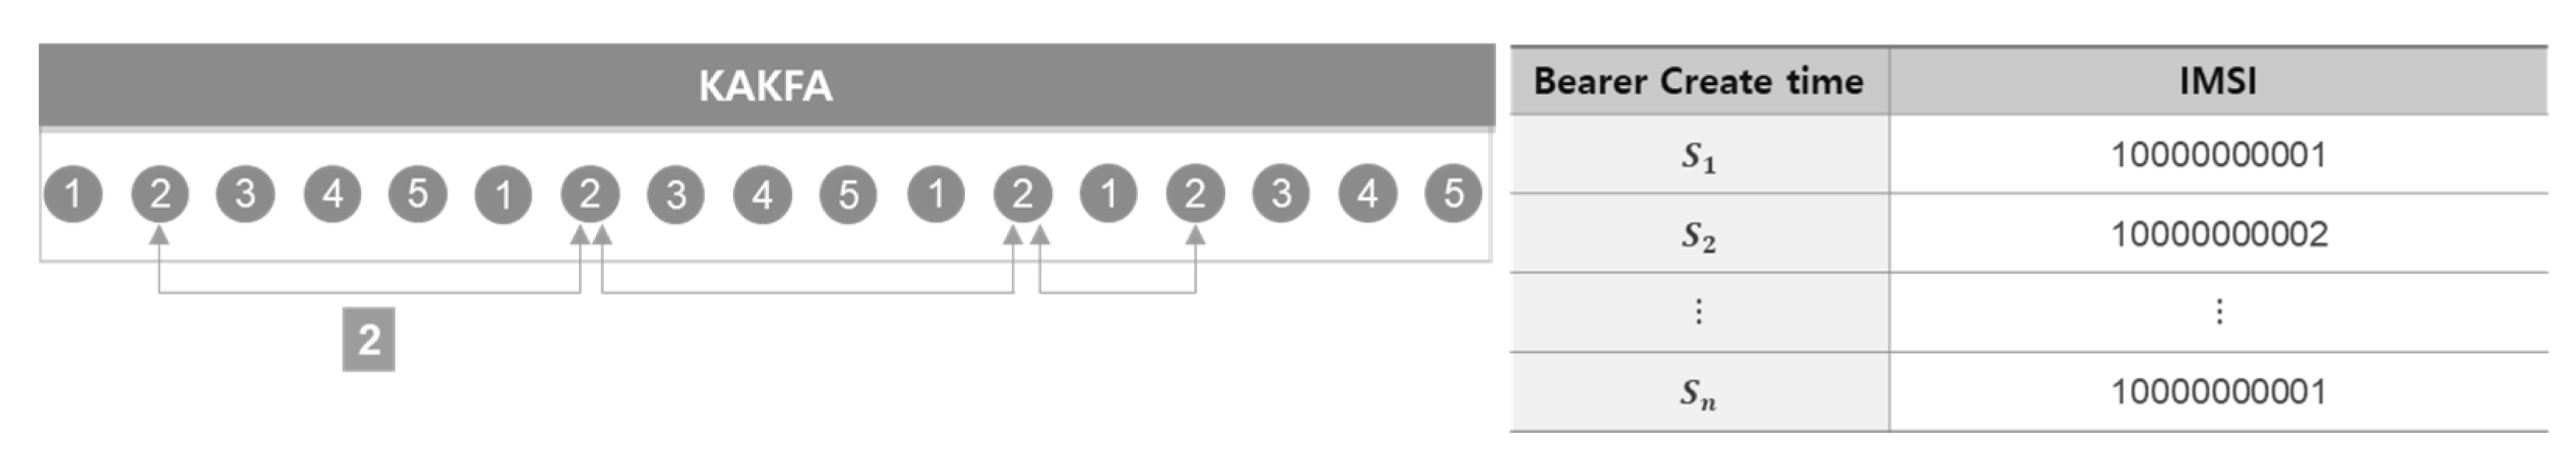
At the front door of the preprocessing module, there must be a collection system that collects 5G CN protocol traffic data and manipulates it to the form of XDR. The collector captures CN protocol traffic data through switch mirroring and processes it to the type of extended data record (XDR). Processed, large-volume traffic data is delivered to Apache Kafka [
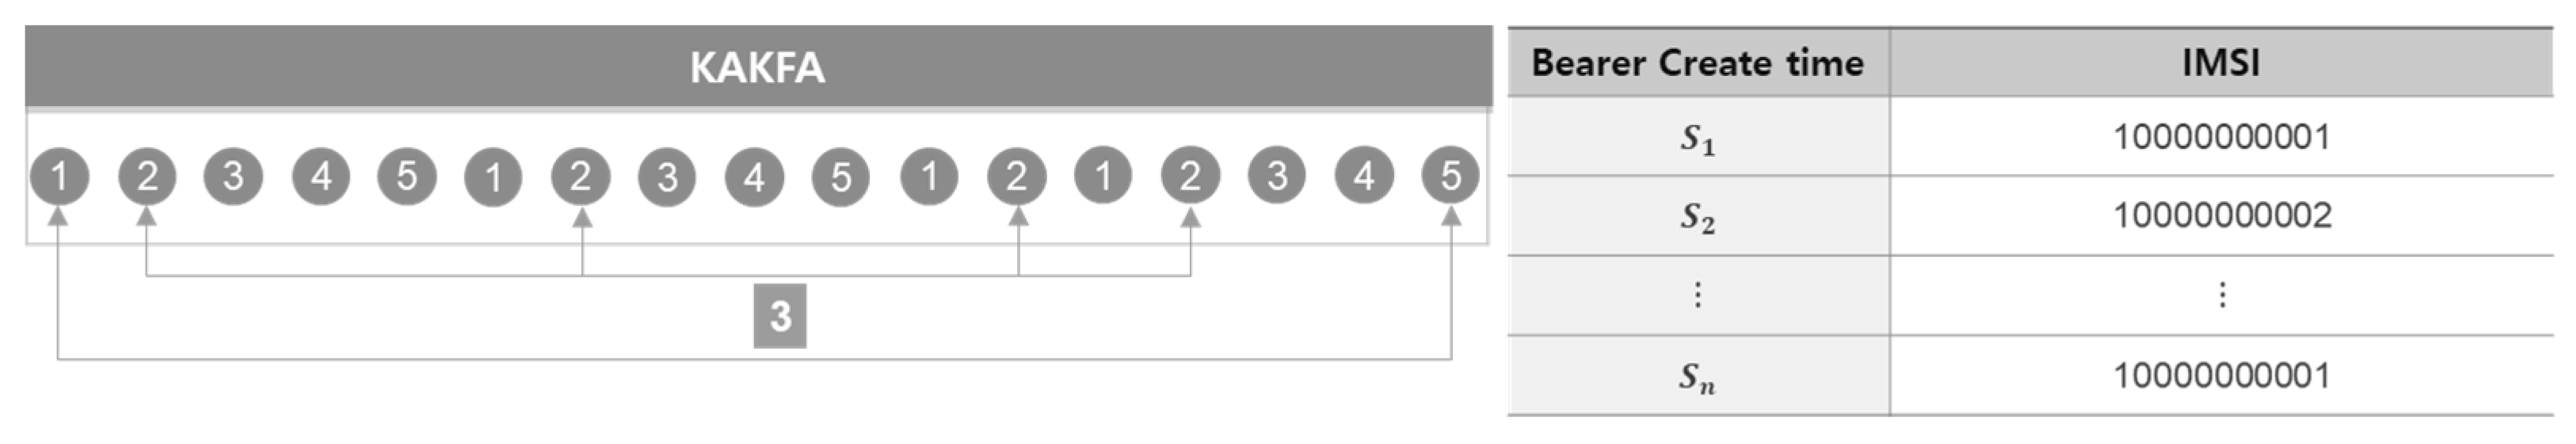
26] that is a distributing platform to facilitate a fast stream processing, where Kafka obtains and writes XDR data streams into Redis. The preprocessing module reads the data written in Redis in an interval of session create time, as shown in
Figure 15.
- (2)
Machine Learning Training module
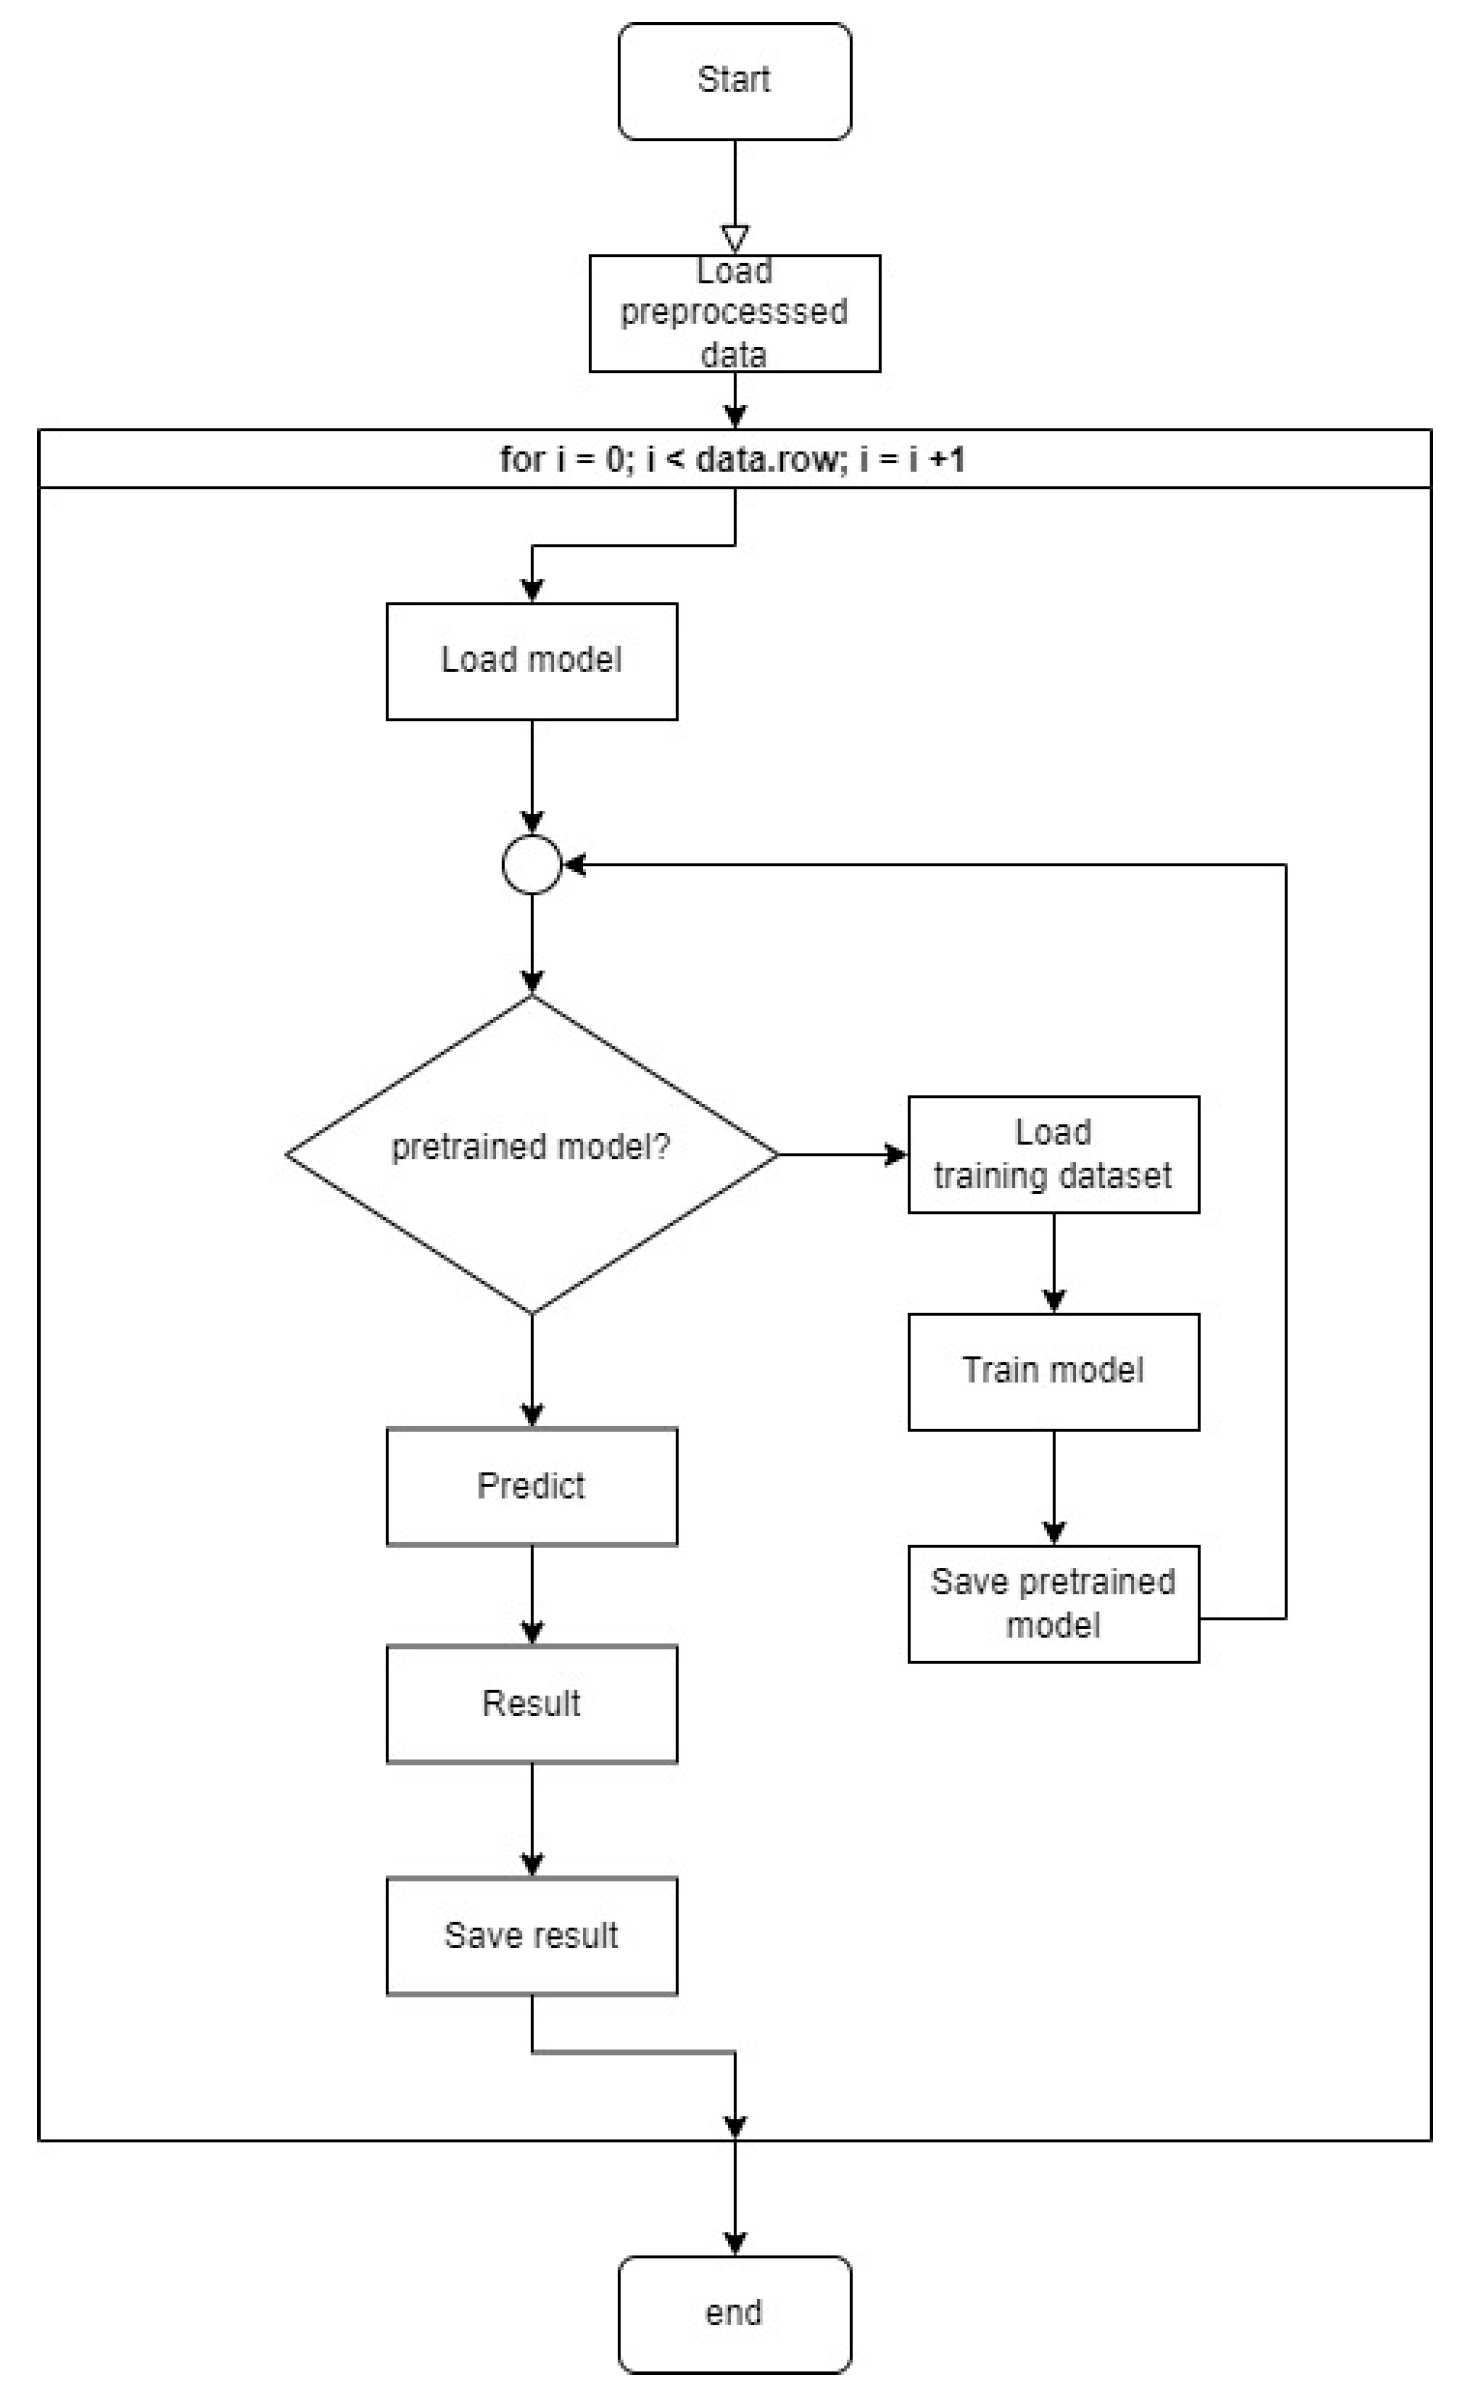
Preprocessed data is transferred to the training module. It trains an ML classifier of interest to have the ability to predict whether traffic-under-test belongs to DDoS attack. The accuracy of the ML classifier is determined depending on how well it has been trained. The training module trains ML classifiers utilizing preprocessed data as shown in
Figure 16.
- (3)
Machine Learning Detecting module
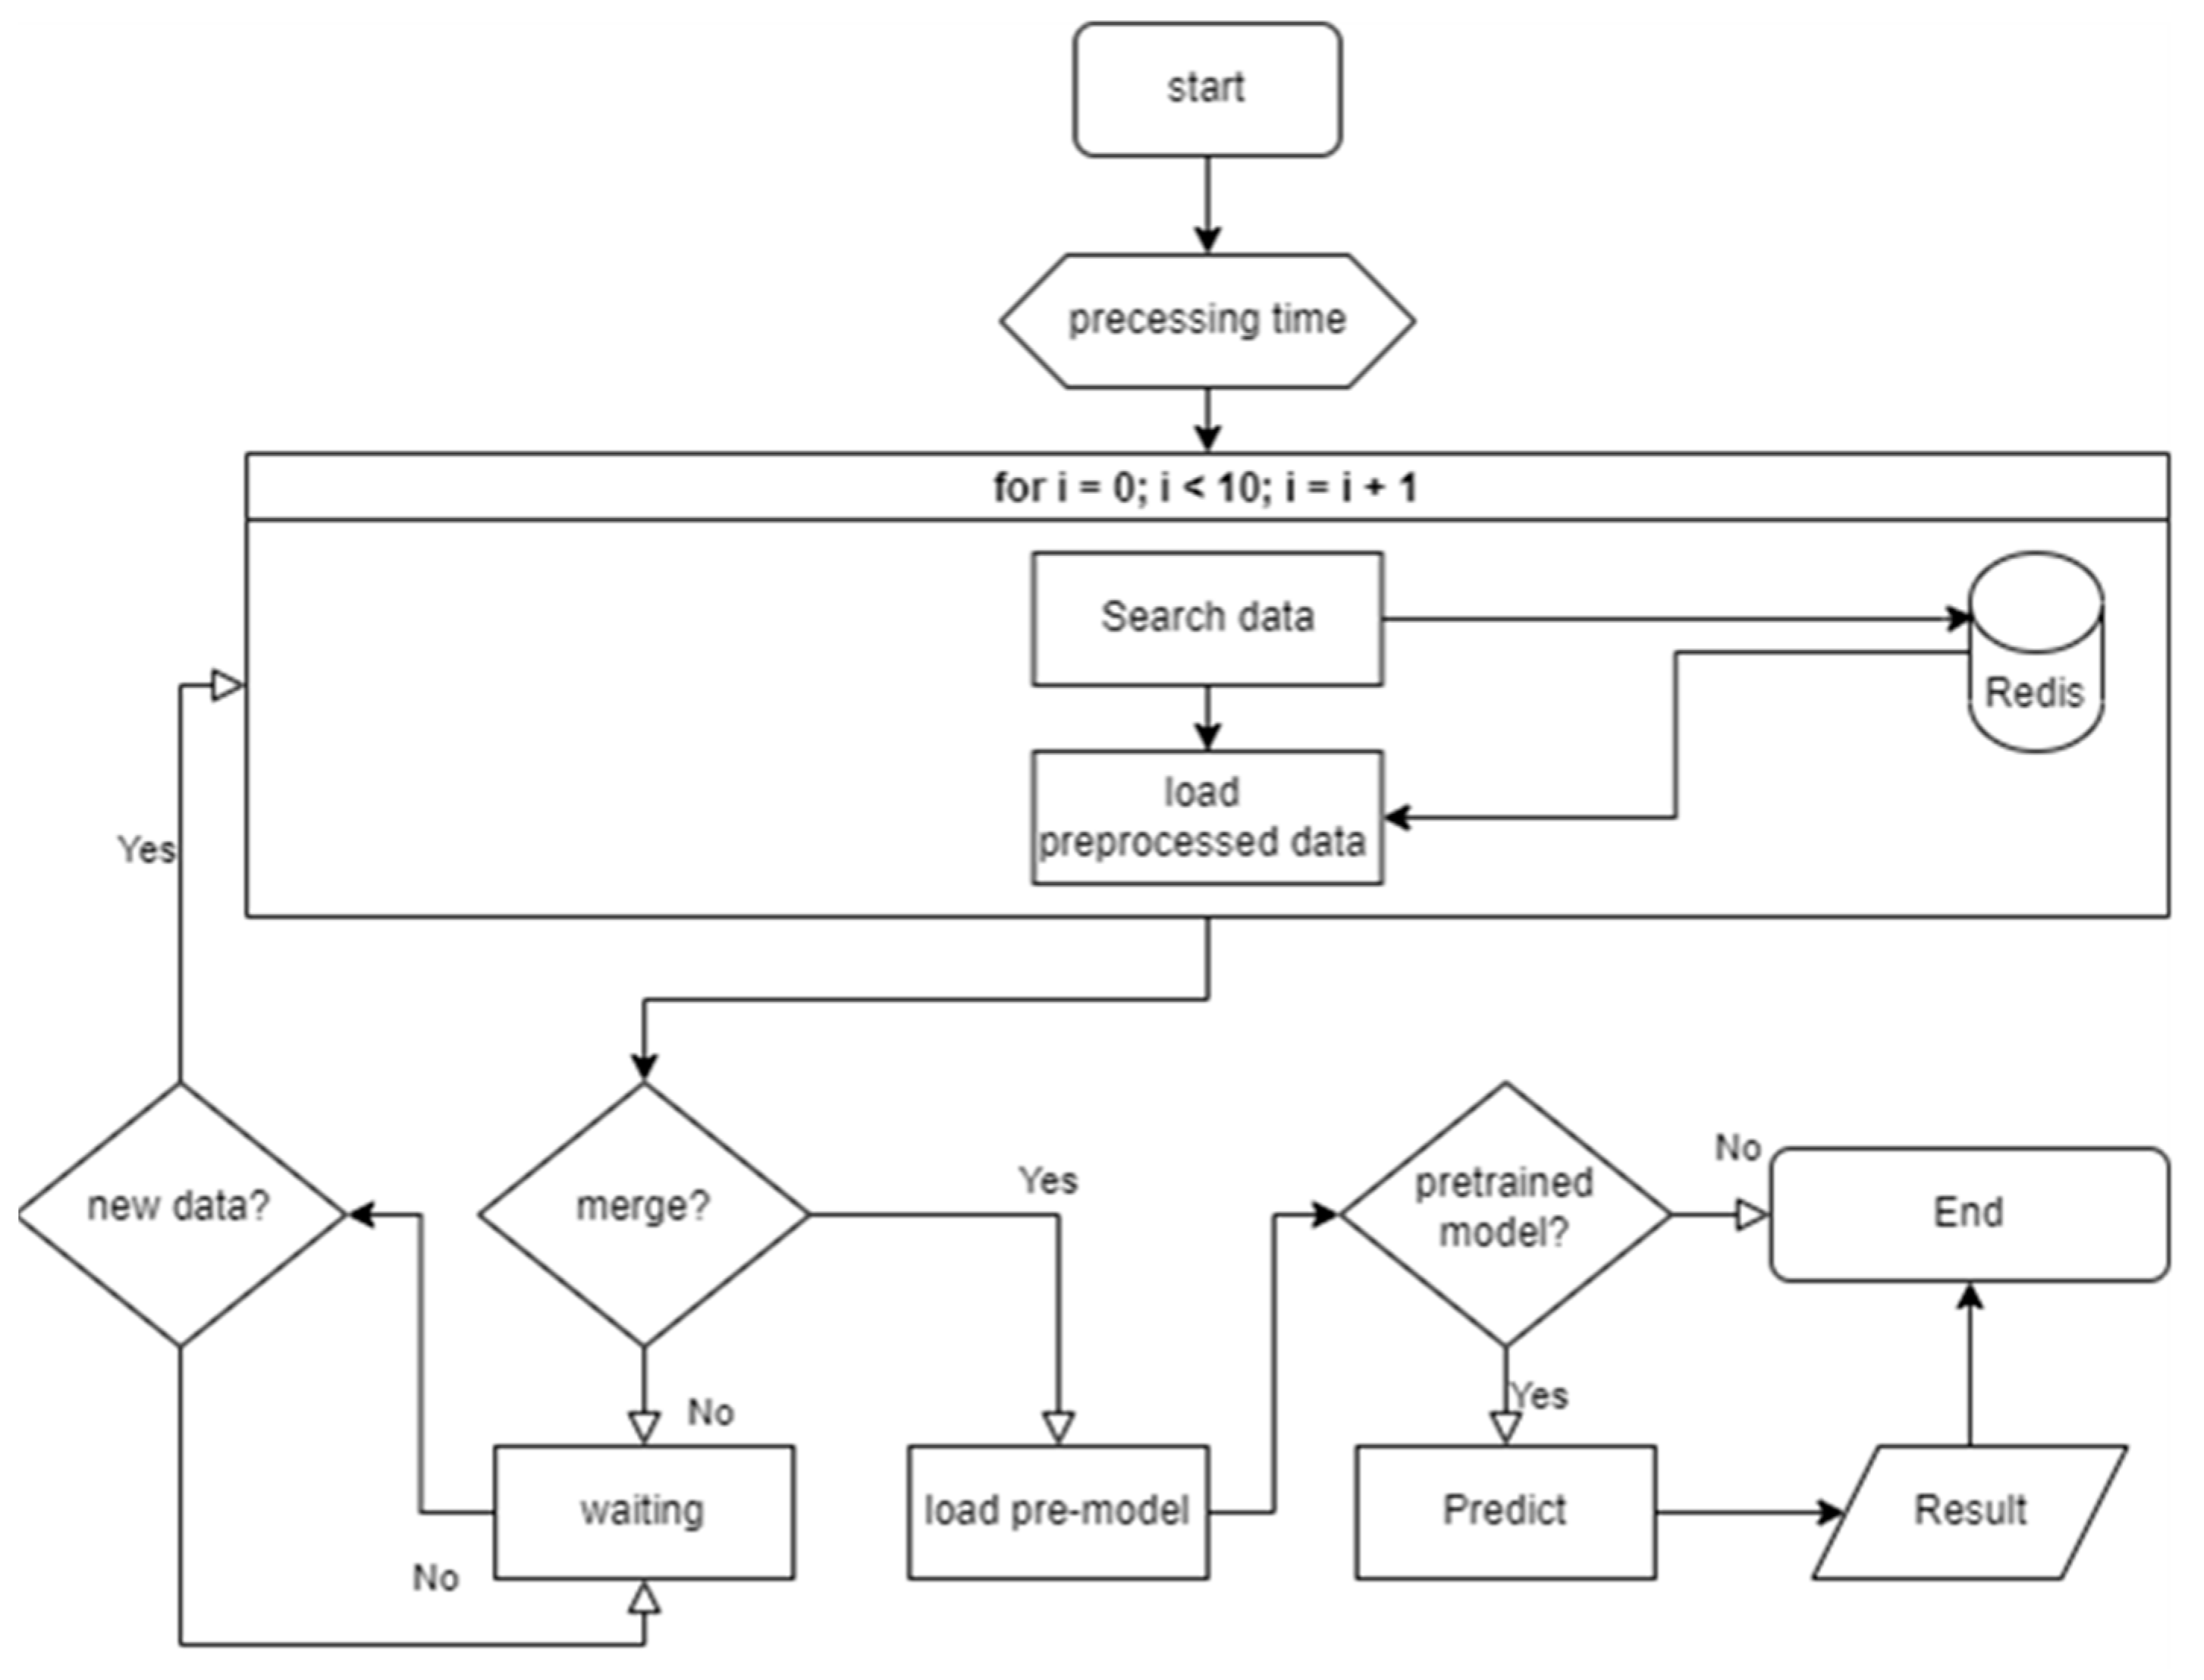
When testing traffic is fed, it is then processed to the test dataset via the preprocessing module. The detecting module loads the preprocessed test dataset in Redis that is the memory DB, to merge as one, as shown in
Figure 17. Then, whether the merged dataset is signaling DDoS is determined using an ML classifier of interest, wherein the detection accuracy varies depending on the capabilities of the ML classifier.
5. Evaluation Results
This chapter describes the result of evaluating the proposed signaling DDoS attack detection algorithm using ML classifiers mentioned before.
5.1. Data Collection
The traffic emulator used for testing is the Spirent Landslide 5G Traffic Generator (model: TAP-10G-SR). As part of the test design, a total of 625,000 5G users in number were created to create traffic data, and signaling DDoS attack scenarios and normal scenarios were set up, based on which traffic was created, respectively.
The amount of traffic created as such was 90,619 in total, among which normal traffic data was composed of 14,943 and signaling DDoS attack traffic data composed of 75,676. The constructed attacking traffic was grouped into 10 attack scenarios, each having a different pattern, being further subgrouped into 5 scenarios where the number of 5G users was set to 100 persons and 5 scenarios where the number of 5G users was set to 20 persons. Moreover, for 5 scenarios out of the 10, PDU sessions were deleted and their re-creation interval in time was increased from 1 sec to 5 sec, to create traffic as shown in
Table 6.
Training data was constructed into three types, as shown in
Table 7, depending on the time that discriminates unit data from each other. More specifically, the dataset annotated XDR was based on the XDR create time, the dataset Bearer that is considered a tunnel for signaling sessions was based on bearer create time, and lastly, the dataset total was based on the combined create time of both XDR and Bearer.
5.2. Preprocessing of Training Datasets
Training data constructed were 9938 pieces in total, comprising 3582 labeled as normal and 6356 labeled as abnormal. This set of data was output in the form of CSV, to train the ML classifiers using outcome by preprocessing signaling DDoS attack data and normal traffic data.
The numbers of normal data and that of abnormal data were counted as given in
Table 8.
5.3. Feature Engineering
As a result of feature selection, it was found that the most selected feature is mean value of traffic time-interval and the least selected feature is entropy of IMSI. In particular, the most frequent top features were in order of t_mean_time (mean value of time), imsi_gnb_entropy (single IMSI entropy on gnb IP), t_imsi_count (number of single IMSIs for 1 min), and imsi_upf_entropy (single IMSI entropy on UPF IP).
In the case of selecting fourr features, as shown in
Table 9, the feature selected commonly in three statistical models was the mean value of time (
t_mean_time) of the session create interval.
As addressed in
Section 5.5 below, the performance was found to be the best when a chi square test was used. In the case of selecting two features only, it can be known that
t_mean_time and
total_count have the highest correlation.
5.4. Detection Accuracy of ML Classifier
As described in
Section 5.1, training data was created using three feature-attributes, i.e., ① XDR create time, ② Bearer create time, and ③ summation of XDR create time and Bearer create time. With these identifiers, the accuracy and
F1 score by individual ML classifiers were measured.
From the measurements, it was found that, for two ML classifiers (i.e., SVM and random forest), the detection accuracy and F1 of the algorithm score were the highest when training data corresponding to the third attribute was used, and that, for the Naive Bayes classifier, they revealed the best result when based on the Bearer create time, all as shown in
Figure 18.
Figure 18 compares the detection accuracy for each machine learning algorithm according to the method of classifying learning data. In the case of the NB algorithm, the yellow bar is its accuracy and the solid yellow line is its
F1 score. In the case of the SVM algorithm, the blue bar is its accuracy, and the solid blue line is its
F1 score. In the case of the RF algorithm, the green bar is its accuracy, and the green solid line is its
F1 score.
When it comes to the Naive Bayes classifier, it can be known that the classifier is more dependent than other features for signaling DDoS detection. This is attributable to the Naive Bayes classifier assuming that all features are independent of each other in data analysis.
5.5. Detection Accuracy of the ML Classifier Depending on the Number of Selected Features
The result of the test demonstrates that the detection accuracy of individual ML classifiers also varies depending on the number of features selected when using the feature selection technique. As described in
Section 4.3, features were selected using three statistical models. They were ① chi square test, ② analysis of variance (Anova) F test, and ③ mutual information test, whereby the accuracy of each ML classifier was measured with the application of these statistical models.
Figure 19 shows the detection accuracy depending on the number of selected features when the chi square test is used to select features.
Figure 20 shows the detection accuracy depending on the number of selected features when the analysis-of-variance (Anova) F test is used to select features.
Figure 21 shows the detection accuracy depending on the number of selected features when the mutual information test is used to select features.
For all the cases above, it can be verified that the detection accuracy of the Naive Bayes classifier goes down with the increasing number of selected features.
Table 10 is drawn by adjusting/tuning the parameters of the model to extract the optimal result, using four features (
t_mean_time,
t_var_time,
t_imsi_count, and
total_count) selected from the feature selection.
5.6. Optimized Conditions for Best Result
By taking into consideration the result of the evaluation as described above, three optimized conditions (training data, statistical model, and ML classifier) to be used for the detection module were finally selected.
With regard to the construct of training data, it was found that its creation based on the “summation of XDR create time and Bearer create time” imparts the best performance.
- (2)
Statistical model used for Feature Selection
When it comes to feature selection, it was found that the chi square test when used on the statistical model imparts the highest result in terms of detection accuracy.
- (3)
ML Classifier used for detection
It was found that, out of the ML classifiers used for detection, random forest exhibits the highest degree of accuracy, with 98.4% on average which can be considered significantly high as shown in
Table 11.
It was found that, when applying the random forest technique, the detection performance differs with the hyperparameters, where the detection performance can be improved by raising n_estimator that designates the number of decision tress. For example, as shown in
Table 12, with all other conditions unchanged, the degree of detection accuracy was increased up to 99.8% when n_estimator has the value 180, whereas the degree of detection accuracy is 98.7% when n_estimator has the value 10. It implies that the greater the number of decision trees in the forest, the more effective the signaling DDoS detection achieved.
5.7. Exceptional Cases
False Positives (FPs) that have occurred during the performance evaluation were analyzed, the result of which is given in
Table 13.
Table 14 shows a comparative data analysis between users (identified by IMSI) detected as triggering attacks and normal users at a given time band. It can be verified that the preprocessed data are identical with respect to abnormal traffic and normal traffic at the point in time of the FP occurrence.
From the image above, abnormal data and normal data at the point-in-time of 16:11 (11 min past 4 in the afternoon) exist concurrently, but there is no difference between the normal and the abnormal since only one traffic signal occurred for a duration of 1 min, which implies that it does not belong to a signaling DDoS attack. It can be anticipated that such an exceptional case is attributable to the effect of impurity the ML classifier has.
7. Conclusions and Future Work
It is very difficult to process stream traffic data and detect security threats in a particular network [
31]. In addition, it involves complex procedures to analyze traffic data in a 5G network environment. Therefore, research on DDoS attacks in the 5G network environment has a high barrier to entry. In the existing 5G cellular landscape, the trend of malicious DDoS events can be broadly categorized into two. The one pertains to any DDoS attack that abuses the control protocol used in the RAN, generally targeting a wireless base station by compromising the RRC protocol it uses in the RAN. The other pertains to any DDoS attack that exploits the control protocol used for voice services. Despite the fact that a lot of research has been conducted to cope with these two categorized events, there was no research exploring the applicability of AI-based ML against DDoS attacks targeting the CN, not the RAN or voice service network.
In this sense, the current research proposes a model capable of ML-based detection of signaling DDoS attacks targeting the 5G CN and evaluates its performance. Out of several ML-based detecting models, SVM and random forest were found to show the highest accuracy. However, it was found that all algorithms of Bayesian, random forest, and SVM have high training time. The experimental result of this study showed that, out of the ML algorithms used for the detection of signaling DDoS, the random forest perspective leads to outcomes having stable and high performance, less time consumption, and high accuracy. As a result of diversely constructing features for the random forest hyperparameters, it could be verified that, when increasing the value of a feature (n_estimator) that designates the number of decision trees as well as the maximum depth of each decision tree, the detection accuracy is enhanced, the average of accuracy scores from five times of cross-validation is increased, and the error range is decreased.
The data used in this work were not simply generated by simulators, but actual traffic data in mobile carriers operating 5G networks, and there were many restrictions on obtaining it due to various strict corporate policies, such as affecting operational services. Nevertheless, we think it was meaningful that the test was conducted with this amount of data. Since the system is currently being tested by installing it on the test network of mobile carriers [
28], more data will be secured in the future, and the results will be analyzed and disclosed as follow-up work.
In this study, the goal was to collect, preprocess, and learn traffic to detect DDoS targeting 5G core networks. However, we will advance this study, create an efficiency table that compares all ML algorithms using a wide range of algorithms, and push for the next step of research on which algorithms are best. In the future, we are planning to make the most of deep learning in detecting signaling DDoS, and comparing the resulting performance with that when utilizing ML classifiers, taking into account the detection accuracy and even the duration of time that each takes until trained and detecting DDoS. If we apply a deep learning algorithm to detect signal DDoS in a 5G network environment, we are also considering using dynamic features [
32]. In addition, the SBA and EBA techniques used in this paper will be applied in various ways. When implementing new techniques, faster and better performance technologies should be used [
33]. In the next work, we will not only use more diverse machine learning algorithms but also use more diverse features.


