Abstract
The reservoir water level in the Three Gorges Reservoir (TGR) of the Yangtze River is adjusted between 145 m and 175 m throughout the year. The landslide below the reservoir water level bears periodic dynamic seepage pressure on the basis of the original steady-state water pressure. In the process of rising reservoir water levels in particular, the effective stress on the sliding zone soil below the reservoir water level line is reduced, and the sliding zone soil shows an unloading state. In order to study the creep characteristics of landslides in a reservoir area, direct shear creep tests of the sliding zone soil in the Huangtupo landslide in an unloading state were carried out in this study. The test results show that the creep characteristics of the sliding zone soil are obvious. The creep curve of the sliding zone soil presents an attenuation creep stage with low shear stress, which is mainly manifested as an elastic creep. However, with the increase in the shear stress, the creep curve of the sliding zone soil presents a steady creep stage, which is mainly manifested as viscoelastic creep. The nonlinear creep characteristics of the sliding zone soil are related to the creep time, stress level, and soil porosity. The longer the creep time, the greater the stress level and the denser the soil, the more obvious the nonlinear creep characteristics of the sliding zone soil. In this study, the Burgers model was used to fit the creep curve of the sliding zone soil, and the fitting effect was good, which indicates that the Burgers model can sufficiently describe the unloading state creep characteristics of the sliding zone soil in the Huangtupo landslide.
1. Introduction
Creep is one of the rheological properties of soils, and the evolution and long-term stability of landslides are profoundly influenced by the creep properties of sliding zone soil. Numerous scholars have explored the mechanism of landslide evolution and development based on the direct shear creep characteristics of sliding zone soil [1,2]. Creep deformation of sliding zone soil is mainly composed of elastic deformation and plastic deformation. Plastic deformation has timeliness, which is the main reason for creep damage to rock–soil masses [3]. At present, the number of geological disasters caused by the rheology of soil globally is progressively growing, such as those caused by landslides and slope instability. Therefore, it is increasingly important to study the creep characteristics of sliding zone soil [4,5].
The creep damage process of rock–soil masses is reflected in various aspects over time, including displacement deformation and the stress and strain rate [6,7,8]. The engineering properties of sliding zone soil in the reservoir area make it more sensitive to changes in moisture content and vertical load [9]. Long et al. studied the creep characteristics of sliding zone soil in the Huangtupo landslide under different moisture contents and found that the yield strength of the sliding zone soil was negatively correlated with the moisture content and the relationship between the creep characteristics of the sliding zone soil and the prediction model of slope instability was discussed [10]. Qin et al. studied the creep characteristics of rock under the condition of reservoir water level change, discussed the microscopic damage mechanism of rock under the action of the saturation–dehydration cycle, and quantitatively expressed the amount of damage to the rock [11]. Tang et al. conducted an in situ triaxial test, believing that the sliding zone soil of the Huangtupo landslide was part of a creep process, and derived a constitutive equation with linear and nonlinear viscoplastic terms to fit the creep process of the sliding zone soil [2]. At present, the direct shear creep test of sliding zone soil is mostly focused on the creep damage stage but not on the attenuation creep stage of sliding zone soil [12,13]. Through direct shear tests, Zhu et al. found that the red-bed sliding zone soil was in the accelerated creep stage and proposed the long-term strength of the sliding zone soil [14]. Jiang et al. found that the creep characteristics of the Suoertou landslide were related to the stress state, and the stress state of the landslide indicated that it was under conditions allowing it to enter an accelerated creep state [15]. Previous studies have shown that the stress history directly affects the distribution of particles in the soil, resulting in shear dilatancy (shrinkage) in the shear process [16]. Li et al. carried out triaxial tests on expansive soil and found that the soil showed shear shrinkage characteristics at the initial stage of stress loading. When soil enters the accelerated creep stage, its volume strain changes from shrinkage to expansion [17].
The rheological constitutive relation of soil is the key to studying its rheological property [18,19]. The rheological model is a description of the stress–strain–time relationship of soil during loading, which can effectively and intuitively explain the rheological characteristics of the stress–strain–time of soil [20,21,22]. Zhu et al. proposed an improved Mesri creep model using triaxial tests [23]. Based on the concept of a binary medium, Wang et al. established a binary medium creep model suitable for frozen soil [24]. With the long-term research on the rheological theory of soil by various researchers, many previous rheological constitutive models applicable to geotechnical materials can be broadly classified into the following four types: the element model, the damage rheological model, the yield-surface model, and the empirical model [17,25]. The above four types of models are applicable to different working conditions and stress states. For instance, the Burgers creep model [26,27,28], which belongs to the element model, is more appropriate for describing the shear creep curve of the soil before the third stage and has been widely used. An improved Burgers model involving the stress–suction–strain–time model was established by Chang et al. by connecting the nonlinear dashpot on the Burgers model [29].
In this study, we investigated a famous landslide in the Three Gorges Reservoir area of China called the Huangtupo landslide. Its location is the south bank of the Yangtze River and belongs to Badong County, Hubei Province, China (Figure 1). The reservoir water level of the Three Gorges Reservoir (TGR) is adjusted from 145 m to 175 m throughout the year, and the difference in the water level can reach nearly 30 m [30,31]. That is to say, the landslide under the flood control limit water level will bear the periodic dynamic osmotic pressure of 0~300 kPa amplitude on the basis of the original steady water pressure. In the process of rising reservoir water levels, in particular, the effective stress of the sliding zone soil below the reservoir water level line decreases, showing an unloading state (Figure 2). Thus, in order to provide the basis for the landslide evolution and stability analysis, a direct shear creep experiment for the sliding zone soil in the Huangtupo landslide under the unloading condition was conducted, and the creep characteristics of the sliding zone soil were studied by analyzing its creep curve.
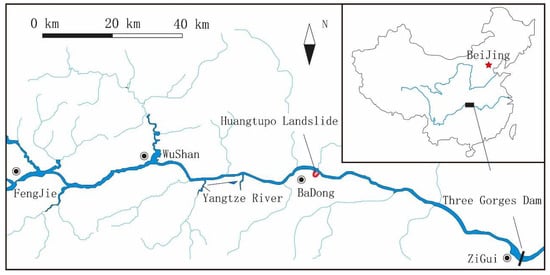
Figure 1.
Location of Huangtupo landslide in China.
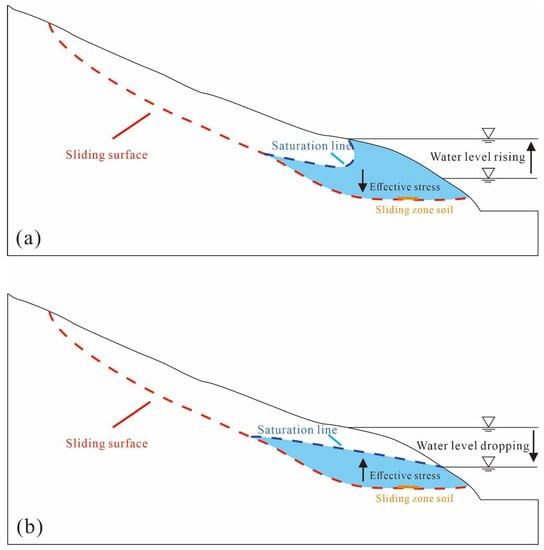
Figure 2.
Changes in effective stress in sliding zone soil caused by reservoir water level fluctuations. (a) Water level rising and (b) water level dropping.
2. Materials and Methods
2.1. Test Materials
The Huangtupo landslide is mainly composed of Riverside Slump #1, Riverside Slump #2, the Substation Landslide, and the Garden Spot Landslide (Figure 3b); its area is 1.35 × 10⁶ m2, and the volume is 6.934 × 10⁷ m3. The regional bedrock is the Middle Triassic Badong Formation (T2b).
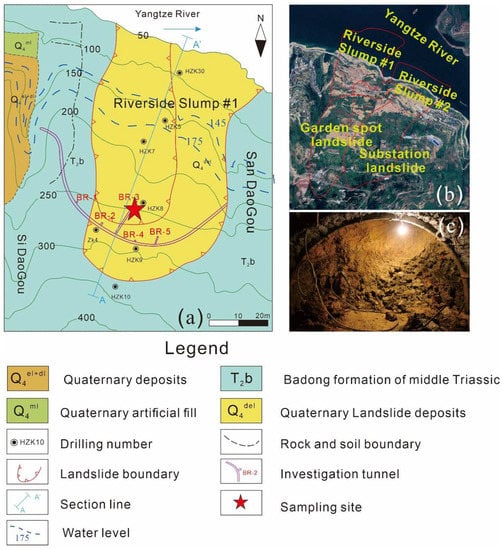
Figure 3.
(a) The plan view of the Riverside Slump #1. (b) Composition of Huangtupo landslide. (c) Sampling site.
After long-term monitoring of the landslide, we found that the degree of deformation of Riverside Slump #1 was the most serious, and its sliding mass was creeping at a steady rate [32]. The plan view is shown in Figure 3a. In order to further understand the sliding zone soil of Riverside Slump #1, the tunnel group of the Badong field test site crossing Riverside Slump #1 was completed in 2013. Many researchers have conducted related studies, as well as monitoring efforts. The soil samples used in this experiment were from Riverside Slump #1 (see Figure 4) and were sampled from branch tunnel no. 3, as shown in Figure 3c.

Figure 4.
A-A’ profile of the Riverside Slump #1.
The laboratory geotechnical tests of the sliding zone soil in the Huangtupo landslide show that the natural moisture content was 13~14%, the average density was 2.05 g/cm3, the average liquid limit was 36.02%, the average plastic limit was 17.51%, and the average plastic index was 18.51. The average particle size distribution of the samples is shown in Figure 5. Since the original sample contained gravel, the sliding zone soil needed to be reshaped. The sample was screened with a standard sieve of 2 mm, and the soil particles less than 2 mm in size were taken to prepare the sample. The moisture content of the remolded sample was controlled at 13.87%, and the density was 2.05 g/cm3. The size of the prepared ring-knife sample was 61.8 mm (diameter) × 20 mm (height). In order to avoid excess air in the specimen to the greatest extent possible, the ring-knife sample was put into a vacuum-saturated cylinder and saturated for 4 h by pumping, and then left to stand in a vacuum for 20 h.
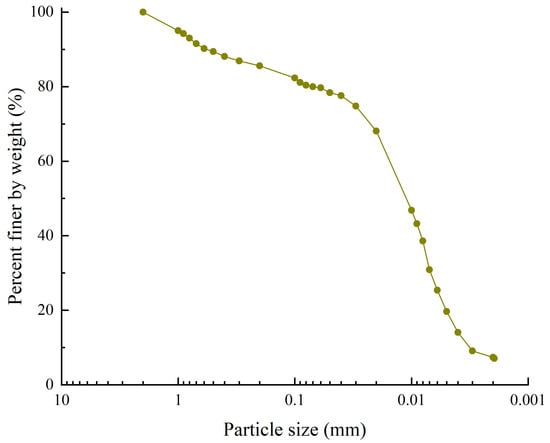
Figure 5.
The particle size distribution of the sliding zone soil.
2.2. Test Apparatus and Procedures
The instrument used in this experiment was the DZR-8 type direct shear creep apparatus. The experiment was carried out in the Laboratory of Soil Mechanics, Engineering Experimental Building, China University of Geosciences (Wuhan). The instrument included a pressure system, a shear box, a displacement measurement system, and a data acquisition system. The vertical load was controlled by weight, and the horizontal load was controlled by driving the piston through oil pressure; the shear force, horizontal displacement, and vertical displacement were collected by a computer with a time interval of 10 s. The loading method adopted in this experiment was step loading [33]. The creep curve based on the step loading test was stepped up. In order to reflect the creep characteristics more intuitively, the curve needed to be processed. According to the Boltzmann superposition principle, i.e., “when multiple forces act on the object together [34], the final deformation is related to the action of individual loads, that is, the action of each load is independent and can be superimposed on each other”, we assumed that the creep deformation of the specimen under the action of each shear stress was the same as that under the direct application of this shear stress, and the creep curves were independent of each other.
Before the creep test, each group of samples was consolidated under drainage conditions. Four consolidation paths were designed in this test, as shown in Table 1. Firstly, the specimens were consolidated for 24 h under an initial consolidation pressure of 300 kPa; the stress was adjusted to 300, 400, 500, and 600 kPa after deformation stability; finally, we unloaded the stress to 300 kPa for reconsolidation. The standard for the stability of the consolidation deformation of the specimen was 0.005 mm/h. Direct shear tests were performed on each group of specimens after consolidation to determine the peak shear strength after loading–unloading stability. According to the results of the direct shear test, the peak shear strengths were 119.02 kPa, 147.69 kPa, 176.37 kPa, and 205.04 kPa after loading the samples to 300, 400, 500, and 600 kPa and then unloading them, respectively.

Table 1.
Applied shear stresses paths.
According to the results of the direct shear test, the loading scheme of the creep test was determined. The shear stress was applied to the consolidated specimen by way of graded loading, and the shear stress level of each stage was 0.15, 0.34, 0.5, 0.67, and 0.85, respectively (loading paths are shown in Table 1) [35]. The rate of loading for this experiment was 0.002 mm/min. After a 24-h period of creep, it was necessary to determine whether the displacement was stable ( ≤ 0.0005 h−1), if it was, the next shear stress was applied. The standards for all the experiments followed the Standard for geotechnical testing method (GB/T 50123-2019) [36].
3. Results of the Creep Tests
3.1. Compressibility of Remolded Samples
The remolded samples of the sliding zone soil were consolidated under different stress paths, and then the porosity ratio—time curve of the remolded samples was plotted according to the obtained vertical displacement data, as shown in Figure 6. The porosity ratio is the ratio of pore volume to solid particle volume in the soil, which is an indicator of soil structure.
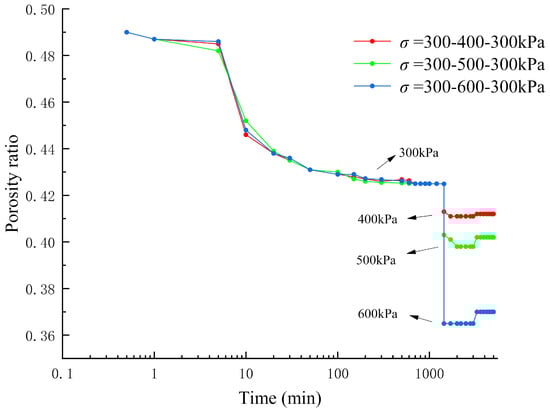
Figure 6.
The porosity ratio–time curve under different loading paths.
Figure 6 shows that the remolded sample were compressed when the vertical stress was loaded or unloaded, and the porosity ratio changed instantaneously. With the extension of time, the porosity ratio tended towards a stable value. R represents the stress amplitude of loading–unloading on the basis of a 300 kPa initial consolidation stress. The loading–unloading amplitudes of the specimens in this paper were 0.100 kPa, 200 kPa, and 300 kPa, respectively. With the increase in vertical stress, the porosity ratio of the consolidated specimen gradually decreased.
After unloading, the porosity ratio of the specimen was not fully recovered within the observation time, which indicated that the specimen produced plastic deformation, and the unrecovered porosity ratio was larger as the stress increased.
3.2. Analysis of Creep Displacement–Time Relationship
In order to study the influence of different consolidation stresses on the creep characteristics of the specimen, the horizontal displacement–time relationship curve of the sample was drawn (Figure 7). It can be seen that the creep trends of the four specimens were consistent. Under the same level of shear stress, the horizontal displacement of the specimen decreased with the increase in loading–unloading amplitude R. For example, under a shear stress of 0.85, the maximum horizontal displacements of the specimens were 2.907 mm, 1.961 mm, and 0.884 mm for loading–unloading amplitudes of 100 kPa, 200 kPa, and 300 kPa, respectively. Compared with an R of 0, the horizontal displacements of the specimens at stabilization were reduced by 13.37%, 41.57%, and 73.66% when the loading–unloading amplitudes R were 100 kpa, 200 kpa, and 300 kpa, respectively.
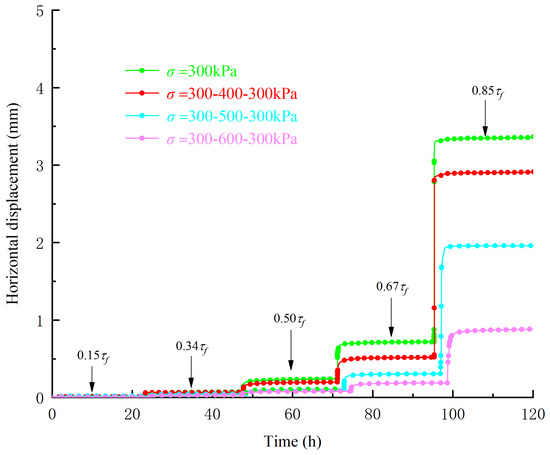
Figure 7.
Horizontal displacement with time curves under step loading.
According to the Boltzmann superposition principle [34], the curve of horizontal displacement with time was plotted (Figure 8). Generally speaking, creep has three stages; namely, the attenuation creep stage, the stable creep stage, and the accelerated creep stage. However, the creep curve of this test only shows the attenuation creep stage and the stable creep stage. At the moment of the application of each shear stress, the specimen deformed in a short amount of time. After this, the creep of the specimen gradually stabilized. Additionally, for each group of specimens, with the increase in shear stress, the time required for the specimen creep to reach stability was longer.
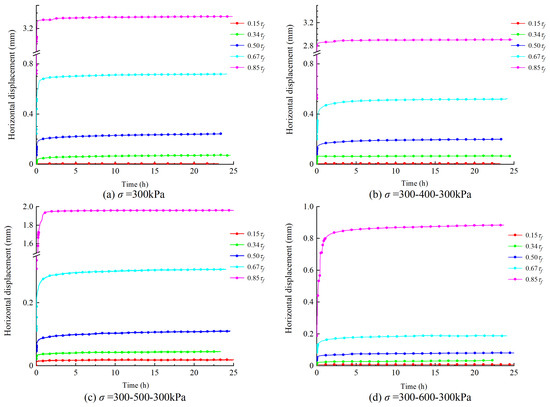
Figure 8.
Horizontal displacement curves of sliding zone soil with different consolidation paths according to the Boltzmann superposition principle.
3.3. Analysis of Isochronous Creep Characteristics
Figure 9 shows that the strain of the specimen increased with the increase in shear stress. With the increase in creep time, the isochronous curve of each group of specimens gradually deviated to the strain axis. Additionally, under the action of high shear stress, the offset degree of the isochronous curve was more obvious. This shows that the creep of the sliding soil was nonlinear creep. The stress–strain curve was roughly linear with the low shear stress (τ = 0.15, 0.34, 0.5), so the strain was elastic; as the shear stress increased (τ = 0.67, 0.85), the stress–strain curve began to deviate to the strain axis; thus, the strain exhibited visco-plastic properties at this time. Under the same shear stress, the shear strain of the specimen eventually converged to a limit value, which indicated that the creep state of the specimen was attenuation creep. For example, under the action of shear stress 0.67, the strain of the specimen with a loading–unloading amplitude of 300 kPa was 0.356% at a creep time of 30 min, 0.369% at a creep time of 8 h, and 0.371% at a creep time of 20 h. Under the shear stress 0.85 for 20 h, the specimens reached the maximum strain at loading-unloading amplitudes of 100 kPa, 200 kPa, and 300 kPa, which were 5.237%, 3.367%, and 1.264%, respectively. There was an obvious inflection point on the stress–strain isochronous curve, and the slope of the curve before and after this point changed greatly. The shear stress corresponding to this point is generally called the yield strength of the sliding zone soil.
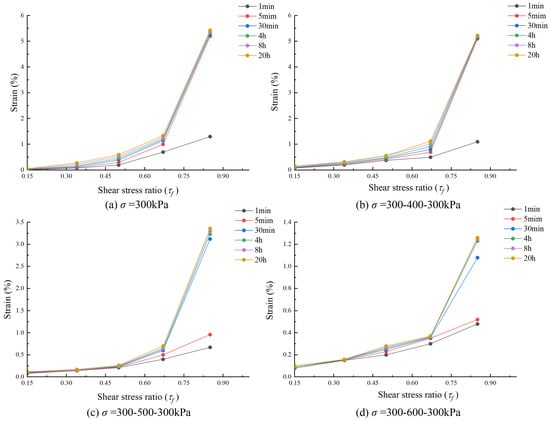
Figure 9.
Stress–strain isochronous curve with different consolidation paths.
3.4. Analysis of Creep Rate
Figure 10 shows that the variation in the shear strain rate–time curve was similar under different shear stresses. Under the same consolidation path, the shear strain rate began to increase at the instant of loading after applying all the levels of shear stress to the specimen, and the strain rate of the specimen reached the maximum value at about 3 min, after which the shear strain rate decreased continuously with the increase in the applied load duration, and finally stabilized at a creep rate close to zero. The maximum creep rates of the specimens under 0.85 shear stress increased simultaneously with the increase in loading amplitude R, which were 2.53034, 2.45955, 0.18079, and 0.07805%/min, respectively.
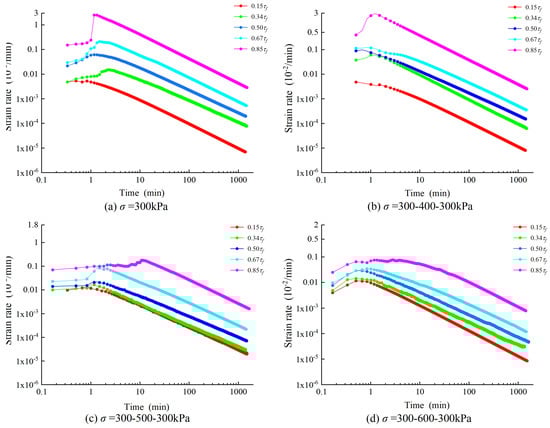
Figure 10.
Strain rate–time curve with different consolidation paths.
The creep rate of the sliding zone soil increased with the increase in shear stress. For example, when the loading–unloading amplitude was 300 kPa, the maximum creep rate of the specimen under shear stresses of 0.15, 0.34, 0.5, 0.67, and 0.85 were 0.01165, 0.01456, 0.02913, 0.03495, and 0.07805%/min, respectively. The higher the shear stress level applied to the specimen, the longer it took to reach stability.
3.5. Analysis of Dilatancy
Shear dilation (shear contraction) indicates that the soil on the shear surface rises (falls) with the increase in horizontal displacement during the shear process. At this time, the skeleton particles of the soil produce relative displacement. Dafalias studied the dilatancy of sand and found that the dilatancy changes with density and confining pressure [37]. Majid et al. applied the dilatancy of soil to a stability analysis of the slope [38]. Figure 11 shows the vertical displacement-horizontal displacement curve of the sliding zone soil after different consolidation paths. In this study, the vertical displacement value was negative and the shear contraction was positive when the soil on the contact surface showed dilatancy. According to Figure 11, it was found that the soil samples in this test underwent shear shrinkage during the shear process. The growth rate of the vertical displacement decreased with the increase in shear displacement, which indicated that the vertical displacement of the contact surface tended to be stable. Zhao et al. also found that the contact surface soil will shrink under loading conditions [39].

Figure 11.
Vertical displacement and horizontal displacement curve of the contact surface.
4. Shear Creep Model and Verification
4.1. Construction of Burgers Constitutive Model
The Burgers constitutive model constructed in this section is shown in Figure 12, which was connected by a Maxwell model and a Kelvin model in a series, where G1 and G2 are the shear modulus of the Maxwell model and the Kelvin model, respectively; and are the viscosity coefficients of the Maxwell model and the Kelvin model, respectively [40].
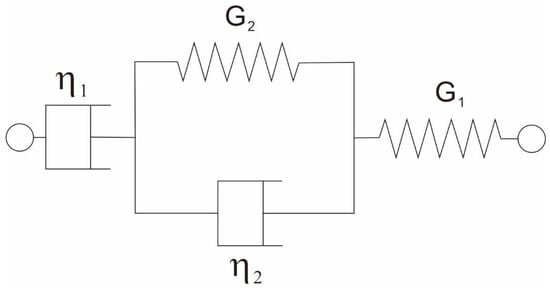
Figure 12.
Burgers model.
The Burgers model constructed by the Maxwell model and the Kelvin model in a series shows the following:
In Equation (1), represents the shear strain of the Burgers model; and represents the shear strain of the Maxwell model and the Kelvin model, respectively.
The Maxwell model is composed of an elastic element G1, a viscous element in a series, and its creep equation can be written as
The Kelvin model is composed of an elastic element G2 and a viscous element in parallel, and the creep equation can be written as
If , insert Equations (2) and (3) into Equation (1):
A differential equation can be obtained by a joint solution:
Solve Equation (5) and obtain its creep equation, such as by Equation (6):
It can be seen from Equation (6) that the creep equation can fit instantaneous strain, initial creep, and stable creep; for creep in the attenuation stage, the viscous element in the Maxwell model needs to be removed in order to fit. In the equation, when t ≈ 0, , the instantaneous shear modulus G1 can be determined by the instantaneous strain.
4.2. The Comparison of Fitted Curves and Experimental Curves
The Burgers model was used to fit the creep process of the sliding zone soil under different consolidation paths. The results are shown in Figure 13. Table 2 shows the fitting results of the constructed creep model parameters, and it can be seen that the Burgers model fits the experimental data to a high degree and can represent the creep characteristics of the sliding zone soil.
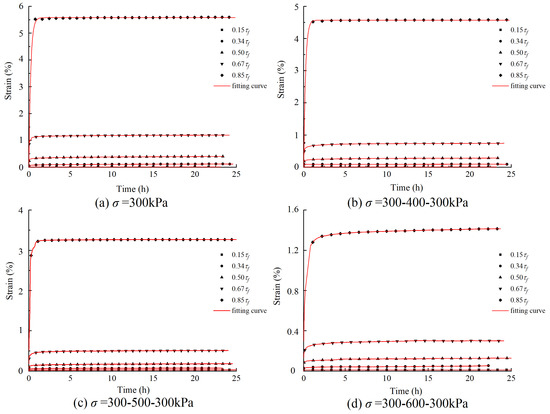
Figure 13.
Comparison between the fitting curve and the experimental data.
Table 2.
Burgers constitutive model parameters.
The comparative analysis showed that the Burgers model had a high degree of fitting to the curve, and R2 was concentrated between 0.88 and 0.99. The Burgers model was composed of elements with mechanical properties. The parameters in the equation reflect the mechanical meaning of the elements in the model, and changes in the parameters can reflect the variation of the internal mechanical properties of the specimen during the test. Therefore, this model is more accurate and applicable to the creep description of sliding zone soil, and research using this method is more meaningful.
4.3. Analysis of the Parametric Properties of the Burgers Model
According to the fitting creep curve of the Burgers model, it can be seen that there was a connection between the values of each parameter and the applied shear stress, as well as the consolidation path.
Figure 14 is the curve of the instantaneous shear modulus versus shear stress at different loading amplitudes R. It was found that the instantaneous shear modulus G1 of the series Maxwell element parameters decreased with the increase in shear stress. Since the Maxwell elastic element was in a series in the structure, the magnitude of G1 depended on the shear stress level at each stage, and the instantaneous strain characteristics of creep were reflected by G1. G1 decreased nonlinearly with the increase in shear stress, which also indirectly indicated that the graded loading method produced nonlinear damage to the specimen. With the increase in shear stress and creep time, the soil particles became increasingly dense, and the specimen showed the characteristics of shear hardening, which indicated that the parameter G1 reflecting the elasticity was decreasing. On the other hand, when the shear stress was the same, G1 increased with the increase in R. The reason for this phenomenon is that with the increase in R, the compression degree of the sample increased, the porosity ratio of the soil sample became increasingly small, and the cohesion between particles increased. Therefore, when subjected to shear stress, the creep of the sample became smaller, and the ability of the sample to resist shear strain increased.
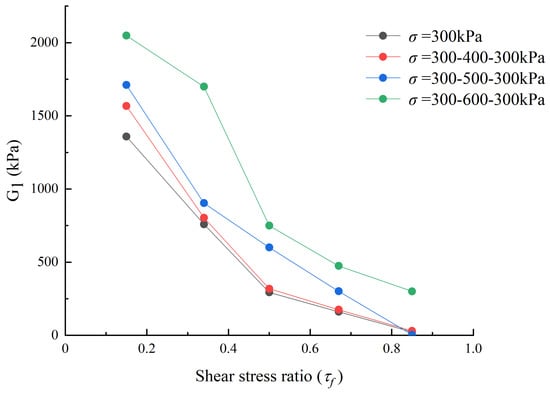
Figure 14.
The curve of shear modulus G1 versus shear stress at different loading amplitudes R.
The curve of shear modulus G2 versus shear stress under different loading amplitudes R is shown in Figure 15. It can be seen that the long-term shear modulus G2 in the Kelvin model decreased with the shear stress. When the shear stress was the same, the long-term shear modulus increased with the increase in R, but with the increase in the stress level, the gap gradually tended to zero. In the creep test, the long-term shear modulus eventually decreased to a stable value.
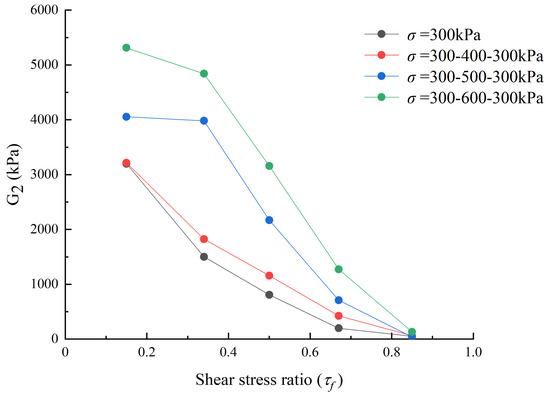
Figure 15.
The curve of shear modulus G2 versus shear stress under different loading amplitude R.
Figure 16 shows the trend of variation in the viscous element parameters in the structure. Overall, the viscosity coefficient increased first and then decreased with the increase in shear stress. The reason for the above phenomenon was that the sample is affected by the elastic elements, and when the shear stress was small, the sample was mainly in the elastic deformation state, and the viscosity coefficient was small. With the change in shear stress and force duration, the soil particles became dense, and the cohesion increased, resulting in an increase in the viscosity coefficient. When the shear stress was greater than the yield strength of the soil, the structure of the soil sample was gradually damaged, so the viscosity coefficient of the model decreased with the continuous increase in shear stress. Additionally, when the shear stress was the same, with the increase in R, the porosity ratio of the soil particles decreased, and the cohesion increased, so the viscosity coefficient increased.
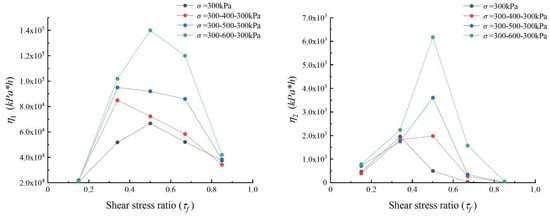
Figure 16.
The curve of viscous element parameters versus shear stress under different loading amplitude R.
5. Discussion
The long-term strength of a soil sample refers to the turning point at which soil creep is converted from stable creep to unstable creep with increasing time under a constant load [41], also known as the third yield stress value of a soil sample. The theory of long-term strength has not yet been unified. In the engineering field, it is generally believed that the long-term strength of rock–soil masses is less than the short-term strength [42]. At present, rheological research on soil is mostly focused on the creep phenomenon, and there is little research on long-term strength and its determination method. In China, the long-term strength is generally determined based on the three boundaries proposed by Chen [43], while it is determined by the Vyalov method [44], the Shlbata method, and other methods abroad [45]. Currently, the isochronous curve method and creep rate–stress relationship curve are most commonly used to determine the long-term strength; the steady-state creep rate method was selected in this study (Figure 17a).

Figure 17.
(a) The steady-state creep rate method to determine the long-term strength. (b) Creep process curve; A–D represents the dividing point of each creep stage.
According to the creep curve characteristics, the stable creep stage is the key process by which to distinguish the creep acceleration stage. As shown in Figure 17b, when the shear stress is less than the yield strength of the sliding zone soil, the strain curve tends to change horizontally with time, and the rate gradually decays to zero, as in section AB; as the shear stress increases, the strain rate decays to a stable value, and the strain changes with a certain slope, as in section BC; when the shear stress is greater than the yield strength of the sliding zone soil, the creep rate increases rapidly with time, resulting in the deformation and destruction of the sample, as in section CD. The shear stress of the BC section is taken as the long-term strength of the soil.
The latter half of the creep rate–stress curve was fitted in order to determine the long-term strength, and the intersection point of the fitting line and the stress axis was used as the reference value of the long-term strength. The steady-state creep rate–shear stress curve of each specimen was plotted according to the isochronous curve, as shown in Figure 18, where the blue section is the tangent of the latter half of the curve, and its intercept in the transverse axis is regarded as the long-term strength value. The long-term strength of the sliding zone soil was found to be approximately 71%–72% of the peak strength. Li at al. also believe that the long-term strength is about 70% of the peak strength [35].
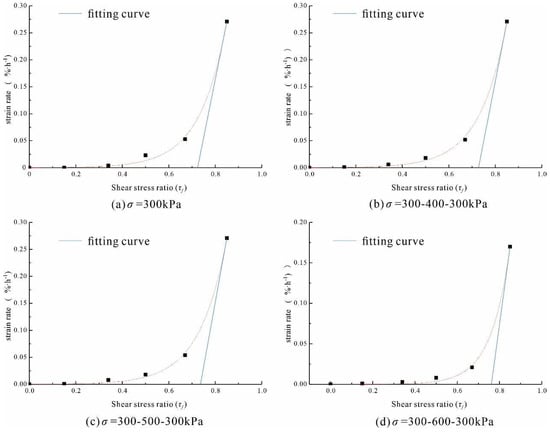
Figure 18.
The steady-state creep rate versus shear stress curve.
The long-term strength of sliding zone soil under different stress states was obtained using the steady-state creep rate method, which was 85.69 kPa (a), 107.22 kPa (b), 128.57 kPa (c), and 155.83 kPa (d). It was found that with the increase in the loading–unloading amplitude R, the long-term strength value increased nonlinearly. The reason for this phenomenon may be related to the porosity ratio of the specimen. Zhu et al. also found that when the soil structure changed from loose to dense, the porosity ratio of the soil decreased, and the bonding force between the soil particles became weaker, which greatly reduced the shear strength of the soil [46]. As shown in Figure 6, it was found that the porosity ratio under the initial consolidation state was the largest, the height of the sample after consolidation was the highest, the cohesion between the particles on the shear surface was low, and the long-term strength was the smallest. When the consolidation pressure of the specimen increased, the sample particles became denser, and the porosity ratio of the specimen decreased accordingly, reflecting that the long-term strength of the sliding zone soil increased.
In summary, the soil particles exhibited different degrees of compactness, and the porosity ratio showed certain regularity after the consolidation path of loading–unloading with different magnitudes R, which can be constructed to reflect the long-term strength of sliding zone soil under different consolidation paths [47], these results provide a reference value for the determination of the strength value of sliding zone soil of landslide.
6. Conclusions
In this paper, based on the influence of reservoir water level changes in the Three Gorges Reservoir area of the Yangtze River on the force of the landslide and the unloading effect on the sliding zone soil under the water when the reservoir water level rises, a direct shear creep test of the sliding zone soil in the Huangtupo landslide under unloading condition was carried out, and the Burgers model was used to fit the creep test curve. The following conclusions were obtained.
- The direct shear creep of the sliding zone soil was mainly divided into the attenuation creep stage and the steady creep stage; the accelerated creep stage was not observed. At the moment of the application of shear stress, the sliding zone soil produced instantaneous deformation, and the degree of deformation was positively correlated with the shear stress. The sliding zone soil was in the attenuation creep stage, and the creep rate decayed rapidly to zero with the low shear stress; the sliding zone soil was in the steady-state creep stage, the creep rate decayed to a constant value, and the visco-plastic creep characteristics were more obvious with the higher shear stress.
- With the increase in the pre-consolidation pressure applied to the sliding zone soil, the creep displacement was correspondingly reduced. When the level of loading stress was high, the shear strain of the sliding soil was also at a high level. Additionally, the strain rate of the sliding zone soil was positively correlated with shear stress and negatively correlated with the previous consolidation pressure. In this study, shear shrinkage occurred during the shear process.
- We found that the Burgers model can accurately fit the creep process of sliding zone soil. The shear modulus of the Burgers model was positively correlated with the applied shear stress. When the applied shear stress increased, the viscosity coefficient increased first and then decreased. The long-term strength value of the sliding zone soil was obtained using the steady-state creep rate method, and the value was about 72% of the peak strength. The long-term strength also increased with the increase in consolidation stress.
Author Contributions
Conceptualization, M.L. and D.C.; methodology, D.C.; software, X.B.; validation, M.L., Z.Q. and C.Z.; formal analysis, D.C.; investigation, M.L.; resources, D.C.; data curation, M.L.; writing—original draft preparation, M.L.; writing—review and editing, D.C.; supervision, X.B.; funding acquisition, D.C. All authors have read and agreed to the published version of the manuscript.
Funding
The work was financially supported by the National Natural Science Foundation of China (No. 42277171 and No. 41772304).
Institutional Review Board Statement
Not applicable.
Informed Consent Statement
Not applicable.
Data Availability Statement
The data presented in this study are available on request from the author.
Conflicts of Interest
The authors declare no conflict of interest.
References
- Wang, S.; Wu, W.; Wang, J.; Yin, Z.; Cui, D.S.; Xiang, W. Residual-state creep of clastic soil in a reactivated slow-moving landslide in the Three Gorges Reservoir Region, China. Landslides 2018, 15, 2413–2422. [Google Scholar] [CrossRef]
- Tan, Q.W.; Tang, H.M.; Fan, L.; Xiong, C.R.; Fan, Z.Q.; Zhao, M.; Li, C.; Wang, D.J.; Zou, Z.X. In situ triaxial creep test for investigating deformational properties of gravelly sliding zone soil: Example of the Huangtupo 1# landslide, China. Landslides 2018, 15, 2499–2508. [Google Scholar]
- Miao, H.; Wang, G. Effects of clay content on the shear behaviors of sliding zone soil originating from muddy interlayers in the Three Gorges Reservoir, China. Eng. Geol. 2021, 294, 106380. [Google Scholar] [CrossRef]
- Zou, L.; Wang, S.; Lai, X. Creep model for unsaturated soils in sliding zone of Qianjiangping landslide. J. Rock Mech. Geotech. Eng. 2013, 5, 162–167. [Google Scholar] [CrossRef]
- Luo, Q.; Chen, X. Experimental Research on Creep Characteristics of Nansha Soft Soil. Sci. World J. 2014, 2014, 968738. [Google Scholar] [CrossRef]
- Lian, B.Q.; Wang, X.G.; Zhan, H.B.; Wang, J.D.; Peng, J.B.; Gu, T.F.; Zhu, R.S. Creep mechanical and microstructural insights into the failure mechanism of loess landslides induced by dry-wet cycles in the Heifangtai platform, China. Eng. Geol. 2022, 300, 106589. [Google Scholar] [CrossRef]
- Xie, X.; Qi, S.W.; Zhao, F.S.; Wang, D.H. Creep behavior and the microstructural evolution of loess-like soil from Xi’an area, China. Eng. Geol. 2018, 236, 43–59. [Google Scholar] [CrossRef]
- Feng, X. Experiment and Numerical Simulation on Creep Mechanical Behaviors of Mudstone under Unloading Condition. Geofluids 2022, 2022, 7175774. [Google Scholar] [CrossRef]
- Wang, S.; Wang, J.E.; Wu, W.; Cui, D.S.; Su, A.J.; Xiang, W. Creep properties of clastic soil in a reactivated slow-moving landslide in the Three Gorges Reservoir Region, China. Eng. Geol. 2020, 267, 105493. [Google Scholar] [CrossRef]
- Long, J.H.; Guo, W.B.; Li, P.; Li, T.L. Creep property of soil in sliding zone of loess landslide. Yantu Gongcheng Xuebao/Chin. J. Geotech. Eng. 2010, 32, 1023–1028. [Google Scholar]
- Qin, Z.; Fu, H.L.; Chen, X.X. A study on altered granite meso-damage mechanisms due to water invasion-water loss cycles. Environ. Earth Sci. 2019, 78, 10. [Google Scholar] [CrossRef]
- Sun, M.J.; Tang, H.M.; Wang, X.H.; Hu, X.L.; Wang, M.Y.; Ni, W.D. Creep properties of sliding-zone soil from a creeping landslide. Rock Soil Mech. 2017, 38, 385–391. [Google Scholar]
- Nazer, N.S.M.; Tarantino, A. Creep response in shear of clayey geo-materials under saturated and unsaturated conditions. In Proceedings of the 3rd European Conference on Unsaturated Soils (E-UNSAT), Paris, France, 12–14 September 2016. [Google Scholar]
- Zhu, F.; Duan, Z.Y.; Wu, Z.Y.; Wu, Y.Q.; Li, T.L.; Cai, Y.D. Experimental Study on Direct Shear Creep Characteristics and Long-term Strength of Red Layer Sliding Zone Soil in Southern Hunan. In Proceedings of the International Conference on Materials, Mechanical and Manufacturing Engineering (IC3ME 2013), Guilin, China, 15 August 2014. [Google Scholar]
- Jiang, X.Z.; Wen, B.P. Creep behavior of slip zone of reactivated slow-moving landslide and its characteristic strength. Rock Soil Mech. 2015, 36, 495–501, 549. [Google Scholar]
- Mahinroosta, R.; Poorjafar, A. Effect of stress state and particle-size distribution on the stress reduction of sandy soils during saturation. Constr. Build. Mater. 2017, 150, 1–13. [Google Scholar] [CrossRef]
- Li, J.J.; Kong, L.W. Creep Properties of Expansive Soils under Triaxial Drained Conditions and its Nonlinear Constitutive Model. Period. Polytech. Civ. Eng. 2021, 65, 1269–1278. [Google Scholar] [CrossRef]
- Kutergin, V.N.; Kal’bergenov, R.G.; Karpenko, F.S.; Leonov, A.R.; Merzlyakov, V.P. Determination of Rheological Properties of Clayey Soils by the Relaxation Method. Soil Mech. Found. Eng. 2013, 50, 1–6. [Google Scholar] [CrossRef]
- Xiao, B.; Hu, M.Y.; Zhou, P.Y.; Lu, Y.K.; Zhang, Y. Creep Behavior of Saturated Clay in Triaxial Test and a Hyperbolic Model. Geofluids 2021, 2021, 7882046. [Google Scholar] [CrossRef]
- Gu, R.G.; Zou, Y.; Fang, Y.G.; Hu, Y.G. Rheological model of soft soils using nonlinear instantaneous elastic modulus. Rock Soil Mech. 2018, 39, 237–241. [Google Scholar]
- Ma, B.N.; Xie, X.Y.; Liu, K.F. Rheological catastrophic model for soft clays. J. Cent. South Univ. 2012, 19, 2316–2322. [Google Scholar] [CrossRef]
- Hu, H.; Zhang, B.W.; Yu, W.; Lu, L.F.; Zhang, C.M.; Niu, T.X. Rheological Behaviors of Structural Soft Soil in Dongting Lake Area. Geotech. Geol. Eng. 2020, 38, 4995–5003. [Google Scholar] [CrossRef]
- Zhu, Y.B.; Yu, H.M. An improved Mesri creep model for unsaturated weak intercalated soils. J. Cent. South Univ. 2014, 21, 4677–4681. [Google Scholar] [CrossRef]
- Wang, P.; Liu, E.L.; Song, B.T.; Liu, X.Y.; Zhang, G.; Zhang, D. Binary medium creep constitutive model for frozen soils based on homogenization theory. Cold Reg. Sci. Technol. 2019, 162, 35–42. [Google Scholar] [CrossRef]
- Li, L.L.; Guan, J.F.; Xiao, M.L.; Liu, H.C.; Tang, K.D. A creep constitutive model for transversely isotropic rocks. Rock Soil Mech. 2020, 41, 2922–2930. [Google Scholar]
- Okuka, A.S.; Zorica, D. Fractional Burgers models in creep and stress relaxation tests. Appl. Math. Model. 2020, 77, 1894–1935. [Google Scholar] [CrossRef]
- Zhao, T.B.; Zhang, Y.B.; Zhang, Q.Q.; Tan, Y.L. Analysis on the creep response of bolted rock using bolted Burgers model. Geomech. Eng. 2018, 14, 141–149. [Google Scholar]
- Zhao, Y.L.; Liu, Q.; Tang, L.M.; Xie, S.L. The double Burgers model of fractured rock masses considering creep fracture damage. J. Vibroeng. 2019, 21, 974–987. [Google Scholar] [CrossRef]
- Chang, Z.L.; Gao, H.X.; Huang, F.M.; Chen, J.W.; Huang, J.S.; Guo, Z.Z. Study on the creep behaviours and the improved Burgers model of a loess landslide considering matric suction. Nat. Hazards 2020, 103, 1479–1497. [Google Scholar] [CrossRef]
- Tang, H.M.; Li, C.D.; Hu, X.L.; Wang, L.Q.; Criss, R.; Su, A.J.; Wu, Y.P.; Xiong, C.R. Deformation response of the Huangtupo landslide to rainfall and the changing levels of the Three Gorges Reservoir. Bull. Eng. Geol. Environ. 2014, 74, 933–942. [Google Scholar] [CrossRef]
- Cao, Z.E.; Tang, J.; Zhao, X.E.; Zhang, Y.G.; Wang, B.; Li, L.C.; Guo, F. Failure Mechanism of Colluvial Landslide Influenced by the Water Level Change in the Three Gorges Reservoir Area. Geofluids 2021, 2021, 6865129. [Google Scholar] [CrossRef]
- Tang, H.M.; Li, C.D.; Hu, X.L.; Su, A.J.; Wang, L.Q.; Wu, Y.P.; Criss, R.; Xiong, C.R.; Li, Y.A. Evolution characteristics of the Huangtupo landslide based on in situ tunnelling and monitoring. Landslides 2014, 12, 511–521. [Google Scholar] [CrossRef]
- Wang, J.B.; Zhang, Q.; Song, Z.P.; Zhang, Y.W. Experimental study on creep properties of salt rock under long-period cyclic loading. Int. J. Fatigue 2021, 143, 10. [Google Scholar] [CrossRef]
- Kolarik, J.; Pegoretti, A. Proposal of the Boltzmann-like superposition principle for nonlinear tensile creep of thermoplastics. Polym. Test. 2008, 27, 596–606. [Google Scholar] [CrossRef]
- Li, C.; Tang, H.M.; Han, D.W.; Zou, Z.X. Exploration of the creep properties of undisturbed shear zone soil of the Huangtupo landslide. Bull. Eng. Geol. Environ. 2017, 78, 1237–1248. [Google Scholar] [CrossRef]
- MWR (Ministry of Water Resources). GB/T 50123-2019; Standard for Geotechnical Testing Method. MWR: Beijing, China, 2019.
- Dafalias, Y.F. An anisotropic critical state clay plasticity model. Mech. Res. Commun. 1986, 13, 341–347. [Google Scholar] [CrossRef]
- Majid, T.; Nourm, A. Significance of sail dilatancy in slope analysis. J. Geotech. Environ. Eng. ASCE 2000, 26, 75–80. [Google Scholar]
- Zhao, C.F.; Wu, Y.; Zhao, C.; Liu, F.M.; Liu, F. Effect of unloading on shear behaviour of interface between sand and concrete. Chin. J. Rock Mech. Eng. 2018, 37, 1020–1029. [Google Scholar]
- Chen, Q.; Cui, D.S.; Wang, J.E.; Liu, Q.B. An experimental study of creep characteristics of sliding zone soil of Huangtupo landslide under different consolidation stresses. Rock Soil Mech. 2020, 41, 1635–1642. [Google Scholar]
- Zhang, W.B.; Ma, J.Z.; Tang, L. Experimental study on shear strength characteristics of sulfate saline soil in Ningxia region under long-term freeze-thaw cycles. Cold Reg. Sci. Technol. 2019, 160, 48–57. [Google Scholar] [CrossRef]
- Chang, C.R.; Wang, G.H. Creep of clayey soil induced by elevated pore-water pressure: Implication for forecasting the time of failure of rainfall-triggered landslides. Eng. Geol. 2022, 296, 106461. [Google Scholar] [CrossRef]
- Chen, Z.J. The mechanical problems for the long-term stability of ground galleries. Chin. J. Rock Me-Chanics Eng. 1982, 1, 1–20. [Google Scholar]
- Vyalov, S.S.; Meschyan, S.R. Creep and Long-Term Strength of Soils Subjected to Variable Load. In Proceedings of the Soil Mechanics and Foundation Engineering Mexico, Mexico City, Mexico, 1 January 1969; pp. 423–431. [Google Scholar]
- Shibata, T.; Karube, K. Creep Rate and Creep Strength of Clays. In Proceedings of the 7th International Conference on Soil Mechanics and Foundation Engineering, Mexico City, Mexico, 1 January 1969. [Google Scholar]
- Zhu, R.S.; Xie, W.L.; Liu, Q.Q.; Yang, H.; Wang, Q.Y. Shear behavior of sliding zone soil of loess landslides via ring shear tests in the South Jingyang Plateau. Bull. Eng. Geol. Environ. 2022, 81, 244. [Google Scholar] [CrossRef]
- Munkholm, L.J.; Heck, R.J.; Deen, B.; Zidar, T. Relationship between soil aggregate strength, shape and porosity for soils under different long-term management. Geoderma 2016, 268, 52–59. [Google Scholar] [CrossRef]
Publisher’s Note: MDPI stays neutral with regard to jurisdictional claims in published maps and institutional affiliations. |
© 2022 by the authors. Licensee MDPI, Basel, Switzerland. This article is an open access article distributed under the terms and conditions of the Creative Commons Attribution (CC BY) license (https://creativecommons.org/licenses/by/4.0/).