Article

Enhancement of a Single-Axis Femtosecond Laser Scanning System by Using Two Galvanometers to Improve the Telecentricity and the Effective Scanning Length on Laser Process

1
Department of Electrical Engineering, National Kaohsiung University of Science and Technology, Kaohsiung 80778, Taiwan
2
Department of Electrical and Electronic, Nha Trang University, Nha Trang 650000, Vietnam
3
Department of Research and Development, E&R Engineering Corporation, Kaohsiung 82445, Taiwan
4
Department of Technology, Dong Nai Technology University, Bien Hoa 810000, Vietnam
5
Department of Graduate Institute of Clinical Medicine, Kaohsiung Medical University, Kaohsiung 80778, Taiwan
*
Author to whom correspondence should be addressed.
Appl. Sci. 2022, 12(23), 12434; https://doi.org/10.3390/app122312434
Submission received: 31 October 2022 / Revised: 30 November 2022 / Accepted: 30 November 2022 / Published: 5 December 2022
(This article belongs to the Section Optics and Lasers)

Abstract

:
The galvanometer scanning system plays a crucial role in modern laser material processing. With the development of this industry, the requirements for galvanometer scanners are getting higher and higher, especially to overcome the inherent disadvantages that still exist, such as image distortion, marking speed and accuracy in state-of-the-art scanning systems. In this paper, a single-axis optical scanner using two galvanometers in combination with one f-theta telecentric lens and a 343 nm femtosecond pulse laser source is proposed as a new approach for enhancing the precision of laser micromachining technology. The additional second galvanometer is used to manipulate the output laser beam of the first galvanometer to the path with less lens aberration to enhance the telecentricity correction and the effective scanning area. This is based on the international standard regulation ISO (the International Organization for Standardization) 11145:2018 requirements in optics and photonics, in which an important criterion is for the roundness of the focused beam spot to be greater than 87% to determine the effective working length of the proposed scanning system compared to the conventional scanning system. It is demonstrated by optical simulations and real optical experiments that the effective working length can be increased by 3.6 mm, corresponding to 8.1% of the effective scanning field, to achieve a laser material processing system with ISO standard. The damped least squares (DLS) algorithm in optical design software ZEMAX is used to optimize the deflected angle of the two galvanometers to obtain the optimal incident position of the f-theta lens.

1. Introduction

In recent decades, the strong development of the laser material processing industry has significantly contributed to the creation of high-quality micromachining products. Optical scanning devices are seen as an indispensable component in making that remarkable development. A two-axis galvanometer-based scanning system deflects a laser beam in both X and Y directions so the laser beam can be guided to any position on the workpiece. They are also used in many other systems along with many other criteria, such as high marking speed, high repeatability, high resolution, and high precision. The most used optical scanners are galvanometer-based, polygon, resonant, holographic, acousto- and electro-optic. Laser scanning technology is divided into two types: pixel-based and vector-based scanning. Polygon and resonant scanning systems represent pixel-based scanning technology with a deflected speed higher than 100 m/s [1,2], but the disadvantage is that the pixelation increase leads to low-precision laser beam positioning. In contrast to pixel-based scanning systems, vector scanning systems such as galvanometers, piezo and MEMs scanners allow the beam to be scanned along a defined trajectory, thereby providing higher spatial resolution and reduced processing time [3]. In addition, in a vector scanning system, optical deflectors such as EOD (electro-optical deflector) and AOD (acousto-optical deflector) provide high scanning speed and accuracy. Still, their disadvantages are small scanning ranges and very high costs. With a cost-effective and large scanning field, a galvanometer scanner is chosen as a competitive commercial solution for the micromaterial processing industry. The galvanometer scanning system was studied and designed in the early 1970s, with the first open-loop scanners, and continuously improved and developed in terms of design and technology to increase the marking speed, as well as the precise positioning [4,5,6]. The laser scanner has also been widely used in electronics technology [7,8,9,10], biomedical and ophthalmic imaging [11,12,13,14], and laser material processing [15,16,17,18]. Nowadays, with a state-of-the-art laser material processing system, the two-dimensional galvanometer scanning system is available for commercial markets with high performance, such as positioning speed (75 m/s), low feedback resolution (0.012 µrad), accuracy (50 µrad pk-pk) and marking speed (5 m/s) [19].
However, the scanning system still has inherent disadvantages, such as scanned image distortion and decreased telecentricity. They are considered essential performance criteria which lead to the inhomogeneity of spots in the scan field when the scanning system scans along the two X and Y axes in combination with a telecentric f-theta lens. The scanned image distortion and telecentric errors increase with a larger scan field, which is related to the structure of the f-theta lens. The use of a telecentric lens is that the laser beam can move parallel to the optical axis to impact the working plane vertically, after passing through the focusing lens, so that the beam shape can be kept round over the scan field [20]. As a result, when using the 2D galvanometer system, the working scanning area of the laser machining system will be limited by the telecentricity of the f-theta lens.
Ideally, the smaller the distance between the two mirrors in a conventional 2D scanning system, the better the performance. However, when increasing the input beam size to obtain a small spot size on the working plane, the X-axis scanning mirror is usually tilted at an angle to create a short enough distance between the two mirrors to obtain a higher telecentricity in practice. In consequence, the original center point position is shifted, and the telecentricity is thus decreased, as shown in Figure 1.
Various methods of improving distortion and telecentricity for 2D scanning systems have been proposed. Xianyu Meng et al. proposed the targeted coordinate transformation to correct the distortion error [21]. Bao-Ling Qi et al. presented a method to fix the distortion of the scanned image by controlling the driving voltage compensation [22]. Another voltage controlling solution was conducted by Yunxi Li’s team [23]. Franz, D. et al. introduced combined scanning of the galvanometer scanner and the subsystem with two A.O.D.s for high efficiency on 74% of the scan field of the f-theta lens they use [24]. Delgado et al. used a coaxially coupled vision device combined with a self-designed calibration plate to reduce field distortions [25]. Yi Zhong et al. presented another approach using freeform surfaces to correct 2D-telecentric scanning systems [26]. Some studies on 2D scanning systems used three galvanometers, in which two mirrors were used for the X-axis and one mirror for the Y-axis [27,28]. It is also commercially available with a scan field that significantly enlarges the working area compared to conventional 2D scanning systems [29].
The ISO standard 11145 provides a set of basic terms, symbols, and units of measurement related to the field of laser technology, in which beam ellipticity or beam roundness is used for the analysis and evaluation of the improved efficiency of the 1D scanning system using two galvanometers, compared to a commercial 2D scanning system [30]. The roundness of the laser beam is the ratio of the minimum diameter to the maximum beam diameter. For the beam roundness evaluations, an ISO standard roundness value of greater than 87% of micro-holes can be regarded as circular, with a value of greater than 90% to meet industrial standard [24,31]. In this study, the evaluation for the effective scan length extension will be evaluated against the criteria of the ISO standard.
The improvement in laser beam quality can be classified in two main directions: the first is to improve the structure of the f-theta lens, and the second is to add additional optical components to improve the beam quality. The telecentric error can be reduced by using two additional free surfaces in the f-theta lens for a conventional 2D galvanometer scanning system [26]. Using a 2D galvanometer scanning system combined with a non-mechanical scanning system with 2 AODs can improve laser beam roundness by more than 90% over using only conventional 2D scanning systems, as shown in [24]. A 2D scanning system using three galvanometer mirrors is now available on the market, as an alternative to the traditional 2D scanning system using two mirrors, to expand the effective working area and improve the focus of the laser spot size [29]. In this study, inspired by the above ideas, a 1D scanning system using two mirrors in combination with the f-theta lens is proposed and implemented to reduce telecentric errors, improving laser beam quality and extending the effective working length. This research will include two main parts: simulation with ZEMAX software and experimental setup with Lab’s prototype. However, adding one galvanometer mirror to correct aberration and telecentricity in simulation and experiment has not been studied. In the simulation, the tilt angle of 2 mirrors was optimized by the DLS (Damped least squares) algorithm in the ZEMAX optical design software [32]. The beam profile will be observed and collected for analysis. Then, an experimental setup with a laboratory scale will be conducted to collect results and compare them to the simulation to meet the requirements of ISO 11145:2018. Before the wafer dicing, applications such as laser-based scribing and grooving on silicon wafers are critical processes for integrated circuit production, so a silicon wafer is used for the laser- processing demonstration experiments.

2. The Working Principle of the Single-Axis Scanning System with Two Galvanometers

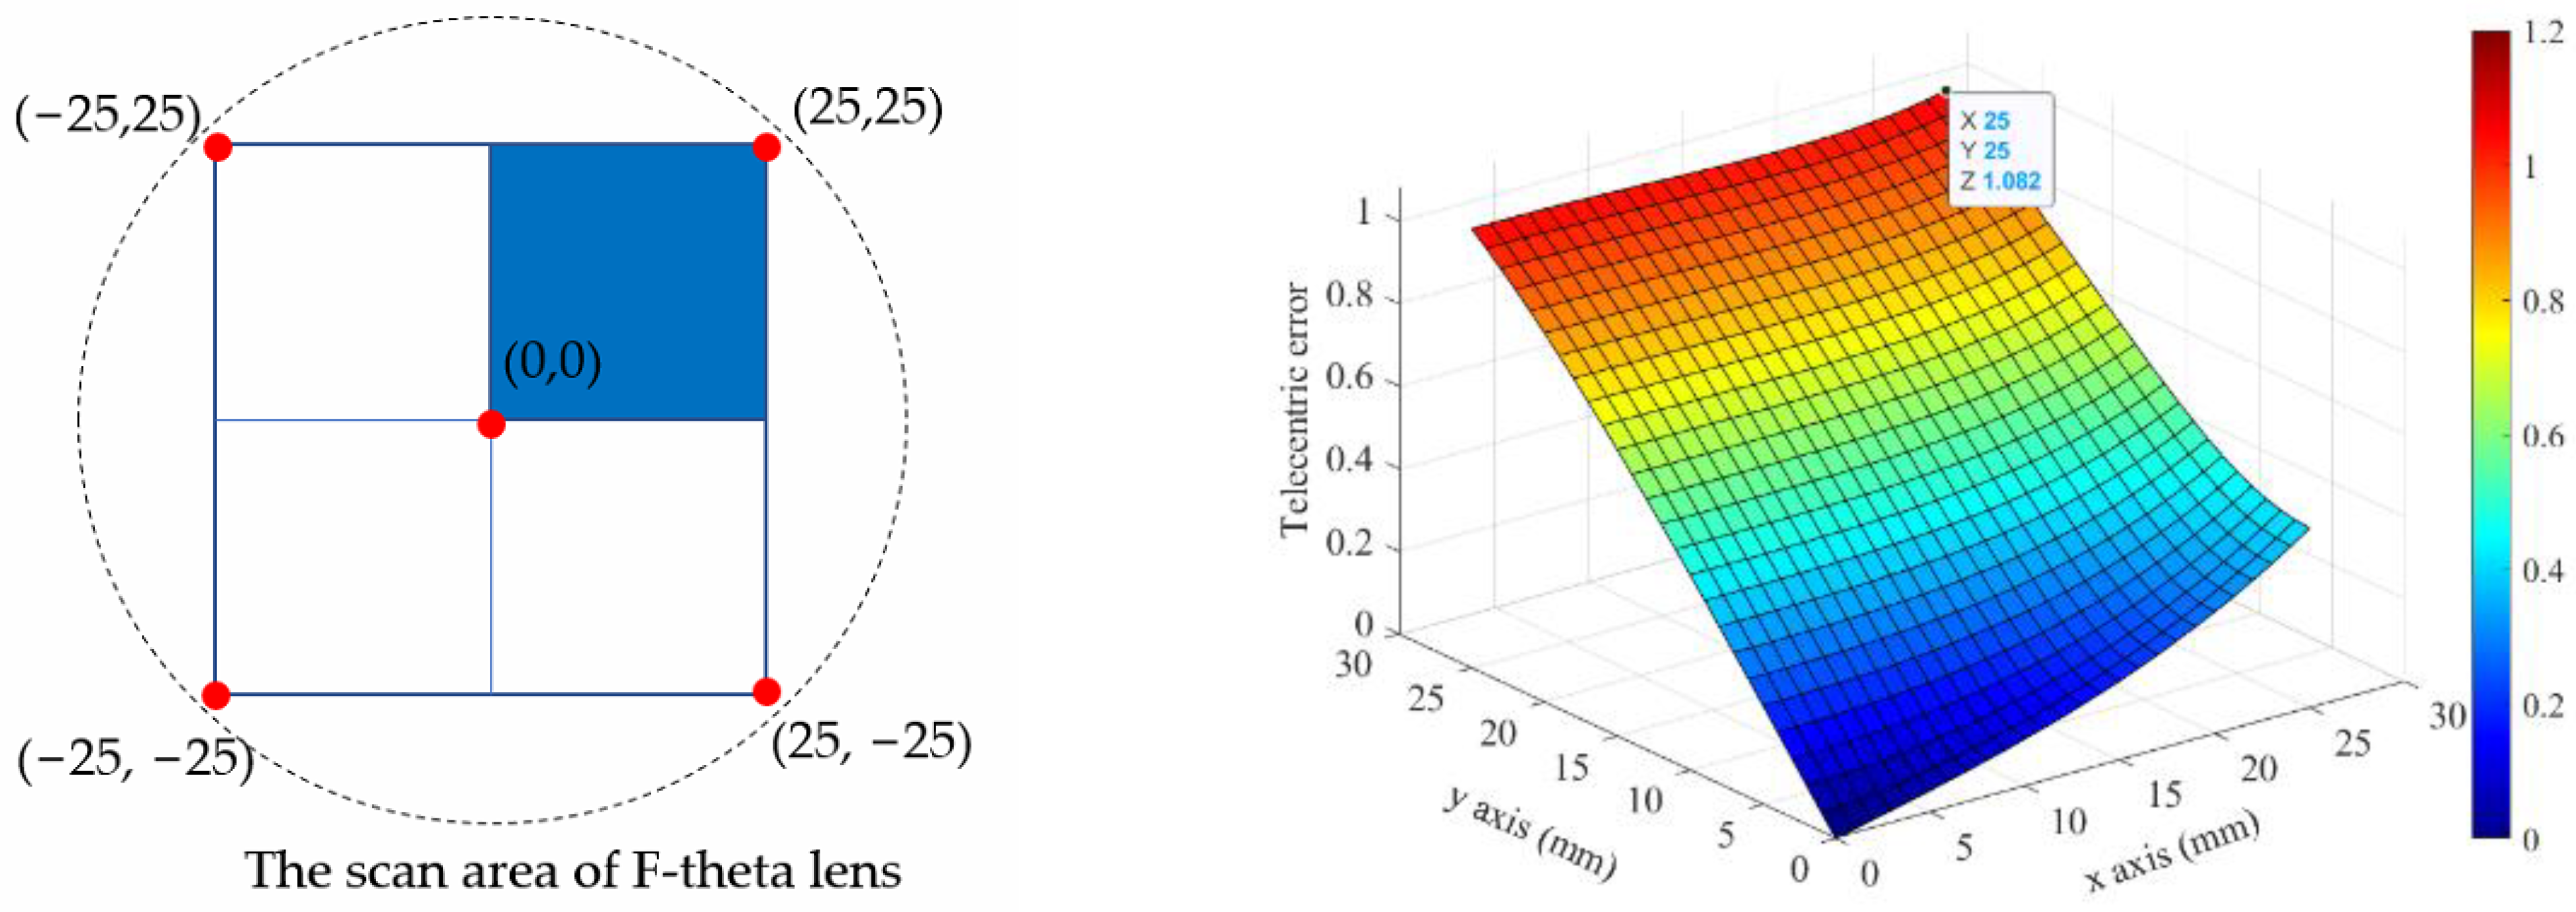
The mirror-based scanning system is responsible for deflecting the beam relative to the working plane. With the advantage of high deflection speed and dynamics compared to the workpiece axis-based lateral movement system, this system significantly improves material processing efficiency [33]. Two-dimensional beam deflection systems typically consist of two galvanometers that can be rotated to deflect the beam for scanning in the x and y directions and are known as galvanometer scanners. The major disadvantage of this system is the dependence of the beam deflection of the second mirror on the beam deflection of the first mirror. With the incident beam aligned perpendicular to the axis of rotation of the first mirror, changing the tilt angle of the first mirror will change the tilt angle of incidence to the second mirror, making the trajectory of the second mirror not straight, leading to the scanning field profile not being a square [34,35]. Figure 2 shows the telecentricity of different locations on the workpiece area of 25 × 25 mm2 using a commercial 2D scanning system. It can be easily seen that the telecentricity is not the same at the same position along the x and y direction from the center point of the workpiece.
This is also evident in the distortion of the scan field for a two-galvanometer scanning system and is a major disadvantage. Following the scanning system, a focusing lens with a flat field is responsible for focusing the laser beam onto the flat surface of the workpiece. Most lenses follow a relationship with image height resulting in Y = f. tan(θ) with zero distortion. However, it is not reasonable to use such a lens in a scanning system due to the velocity of the scanned spot increasing proportionally to the tangent of the scanning system. Since the motion of the laser scanner is required at a linear speed, conventional mirrors are not acceptable. The selected lens must maintain the relationship, in that changing the linear speed with Y = f. θ will produce a linear scan rate suitable for the scanning system [36,37]. Lenses like these are called F-theta. These lenses are designed with intentional negative or barrel distortion to counteract increased image velocity.
The distance of the beam on the workpiece from the center point to the scanning field d is given by the equation
d θ = f . θ
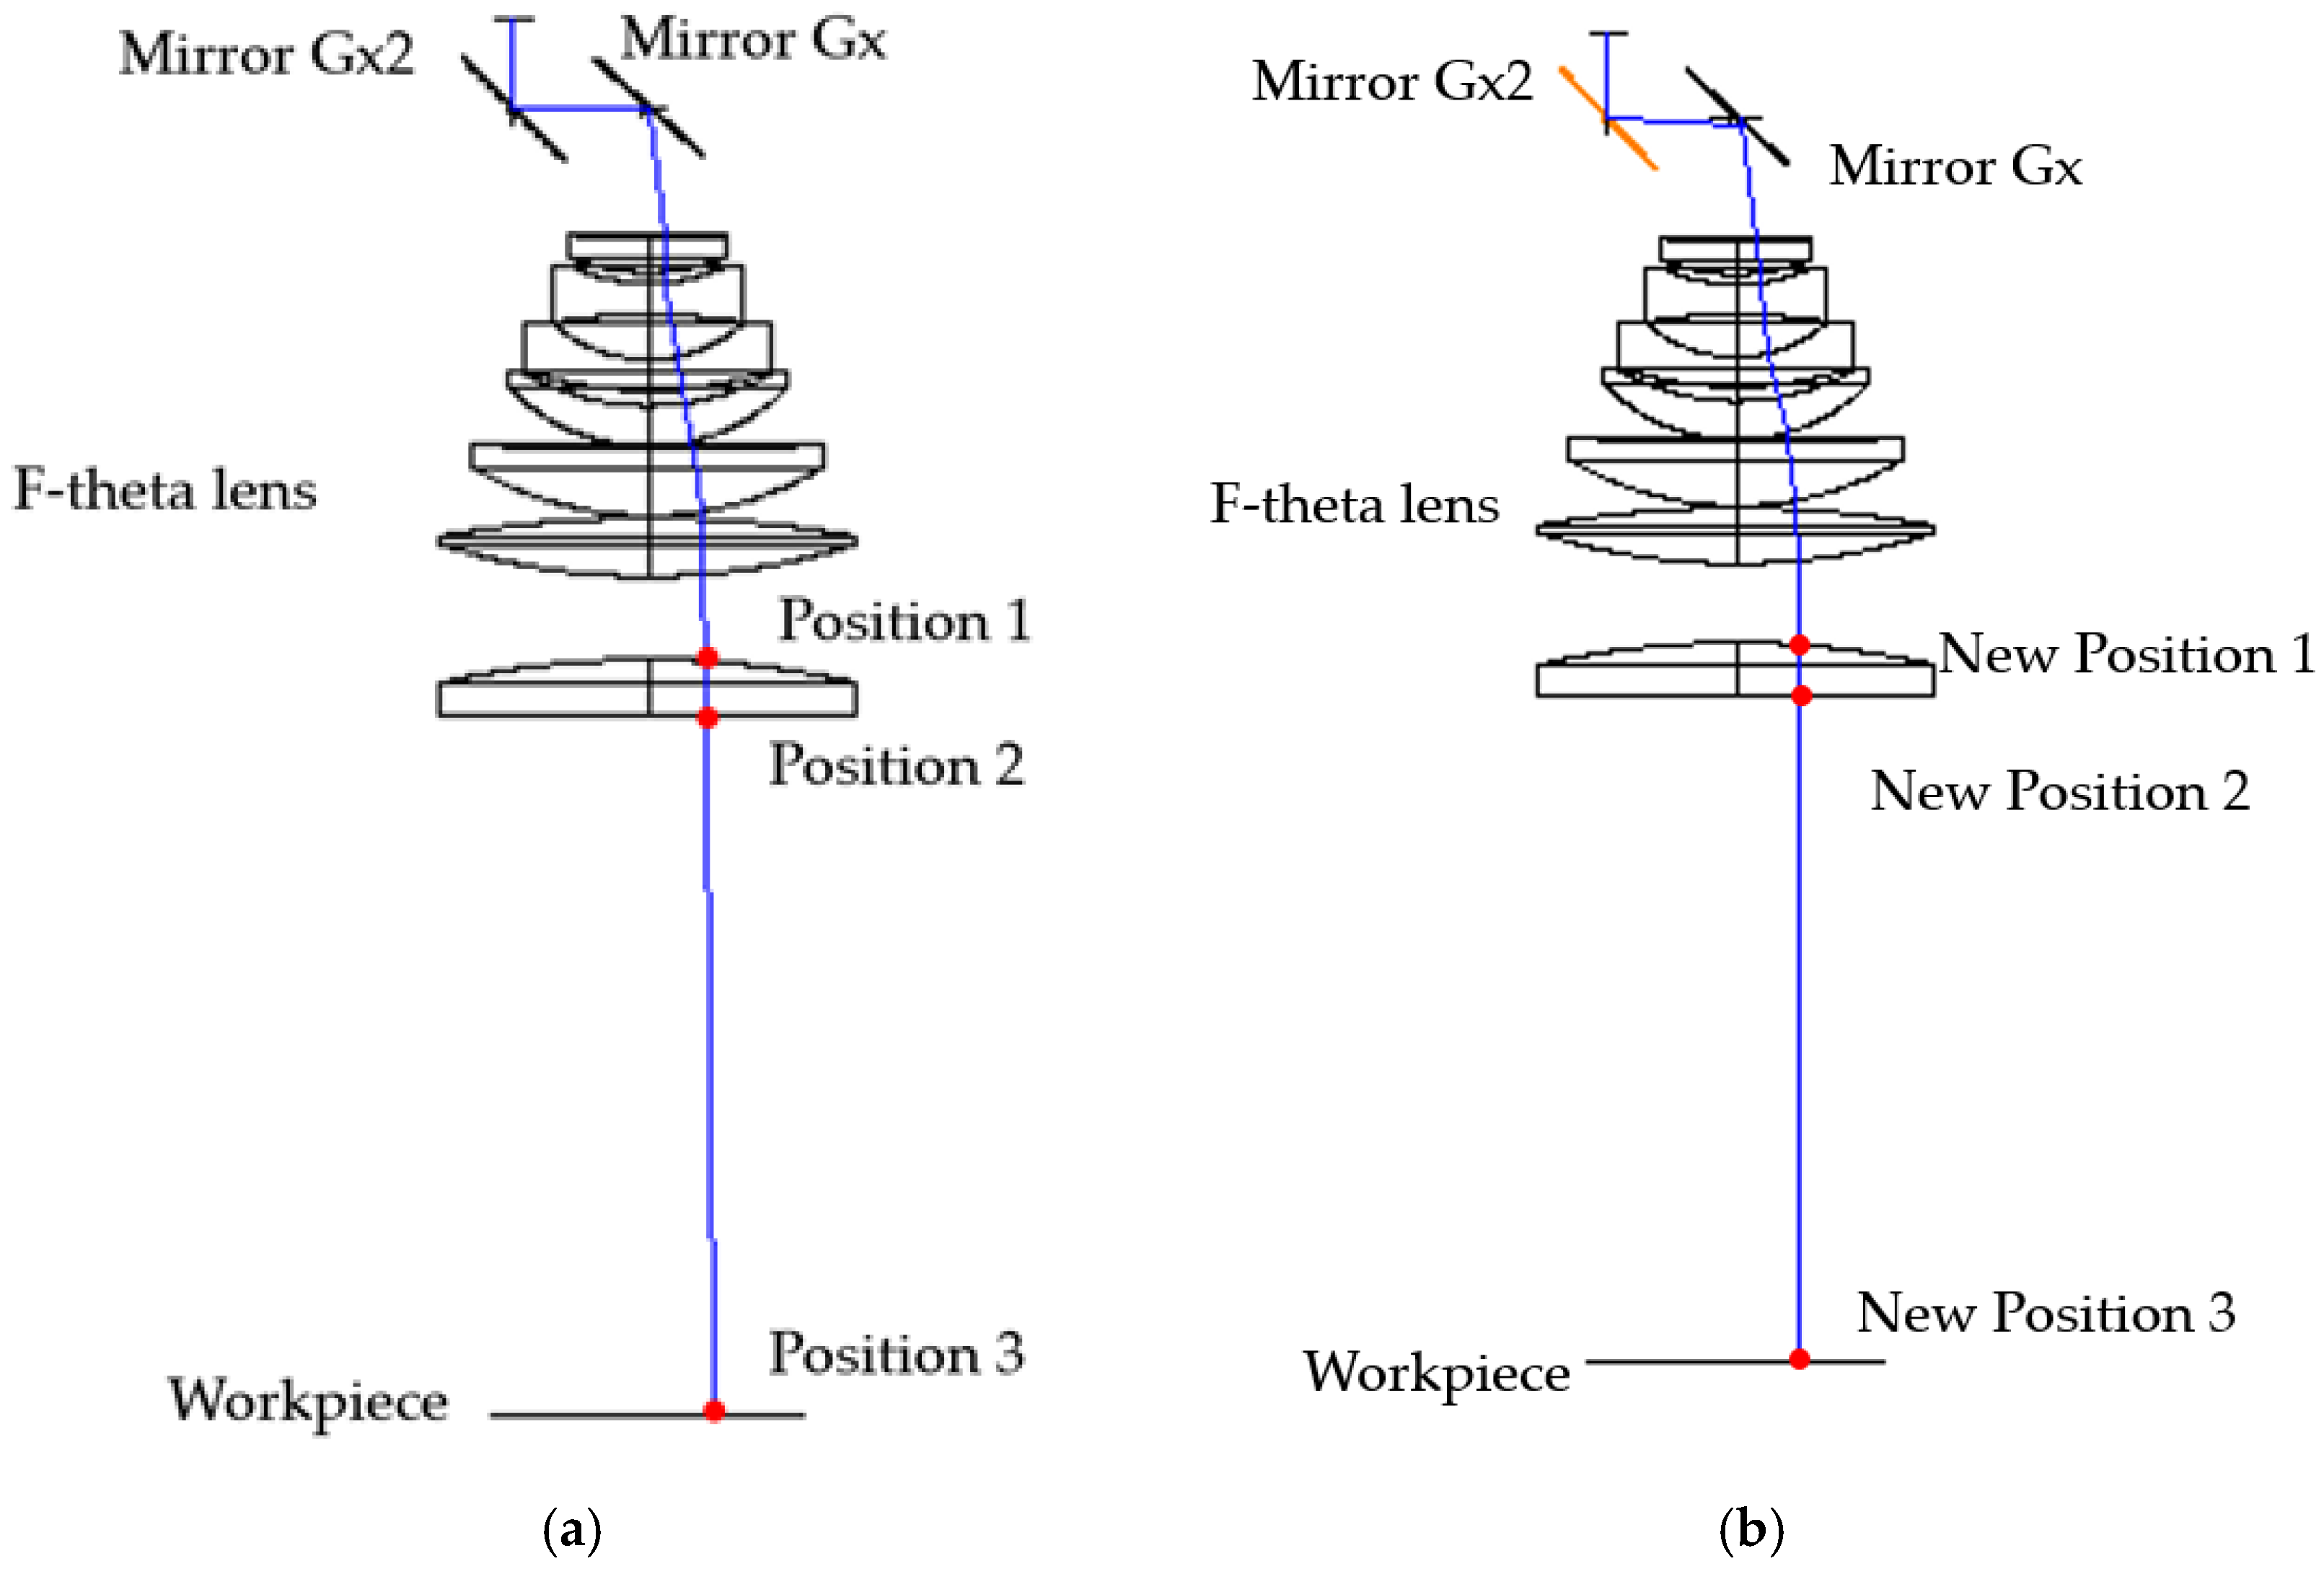
which is, in turn, denoted as the focal length of the F-theta lens f and the beam deflection angle θ. Combining the scanning field of the scanning system and the f-theta lens can significantly improve the scanning position on the workpiece surface, while still having minor telecentricity. Even though it is less than one percent, it also causes significant positional distortion if the focal length of the F-theta lens is significant and will produce guide beam inclinations that cannot have perpendicular effects on the workpiece, resulting in the beam profile’s non-circular shape. With the single-mirror galvanometer system, which orbits in a straight line with the Y-axis and has a scanning field in a broader axis than the two-axis system, telecentricity still exists due to the combination of F-theta lenses. It is because of the disadvantage of these two scanning systems that we propose an approach to eliminate the telecentricity to increase the accuracy of workpiece processing, and at the same time, improve the edge quality of the bore or groove. A scanning system using two mirrors is considered a solution for minimizing the telecentricity of the system. The working principle of the 1D scanning system using two galvanometers is shown in Figure 3a,b. In Figure 3a, the galvanometer Gx deflects at an appropriate angle to guide the beam to the desired position. For this system, telecentricity still exists and varies depending on the deflected angle of the incident beam and the distance to the f-theta lens. Figure 3b shows a single-axis scanning system using two galvanometers, working by shifting the laser beam in a direction parallel to the initial beam in the scanning system using 1 Galvo, and keeping the scan angle constant to ensure the correct positioning in the direction of the laser beam in Equation (1). The new position to minimize the telecentricity value depends on the construction of the f-theta lens. With different f-theta structures, the galvanometers will need to be tilted at different angles. Optimization of the tilt angle of the galvanometers will be performed by the optical design software ZEMAX.
A position coefficient C f theta is defined as the coefficient to determine the new position one of the f-theta lens P1n from position one P1, and it depends on the structure of the f-theta lens.
C f theta = P 1 n P 1
The beam deflection angle θ describes the relationship between the tilt angle of mirror one θm1 and mirror two θm2
θ = 2 . θ m 1 + θ m 2
New position one is considered as the position relative to the angle theta to mitigate telecentricity, which can be determined by an equivalent equation as follows:
P 1 n = d θ . tan 2 . θ m 1 + θ m 2 . C f theta
The Cf-theta coefficient in this simulation has a value that varies from 1.17 to 1.058 depending on the beam deflection angle from 1 degree to 16.2 degrees, respectively. We can also choose constant factor Cf-theta = 1.11 as the constant factor for the approximative calculation.

3. Results and Discussion

The target of designing the 1D scanning system using two galvanometers is to meet the ISO standard and have a more effective working range compared to the 2D galvanometer scanner. Through the workflow diagram, there are three main parts for building this scanning system, including part 1: simulating an f-theta lens model with the same specifications as a real f-theta lens; part 2: simulating a 2D scanner and 1D scanner with two mirrors and evaluating the telecentricity and the roundness of the beam spot; and part 3: implementing the practical experimental setup, including measuring the parameters and evaluating the results, as well as comparing the results of the simulation and experiment. All parts of this study are presented in detail in Figure 4.

3.1. F-Theta Lens Design

At the start of the telecentric f-theta lens design process, specifications, such as effective focal length, telecentric error, entrance beam, wavelength, scan angle, and aperture stop, need to be taken into account. The expected improvement is that the effective scanning range can be enlarged with a beam spot roundness of over 87%, complying with ISO standards. The simulation model was implemented by ZEMAX software using the ray-tracing method to create the structure of the f-theta lens group. The f-theta lens group used in this simulation is based on the telecentric lens S4LFT4125-075 of Sill Optics. The design parameters include a design wavelength of 355 nm, an effective focal length of 125 mm, a maximum entrance beam diameter of 10 mm, an optical scan angle of 17.5 degrees, an aperture stop distance of 36.8, and a working length of 156.9 mm. The parameter is set for the general dialog box with an aperture value of 10, and the apodization type is Gaussian with a factor of 1. The parameter in the field data dialog box is set from 0 to 15 degrees, and the wavelength is 355 nm for the wavelength dialog box.
During the lens simulation, an optimization merit function was used, such as the RMS spot radius, DISC, RAED, EFFL, and aberration operands, in which the important operands such as DISC (the calibrated distortion) is set to 1.042, RAED (real ray angle of exitance) = 0.2 and EFFL (effective focal length in lens units) = 125.04 to constrain the desired design. Its field of view is 0° in blue, 5° in green, 10° in red, 12.5° in yellow, and 15° in pink. The number of lenses in the f-theta is seven, as shown in Figure 5.
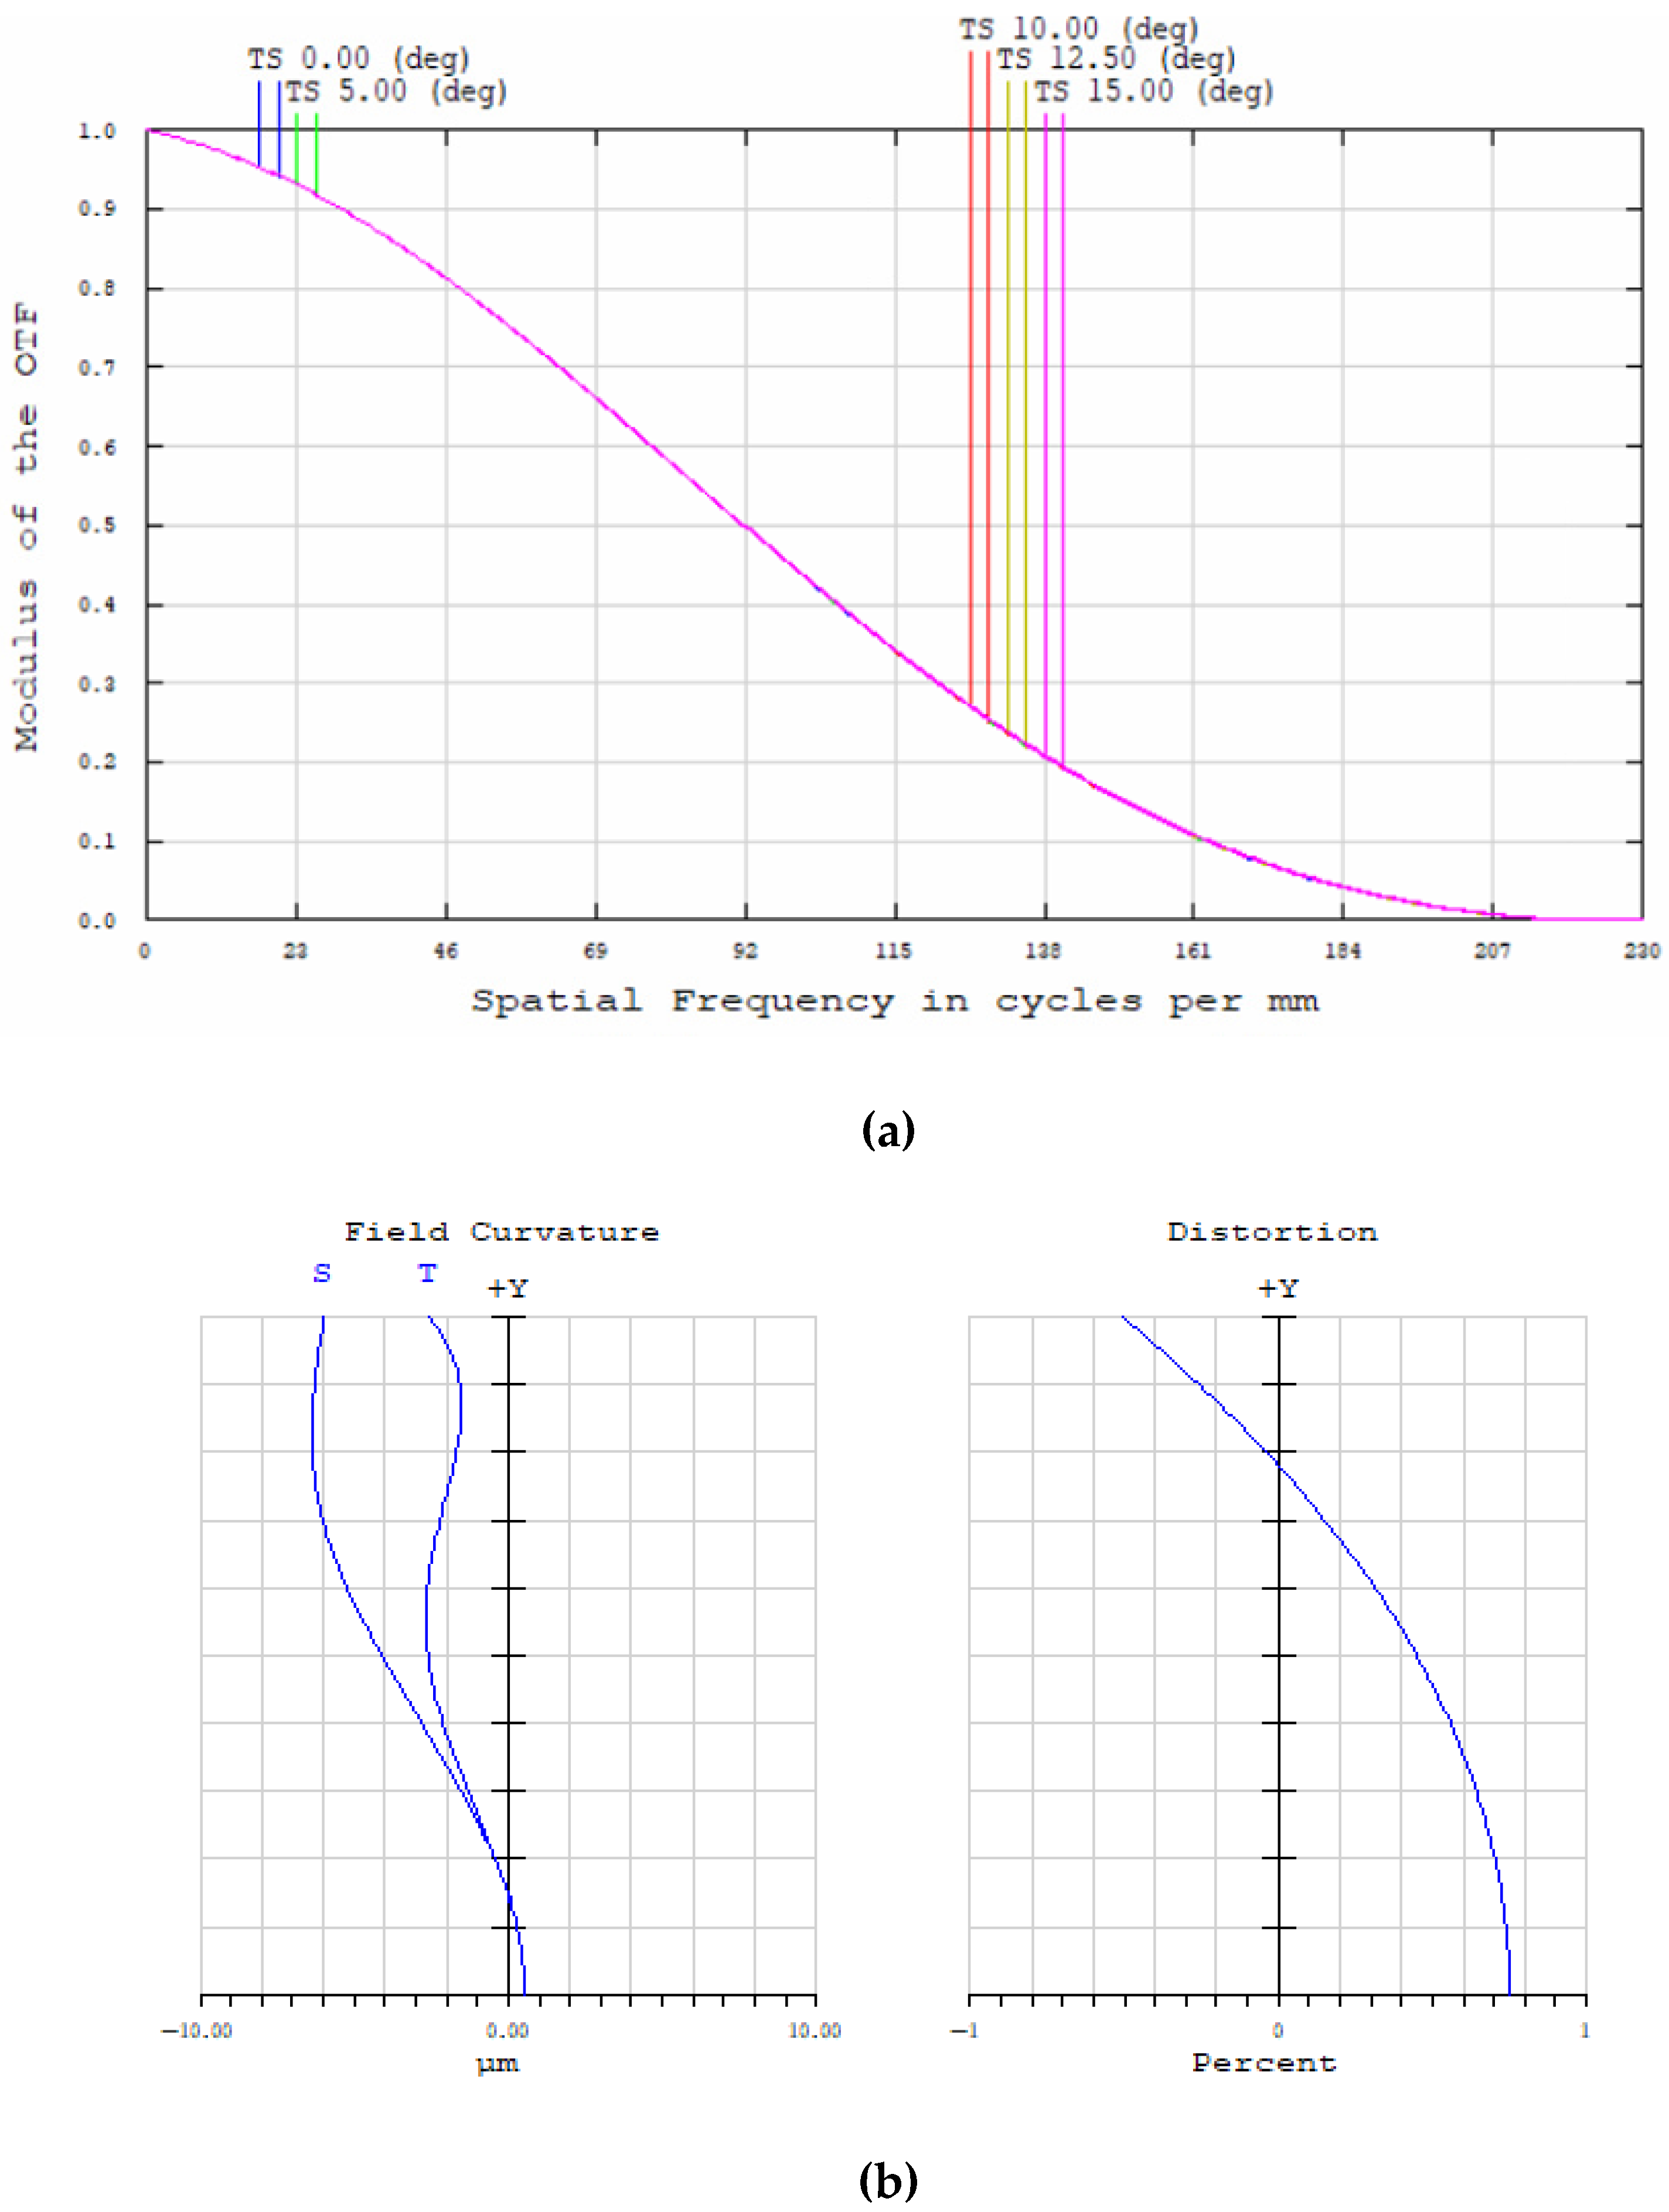
The MTF graph of the designed f-theta lens group is shown in Figure 6a. The MTF values of every field (0, 5, 10, 12.5, and 15) show more than 0.18 at 143 lp/mm, and all field lines coincide with the diffraction limit line showing the perfect performance of the f-theta lens. The maximum f-tan(theta) distortion of less than 1% with a tilt angle of 15 degrees is suitable for the design requirements for a large field of view, as depicted in Figure 6b. The limitation of the tilt angle for the 2D scanner is 12.5 degrees.

3.2. Single Galvanometer Scanner Model

The laser scanning system design uses the AGV14HPO galvanometer scanner manufactured by Aerotech Inc. The dimension of the X and Y mirrors are 28.2 × 17 mm and 33.4 × 24 mm, respectively. The face-sheet thickness of the mirror is 0.8 mm, with a rotation range of the mirror of ±20 degrees. The parameters are set to increase the simulation model’s reliability and accuracy. For the 2D scanner, the distance between mirror one (M1) and mirror two (M2) is 16.5 mm, and 27 mm for the distance between mirror two and the f-theta lens, as derived from the scanning system technical material. The detailed parameters related to the simulation model are listed in Table 1. The design parameters of a 1D scanning system using two galvanometers changes the mirror’s surface 5 and 11 properties with the mentioned thickness and dimension, and places the center of gravity of the mirror on the rotation axis to increase the accuracy for simulation. These parameters for the 1D scanner will be optimized by ZEMAX software with merit functions. After optimization, the distance M1–M2 is 36.8 mm, and M2–the f-theta lens is 40 mm. Then, beam sizes X and Y are measured, and values, such as beam ellipticity, are calculated for efficient evaluation. The three-dimensional layout of the structure of the 1D scanner uses two galvanometers in combination with the designed f-theta lens with a focal length of f = 125 mm, as depicted in Figure 7.
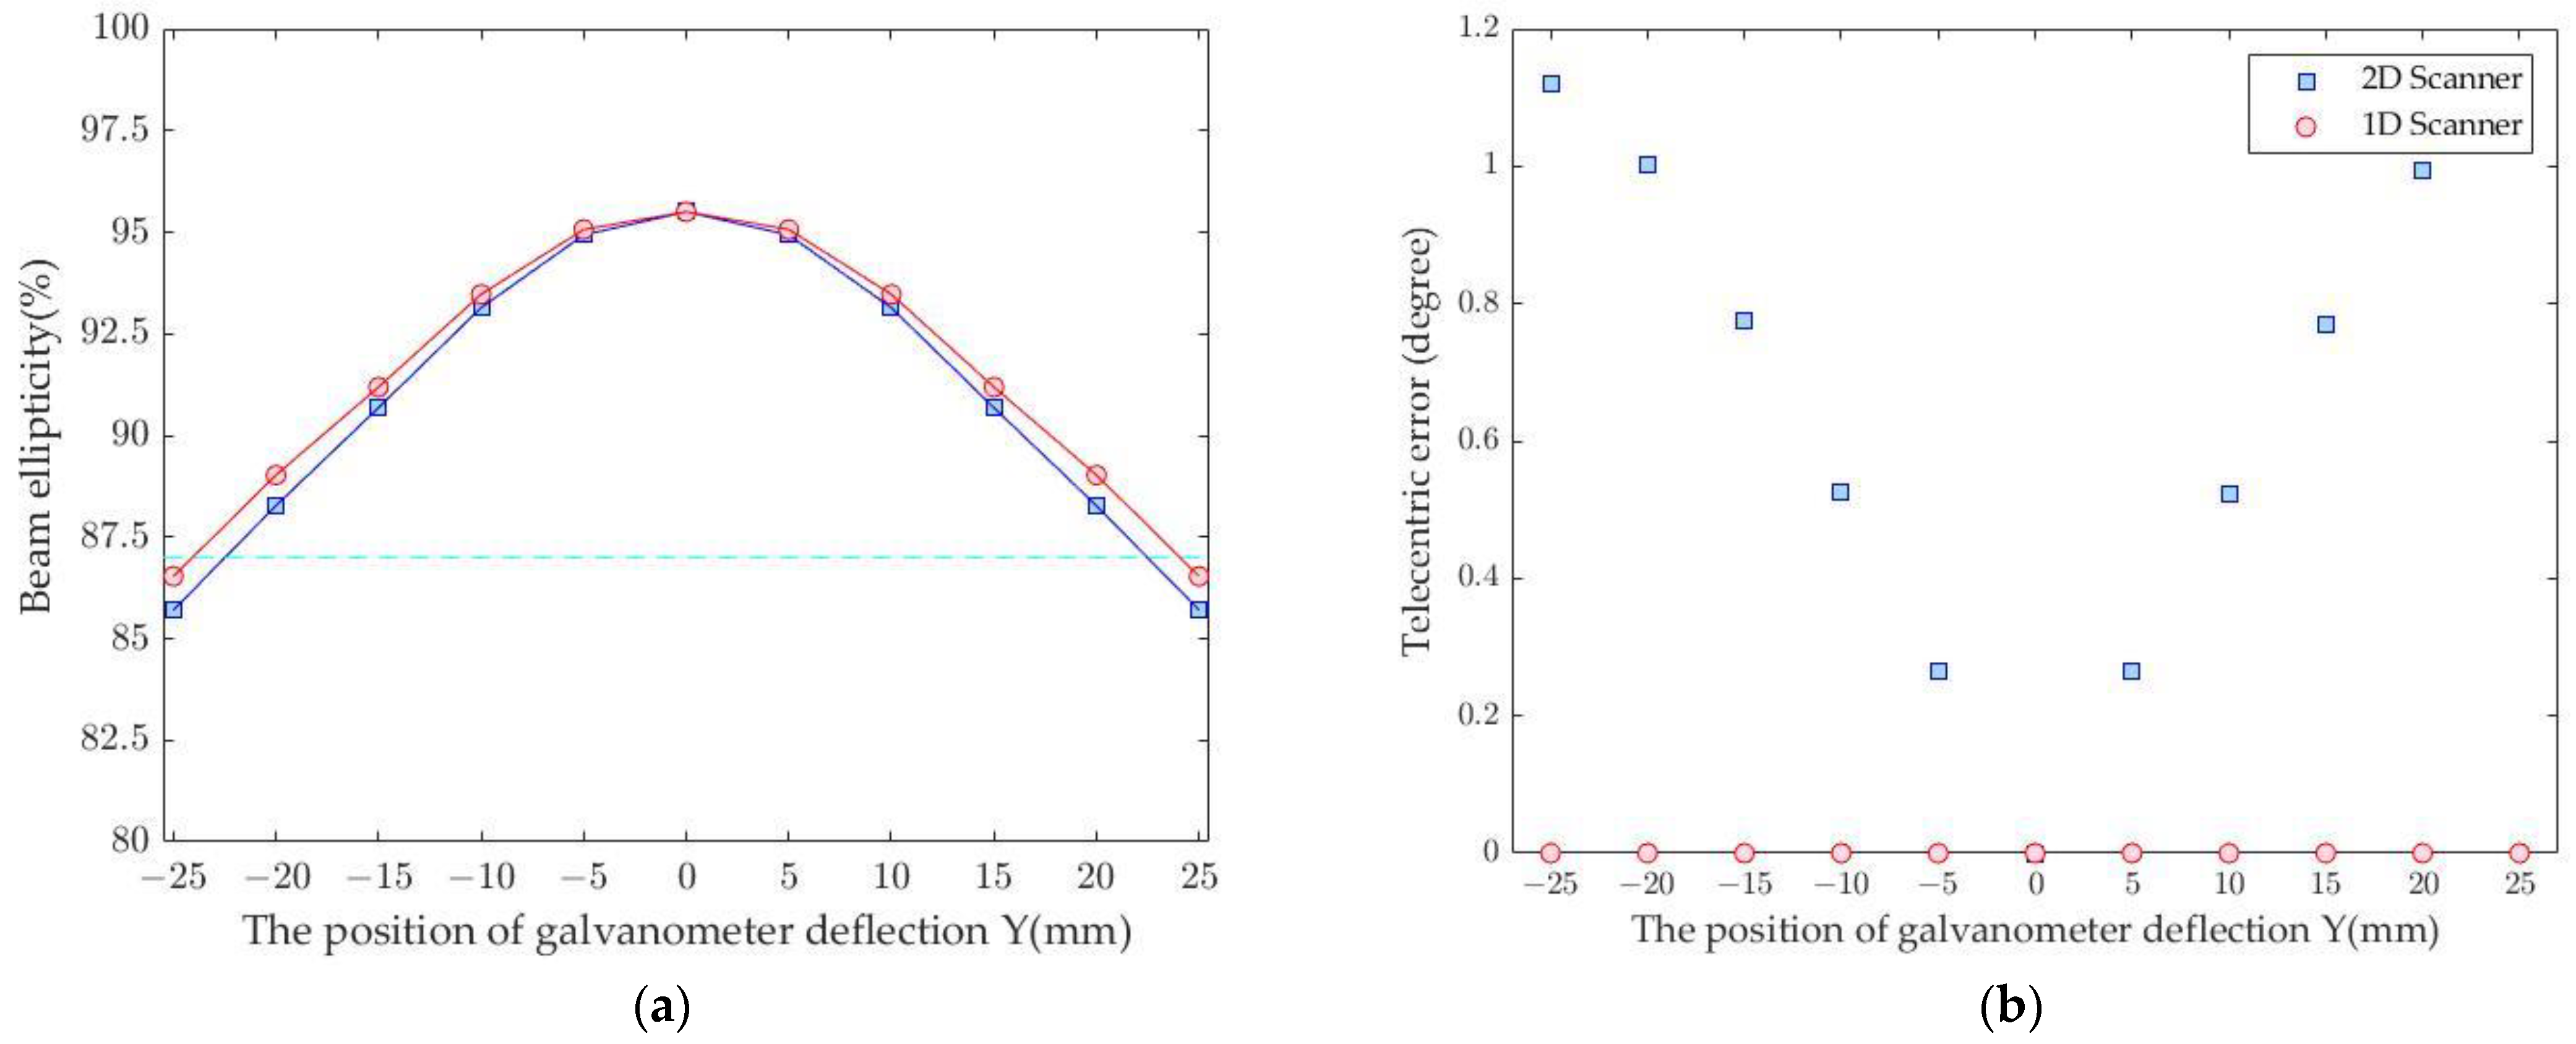
Figure 8a shows simulation results comparing the roundness of the 1D scanning system using two galvanometers in the red circle and the 2D scanning system in the blue square. The cyan line shows the roundness of the ablations in ISO 11145:2018. The criterion for the roundness of the laser beam has been calculated as the ratio of the minimum diameter to the maximum beam diameter. For ISO standards with beam roundness requirements over 87%, the recommended effective extension length of the 1D scanning system is 3.16 mm on the maximum scan length of 75 mm of the f-theta lens, corresponding to 4.21% of the effective scan length. The maximum working distance with roundness greater than 87% is 48.1 mm, which corresponds to 64.13% of the effective scanning length of the f-theta lens. The telecentricity compensation is determined by the RAED operator in Zemax, shown in Figure 8b. This shows increased telecentricity in f-theta lenses through the use of a second mirror to change the pivot point.

3.3. Optical Experimental Setup and Results

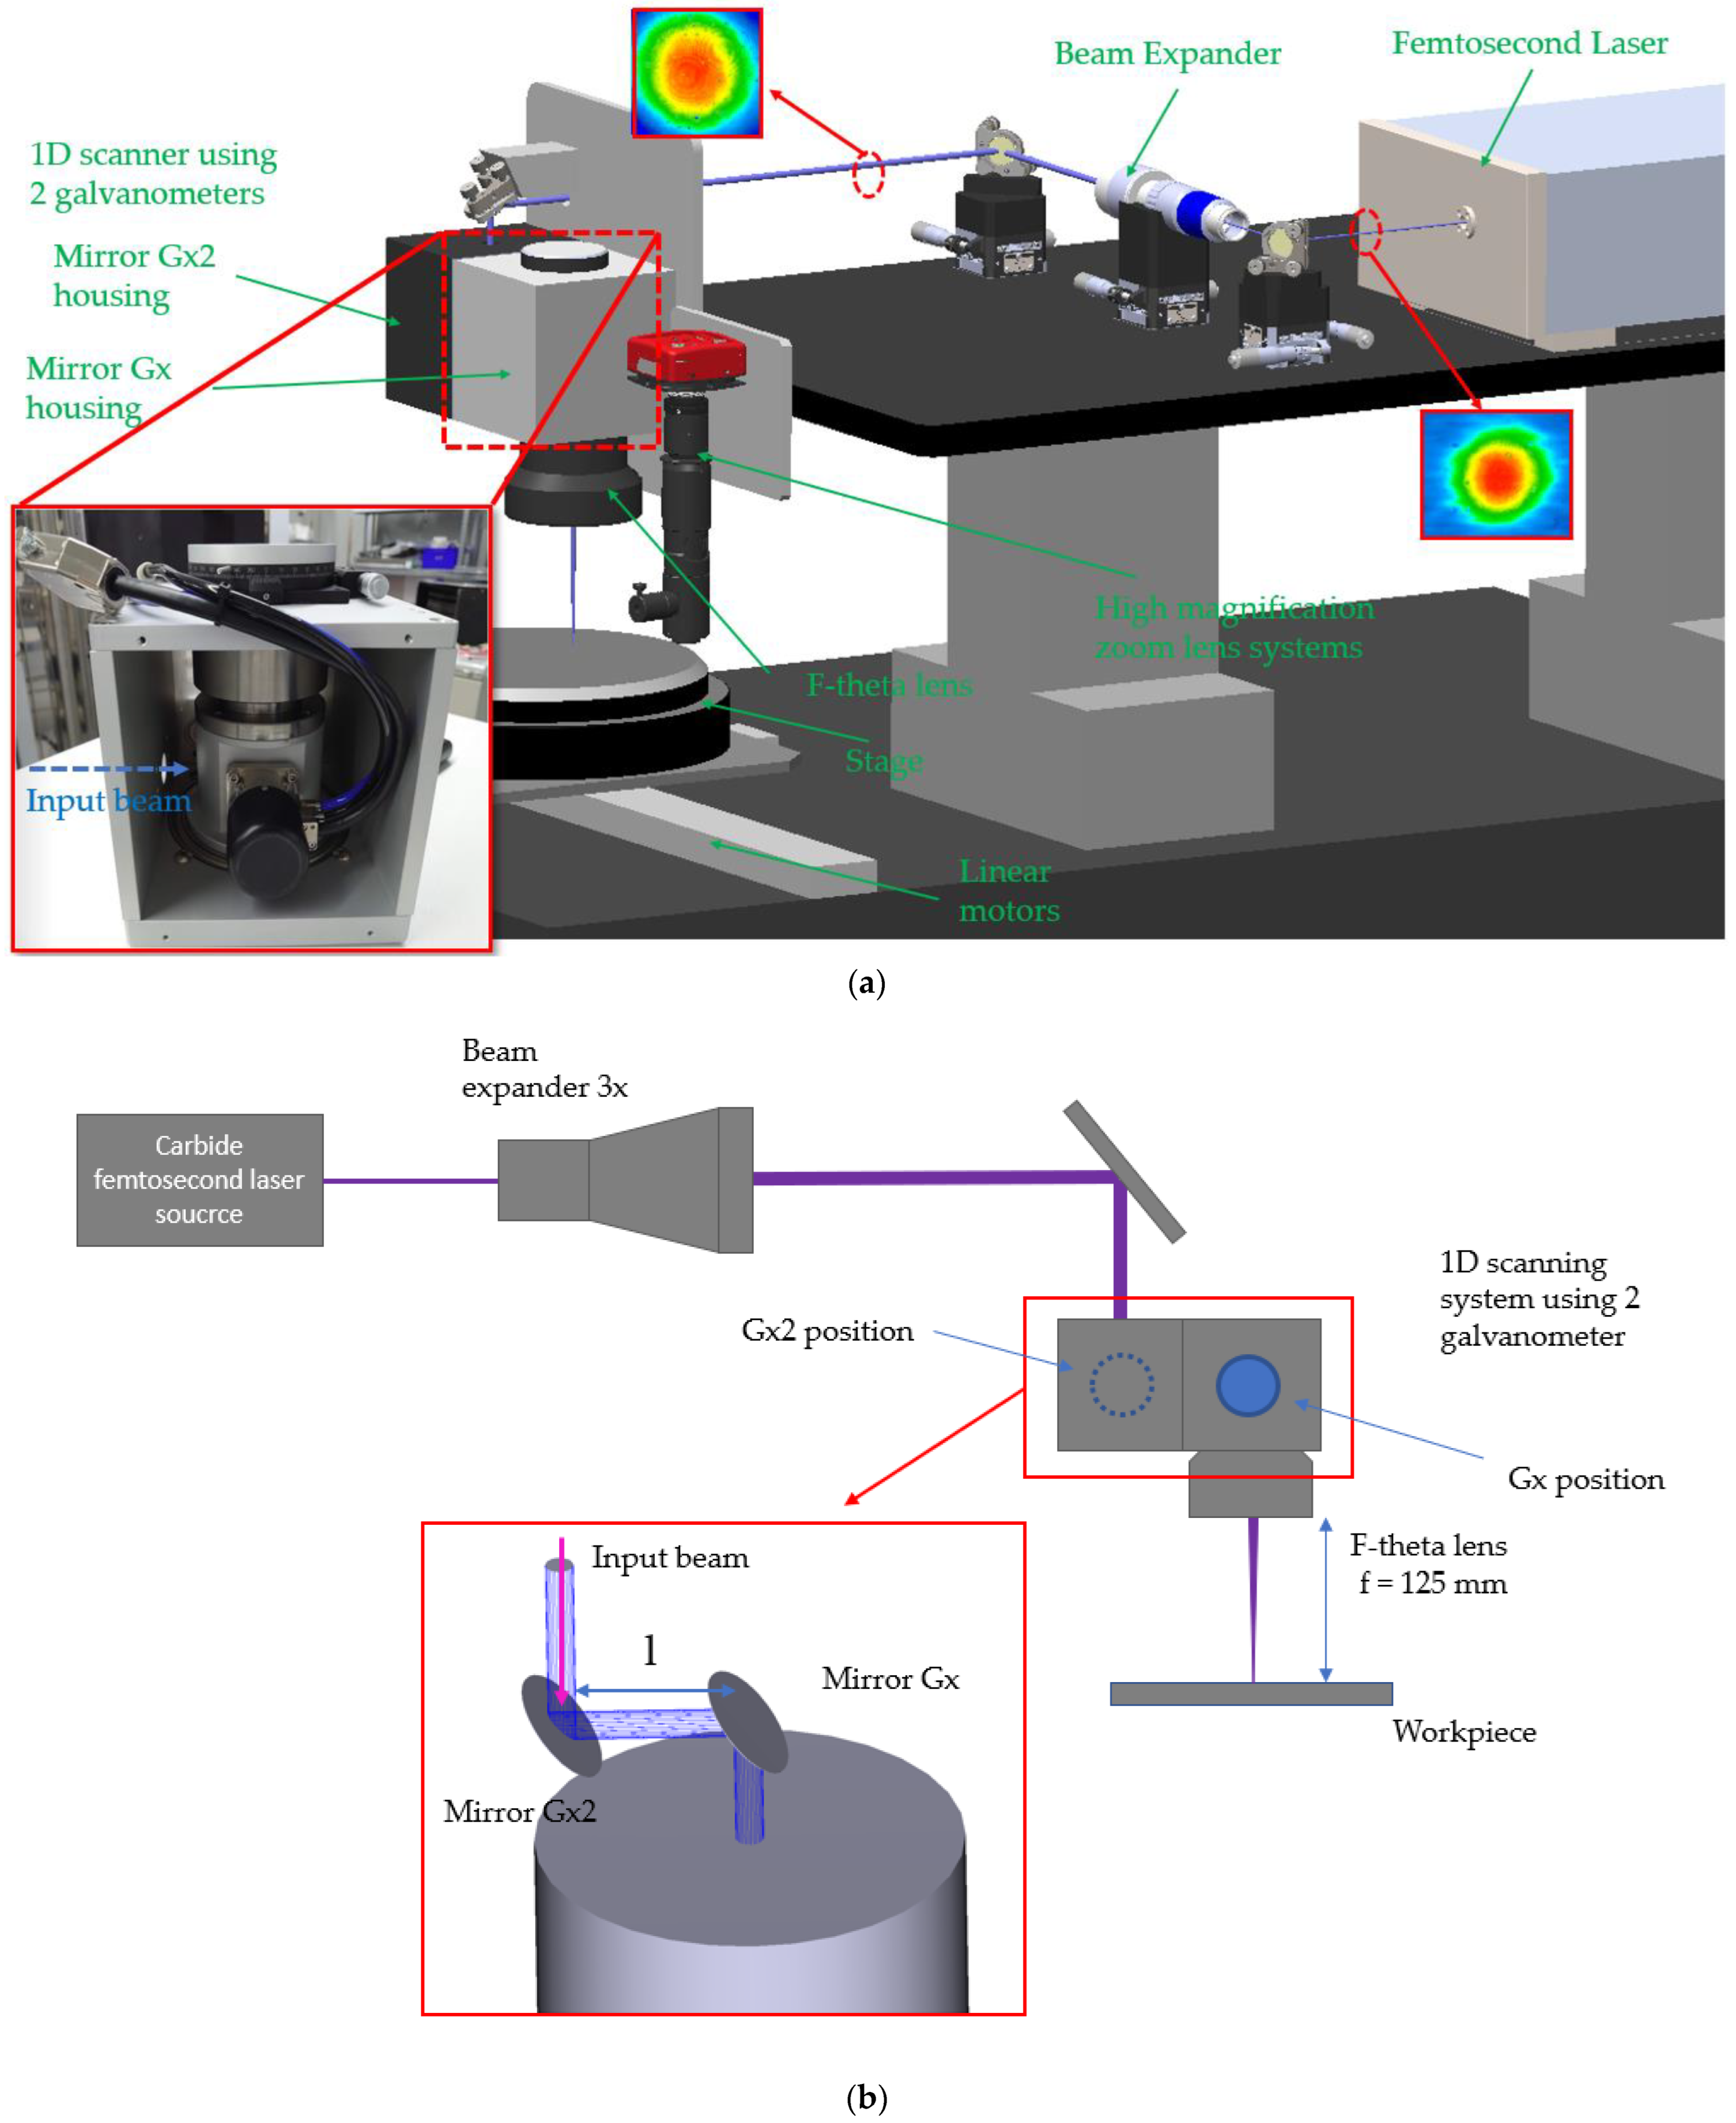
The experimental setup for the mirror-based scanning system uses two galvanometers, including a femtosecond laser source (CB3-40-0200-10-H, Light Conversion, Vilnius, Lithuania) [38], a beam expander (BEX 1x-8x, Jenoptik, Jena, Germany), and a galvanometer scanner AVG14HPO, Aerotech Inc., Pittsburgh, PA, United States). The carbide ultrafast laser we used is a femtosecond laser system with a high repetition rate based on a chirped pulse amplification technique (CPA). Its active operating environment is generated using directly diode-pumped Yb: KGW (ytterbium-doped potassium gadolinium tung-state). The laser head consists of a Kerr lens mode-locked oscillator (OSC), stretcher compressor (SC), and regenerative amplifier (RA) units. Automated harmonics modules are used to convert fundamental laser radiation to be with specific harmonics, and a third harmonic of 343 nm is selected in this study. The laser system has high beam quality, in which the roundness of the input beam laser profile is over 96%. There is also a beam quality M2 of 1.05 and a divergence angle of 0.31 mrad. Based on the concept of this approach, all laser sources could be suitably applied. Compared to the visible and infrared spectral regions, our study decided to select a UV laser because it has the smallest spot size and a higher absorption rate of materials. A UV laser could do the most multilayer structure processing without the limitation of material type. The femtosecond laser source was equipped with a third harmonic generation module emitting at a wavelength of 343 nm, with a pulse duration of 210 fs, beam quality factor M2 < 1.1, and a repetition rate of 200 kHz, to create a raw laser beam with a diameter of approximately 2.0 mm and beam ellipticity of 95.4%. A galvanometer scanner housing was designed for a 1D scanner using two galvanometers, in combination with an f-theta lens (S4LFT4125/075, Sill Optics GmbH & Co. KG, Wendelstein, Germany) with a focal length of 125 mm, which was used for deflection and the focusing of the laser beam. The scanning range of the f-theta lens is up to 2809 mm2, with a working distance of 156.905 mm. The overall optical setup is illustrated in Figure 9. The raw laser beam will be enlarged three times by a beam expander. The experimental design was conducted to compare a 2D galvanometer scanner and the optimized 1D galvanometer scanner using two galvanometers. The geometry value of via holes is collected and analyzed by VK-X200 (Keyence, Osaka, Japan) [39] in the range of ±25 mm from the center position of the workpiece.
In this study, a raw laser beam diameter of do = 2.0 mm was measured by Thorlab’s high-magnification zoom lens system. The system includes an 8-megapixel C.C.D. camera for microscopy S805MU1, 12X zoom lenses MVL12X3Z, 12X system magnifying lens attachments MVL12X20L, and extension tubes for the 12X system MVL20FA, mounted next to the galvanometer scanner. The diameter of the laser beam waist w f can be calculated [9] by
d f = 4 . λ . f . M 2 d 0 . π
where λ is the laser wavelength, f defines the focal length of the f-theta lens, d0 is the laser beam diameter on the lens (1/e2), and M2 is the beam quality of the laser. Subsequently, a diffraction-limited spot radius of d f = 10   μ m . Then, the Rayleigh length of Z f = 229   μ m can be calculated by substituting into the below Equation (6) [40]
Z f = π . d f 2 2 λ
The minimum and maximum beam diameters were collected in the workpiece’s range of ± 25 mm to ensure the f-theta lens’s safety. Laser-beam-quality conditions need to be met to evaluate the beam quality of the ablations and measure the working length. According to the ISO standards, a beam ellipticity (the ratio of d minor to d major at the z position) of more than 87% is regarded as circular. The ablation threshold for silicon was calculated for the used 210 fs laser source. Static pulse ablations with power varying from 30% to 60% are shown in Figure 10.
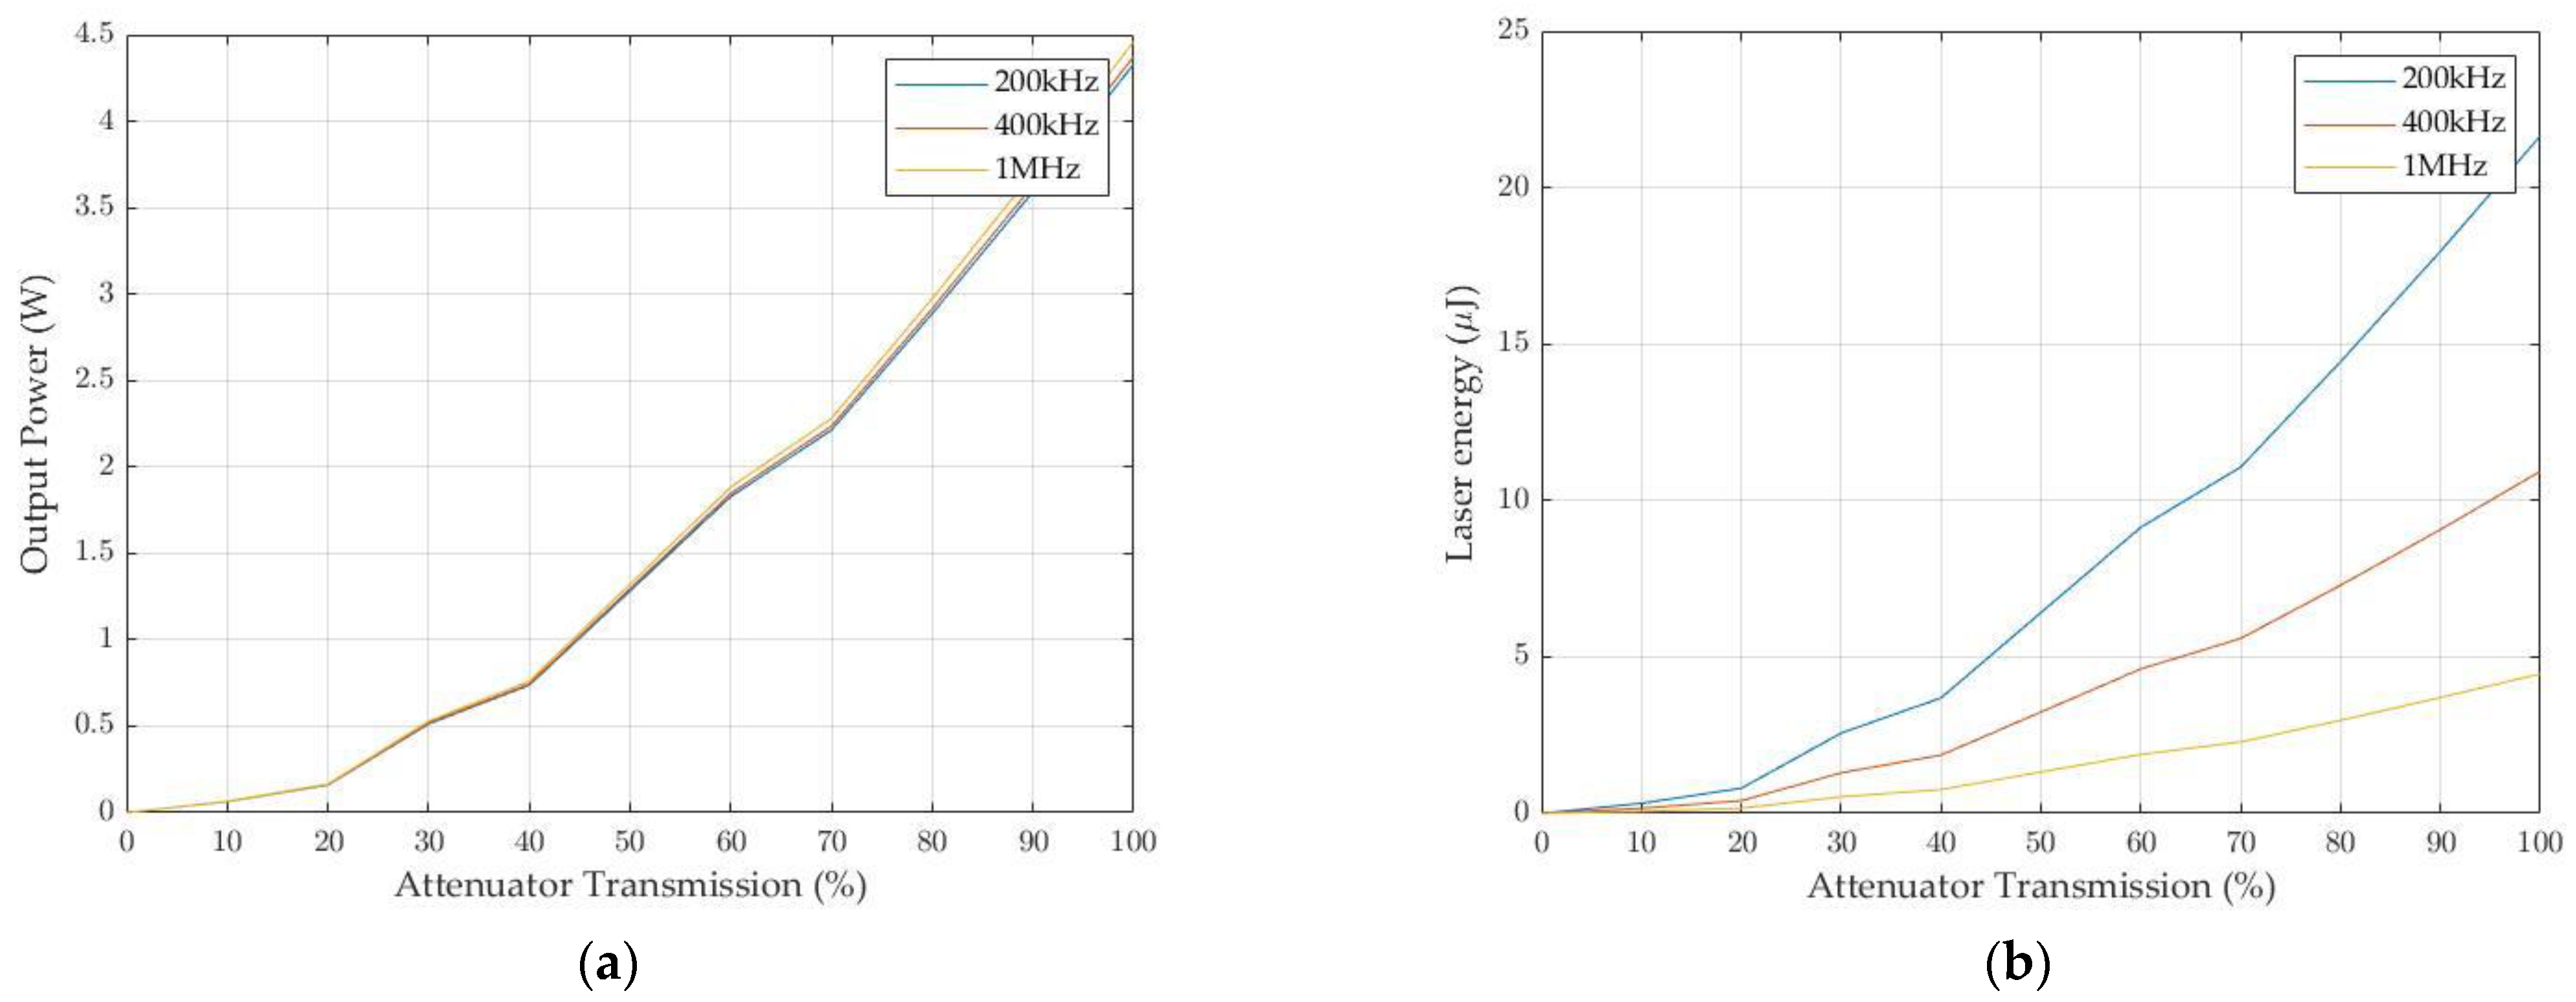
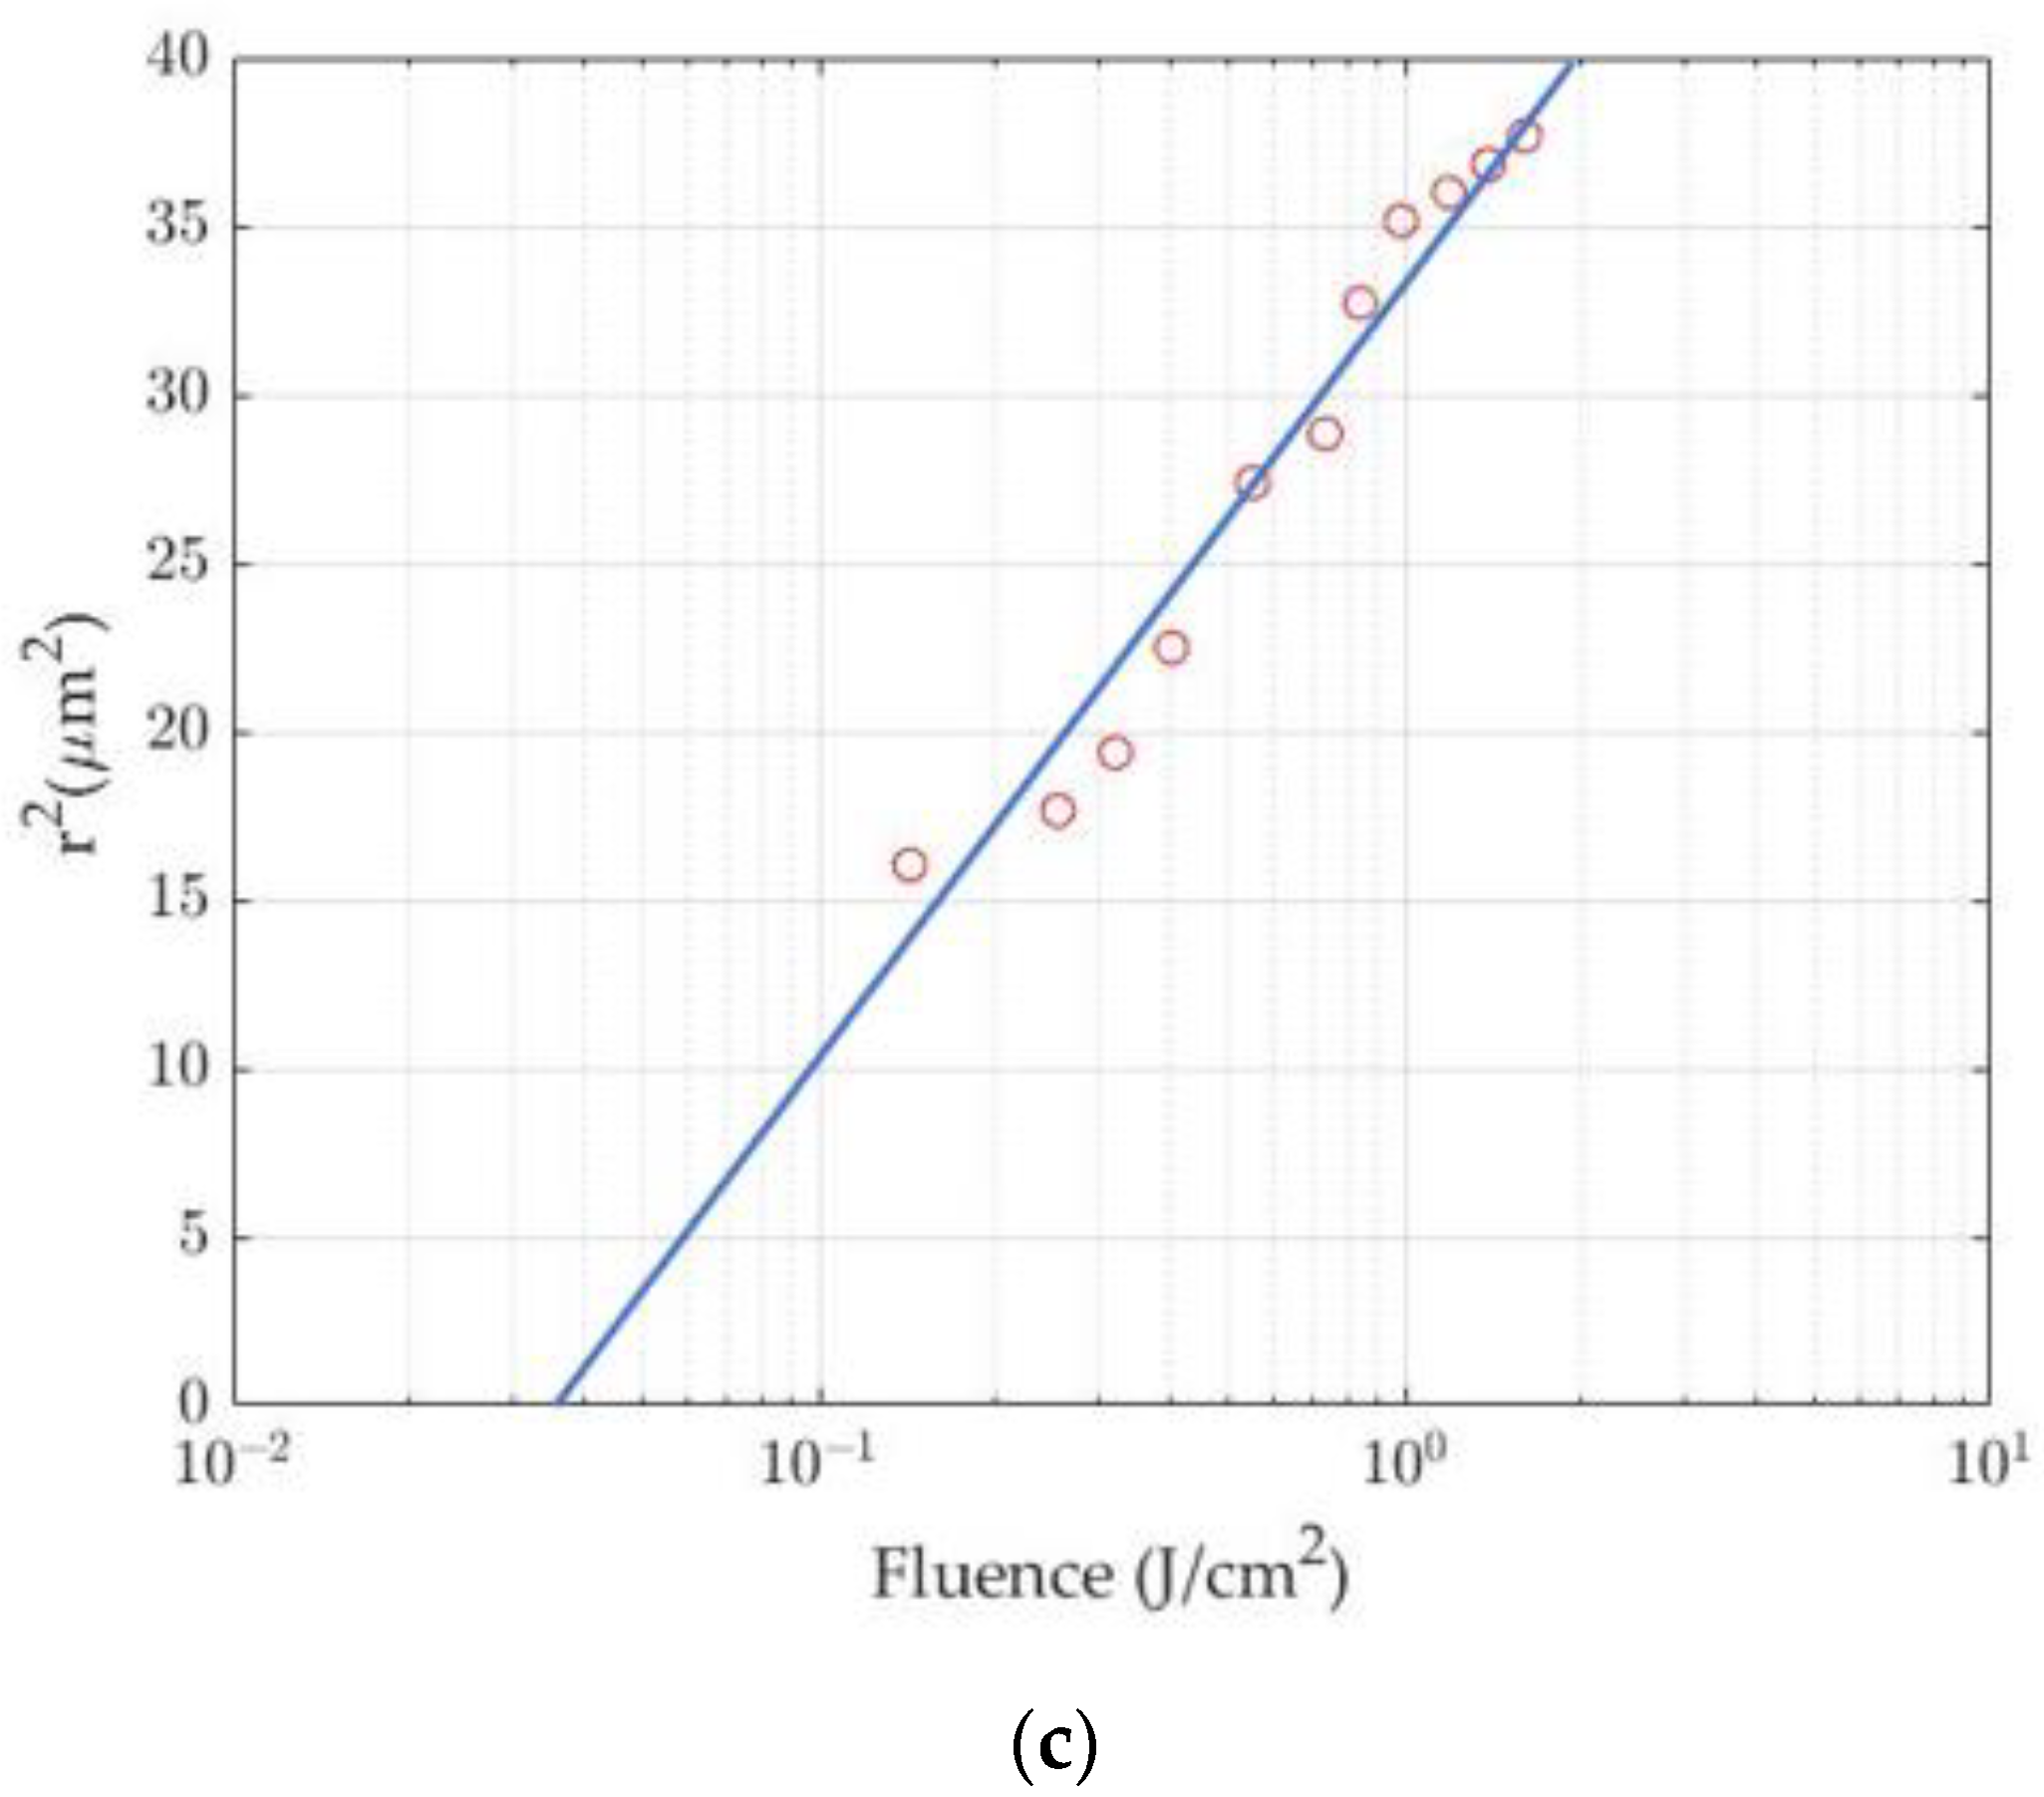
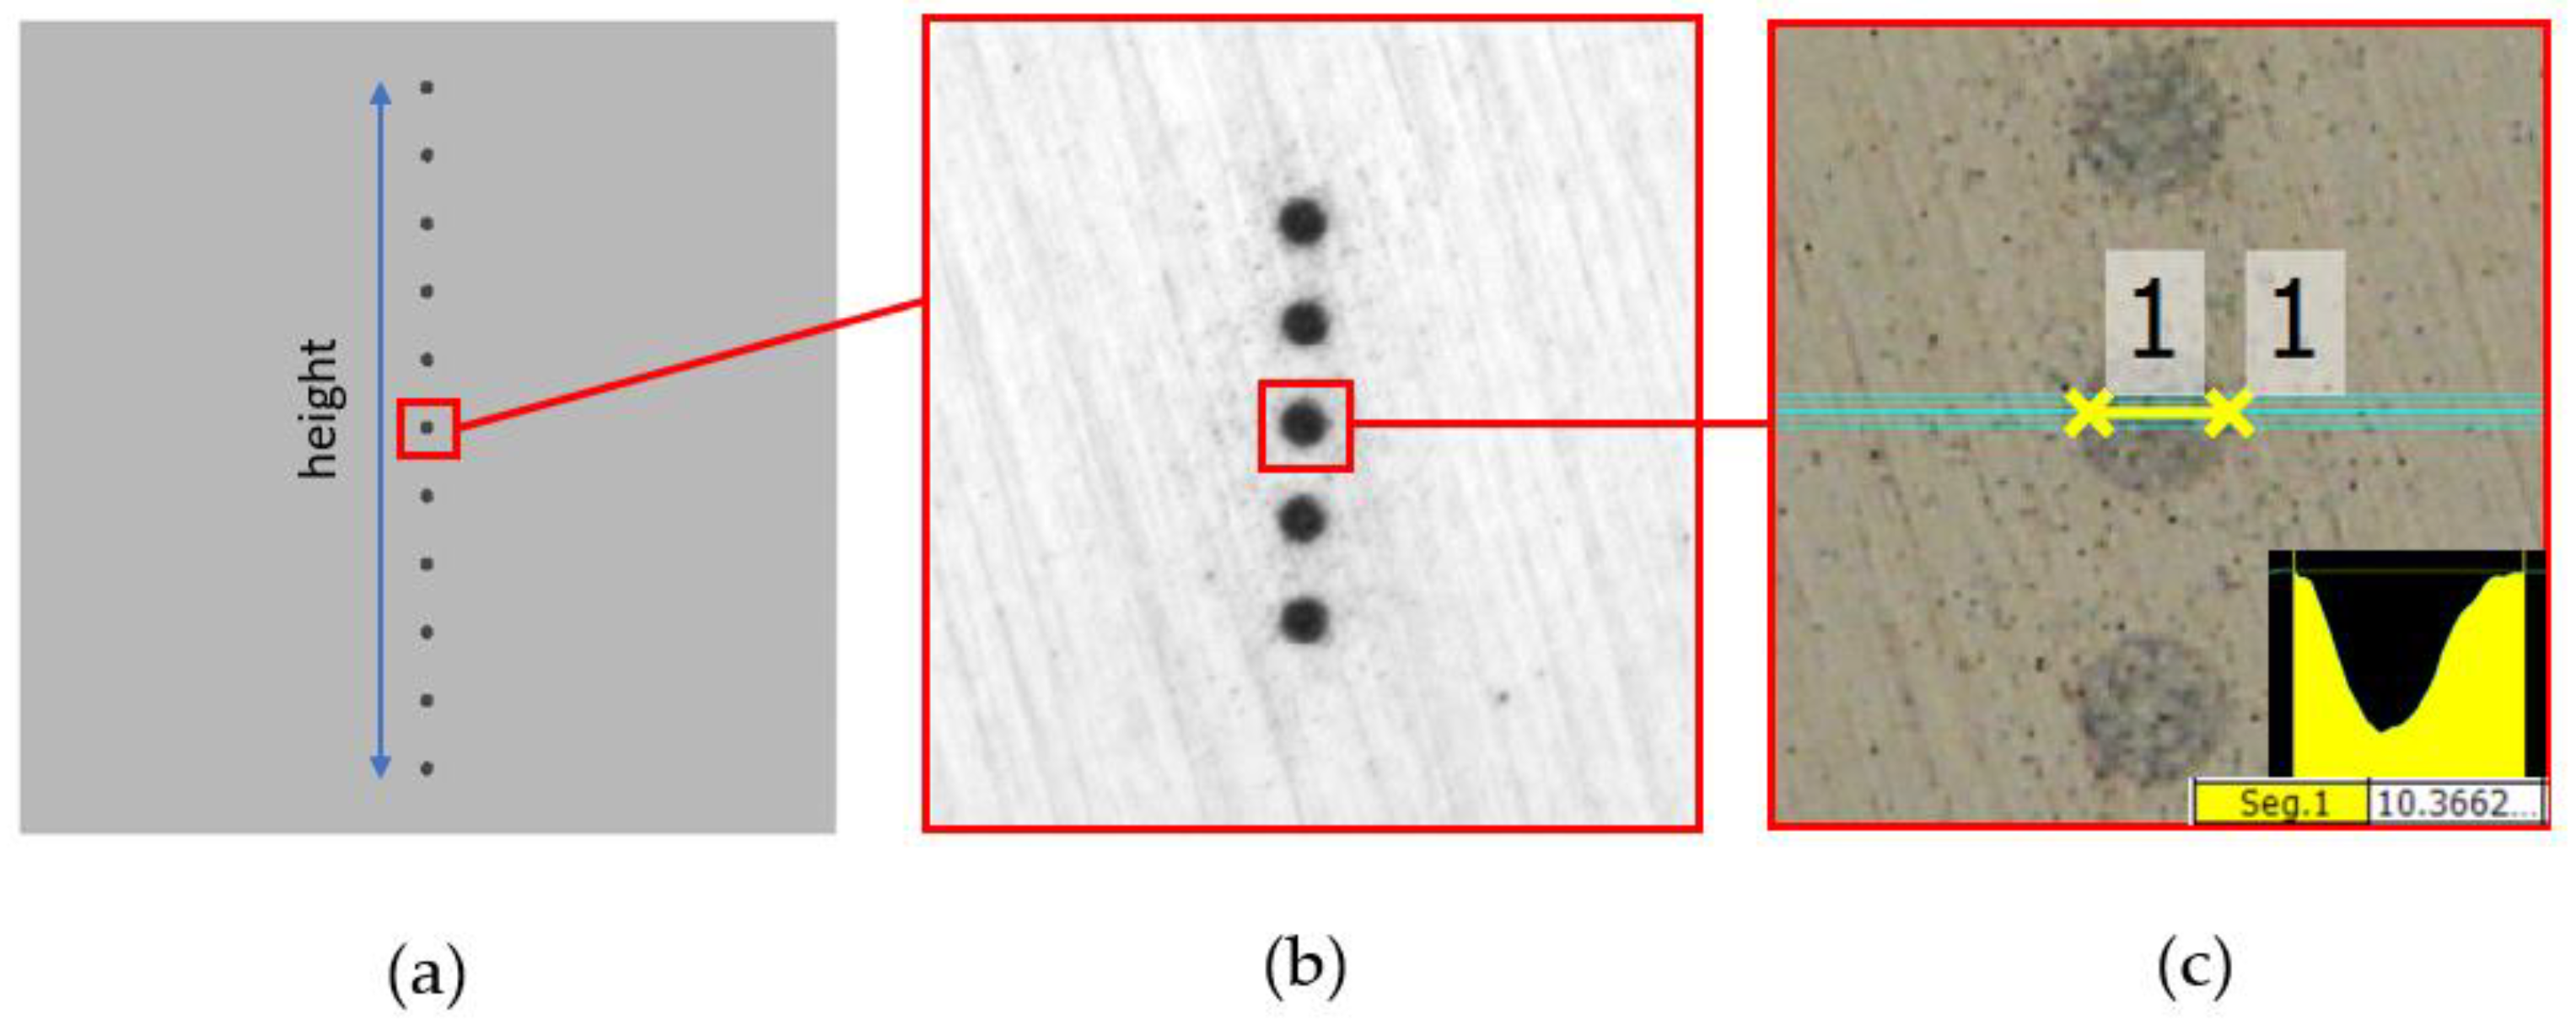
The results of laser power measurement and laser energy are shown in Figure 11a,b. The ablation fluence can be determined from 0.165 µJ/cm2 to 1.884 µJ/cm2 in the attenuator transmission range of 20% to 65%. The ablation threshold can be determined according to Liu’s method [41] because the required fluence must be higher than the ablation threshold. A plot of the Liu method for determining the ablation threshold is shown in Figure 11c. Thereby, we can see that the ablation threshold value for silicon is 0.026 µJ/cm2. From Liu’s plot and images of the ablation, 30% of the laser source power was selected for the experimental setup to compare the roundness of static pulsed ablation using the proposed 1D system with the conventional 2D system, when scanning along the Y-axis. To determine the gaussian beam intensity profile, 11 equidistant positions were selected with a pitch of 5 mm at different galvanometer deflections in a range of ±25 mm, as depicted in Figure 12a. Five holes are drilled at each position with equal spacing of 20 µm. Figure 12b shows the image captured by Thorlab’s CCD camera system with five drilled holes at the center of the silicon wafer. At the non-deflection position of the galvanometer’s deflection, an ablation with an average diameter of 10.3 µm (the mean value between the maximum and minimum diameters of the laser beam spot diameter), and an average via-hole roundness of 95.4%, can be achieved. The roundness can change due to the oscillation characteristics of the laser beam at different measurement times and by the influence of power loss over long periods of use. Figure 12c depicts the process of measuring and collecting spot sizes at different locations to calculate the roundness of the experimental setup.
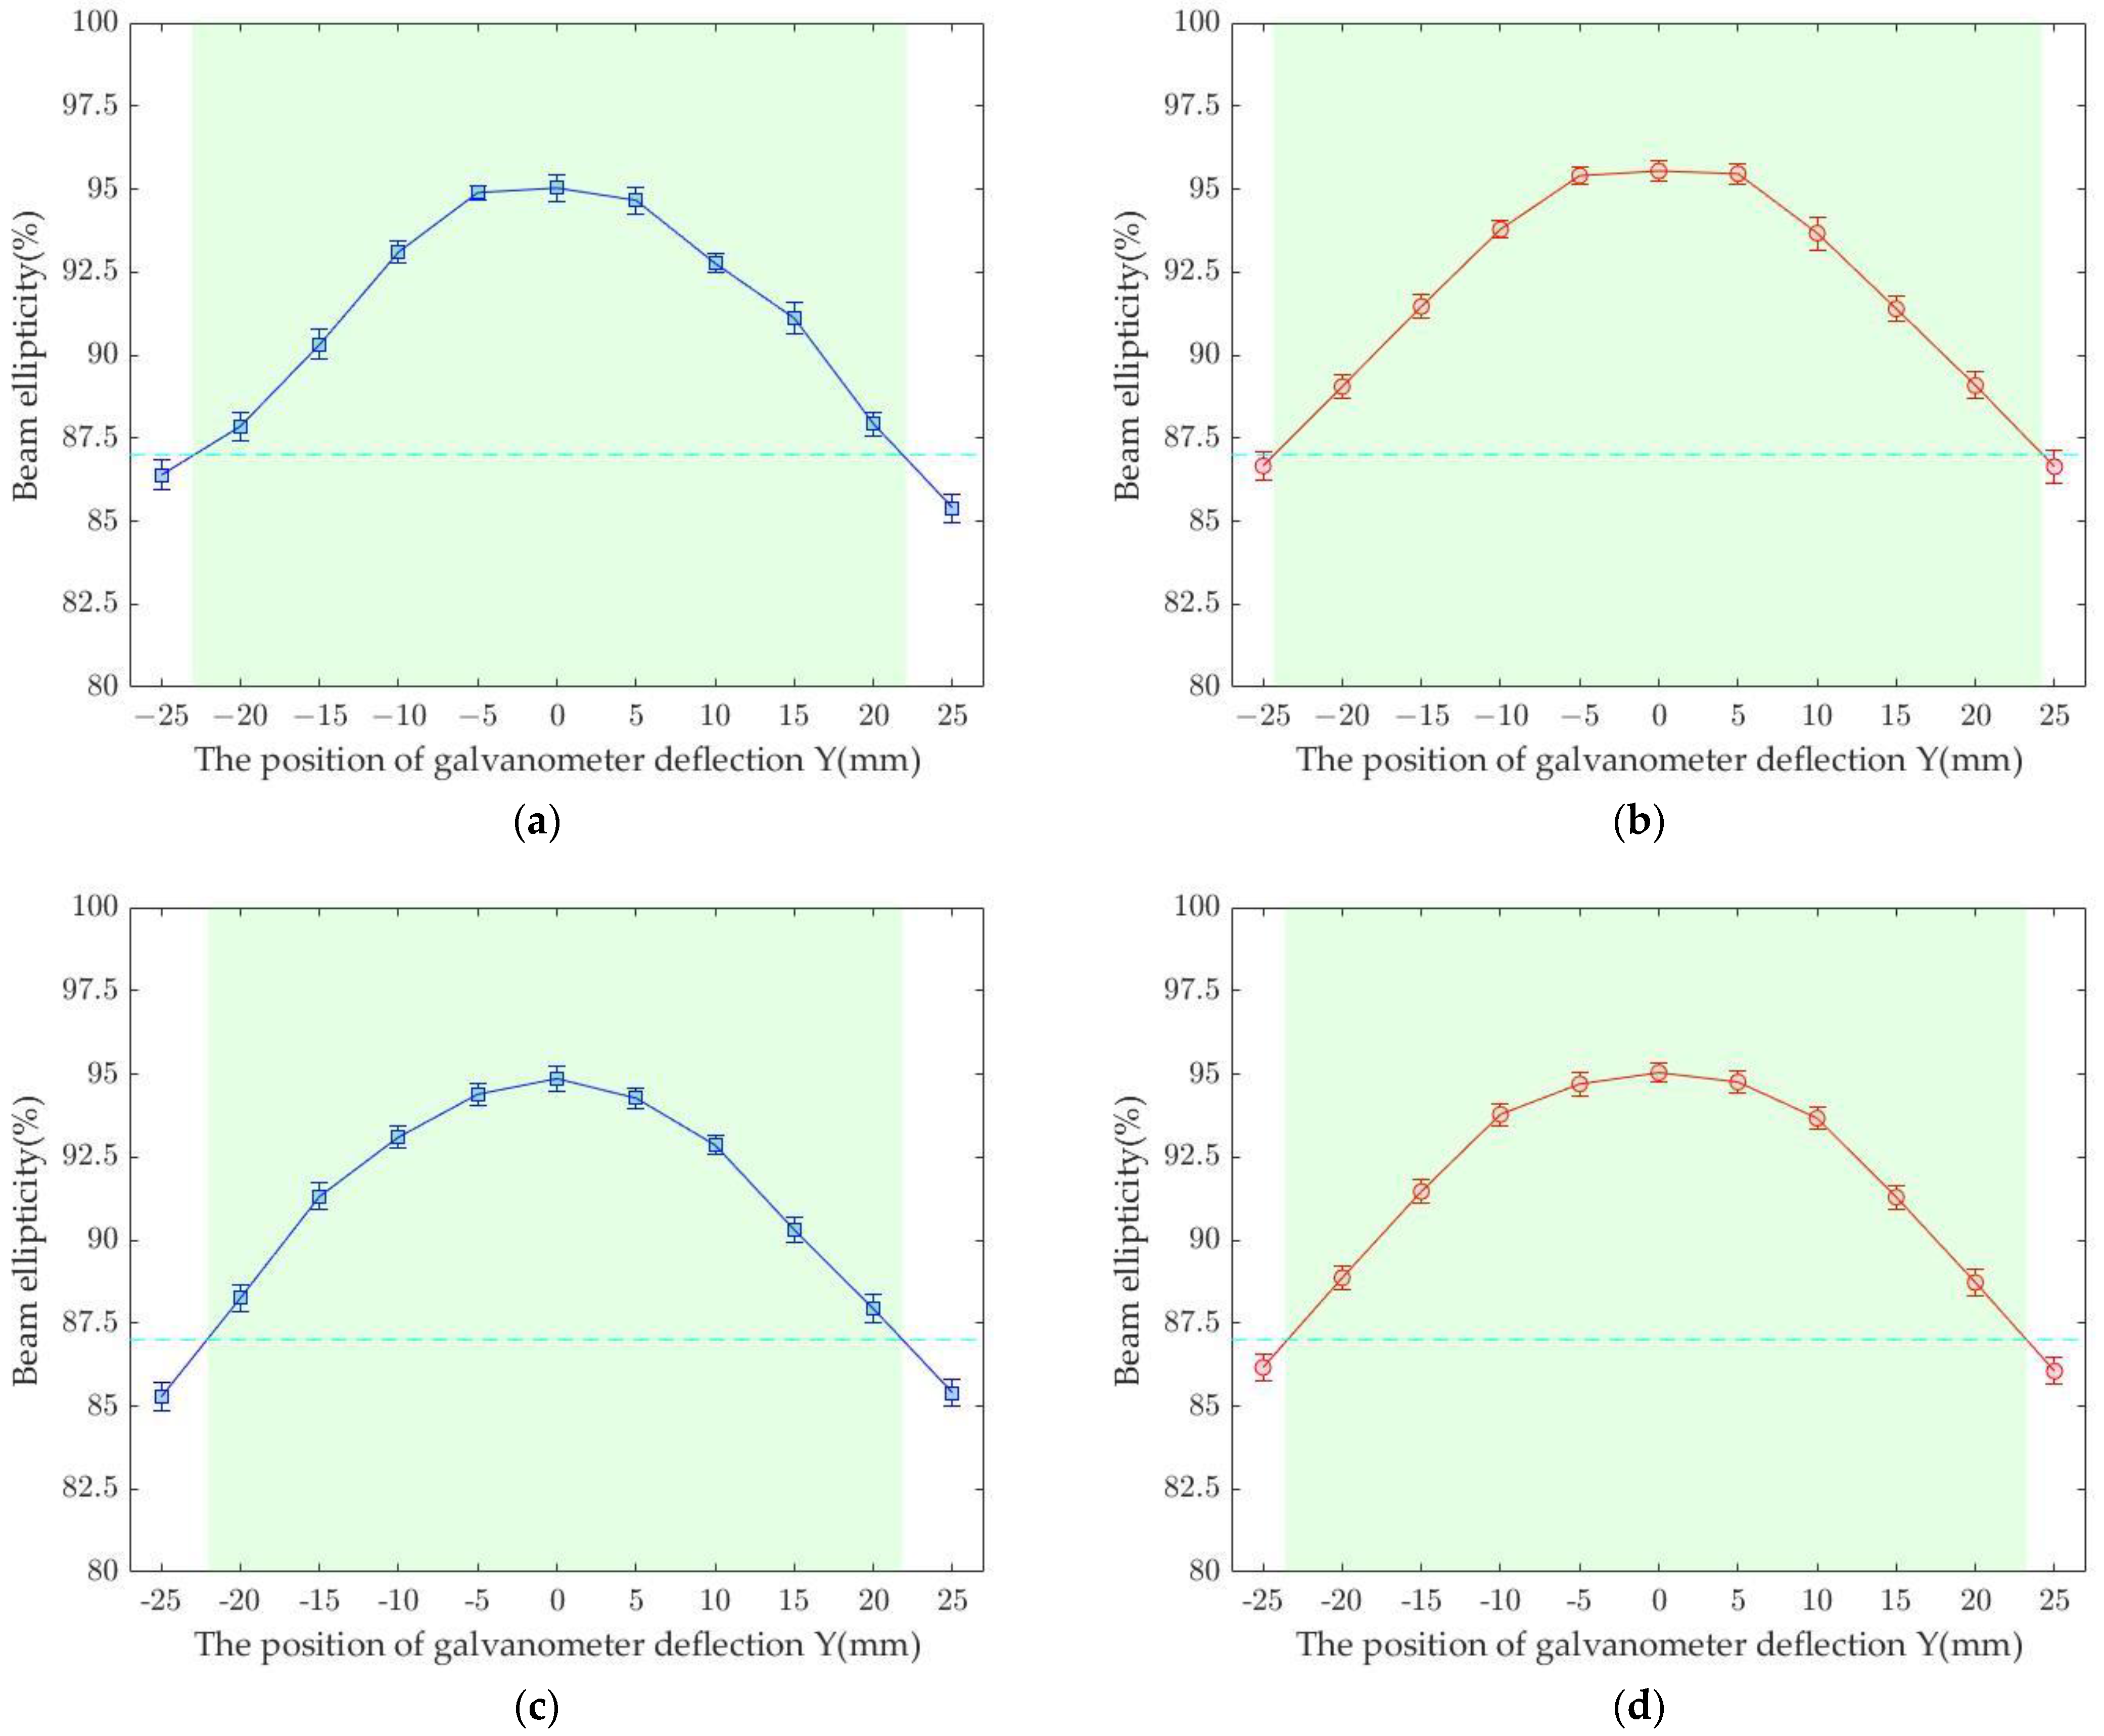
To determine the effective working length of the proposed 1D scanning system using two galvanometer scanners, compared to the conventional 2D scanning system, the roundness of the silicon ablation was determined at different galvanometer deflection positions in the focal plane of the f-theta lens. To evaluate the roundness of the spots, the ISO 11145:2018 standard, with the requirement for the roundness of the static pulse ablation with the ratio of minimum and maximum beam diameter to be greater than 87%, is used. To meet industrial standards, a roundness of micro-holes of greater than 90% was used for comparison. Their mean roundness and standard deviation are shown in Figure 13a for the conventional 2D scanning system, and Figure 13b for the proposed 1D scanning system using a galvanometer deflection in the range of ±25 mm.
At the non-galvanometer deflection, the averaged roundness of the ablation is achieved (95.03 ± 0.396)%. The average roundness of the ablation will be changed to be 95% from the original 96% after the laser beam passes through the central position of the f-theta lens, shown in Figure 13. The average roundness of the ablations decreased by 0.254%, 2.099%, 4.319%, and 7.139%, corresponding to the distances of −5/5 mm, −10/10 mm, −15/15 mm, and −20/20 mm. The average roundness of the ablations decreased at the galvanometer deflections that are far away from the center position. At a position with a distance of more than 20 mm from the center position, the roundness of the static pulsed ablations does not meet the ISO standard. This effect can be attributed to insufficient centric and parallel propagation of the laser beam through the f-theta lens. A working length to meet ISO standards can be determined based on the limited portion of the intersection of the solid blue line and the dashed cyan line, highlighted by the transparent green area on the graph. The roundness of the ablation is greater than 87% to meet the ISO standard. It is then easy to determine the working lengths extending from −22.86 to 21.85 mm.
The total length for laser material processing that can meet the standard is 44.71 mm, which corresponds to 59.61% of the effective scanning length of the f-theta lens. An overview of the analysis results of the roundness of the resection when using 1D with two galvanometer scanners shows symmetry. The spot size change has a minor fluctuation compared to the conventional 2D scanning system. In the range of ±5 mm, the roundness of the ablation is above 95% with a slight circularity deviation. This is because the telecentricity compensation helps to minimize aberration near the center of the lens, which corresponds to 13.3% of the scan length of the F-theta. The roundness of the ablations at the center position reached 95.4%. At positions away from the center of the workpiece, these values decrease with an average beam spot roundness of 0.112%, 1.813%, 4.114%, and 6.475%, corresponding to the distances of −5/5 mm, −10/10 mm, −15/15 mm, and −20/20 mm. Thus, a 1D scanning system using two galvanometer scanners can add an average of 3.6 mm, equivalent to 8.1% of the working length, to meet ISO standards. The total length achieved for the ISO compliance of a 1D scanning system using two galvanometers is 48.3 mm. The similarity between the extended working length of the simulation and the experiments was 87%. This can be explained in the following ways: differences in f-theta lens design and real lenses, laser beam profile, and measurement inaccuracies. For Figure 13c,d, the results measured with a laser power of the attenuator transmission of 55% also show an increase in the effective working length when using the proposed scanning system. The laser power is limited to the appearance of the thermal effect acting on the surrounding area of the micro-hole. Through comparison, we see that after increasing the power, the field of view is reduced to 7.8% compared to the micro-holes ablated with 30% of the power of the laser source. From the results, it can be seen that the use of a 1D scanning system with two galvanometers has shown an increase in the effective scan length, improved beam spot at the work plane, and increased telecentricity. Through the results and based on the studies of other researchers [24,29], we have also reached further conclusions that the ability to extend the effective scan length is also attributed to the structure of the f-theta lens. With this approach, when the laser beam hits the pivot point on mirror one, and because mirror two is deflected by a suitable angle, the beam leaving the f-theta lens will be perpendicular to the workpiece plane, which keeps the laser beam more circular in the scan area of the f-theta lens [20]. In other words, for an f-theta lens design, the lower the telecentricity, the more uniform the laser spot size will be. In our experimental setup, the f-theta lens had a large scanning area of 53 × 53 mm2, with telecentricity = 1.1 degrees, as claimed by the manufacturer using the UV wavelength. Experimental results show an increase in working length of 8.1%.
The evaluation results of the methods using the additional optical components are compared with each other, as shown in Table 2. A commercial scanning system incorporating an f-theta lens with a field of view of 170 × 170 mm2, with telecentricity = 12.7 degrees, showed an increase in effective working length of 63 mm at UV wavelength [29]. Another experimental setup’s results used a scan lens with a working area of 10 × 10 mm2 and telecentricity = 11.5 degrees for an increased working length of 200 µm [27]. A similar method, using an AOD as an added optical element, shows an increase in accuracy and improves the roundness of microholes to industry standard, with an f-theta lens with a focal length of 100 mm, a scan area of 35 × 35 mm2 and telecentricity = 1.5 degrees [24] at visible wavelength. In our study, the f-theta lens, with the advantage of an extensive scanning area and small telecentricity, showed an improvement in effective working length.

4. Conclusions

In this study, a single-axis scanning system using two galvanometers was proposed to mitigate telecentricity, improving the beam quality of the laser material processing system, as well as increasing the effective working area for the system in combination with moving the stage. The research process included designing the f-theta lens, simulating the scanning system combined with the designed f-theta lens, and conducting the experimental setup. The results of the simulation and experimental setup compared the conventional 2D scanning system and the 1D scanning system using two galvanometers when scanning along Y-axis. The results show that the proposed 1D scanning system using two galvanometers can increase the working length up to 3.6 mm in practice, representing 8.1% of the effective field of view of the f-theta lens, with the roundness of the laser-induced ablation over 87%, which meets ISO standard 11145:2018. The total length achieved for ISO compliance in a 1D scanning system using two galvanometers is 48.3 mm, which corresponds to 64.4% of the scan length of the f-theta lens. A combination of AOD and 1D scanning systems using two galvanometers is a promising research topic to improve beam ellipticity and expand the effective scan length of the f-theta lens for laser-based micromachining in the future.

Author Contributions

X.-H.N. carried out the simulation and wrote the manuscript; C.-M.C. implemented the experiments and investigation; H.-T.L. fabricated the single scanner housing and installed the experimental setup; H.-Y.L. conceived the original idea, supervised the project, edited and reviewed the manuscript. All authors have read and agreed to the published version of the manuscript.

Funding

This work was supported by National Kaohsiung University of Science and Technology (Grant No.: 1119010BA02).

Institutional Review Board Statement

Not applicable.

Informed Consent Statement

Not applicable.

Data Availability Statement

The data presented in this study are available on request from the corresponding author.

Conflicts of Interest

The authors declare no conflict of interest.

References

  1. Lopez, J.; Mishchik, K.; Mincuzzi, G.; Audouard, E.; Mottay, E.; Kling, R. Efficient metal processing using high average power ultrafast laser. J. Laser Micro/Nanoeng. 2017, 12, 296–303. [Google Scholar]
  2. Loeschner, U.; Schille, J.; Streek, A.; Knebel, T.; Hartwig, L.; Hillmann, R.; Endisch, C. High-Rate Laser Microprocessing Using a Polygon Scanner System. J. Laser Appl. 2015, 27, S29303. [Google Scholar] [CrossRef]
  3. Römer, G.R.B.E.; Bechtold, P. Electro-Optic and Acousto-Optic Laser Beam Scanners. Phys. Proc. 2014, 56, 29–39. [Google Scholar] [CrossRef] [Green Version]
  4. Marshall, G.F.; Stutz, G.E. Handbook of Optical and Laser Scanning, 2nd ed.; CRC Press: New York, NY, USA, 2004; pp. 394–439. Available online: https://library.oapen.org/handle/20.500.12657/41669 (accessed on 10 September 2022).
  5. Montagu, J.; Hoffman, C.; Driggers, R. Scanners—Galvanometric and resonant. In Encyclopedia of Optical Engineering, 2nd ed.; CRC Press: Boca Raton, FL, USA, 2015; pp. 2460–2489. [Google Scholar]
  6. Büsing, L. Optische Systeme Für Die Hochpräzise, Scanner Basierte Multistrahlbearbeitung Mit Ultrakurzen Laserpulsen. Ph.D. Thesis, RWTH Aachen, Aachen, Germany, 2016. Available online: https://publications.rwth-aachen.de/record/572320 (accessed on 31 May 2022).
  7. Periyasamy, K.G.K.; Zuo, H.; He, S. Flexible Printed Circuit Board Magnetic Micromirror for Laser Marking/Engraving. J. Micromech. Microeng. 2019, 29, 085001. [Google Scholar] [CrossRef]
  8. Zheng, L.J.; Wang, C.Y.; Song, Y.X.; Yang, L.P.; Qu, Y.P.; Ma, P.; Fu, L.Y. A Review on Drilling Printed Circuit Boards. Adv. Mater. Res. 2011, 188, 441–449. [Google Scholar] [CrossRef]
  9. Franz, D.; Häfner, T.; Kunz, T.; Roth, G.-L.; Rung, S.; Esen, C.; Hellmann, R. Ultrashort Pulsed Laser Drilling of Printed Circuit Board Materials. Materials 2022, 15, 3932. [Google Scholar] [CrossRef]
  10. van Breemen, A.J.J.M.; Ollearo, R.; Shanmugam, S.; Peeters, B.; Peters, L.C.J.M.; van de Ketterij, R.L.; Katsouras, I.; Akkerman, H.B.; Frijters, C.H.; Giacomo, F.D.; et al. A Thin and Flexible Scanner for Fingerprints and Documents Based on Metal Halide Perovskites. Nat. Electron. 2021, 4, 818–826. [Google Scholar] [CrossRef]
  11. Takamatsu, T.; Fujita, S. Microscopic Tomography by Laser Scanning Microscopy and Its Three-dimensional Reconstruction. J. Microsc. 1988, 149, 167–174. [Google Scholar] [CrossRef]
  12. Webb, R.H. Confocal Optical Microscopy. Rep. Prog. Phys. 1996, 59, 427. [Google Scholar] [CrossRef]
  13. Mertz, J. Nonlinear Microscopy: New Techniques and Applications. Curr. Opin. Neurobiol. 2004, 14, 610–616. [Google Scholar] [CrossRef]
  14. Choi, W.; Fang-Yen, C.; Oh, S.; Lue, N.; Dasari, R.R.; Feld, M.S.; Badizadegan, K. Tomographic Phase Microscopy. Imaging Microsc. 2008, 10, 48–50. [Google Scholar] [CrossRef]
  15. Gafner, M.; Remund, S.M.; Chaja, M.W.; Neuenschwander, B. High-Rate Laser Processing with Ultrashort Laser Pulses by Combination of Diffractive Elements with Synchronized Galvo Scanning. Adv. Opt. Technol. 2021, 10, 333–352. [Google Scholar] [CrossRef]
  16. Finger, J.; Hesker, M. High Power Ultrashort Pulse Laser Processing Using a Flexible Multibeam Approach. J. Phys. Photonics 2021, 3, 021004. [Google Scholar] [CrossRef]
  17. Cui, M.; Lu, L.; Zhang, Z.; Guan, Y. A Laser Scanner–Stage Synchronized System Supporting the Large-Area Precision Polishing of Additive-Manufactured Metallic Surfaces. Engineering 2021, 7, 1732–1740. [Google Scholar] [CrossRef]
  18. Belosludtsev, A.; Buinovskis, D. Significant Increase of U.V. Reflectivity of SiC Galvanometer Mirror Scanners for the High-Power Laser Applications. Opt. Laser Technol. 2021, 140, 107027. [Google Scholar] [CrossRef]
  19. 2-Axis Galvo Scanner Hardware Manual, Aerotech; 2015–2021. Available online: https://www.aerotech.com/resources-manuals-help-files/ (accessed on 29 July 2022).
  20. Ozga, C. Unseen Possibilities of F-Theta Lenses. Opt. Photonik 2018, 13, 48–51. [Google Scholar] [CrossRef] [Green Version]
  21. Meng, X.; Cao, G.; Li, X.; Lv, Q. 2-D Scanning Galvanometer Error Analysis and Its Correction. J. Phys. Conf. Ser. 2019, 1345, 022068. [Google Scholar] [CrossRef]
  22. Qi, B.-L.; Wang, C.-H.; Guo, D.-B.; Zhang, B. A Scanning Distortion Correction Method Based on X–Y Galvanometer Lidar System. Chin. Phys. B 2021, 30, 044206. [Google Scholar] [CrossRef]
  23. Li, Y.; Cui, T.; Li, Q.; Zhang, B.; Bai, Y.; Wang, C. A Study of Correction Method to the Pincushion Distortion Based on Dual Galvanometer LiDAR Scanning System. Optik 2019, 181, 555–561. [Google Scholar] [CrossRef]
  24. Franz, D.; Häfner, T.; Kunz, T.; Roth, G.-L.; Rung, S.; Esen, C.; Hellmann, R. Characterization of a Hybrid Scanning System Comprising Acousto-Optical Deflectors and Galvanometer Scanners. Appl. Phys. B 2022, 128, 55. [Google Scholar] [CrossRef]
  25. Delgado, M.A.O.; Lasagni, A.F. Reducing Field Distortion for Galvanometer Scanning System Using a Vision System. Opt. Laser Eng. 2016, 86, 106–114. [Google Scholar] [CrossRef]
  26. Zhong, Y.; Tang, Z.; Gross, H. Correction of 2D-Telecentric Scan Systems with Freeform Surfaces. Opt. Express 2020, 28, 3041. [Google Scholar] [CrossRef] [PubMed]
  27. Pisanello, M.; Zheng, D.; Balena, A.; Pisano, F.; Vittorio, M.D.; Pisanello, F. An Open Source Three-Mirror Laser Scanning Holographic Two-Photon Lithography System. PLoS ONE 2022, 17, e0265678. [Google Scholar] [CrossRef] [PubMed]
  28. Sofroniew, N.J.; Flickinger, D.; King, J.; Svoboda, K. A Large Field of View Two-Photon Mesoscope with Subcellular Resolution for in Vivo Imaging. Elife 2016, 5, e14472. [Google Scholar] [CrossRef] [PubMed]
  29. Single Pivot Point Laser Scan Heads Product Manual, Aerotech; 2019–2021. Z.E.M.A.X. Development Corporation. Available online: https://www.aerotech.com/product/laser-scan-heads/agv-spo-high-performance-single-pivot-point-laser-scan-heads/ (accessed on 28 September 2022).
  30. ISO 11145:2018; Optics and Photonics—Lasers and Laser-Related Equipment—Vocabulary and Symbols. ISO: Geneva, Switzerland, 2018. Available online: https://www.iso.org/standard/72944.html (accessed on 13 January 2022).
  31. Kim, K.-R.; Cho, J.-H.; Lee, N.-Y.; Kim, H.-J.; Cho, S.-H.; Park, H.-J.; Choi, B. High-Precision and Ultrafast UV Laser System for next-Generation Flexible P.C.B. Drilling. J. Manuf. Syst. 2016, 38, 107–113. [Google Scholar] [CrossRef]
  32. Zemax. Optical Design Program User’s Guide; Zemax: Kirkland, WA, USA, 2014. [Google Scholar]
  33. Hofmann, O.; Stollenwerk, J.; Loosen, P. Design of Multi-Beam Optics for High Throughput Parallel Processing. J Laser Appl 2020, 32, 012005. [Google Scholar] [CrossRef] [Green Version]
  34. Ehrmann, J.S. Optics for vector scanning. Proc. SPIE 1991, 1454, 245–256. [Google Scholar]
  35. Verboven, P.E. Distortion Correction Formulas for Pre-Objective Dual Galvanometer Laser Scanning. Appl. Opt. 1988, 27, 4172. [Google Scholar] [CrossRef]
  36. Fused Silica Optics F-Theta lens S4LFT4125/075, Datasheet, Sill Optics. 2022. Available online: https://www.silloptics.de/service/downloads (accessed on 29 July 2022).
  37. Fischer, R.E.; Galeb, B.T.; Yoder, P.R. Optical System Design, 2nd ed.; SPIE Press: New York, NY, USA, 2008; pp. 199–212. Available online: https://www.accessengineeringlibrary.com/content/book/9780071472487 (accessed on 31 May 2022).
  38. Carbide Femtosecond Laser, Datasheet, Light Conversion. 2022. Available online: https://lightcon.com/product/carbide-femtosecond-lasers/#downloads (accessed on 1 August 2022).
  39. Profile-Analyzing Laser Microscope VKX-200, Manual, Keyence. 2022. Available online: https://www.keyence.com.tw/products/microscope/laser-microscope/vk-x100_x200/index_pr.jsp (accessed on 1 August 2022).
  40. Poder, K.; Cole, J.M.; Wood, J.C.; Lopes, N.C.; Alatabi, S.; Foster, P.S.; Kamperidis, C.; Kononenko, O.; Palmer, C.A.; Rusby, D.; et al. Measurements of Self-Guiding of Ultrashort Laser Pulses over Long Distances. Plasma Phys. Control. Fusion 2017, 60, 014022. [Google Scholar] [CrossRef] [Green Version]
  41. Liu, J.M. Simple technique for measurements of pulsed Gaussian-beam spot sizes. Opt. Lett. 1982, 7, 196–198. [Google Scholar] [CrossRef]
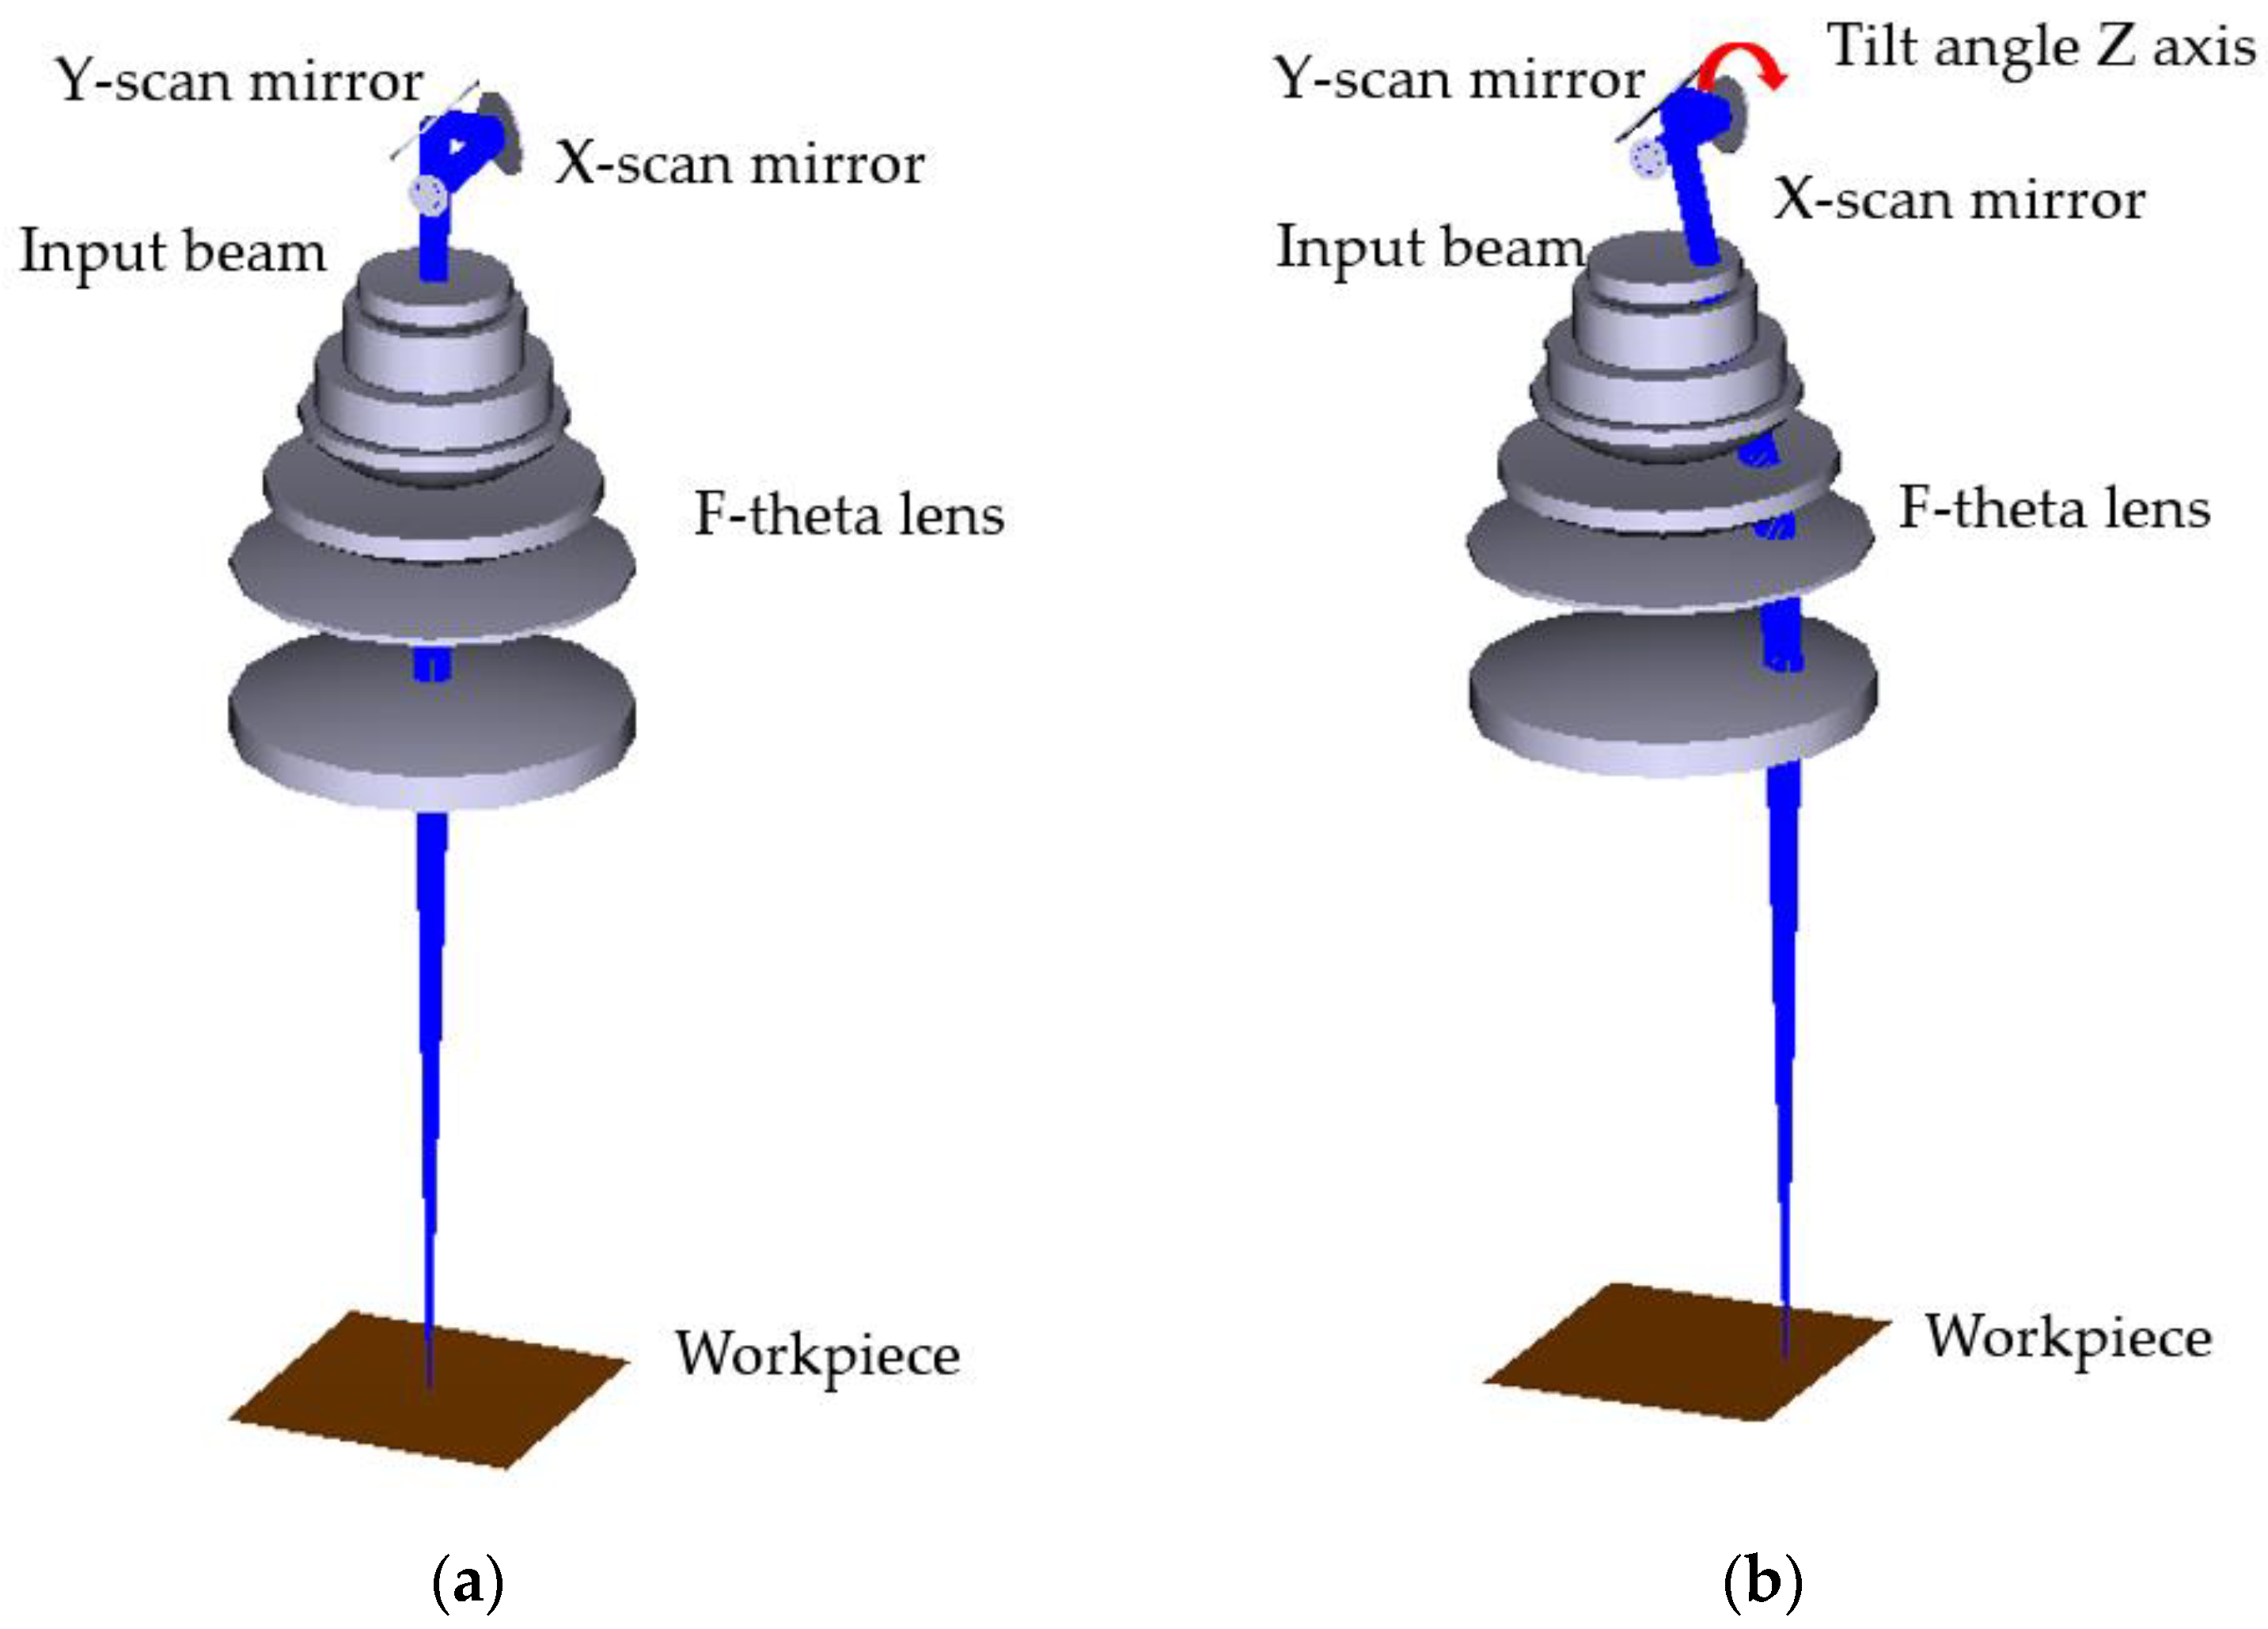
Figure 1. The simulated image of (a) an ideal 2D scanning system and (b) a commercial 2D scanning system with an X-scan mirror tilted to the Z axis at an angle of 15 degrees with the deflection of beam position.
Applsci 12 12434 g001
Figure 2. Telecentricities at different positions on the X and Y axis with a scan area of 25 × 25 mm2 of the workpiece.
Applsci 12 12434 g002
Figure 3. Illustration of the working principle of a 1D scanning system using two mirrors (a) before and (b) after telecentricity compensation with mirror Gx2 in orange, simulated by Zemax.
Applsci 12 12434 g003
Figure 4. The workflow of simulating a single-axis scanner using two galvanometers in combination with the f-theta lens in simulation and experimental setup.
Applsci 12 12434 g004
Figure 5. The structure diagram of an f-theta lens designed by ZEMAX, 0° in blue, 5° in green, 10° in red, 12.5° in yellow, 15° in pink.
Applsci 12 12434 g005
Figure 6. (a) The modulation transfer function (M.T.F.) and (b) the field curvature and distortion of the designed f-theta lens group.
Applsci 12 12434 g006
Figure 7. The three-dimensional layout of the structure of the 1D scanner uses two galvanometers in combination with the designed f-theta lens.
Applsci 12 12434 g007
Figure 8. (a) Simulation results comparing the roundness of ablations of the 1D scanning system using two galvanometers in the red circle and the 2D scanning system in the blue square, in which the cyan line shows the roundness of ablations in ISO 11145:2018. (b) The compensation of telecentricity in the 1D scanning system using two galvanometers compared to the conventional 2D scanner.
Applsci 12 12434 g008
Figure 9. (a) Overall view of experimental setup from computer-aided design (CAD) model for a 1D scanning system using two galvanometers and beam profile of laser source and laser beam after passing through beam expander. (b) Schematic representation of laser setup for conjugated two galvanometers to minimize telecentricity, 1D scanning system using two galvanometers with a distance between the two mirrors of l = 40 mm.
Applsci 12 12434 g009
Figure 10. Optical microscopy image of typical static pulse ablations with power variation from 30%, 40%, 50%, and 60% of laser source power.
Applsci 12 12434 g010
Figure 11. (a) Output laser power, (b) laser energy, and (c) ablation threshold plot for silicon using laser fluences of F = 0.165 µJ/cm2–1.884 µJ/cm2 in the attenuator transmission range of 20% to 65%.
Applsci 12 12434 g011aApplsci 12 12434 g011b
Figure 12. Experiment to investigate the roundness of ablations through camera images and microscopic measurements: (a) ablation position, (b) the number of ablation, and (c) ablation measurements.
Applsci 12 12434 g012
Figure 13. Results of measuring the roundness of silicon ablation when using (a) a conventional 2D scanning system and (b) a 1D scanning system using two galvanometers at attenuator transmission of 30%. (c) and (d) Comparison results of two scanning systems at attenuator transmission of 55%.
Applsci 12 12434 g013
Table 1. The design parameters of a 1D scanning system using two galvanometers.
SurfaceTypeRadius (mm)Thickness (mm)GlassSemi-Diameter (mm)
ObjectStandardInfinity0 0
1StandardInfinity20 0
StopStandardInfinity20 1.0
3Coordinate break 0 0
4Coordinate break 0 0
5StandardInfinity0Mirror7.087
6Coordinate break 0 0
7Coordinate break 0 0
8StandardInfinity−40 5.00994
9Coordinate break 0 0
10Coordinate break 0 0
11StandardInfinity0Mirror7.105
12Coordinate break 0 0
13Coordinate break 0 0
14StandardInfinity28.8 5.306
15Standard−568.0688.0C79-8016.8
16Standard−44.9242.342 17.8
17Standard−41.1357.0Silica18
18Standard129.8649.991 21
19Standard−32.0999.0C79-8021.2
20Standard−84.9393.375 27.5
21Standard−55.8659.0Silica28
22Standard−43.4690.543 31
23Standard−981.24215.0C79-8037
24Standard−75.3300.502 39
25Standard265.03913.0Silica46.5
26Standard−153.78018.545 46.5
27Standard208.26712.0C79-8046.5
28Standard714.772156.905 46.5
ImageStandardInfinity-
Table 2. Comparison results of various experimental setups.
Experimental SetupAerotech, 2019–2021Pisanello, 2022Franz, 2022Group of Authors
Methods2D scanner using three galvanometers2D scanner using three galvanometersAOD + 2D scanner1D scanner using two galvanometers
F-theta lens scan area [mm2]170 × 17010 × 1035 × 35 53 × 53
Telecentricity error [°]12.711.51.51.1
Wavelength [nm]355450–1100532355
Extended working length 63 mm200 µmunspecified3.6 mm
Publisher’s Note: MDPI stays neutral with regard to jurisdictional claims in published maps and institutional affiliations.