

Analysis of Load Transfer and the Law of Deformation within a Pile-Supported Reinforced Embankment


Abstract
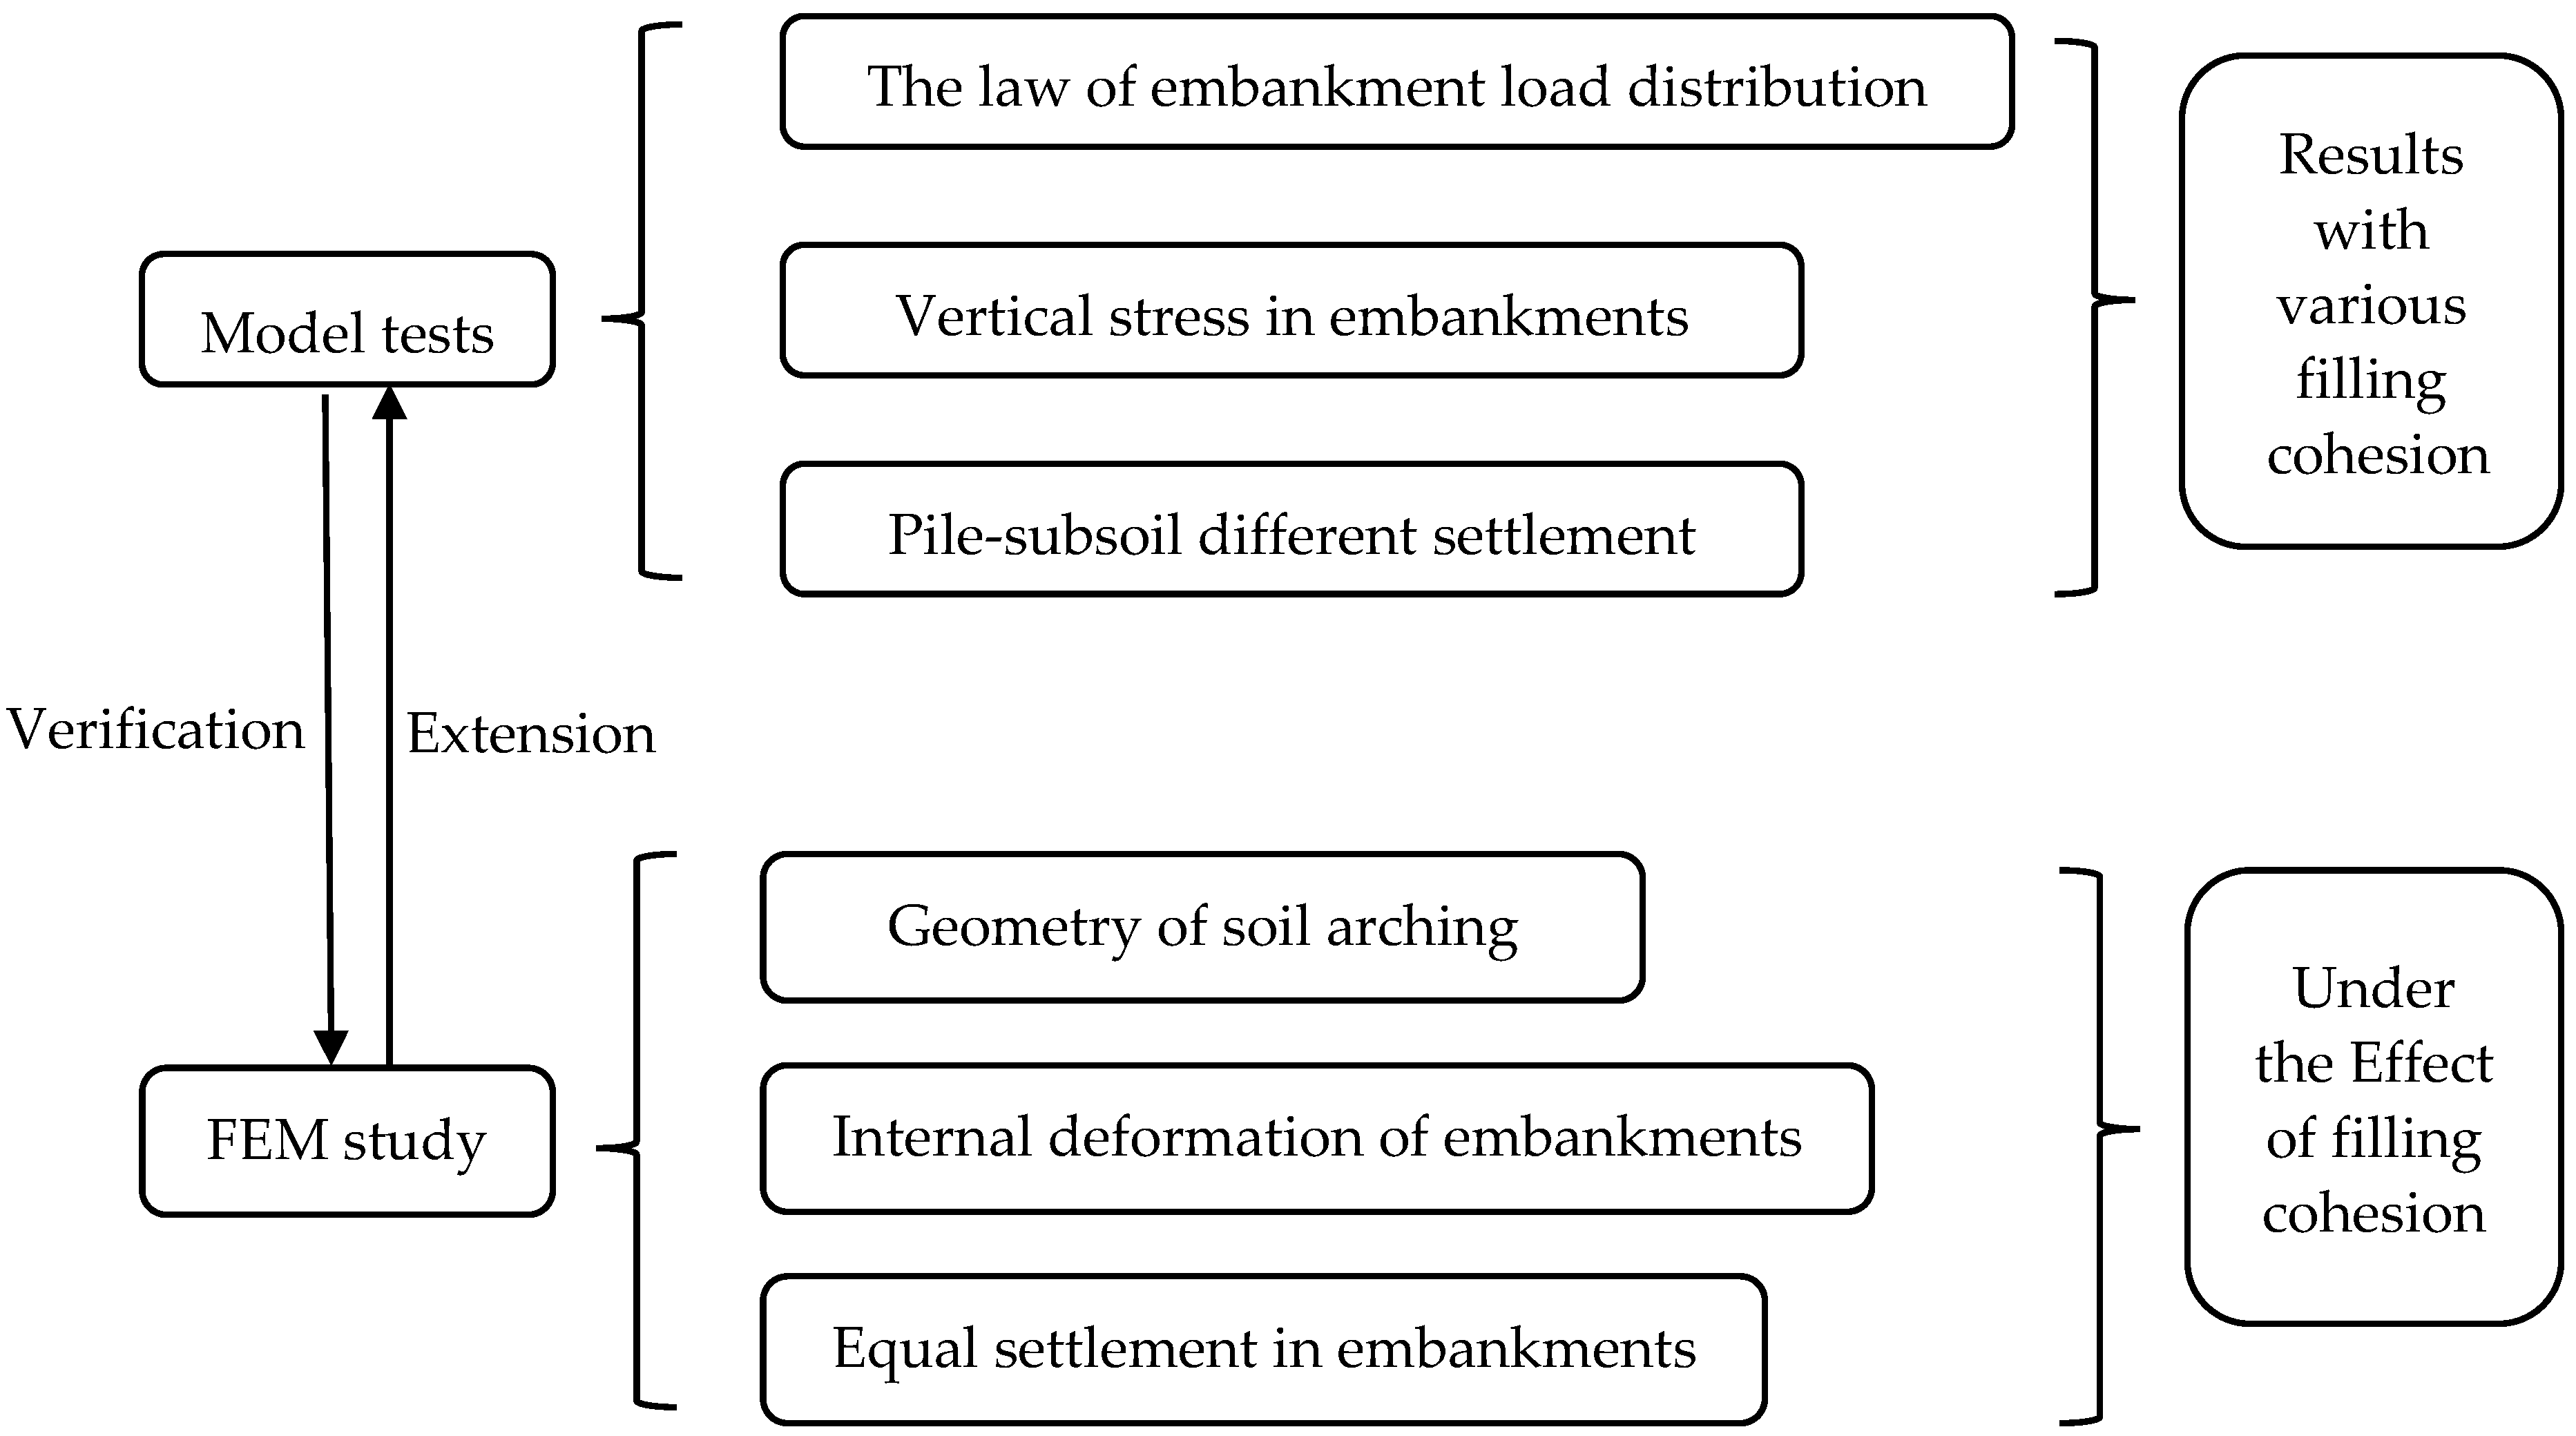
1. Introduction
2. Model tests
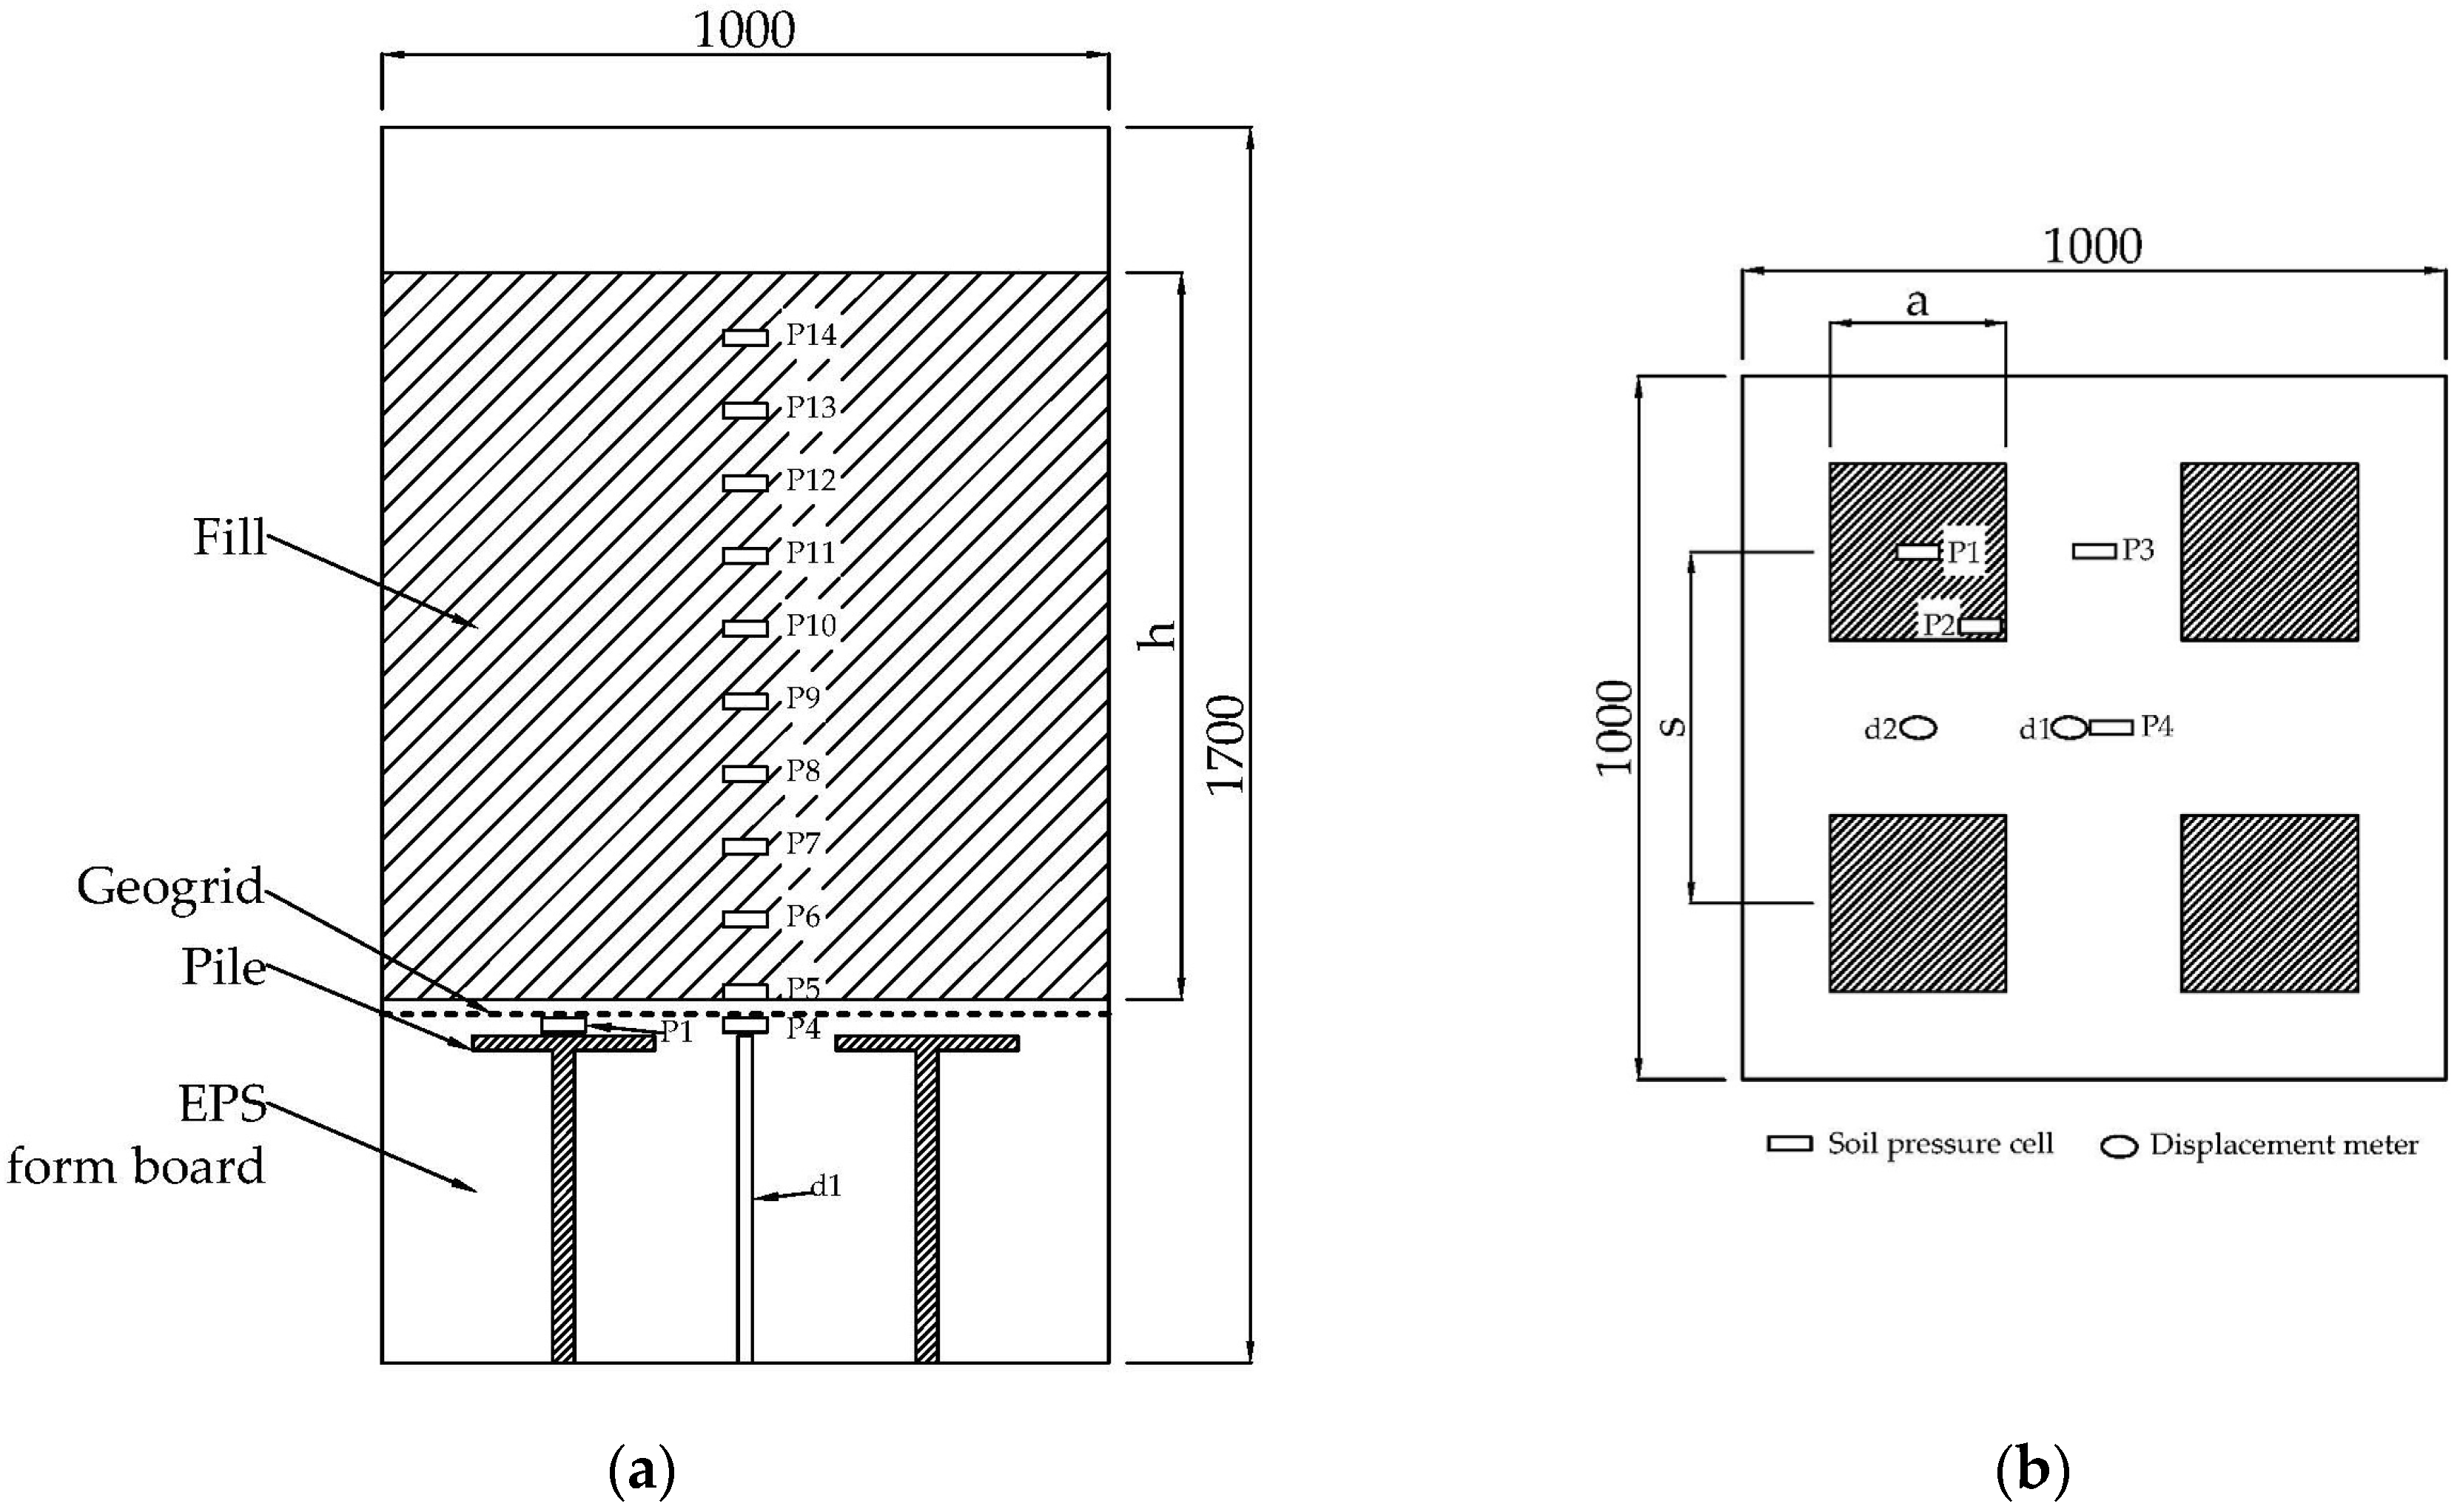
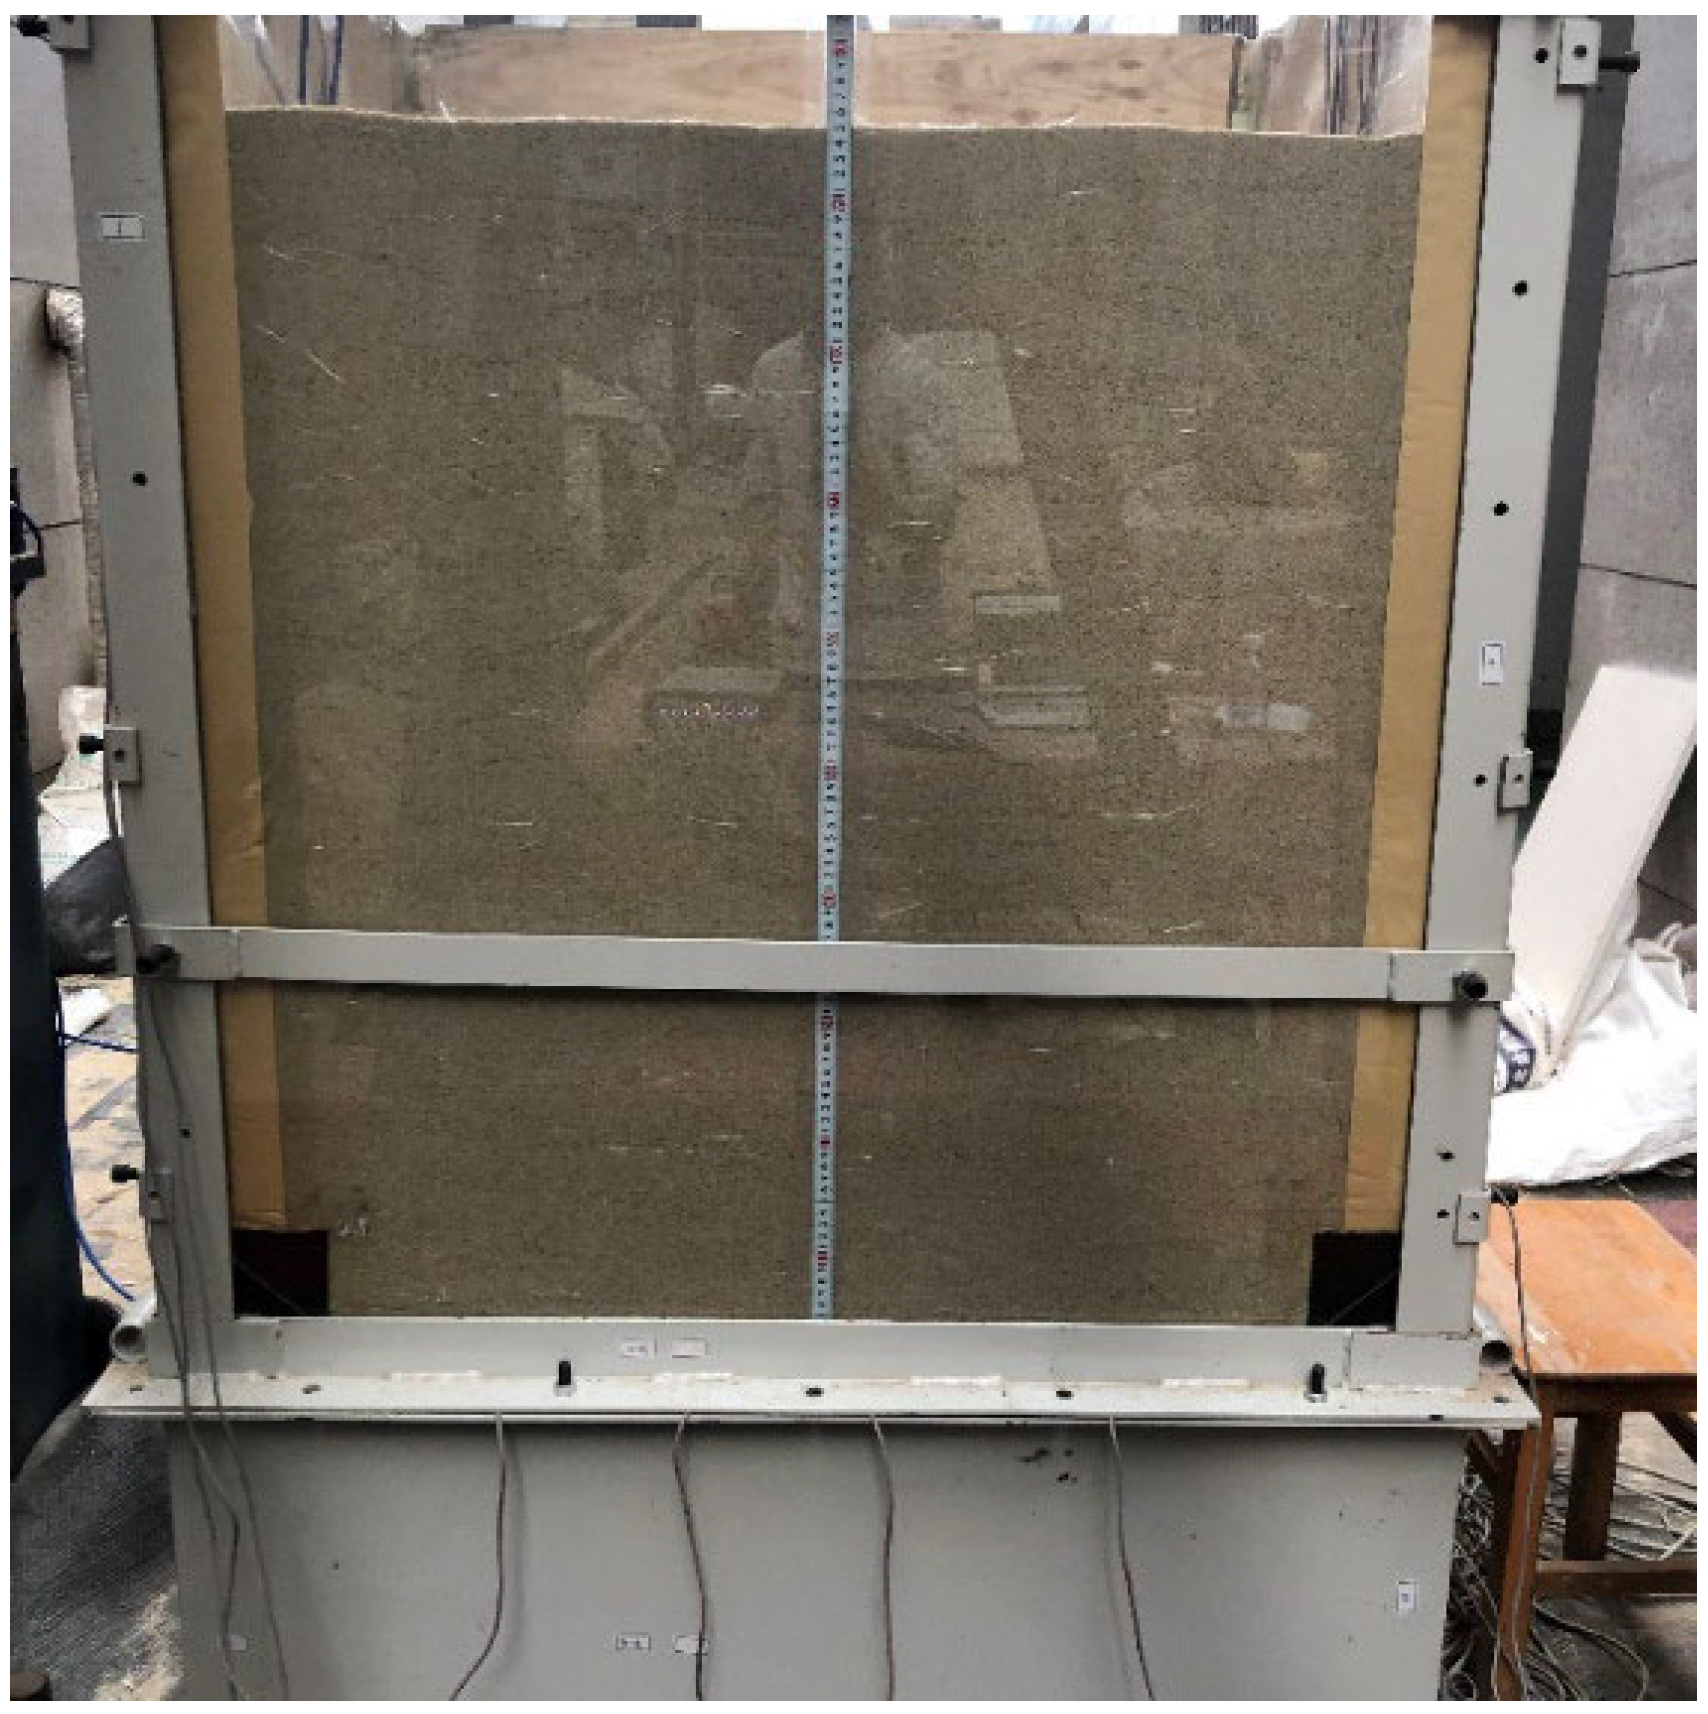
2.1. Model Test Setup and Measurement System
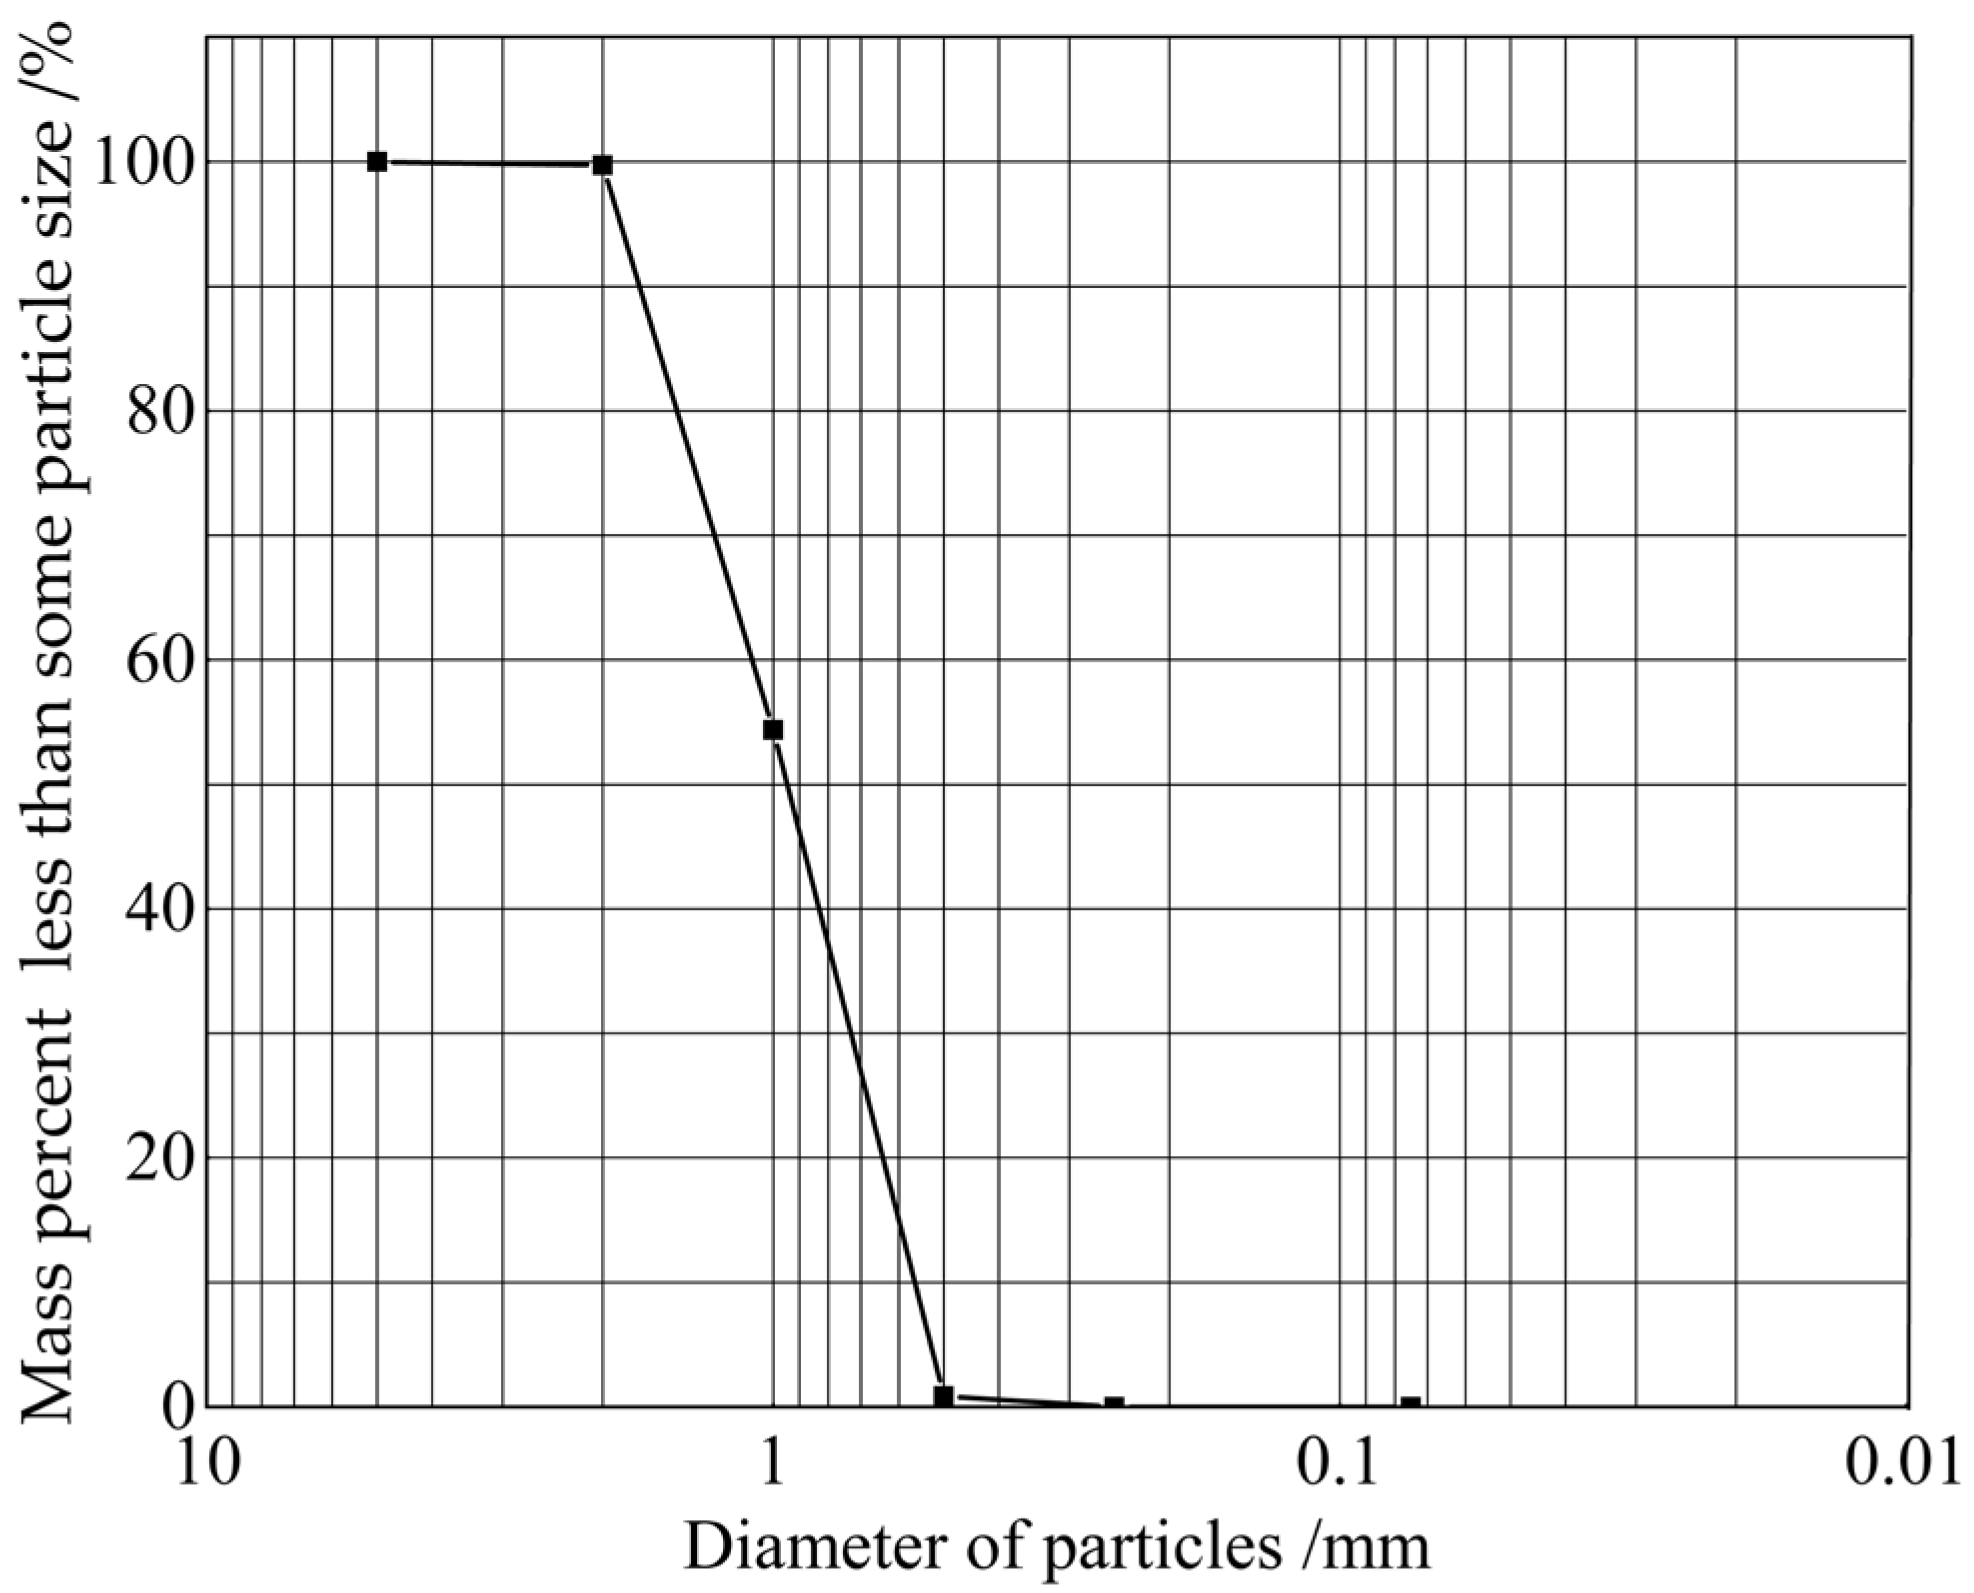
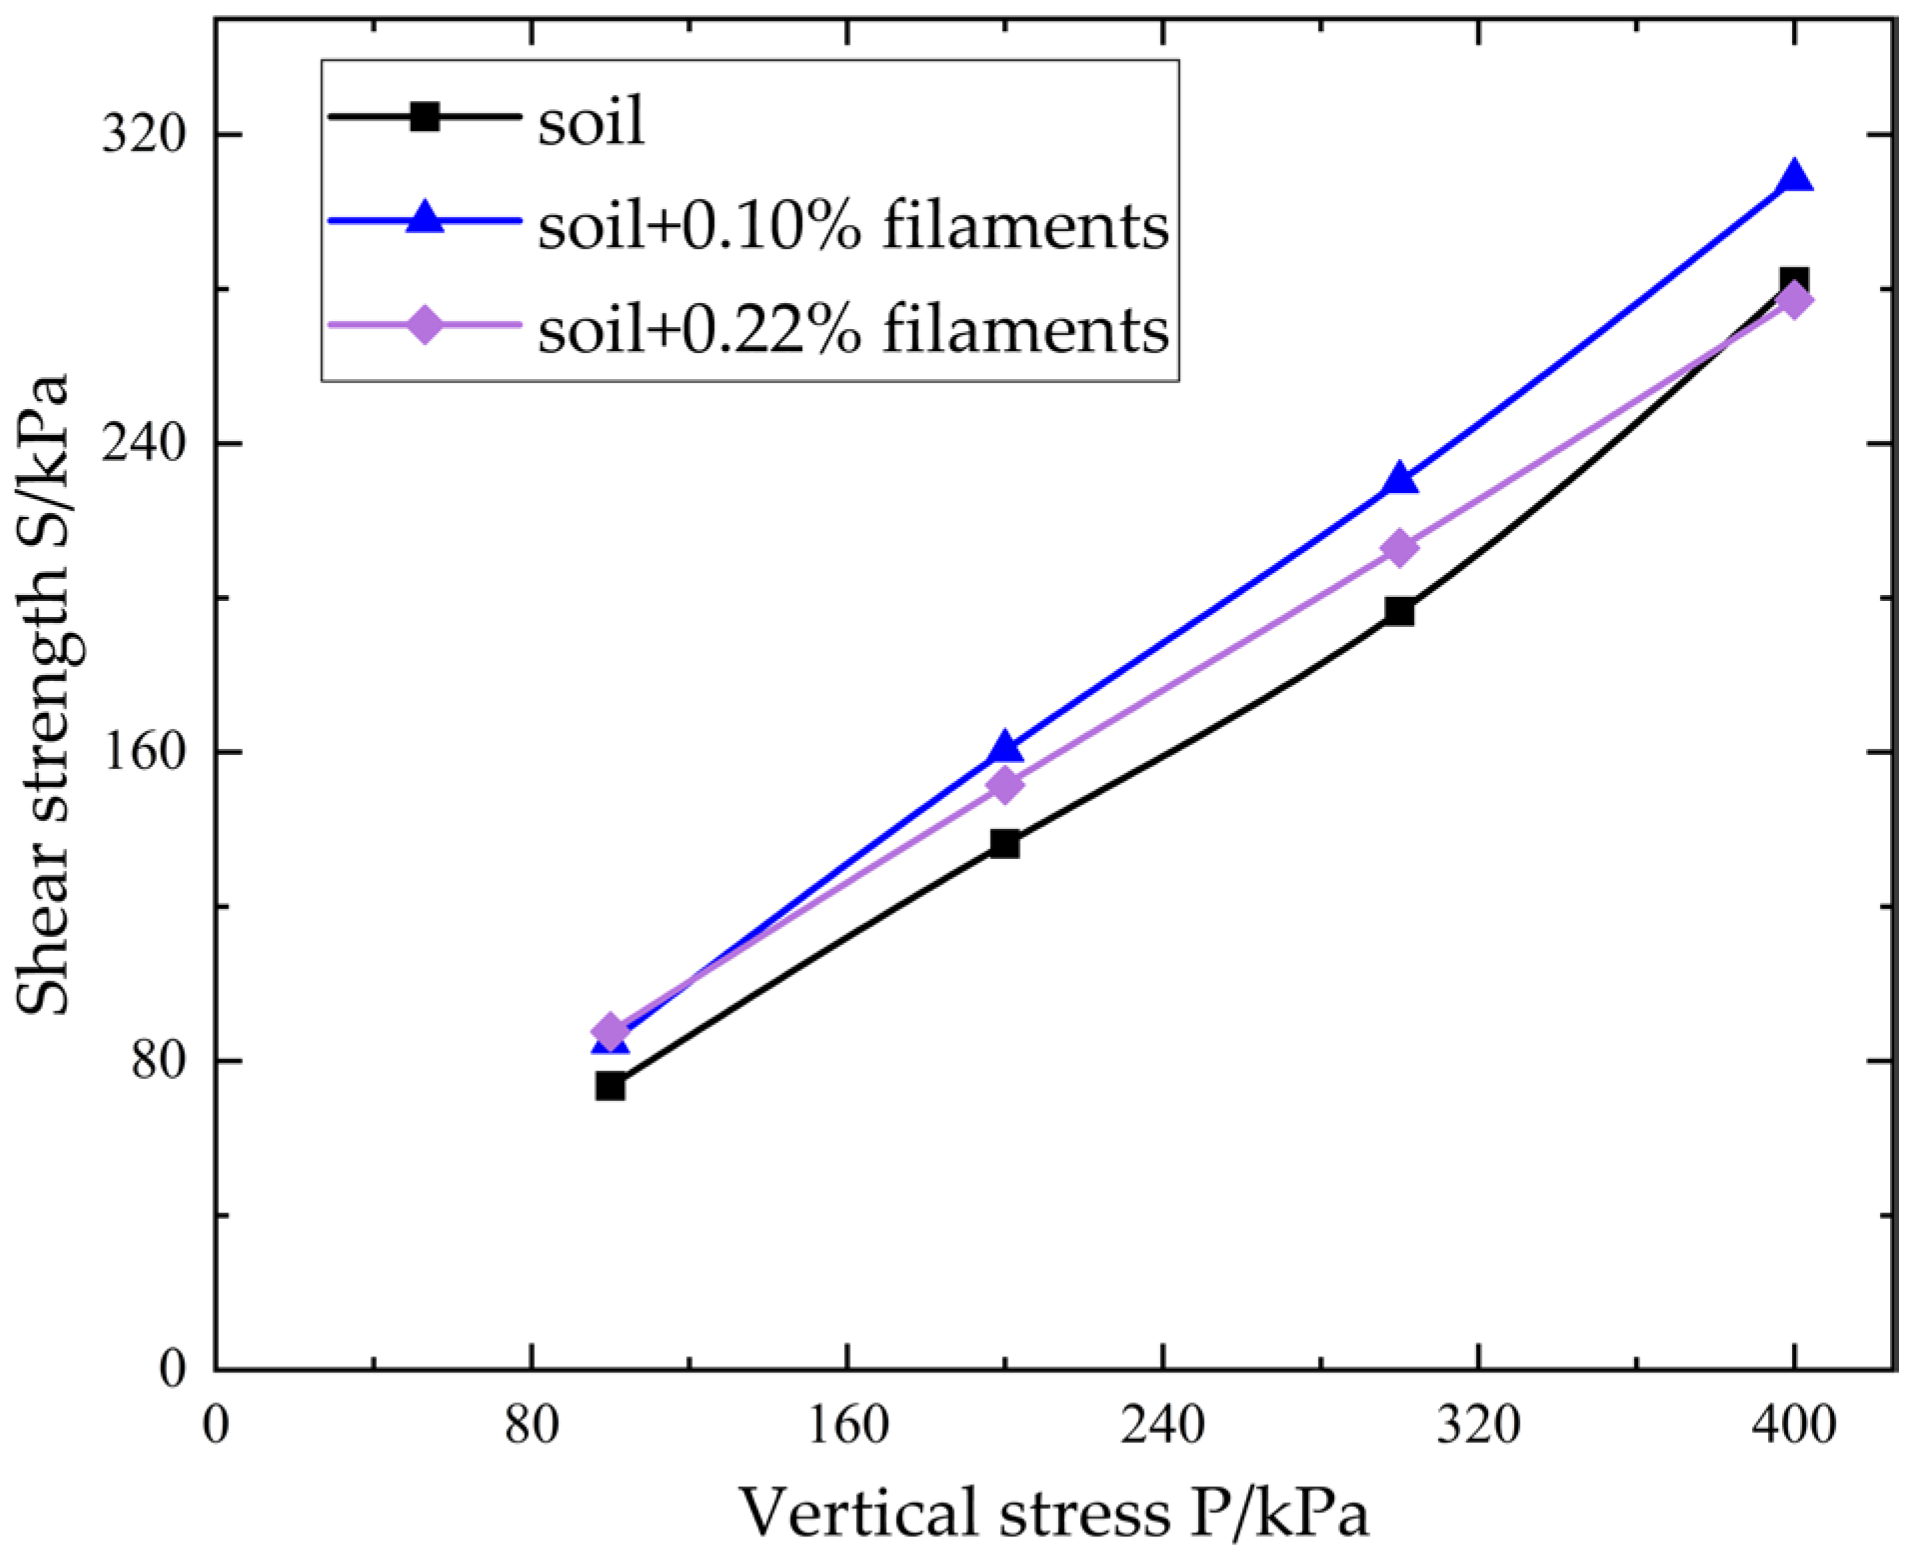
2.2. Materials for Model Tests
2.3. Scheme of Model Test
2.4. Steps of Model Test
- (1)
- Preparation of a series of instruments and equipment required for the model tests;
- (2)
- Placing model piles and EPS foam board;
- (3)
- Arranging the single-point displacement meter in the middle of the subsoil and attaching it to the comprehensive tester;
- (4)
- Connecting the soil pressure cells with the dynamic strain acquisition instrument and zeroed by software;
- (5)
- Burying soil pressure cells and laying reinforced cushion;
- (6)
- Filling the embankment into ten layers and burying the soil pressure cells after each layer is filled. In addition, the compaction degree is controlled by the quality of each filling layer.
3. Model Test Results
3.1. Stress State at the Bottom of the Embankment
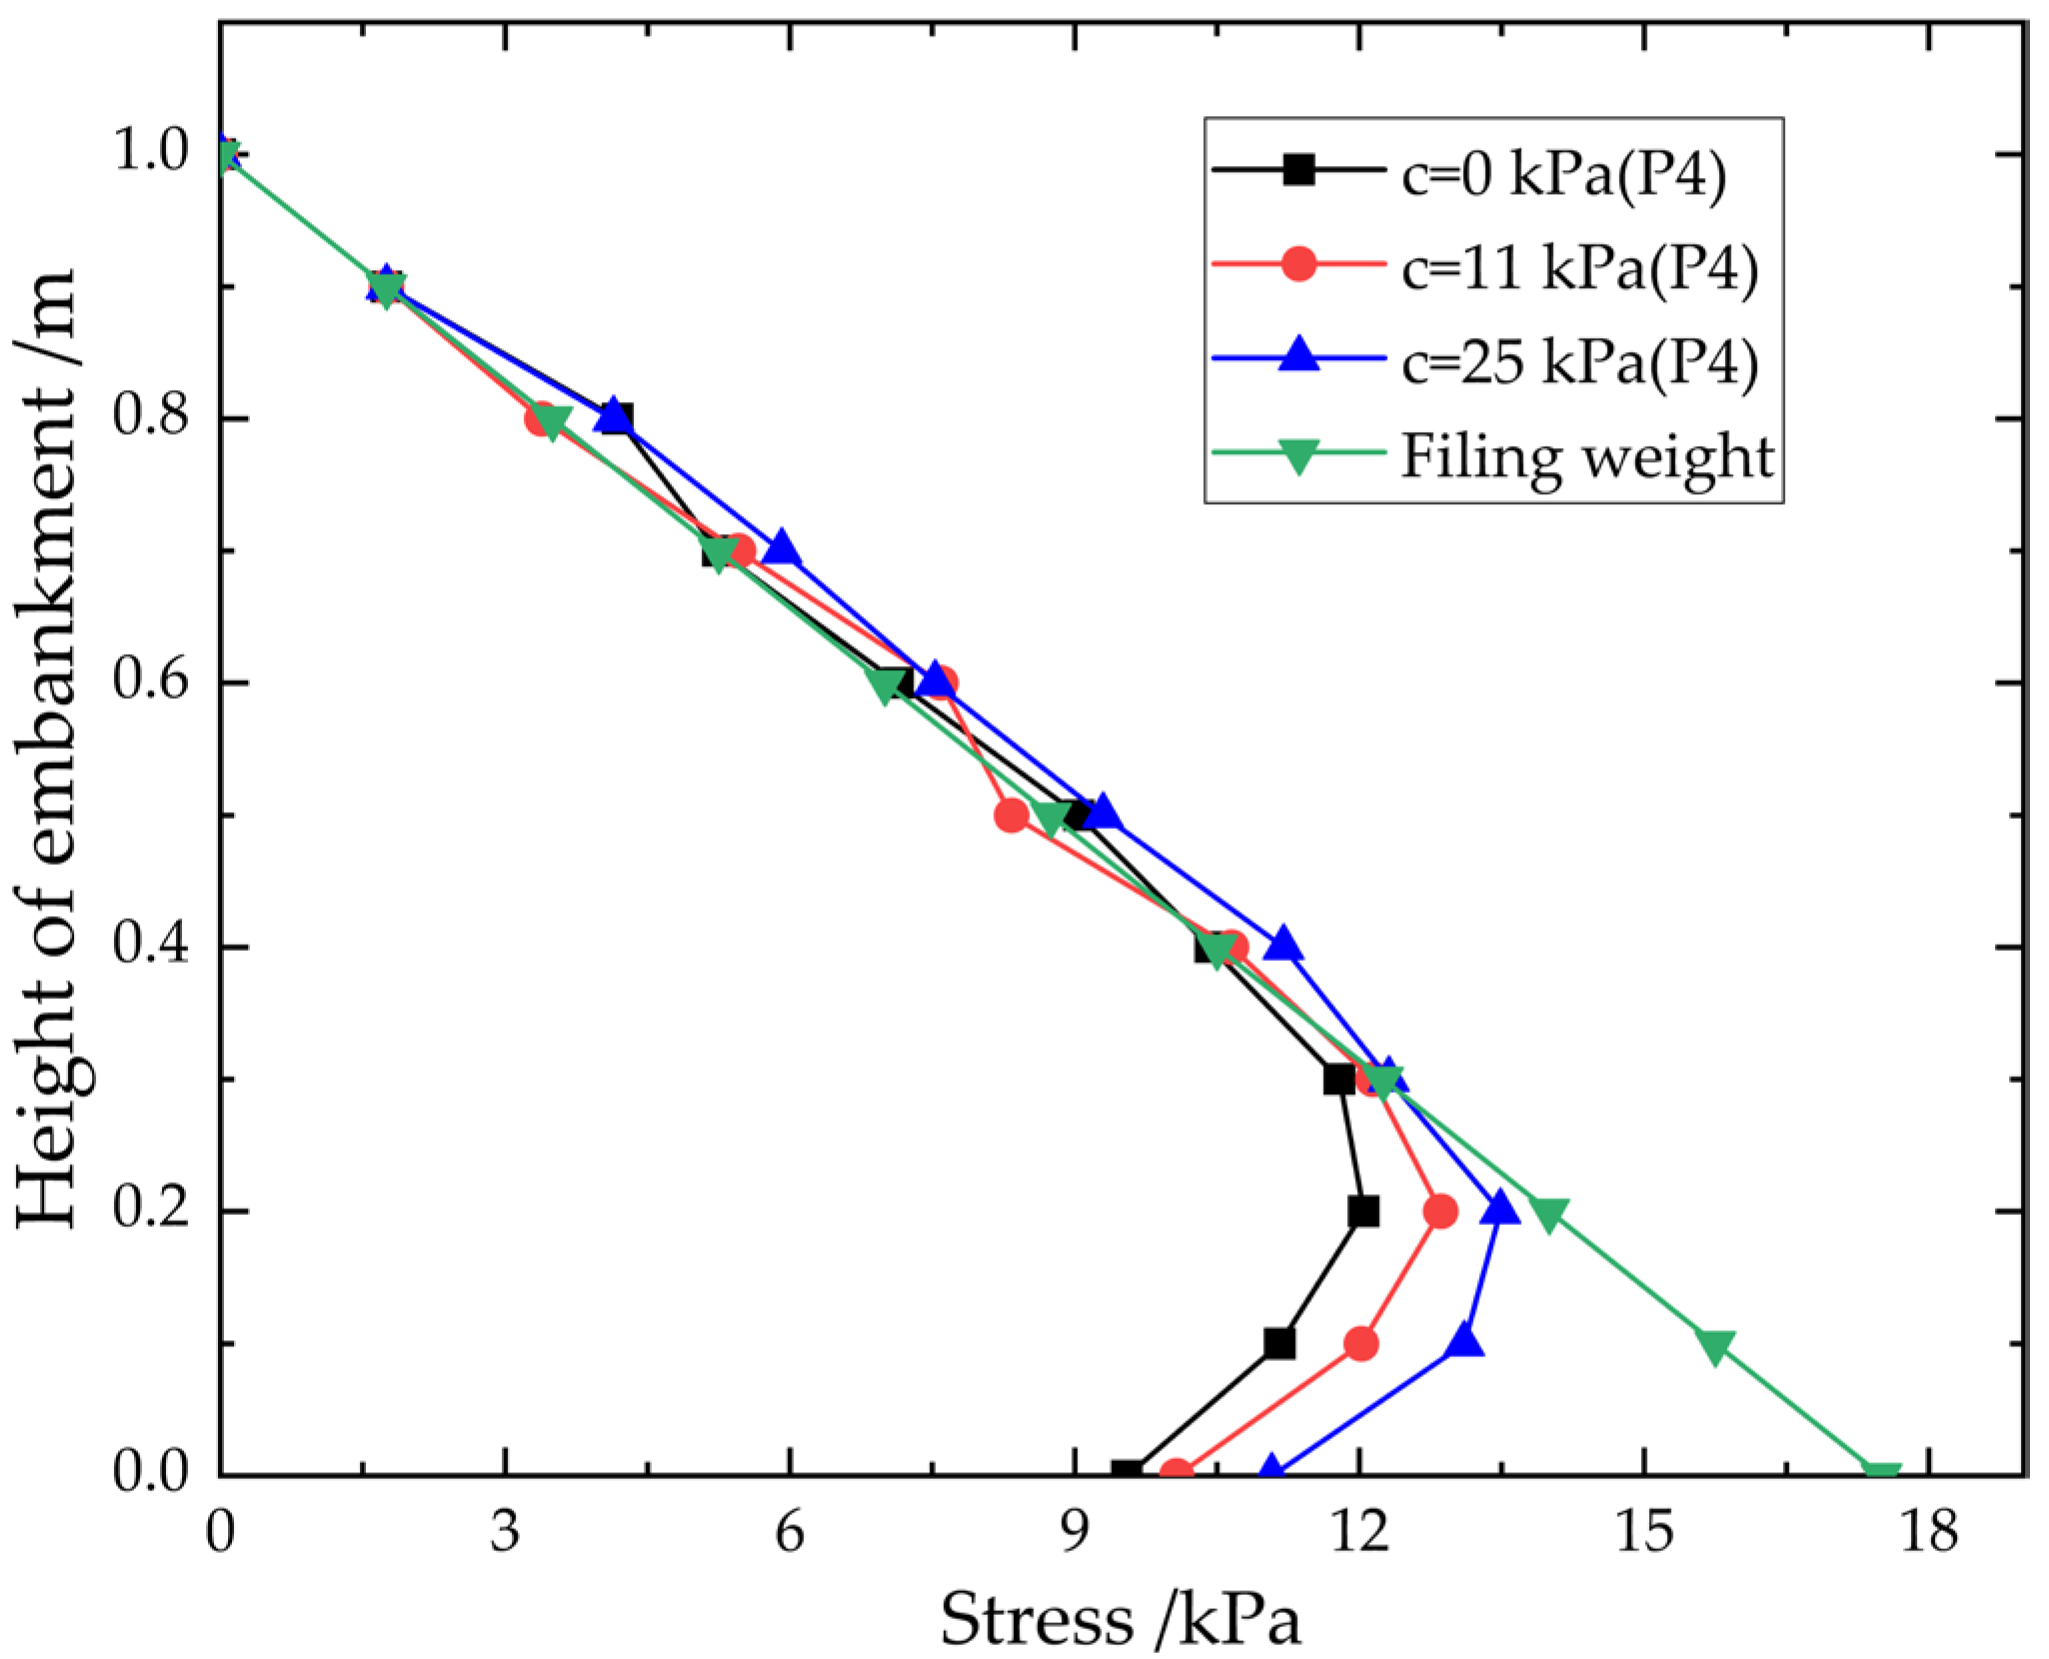
3.2. Distribution of Vertical Stress
- (1)
- In all tests, the curve of vertical stress of the embankment is deflected;
- (2)
- In some situation when the distance is less than 0.3 m from the bottom of the embankment, the value of vertical stress increases with the increase in cohesiveness;
- (3)
- The deflection height on the curve of vertical stress is less affected by the cohesion, and the deflection height is about 0.3 m.
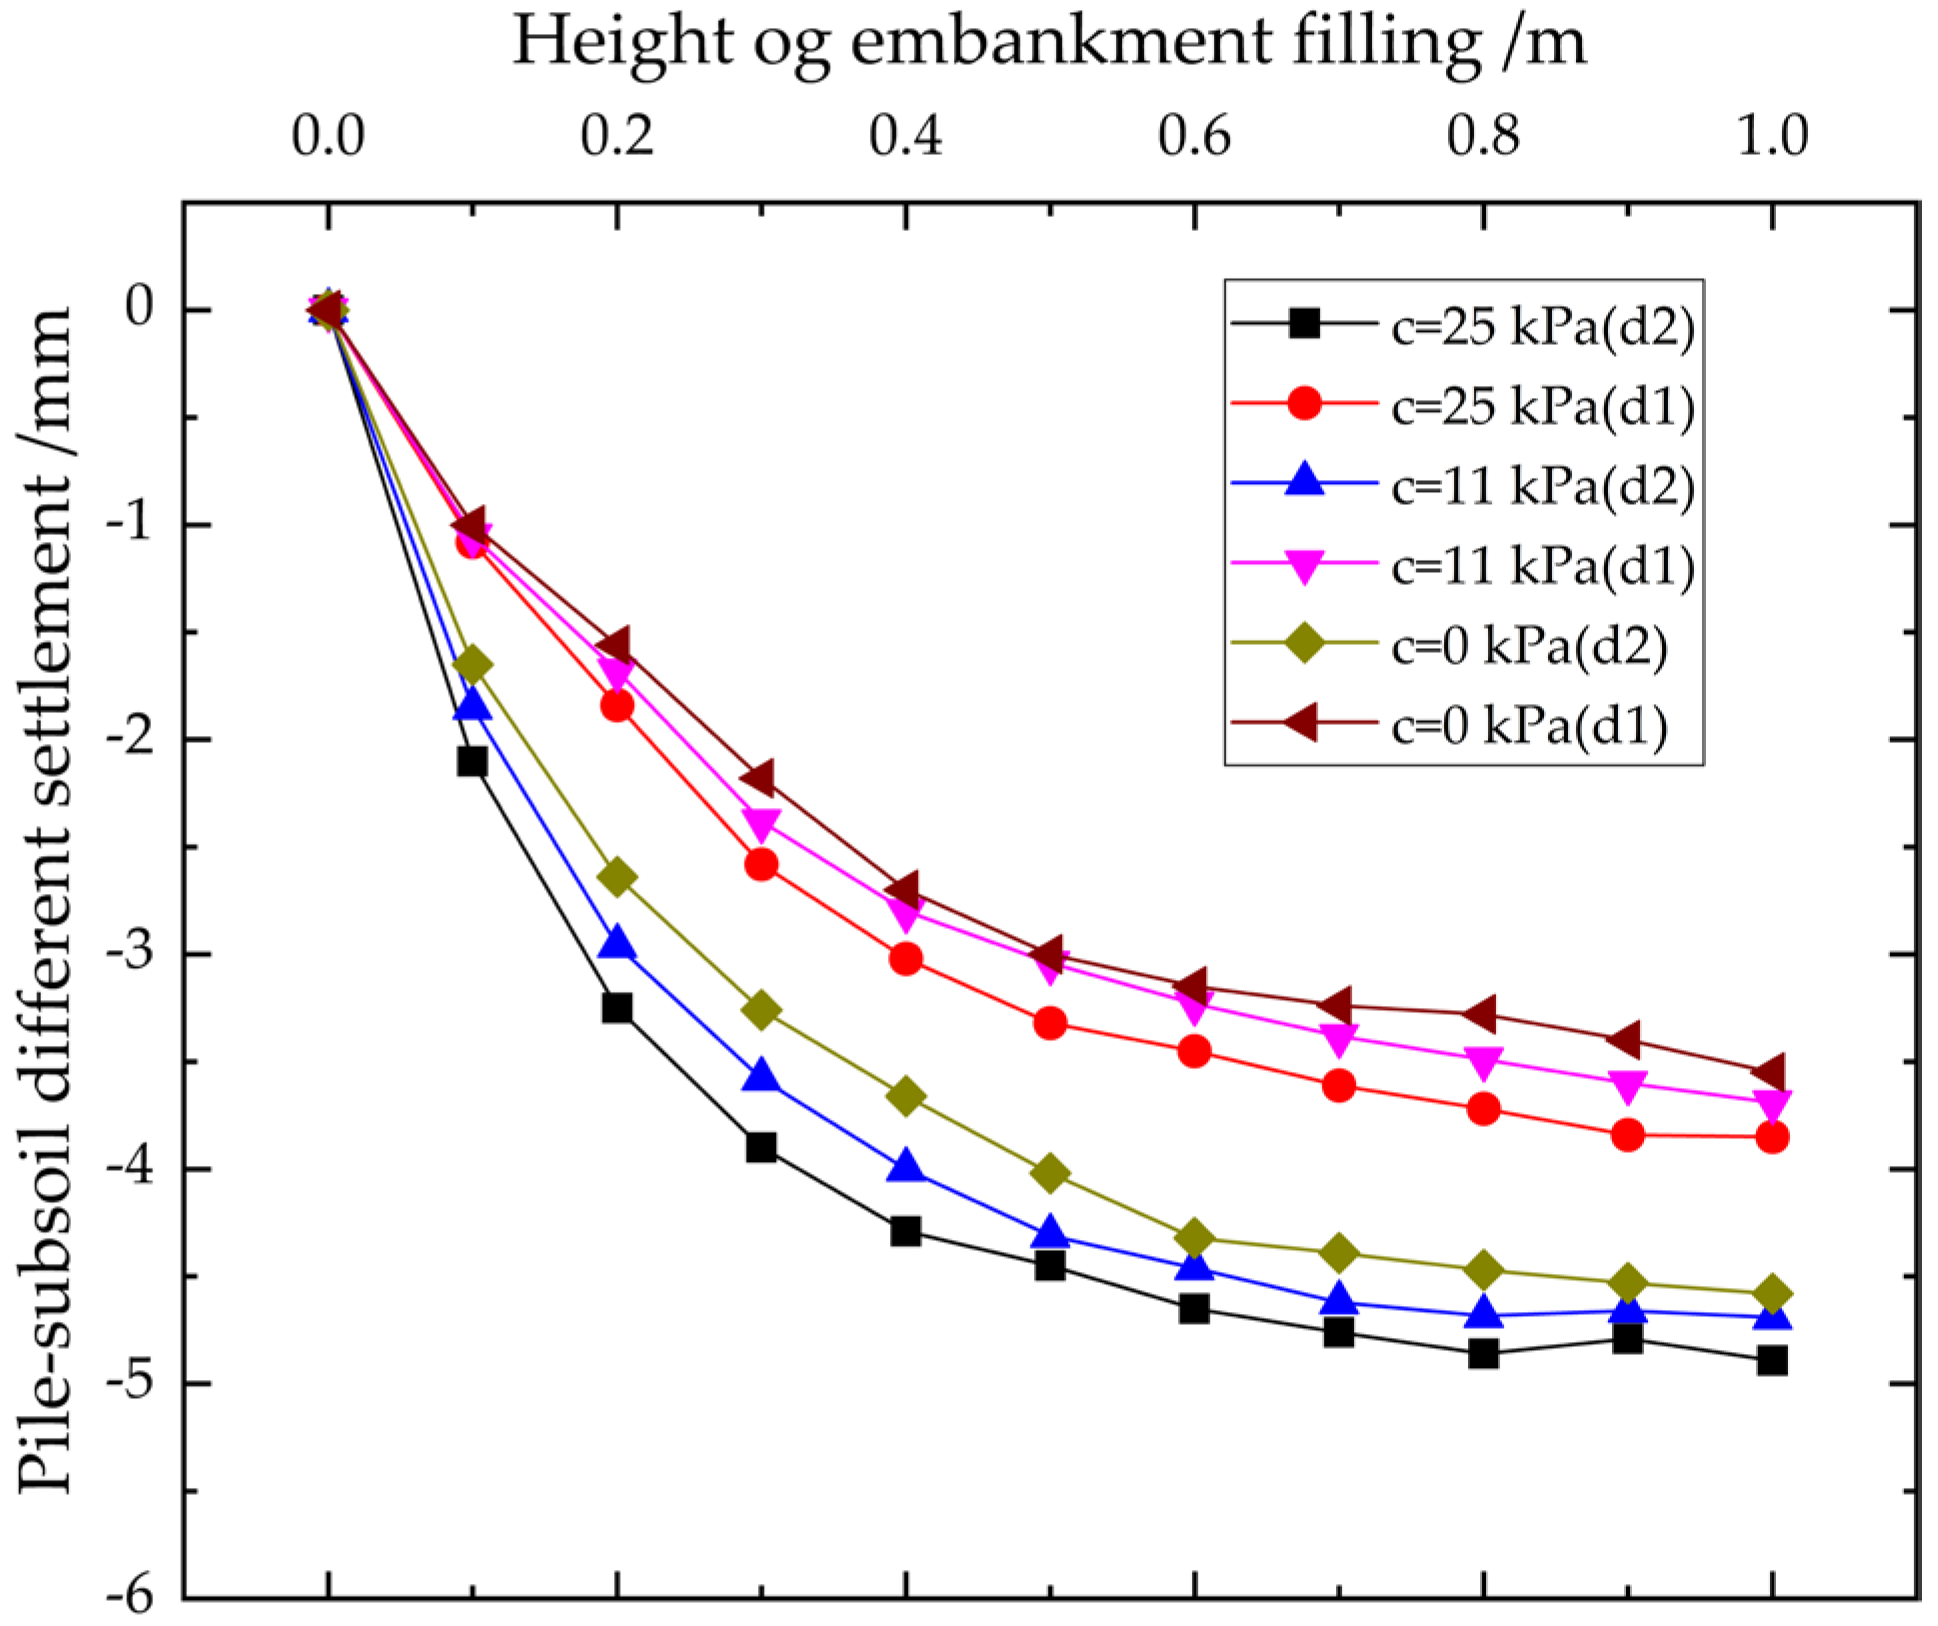
3.3. Pile-Subsoil Relative Displacement
- (1)
- The pile-subsoil differential settlement continues to grow during the embankment filling process, and the rate of growth gradually decreases. The final values of pile-subsoil differential settlement at the mid-span between four piles are 4.89 mm, 4.69 mm, and 4.58 mm, respectively, and the final values of pile-subsoil differential settlement at the mid-span between two piles are 3.85 mm, 3.69 mm, and 3.55 mm respectively. The different settlement at the mid-span between four piles is more extensive than between two piles. The pile spacings are always 500 mm. However, there is a difference between the spacing of diagonal adjacent piles and horizontal adjacent piles. As a result, the subsoil between four piles needs to bear a greater load.
- (2)
- As filling cohesiveness increases, the pile-subsoil differential settlement reduces. The different settlement at the mid-span between four piles in Test 2 and Test 3 decreased by 4.09% and 6.34%, respectively, and the different settlement at the mid-span between two piles in T2 and T3 decreased by 4.11% and 7.79%, respectively, compared with T1. It confirms that the pile-subsoil differential settlement, which is also caused by the variable spacings of diagonal adjacent piles and horizontal adjacent piles, is more susceptible to cohesiveness change at the mid-span between four piles than it is at the mid-span between two piles.
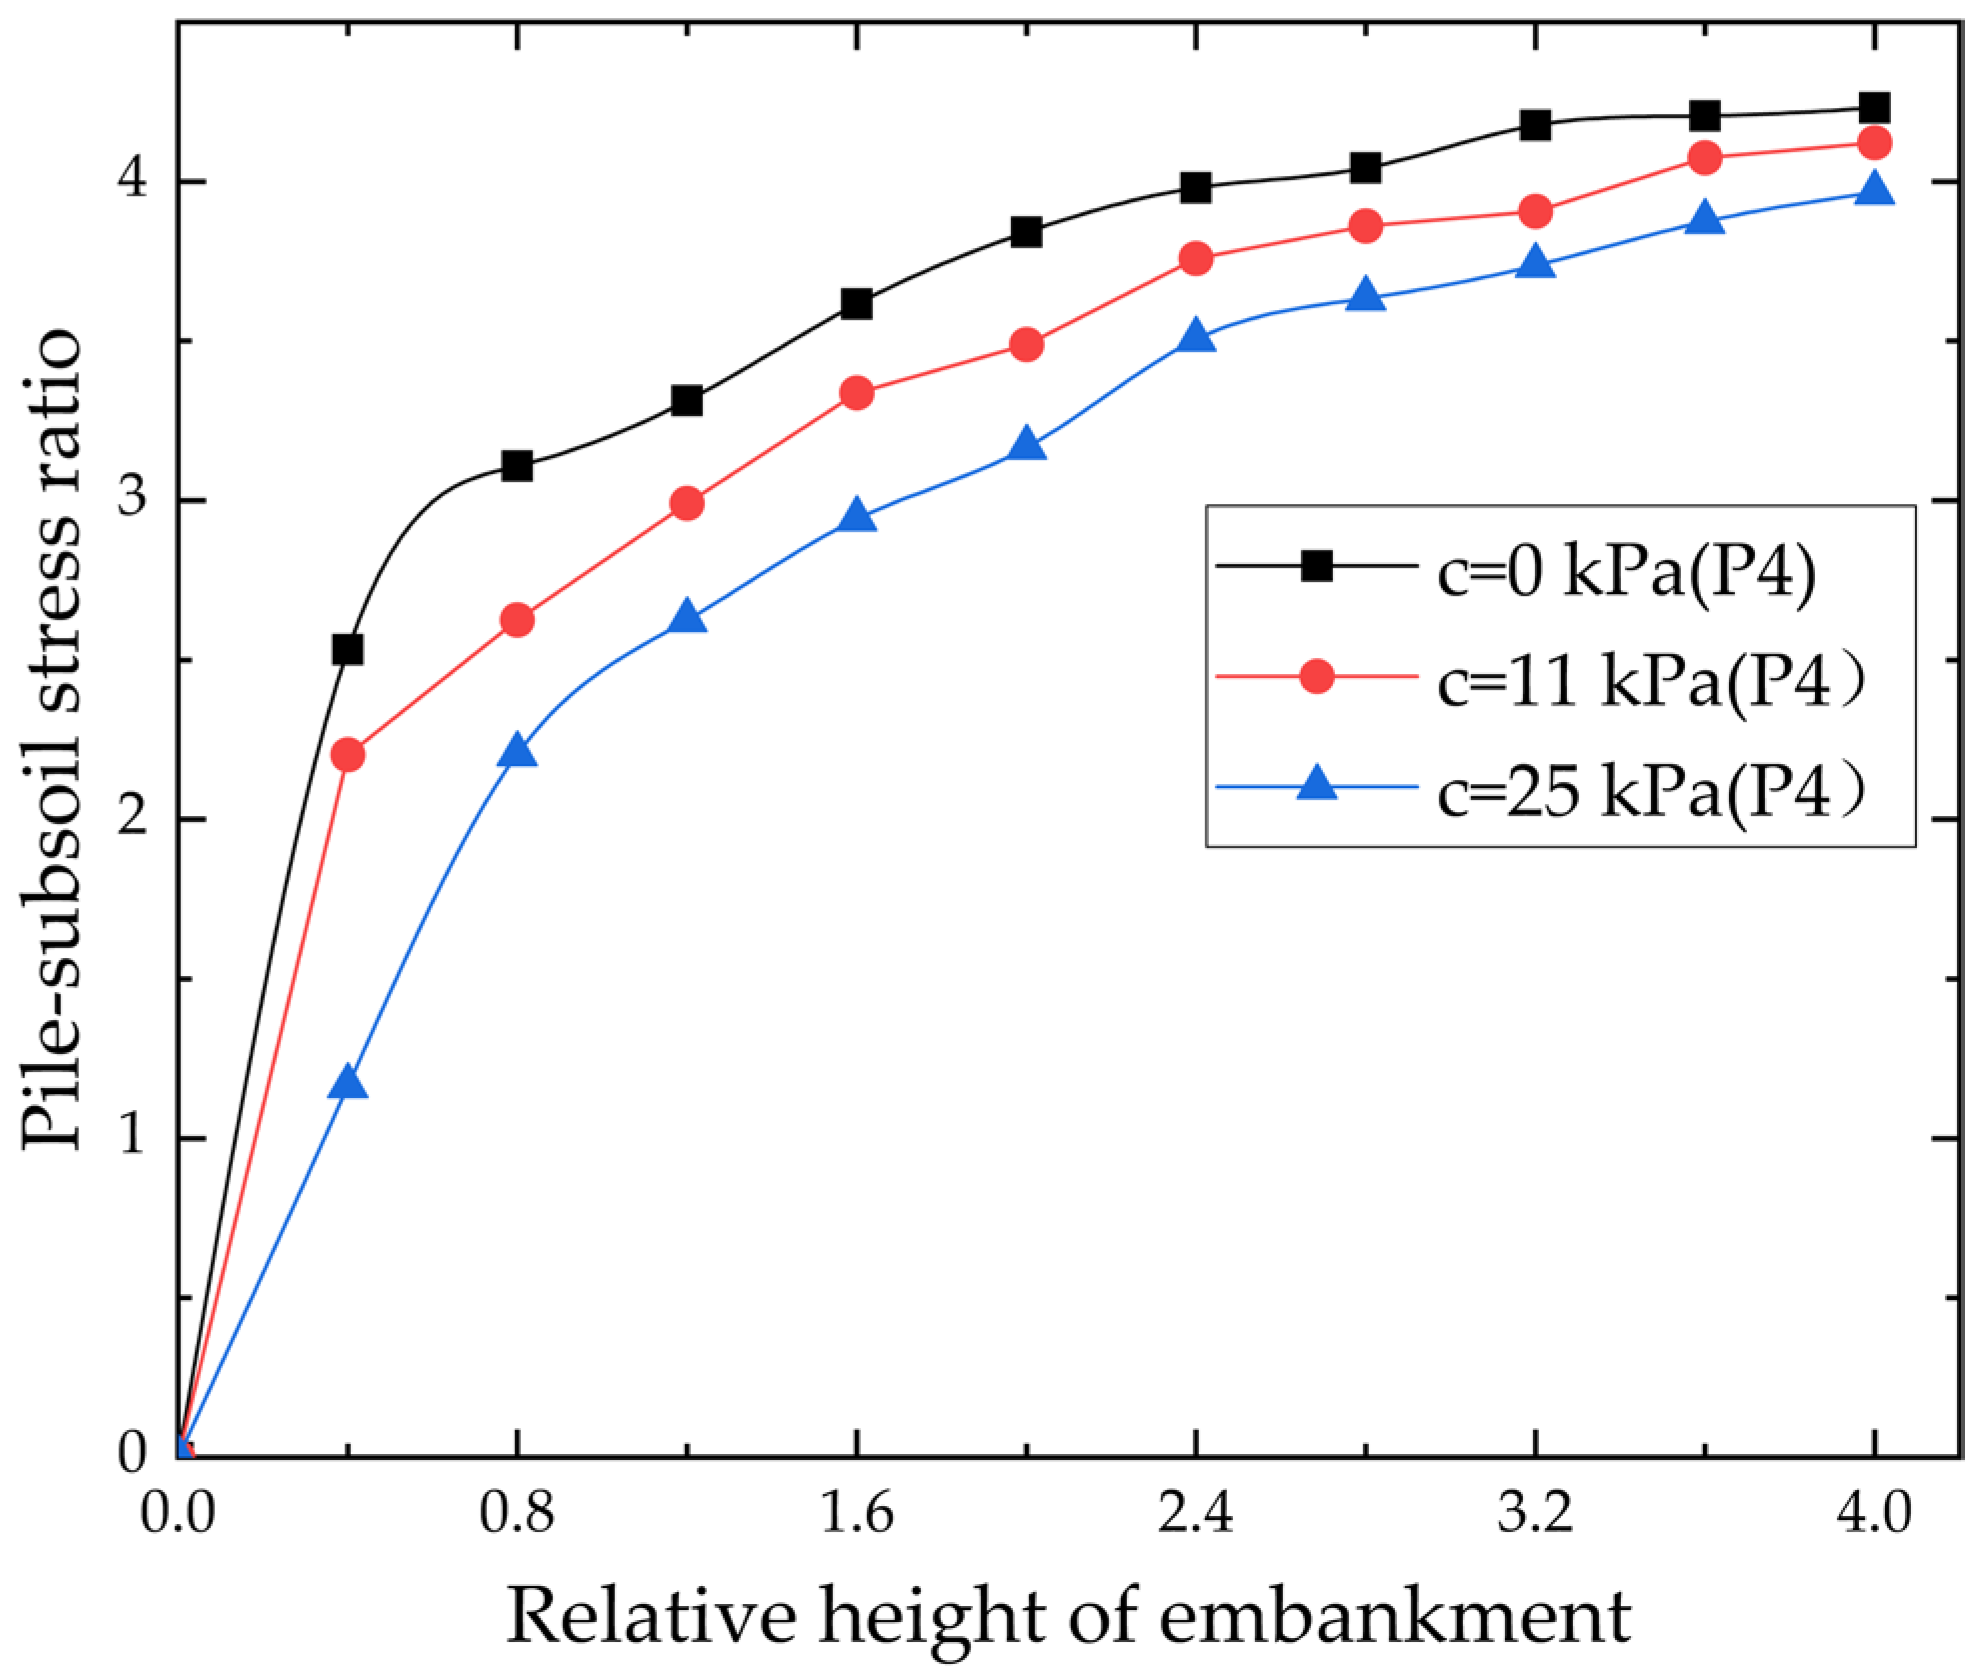
3.4. Pile-Subsoil Stress Ratio
- (1)
- Before the relative height of the embankment ( reached 2.4, the pile-subsoil stress ration grew quickly, and after that it tended to remain constant.
- (2)
- As cohesiveness rises, the pile-subsoil stress ratio decreases under the embankment of the identical height.
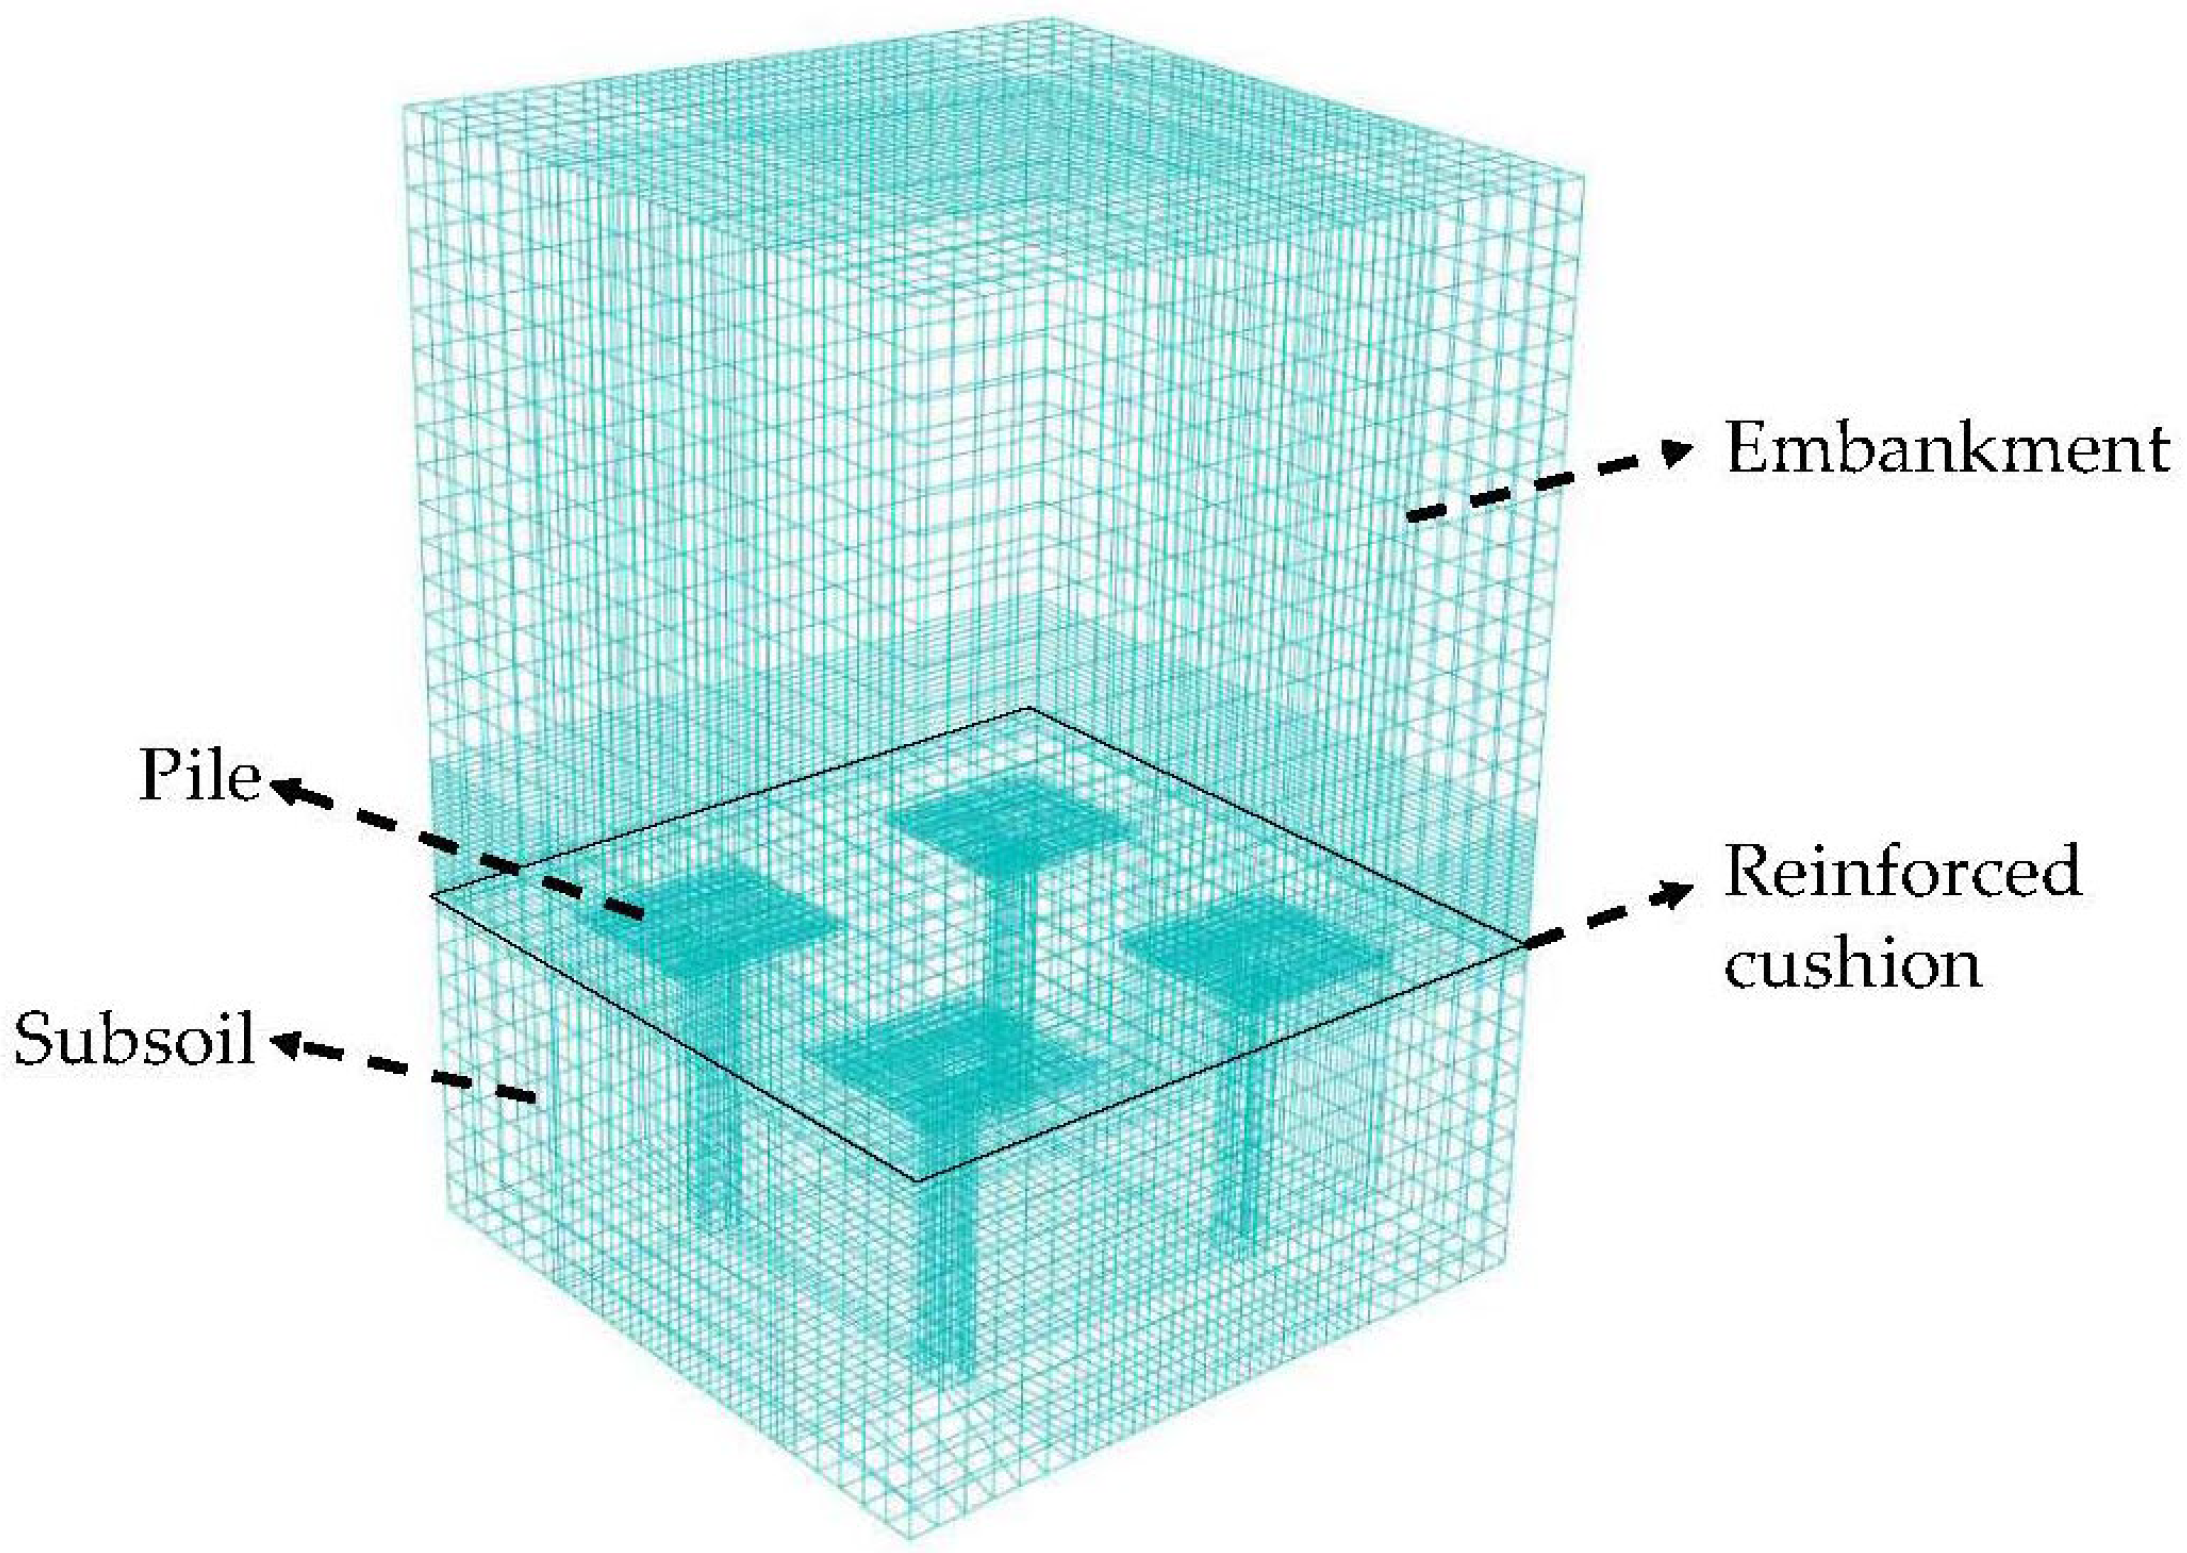
4. FEM Numerical Analysis
4.1. FEM Calibration and Verification
- (1).
- The stiffness of soil pressure cells used in the model tests is more prominent than it of the soil, and its diameter is 78 mm. This results in a concentration of stress above the soil pressure cells. Due to the aforementioned factors, the measured results of soil pressure cells are too large.
- (2).
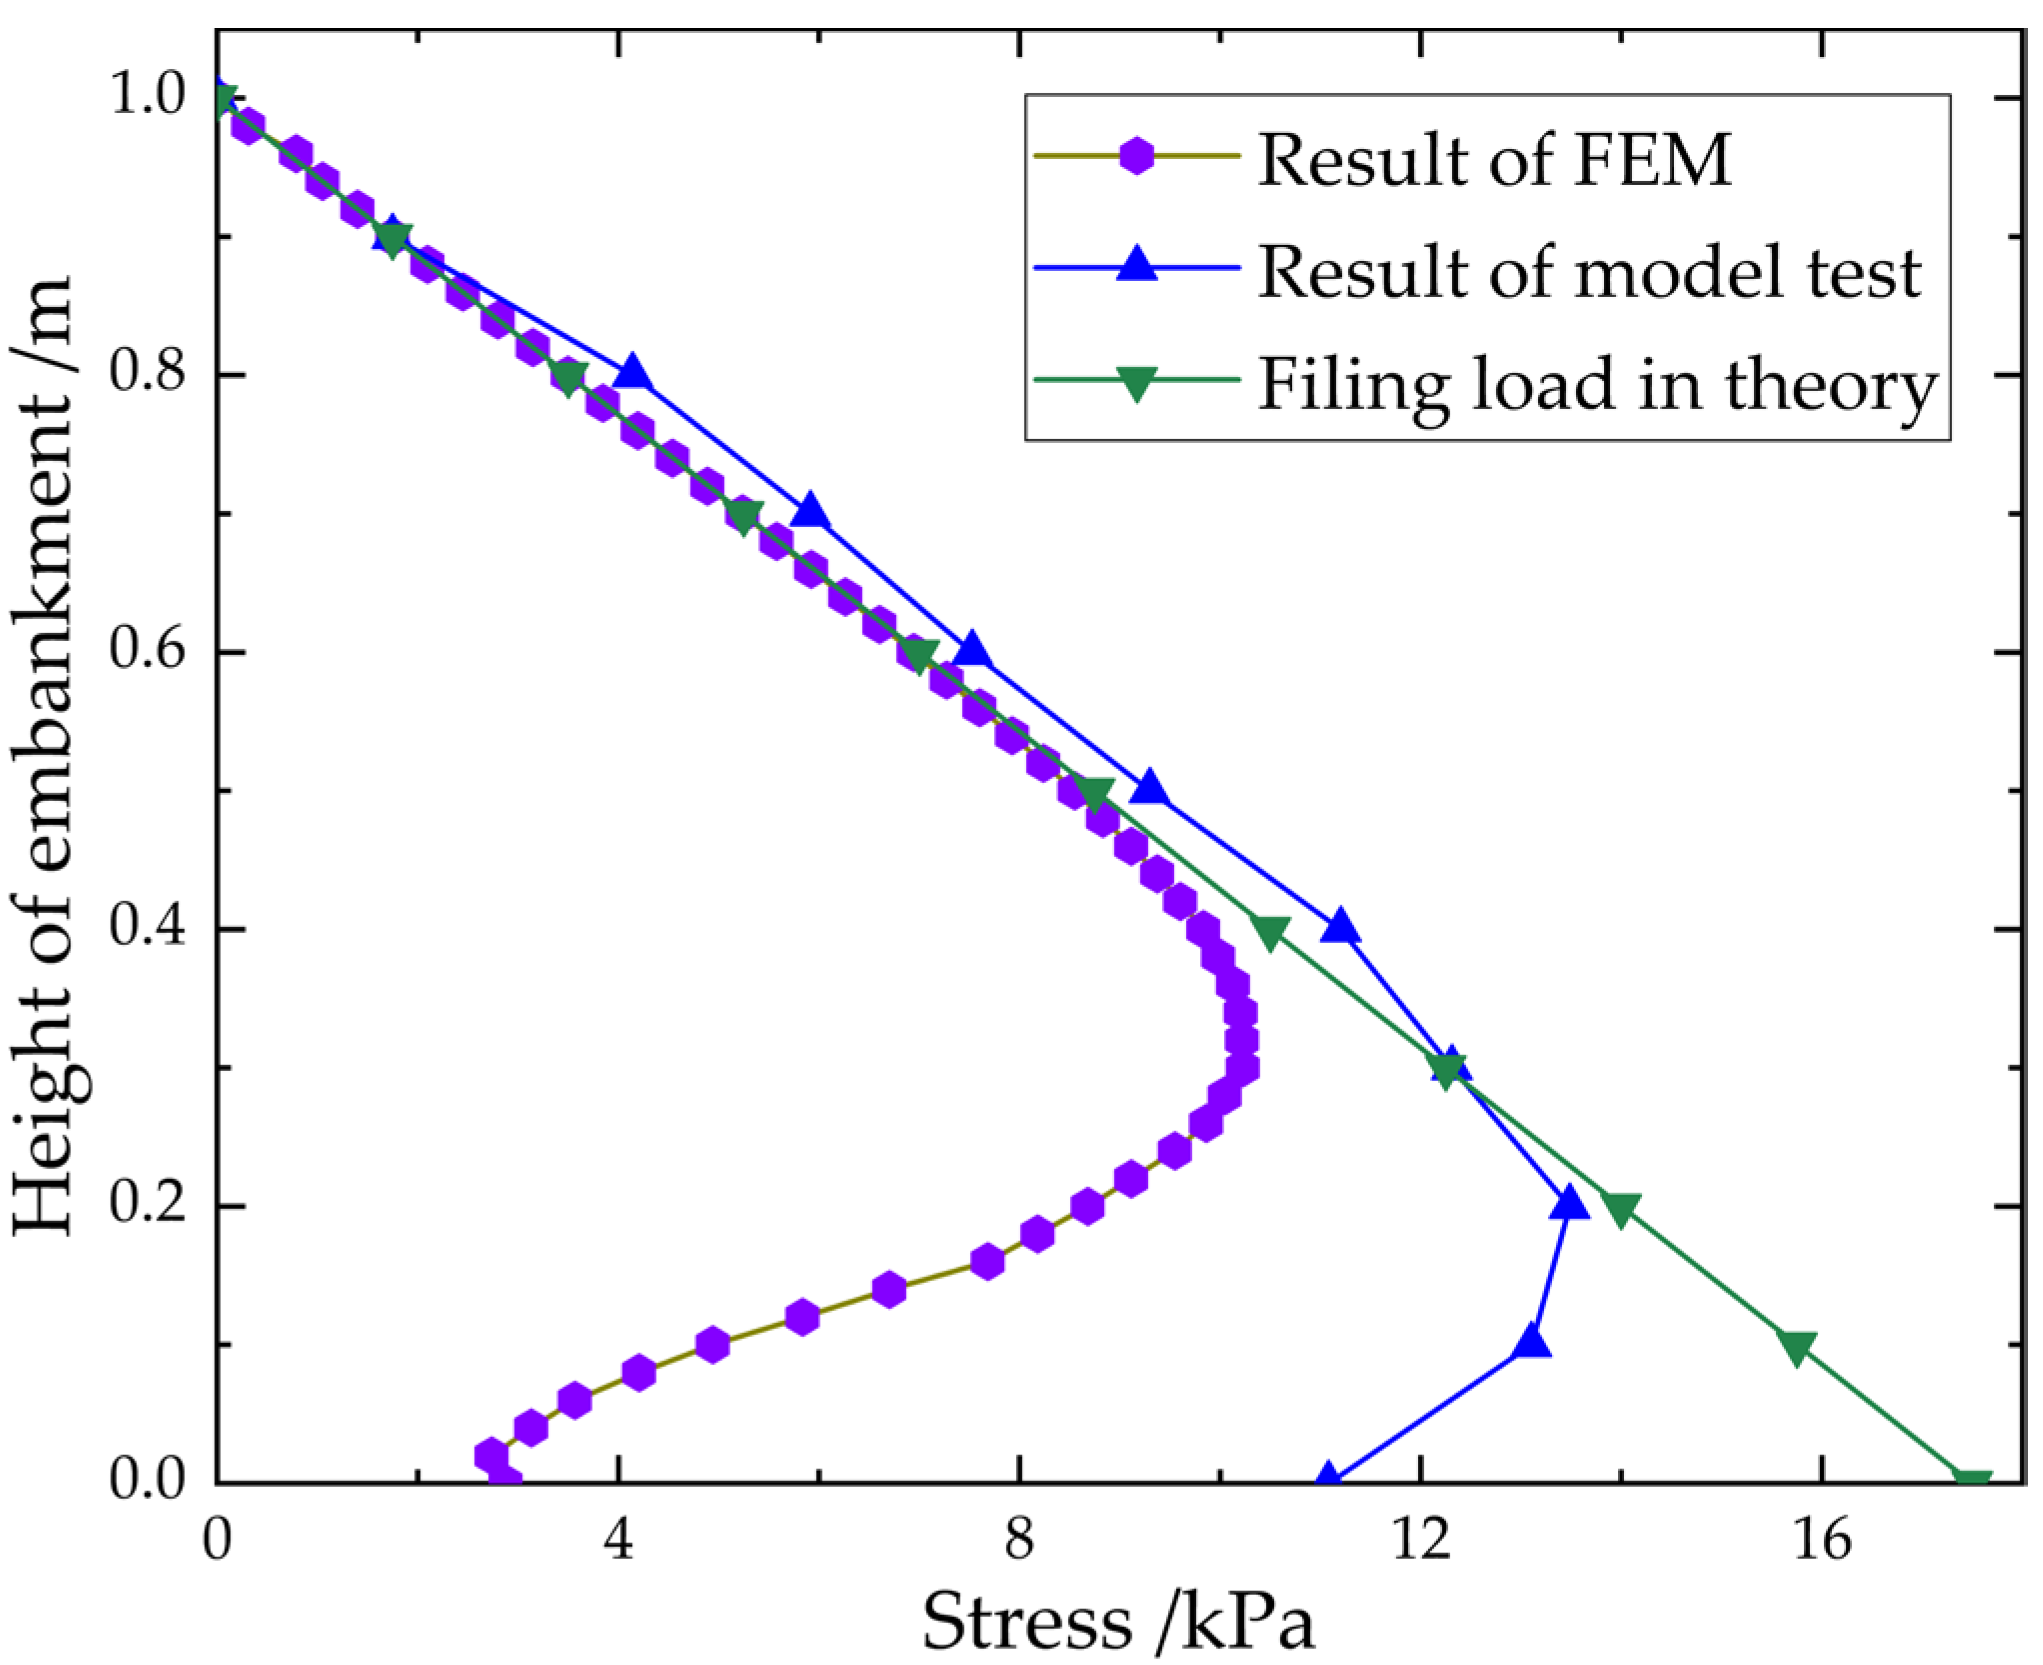
- It can be seen from Figure 11 that the measurement discrepancy is slight when the distance from the embankment bottom exceeds 0.4 m, but not when the distance from the embankment bottom is less than 0.4 m. The soil pressure cells are shifted during the process of embankment filling, because of the relative movements between the embankment filling. Soil pressure cells’ measurement accuracy is hampered.
- (3).
- The compressive properties of the medium-fine sand lead to a continuous decrease in the compressibility of the filling during compression. At the same time, the material’s elastic modulus remains unchanged during the process of numerical simulation, which leads to the difference between the two tests.
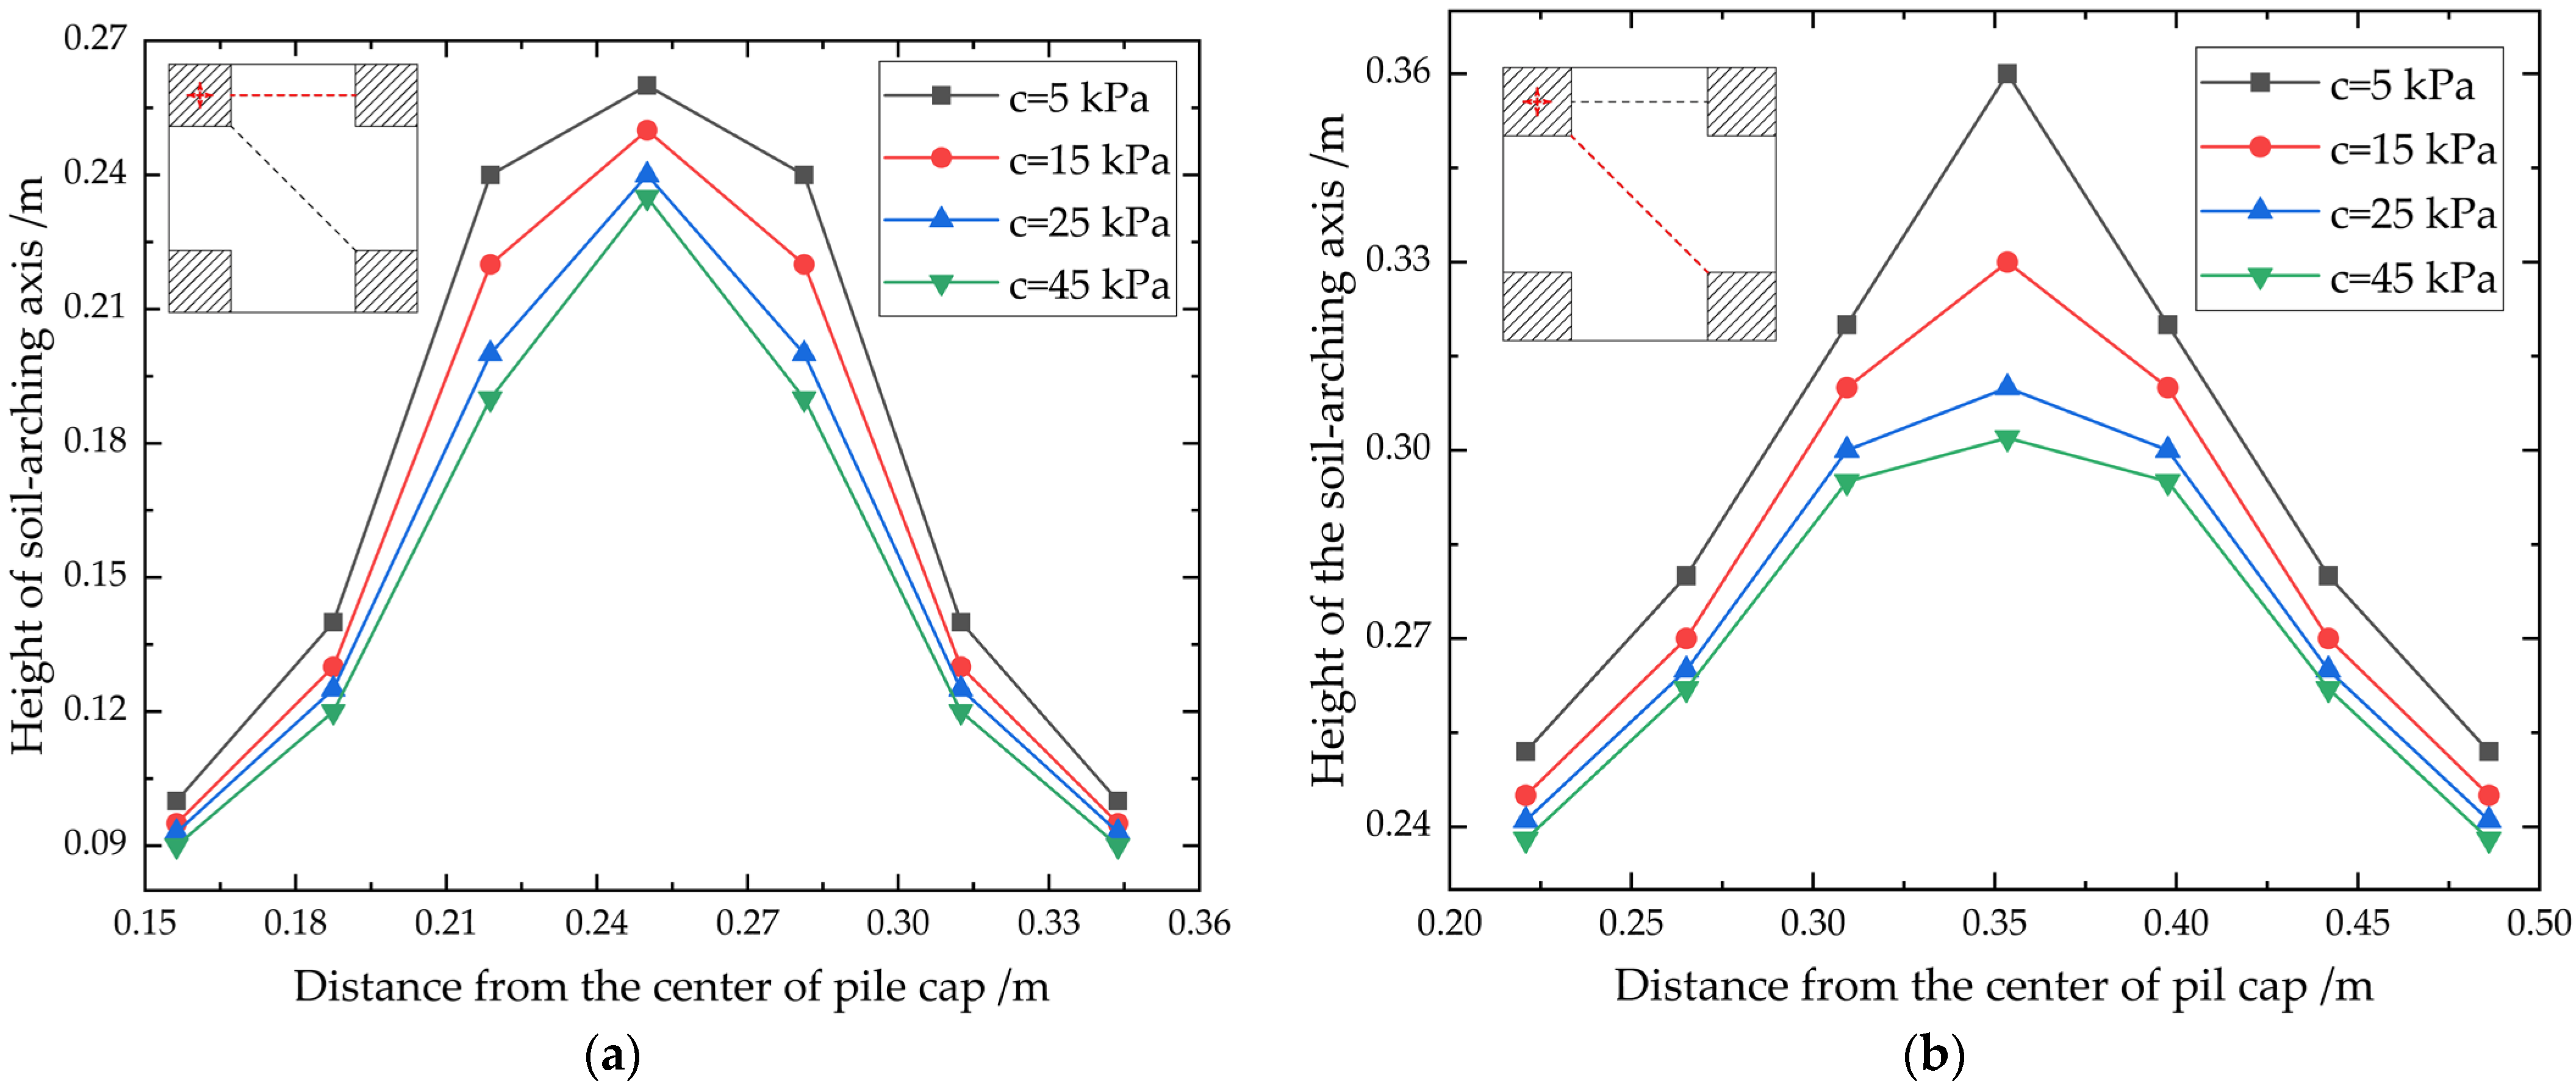
4.2. Soil-Arching Geometry
- (1)
- The height of the soil-arching axis between the diagonal adjacent piles is higher than between the horizontal adjacent piles. In tests M1, M2, M3, and M4, the height of the soil-arching crown between the diagonal adjacent piles increases by 38.5%, 32%, 30%, and 28.5% compared with that between the horizontal adjacent piles. It can be seen that there are significant differences in soil-arching morphology by comparing Figure 12a,b. That is because the net spacing between diagonal adjacent piles is larger than it is between the horizontal adjacent piles, as well as the overburden load of subsoil, which leads to sizeable pile-subsoil differential settlement, and thus the height of the soil-arching axis increases.
- (2)
- As cohesiveness rise, the height of the soil-arching crown falls. Compared with the test M1, the height of vault between horizontal adjacent piles in tests M2, M3, and M4 decreases by 3.85%, 7.69%, and 9.62%, and the height of vault between diagonal adjacent piles decreases by 8.33%, 13.89%, and 16.11%. These findings suggest that as filling cohesion increases, the effect of cohesion on the soil-arching form is gradually weakened. When the filling cohesiveness changes, the soil-arching height between the diagonal adjacent piles is more sensitive than it is between the horizontal adjacent piles.
- (3)
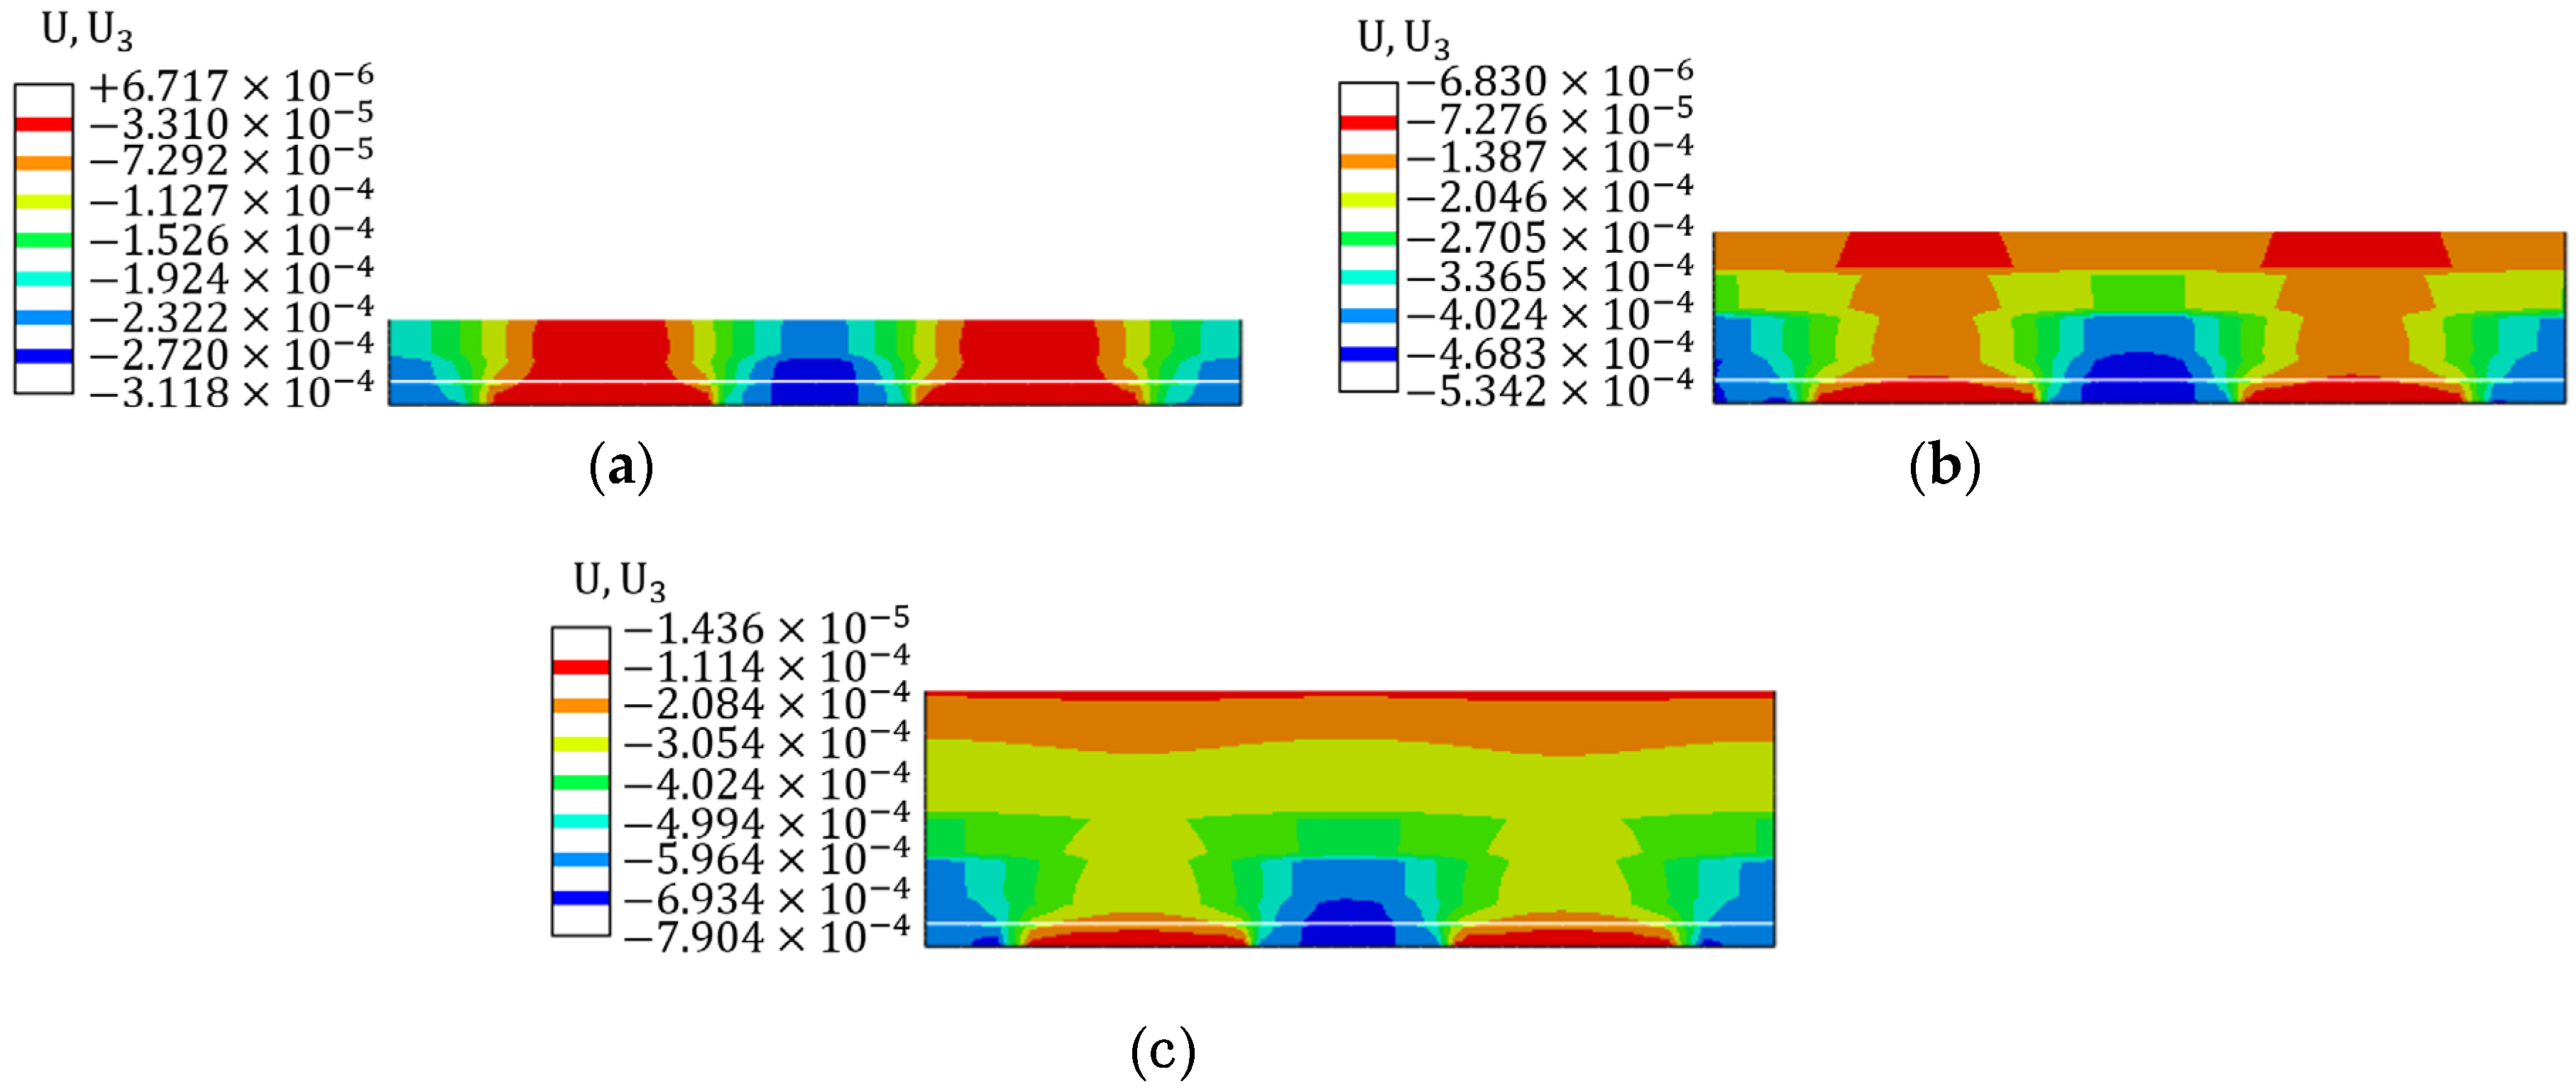
4.3. Deformation Behavior
- (1)
- When the embankment’s height is relatively low, sliding surfaces penetrate the entire embankment, causing localized differential settlement at the embankment surface, which is a significant undesirable settlement for the building of roads and railroads. The area with a substantial settlement inside the embankment is outlined by a triangle, and the areas surrounding the triangle are two non-overlapping inverted triangles.
- (2)
- Two inverted triangular areas begin to overlap with the increase of embankment-filling height. The different settlement on the embankment surface is lessened when the soil-arching effect develops gradually.
- (3)
- With the increase in filling height, planes with the same settlement appear in the embankment. The embankment height is now adequate for the development of the whole soil arching. It also demonstrates that the soil-arching effect can inhibit the uneven settlement of the embankment surface.
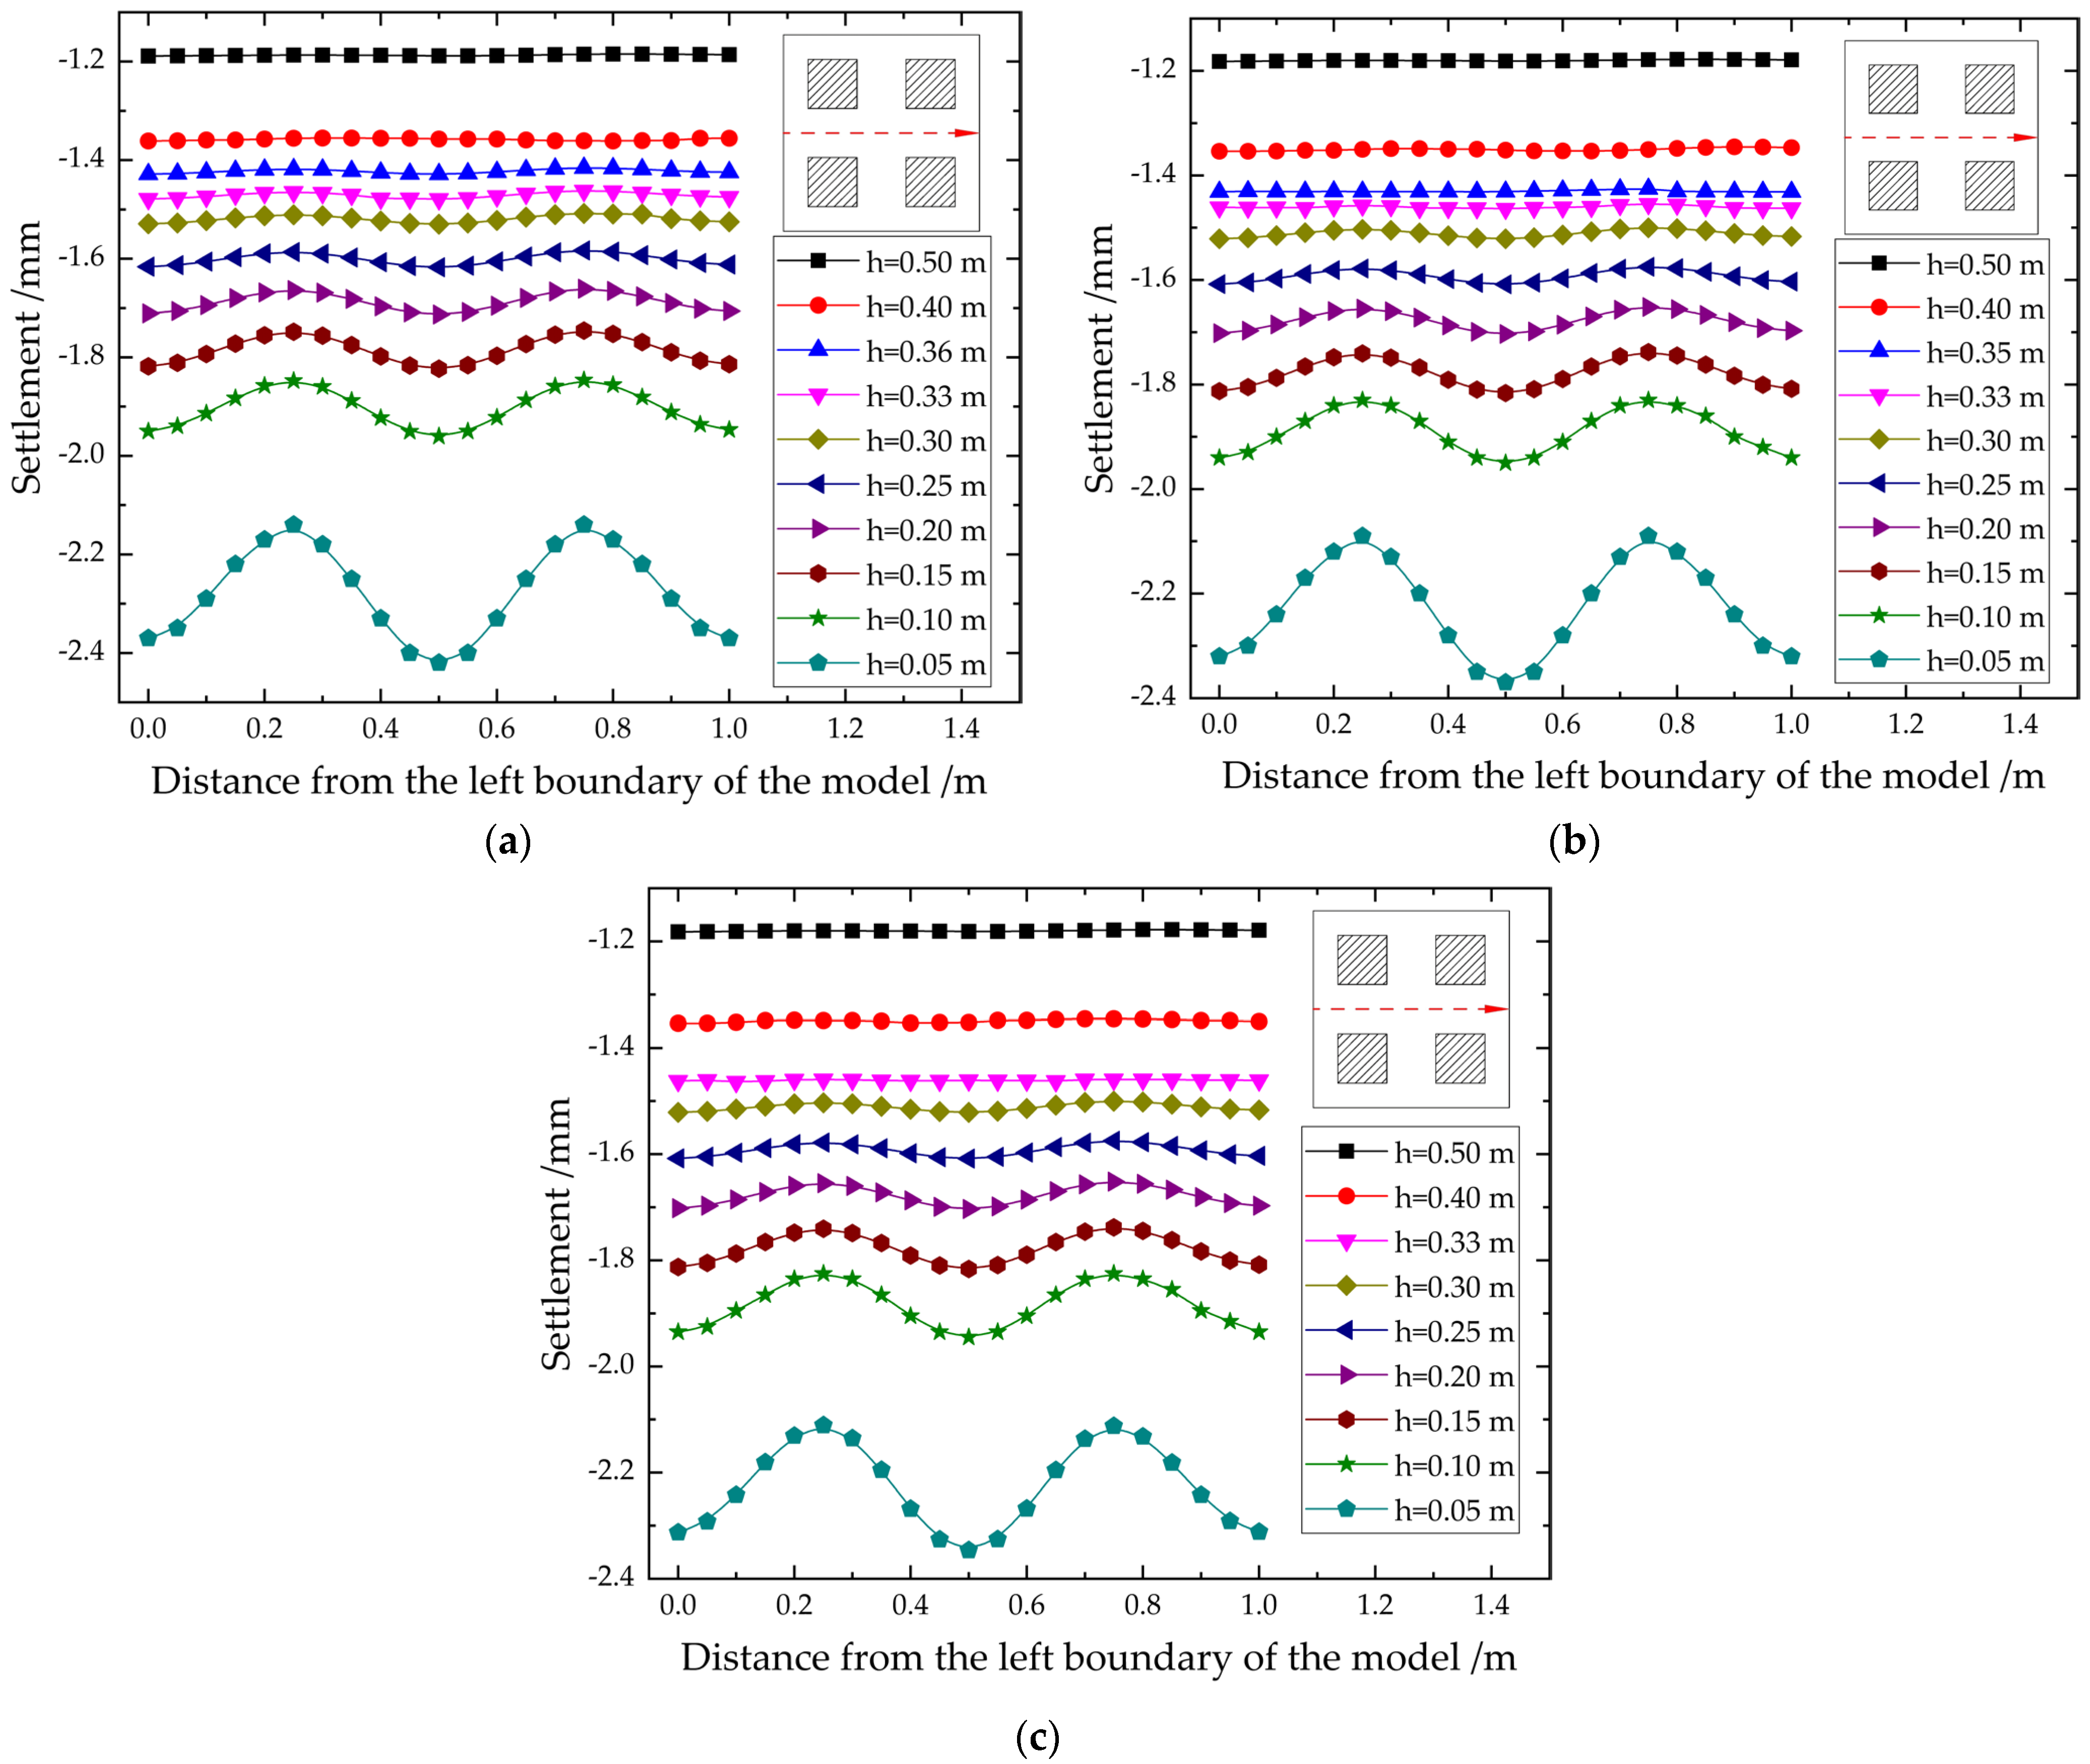
4.4. Equal Settlement Plane
- (1)
- The variability of the filling cohesiveness has not essentially altered the deformation pattern of pile-supported reinforced embankment. Meanwhile, note that the above conclusion is related to the fact that the embankment is composed of granular material. Although the cohesion of the embankment filling has been increased, the granular material’s properties have not been fundamentally changed. The equilibrium condition between the soil particles at the bottom of the embankment will be broken because of the subsoil’s settlement. The cooperative movement of nearby particles will result in the uneven settlement inside the embankment.
- (2)
- The change in filling cohesion has little impact on the displacement of soil particles, and when the filling cohesion increase, there is a slight reduction in the differential settlement at the same height in embankments. For example, the maximum settlement values in the M1, M3, and M4 are 2.42 mm, 2.37 mm, and 2.35 mm, respectively, when the embankment height h = 0.5.
- (3)
- The progressive formation of equal-settlement planes during the filling of embankments is only marginally impacted by changes in filling cohesion. The equal settlement surface heights monitored from the tests M1, M3, and M4 are 0.36–0.4 m, 0.30–0.33 m, and 0.30–0.33 m, respectively. In addition, combined with the soil-arching height mentioned in the previous section, the heights of the soil-arching crown from tests M1, M3 and M4 are 0.36 m, 0.31 m, and 0.302 m, respectively. Altogether, the soil arching and the equal-settlement plane are approximately identical in height.
5. Conclusions
- When the filling is completed, changing the filling cohesion affects the load-transfer efficiency. It has more influence on the load distribution above the pile cap, while less on the load distribution above the subsoil. As the filling cohesion increases, the soil-pressure difference between the corner and center of the pile caps decreases.
- The filling cohesion affects the pile-subsoil load-transfer efficiency during the embankment filling process. The pile-subsoil stress ratio falls with the increase of filling cohesion. The curves of the pile-subsoil stress ratio grow rapidly at the beginning and then tend to stabilize at the later stage.
- With a rise in filling cohesion, the pile-subsoil differential settlement and soil-arching height both decrease. Pile-soil differential settlement at the mid-span of four piles is greater than at the mid-span of two piles. Meanwhile, the soil-arching height between the diagonal adjacent piles is higher than that between the horizontal adjacent piles. The above results the net pile spacing between diagonally adjacent piles is greater than the net spacing between horizontally adjacent piles.
- The soil-arching crown in the embankment is roughly the same height as the net pile spacing. The influence of filling cohesion on the soil-arching height is more significant only in the case of less cohesive working conditions.
- The vertical displacement inside the embankment decreases with the increase of filling cohesion. The equal settlement plane and the soil arching both have the same height.
Author Contributions
Funding
Institutional Review Board Statement
Informed Consent Statement
Data Availability Statement
Conflicts of Interest
References
- King, D.J.; Bouazza, A.; Gniel, J.R.; Rowe, R.K.; Bui, H.H. Load-transfer platform behaviour in embankments supported on semi-rigid columns: Implications of the ground reaction curve. Can. Geotech. J. 2017, 54, 1158–1175. [Google Scholar] [CrossRef]
- Marston, A.; Anderson, A.O. The Theory of Loads on Pipes in Ditches and Tests of Cement and Clay Drain Tile and Sewer Pipe, R. Bulletin; IA Engineering Experimental Station, Iowa State College: Ames, IA, USA, 1913. [Google Scholar]
- Liu, J.F. Analysis on pile-soil stress ratio for composite ground under embankment. Chin. J. Rock Mech. Eng. 2003, 04, 674–677. [Google Scholar]
- Zhang, C.F.; Zhao, M.H.; Zhou, S.; Xu, Z.Y. A Theoretical Solution for Pile-Supported Embankment with a Conical Pile-Head. Appl. Sci. 2019, 9, 2658. [Google Scholar] [CrossRef]
- Terzaghi, K. Theoretical Soil Mechanics; M. John Wiley and Son: New York, NY, USA, 1943; pp. 66–75. [Google Scholar]
- Russell, D.; Pierpoint, N. An assessment of design methods for piled embankments. Ground Eng. 1997, 30, 39–44. [Google Scholar]
- Hewlett, W.J.; Randolph, M.F. Analysis of piled embankments. Int. J. Rock Mech. Min. Sci. Geomech. Abstr. 1988, 25, 297–298. [Google Scholar]
- BS 8006-1; 2010; Code of practice for strengthened/reinforced soils and other fills. S. British Standards Institution: London, UK, 2010.
- Zaeske, D.; Kempfert, H.G. Calculation and mechanism of unreinforced and reinforced base layers on point and line-shaped support members. Civil Eng. 2002, 77, 80–86. [Google Scholar]
- EBGEO 2010. Recommendations for design and analysis of earth structures using geosynthetic reinforcements.; S. German Geotechnical Society: Berlin, Germany, 2010. [Google Scholar]
- Van Eekelen, S.J.M.; Bezuijen, A.; Van Tol, A.F. An analytical model for arching in piled embankments. Geotext. Geomembr. 2013, 39, 78–102. [Google Scholar] [CrossRef]
- Carlson, B.O. Reinforced Soil, Principles for Calculation.; Terratema AB: Linöping, Sweden, 1987. [Google Scholar]
- Nordic Geosynthetic Group. Nordic Guidelines for Reinforced Soils and Fills; M. Nordic Geotechnical Society: Budapest, Magyarország, 2004. [Google Scholar]
- Yang, G.Q.; Wang, X.; Wang, X.Z.; Jin, J.Z.; Zhang, C. Field Test on Mechanical Behavior of Pile-supported Embankment in Soft Soil Area. Chin. J. Geotech. Eng. 2022, 44, 2089–2096. [Google Scholar]
- Iglesia, G.R.; Einstein, H.H.; Whitman, R.V. Investigation of Soil Arching with Centrifuge Tests. J. Geotech. Geoenviron. Eng. 2014, 140, 04013005. [Google Scholar] [CrossRef]
- Cao, W.P.; Hu, W.W. Experimental study of 3D soil arching in piled reinforced. Rock Soil Mech. 2014, 35, 351–358. [Google Scholar]
- Fei, K.; Wang, J.J.; Chen, Y. Experimental and numerical studies of arching in piled embankment. Rock Soil Mech. 2011, 32, 1975–1983. [Google Scholar]
- Eskisar, T.; Otani, J.; Hironaka, J. Visualization of soil arching on reinforced embankment with rigid pile foundation using X-ray CT. Geotext. Geomembr. 2012, 32, 44–54. [Google Scholar] [CrossRef]
- Fang, Y.G.; Hou, M.X.; Gu, R.G.; Chen, P. Visual analysis of initiation of soil arching effect in piled embankments. Chin. J. Geotech. Eng. 2015, 37, 1678–1684. [Google Scholar]
- Wang, J.A.; Liang, C.; Pang, W.D. Photoelastic experiment on force chain evolution of particle aggregate under the conditions of biaxially loading and bilaterally flowing. Rock Soil Mech. 2016, 37, 3041–3047. [Google Scholar]
- Zhang, Z.; Tao, F.J.; Han, J.; Ye, G.B.; Cheng, B.N.; Xu, C. Arching Development in Transparent Soil during Multiple Trapdoor Movement and Surface Footing Loading. Int. J. Geomech. 2021, 21, 04020262. [Google Scholar] [CrossRef]
- Rui, R.; Wan, Y.; Chen, C.; Zhuang, Y.; Zhang, K. Experimental investigation on influences of geosynthetic reinforcement on deformation pattern and soil arching in piled embankments. China J. Highw. Transp. 2020, 33, 41–50. [Google Scholar]
- Rui, R.; He, S.K.; Liu, H.; Pei, Y.H.; Chen, C.; Zhang, L. Parametric analysis of geosynthetic-reinforced pile supported embankments using hybrid tests. Chin. J. Rock Mech. Eng. 2022, 41, 1476–1487. [Google Scholar]
- JTG 3403-2020; Test Methods of Soils for Highway Engineering and Geotextiles. S. China Communications Press: Beijing, China, 2020.
- GB/T 15788-2017; Geosynthetics-Wide-width tensile test. China Quality Inspection Press: Beijing, China, 2017.
- Wang, X.; Wang, X.Z.; Yang, G.Q.; Zong, Q.M. Study on Load Transfer Mechanism of Pile-Supported Embankment Based on Response Surface Method. Appl. Sci. 2022, 12, 4905. [Google Scholar] [CrossRef]


| T1 | 0 | 500 | 250 | 1000 |
| T2 | 11 | 500 | 250 | 1000 |
| T3 | 25 | 500 | 250 | 1000 |
| Parameter | Fill | Geogrid | Subsoil | Pile |
|---|---|---|---|---|
| E (MPa) | 15 | 0.5 | 0.2 | 200,000 |
| Internal Friction Angle (°) | 34.4 | - | - | - |
| Volume Weight (kN/m3) | 17.5 | - | 0.15 | 25 |
| Pisson Ration | 0.35 | 0.2 | 0.3 | 0.2 |
| NO. | ||||
|---|---|---|---|---|
| M1 | 5 | 500 | 250 | 1000 |
| M2 | 15 | 500 | 250 | 1000 |
| M3 | 25 | 500 | 250 | 1000 |
| M4 | 45 | 500 | 250 | 1000 |
Publisher’s Note: MDPI stays neutral with regard to jurisdictional claims in published maps and institutional affiliations. |
© 2022 by the authors. Licensee MDPI, Basel, Switzerland. This article is an open access article distributed under the terms and conditions of the Creative Commons Attribution (CC BY) license (https://creativecommons.org/licenses/by/4.0/).
Share and Cite
Zhang, D.; Yang, G.; Wang, X.; Wang, Z.; Wang, H. Analysis of Load Transfer and the Law of Deformation within a Pile-Supported Reinforced Embankment. Appl. Sci. 2022, 12, 12404. https://doi.org/10.3390/app122312404
Zhang D, Yang G, Wang X, Wang Z, Wang H. Analysis of Load Transfer and the Law of Deformation within a Pile-Supported Reinforced Embankment. Applied Sciences. 2022; 12(23):12404. https://doi.org/10.3390/app122312404
Chicago/Turabian StyleZhang, Da, Guangqing Yang, Xin Wang, Zhijie Wang, and He Wang. 2022. "Analysis of Load Transfer and the Law of Deformation within a Pile-Supported Reinforced Embankment" Applied Sciences 12, no. 23: 12404. https://doi.org/10.3390/app122312404
APA StyleZhang, D., Yang, G., Wang, X., Wang, Z., & Wang, H. (2022). Analysis of Load Transfer and the Law of Deformation within a Pile-Supported Reinforced Embankment. Applied Sciences, 12(23), 12404. https://doi.org/10.3390/app122312404